Short abstract
Age-related macular degeneration (AMD) is the leading cause of severe vision loss and legal blindness. It is known that retinal photoreceptors are the primary target of AMD. Therefore, a reliable method for objective assessment of photoreceptor function is needed for early detection and reliable treatment evaluation of AMD and other eye diseases such as retinitis pigmentosa that are known to cause photoreceptor dysfunctions. Stimulus-evoked intrinsic optical signal (IOS) changes promise a unique opportunity for objective assessment of physiological function of retinal photoreceptor and inner neurons. Instead of a comprehensive review, this mini-review is to provide a brief summary of our recent in vitro and in vivo optical coherence tomography (OCT) studies of stimulus-evoked IOS changes in animal retinas. By providing excellent axial resolution to differentiate individual retinal layers, depth-resolved OCT revealed rapid IOS response at the photoreceptor outer segment. The fast photoreceptor-IOS occurred almost right away (∼ 2 ms) after the onset of retinal stimulation, differentiating itself from slow IOS changes correlated with inner neural and hemodynamic changes. Further development of the functional IOS instruments and retinal stimulation protocols may provide a feasible solution to pursue clinical application of functional IOS imaging for objective assessment of human photoreceptors.
Impact statement
Retinal photoreceptors are the primary target of age-related macular degeneration (AMD) which is the leading cause of severe vision loss and legal blindness. An objective method for functional assessment of photoreceptor physiology can benefit early detection and better treatment evaluation of AMD and other eye diseases that are known to cause photoreceptor dysfunctions. This article summarizes in vitro study of IOS mechanisms and in vivo demonstration of IOS imaging of intact animals. Further development of the functional IOS imaging may provide a revolutionary solution to achieve objective assessment of human photoreceptors.
Keywords: Optical coherence tomography, intrinsic optical signal, age-related macular degeneration, photoreceptors
Introduction
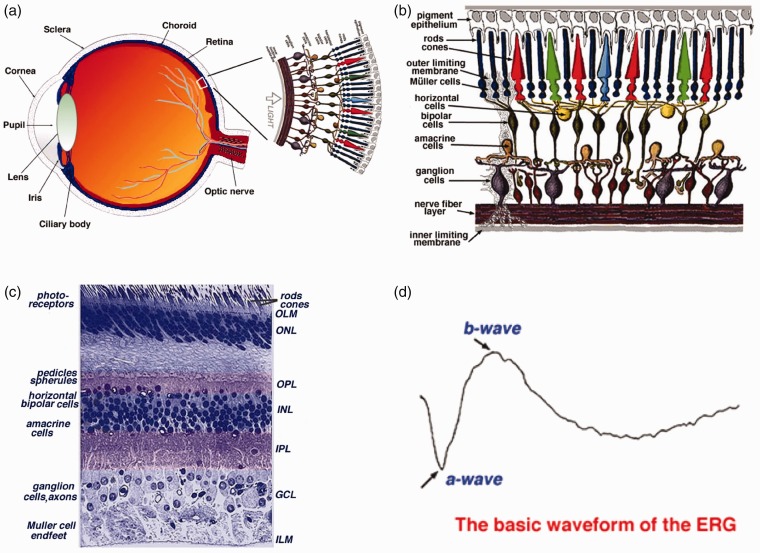
As one part of central nervous system (CNS), the retina is the innermost layer of the eye (Figure 1(a)).1 The retina consists of five major types of neurons, i.e. photoreceptors, bipolar cells, horizontal cells, amacrine cells, and ganglion cells. These neural cells and synapses are stratified into multiple-layered structures (Figure 1(b)),1 functioning together as a delicate neural network to conduct phototransduction and preliminary processing of visual information. As shown in Figure 1(b) and (c), the retina includes three layers of neural cell bodies, i.e. the outer nuclear layer (ONL), inner nuclear layer (INL), and ganglion cell layer (GCL); and two layers of synapses, i.e. the outer plexiform layer (OPL) and inner plexiform layer (IPL).1 Moreover, the retinal pigment epithelium (RPE) supports the photoreceptors. The outer limiting membrane (OLM), also named as external limiting membrane (ELM), is situated at the base of the photoreceptor inner segment. The inner limiting membrane (ILM) is the boundary between the retina and the vitreous body. It is known that different eye diseases can produce pathological changes of different neural cells and functional layers in the retina. Therefore, selective assessment of individual cell types is desirable for better disease detection and treatment evaluation.
Figure 1.
(a) A schematic diagram of the human eye with a schematic enlargement of the retina. (b) Schematic diagram of the human retina. Retinal photoreceptors consist of rods and cones. Red, green, and blue cones are responsible for color perception. (c) Histological image of a cross-sectional slice of the central human retina. (d) Typical full-field ERG waveform. (a), (b) and (c) reprinted with permission from Simple Anatomy of the Retina.1 (d) reprinted with permission from The Electroretinogram: ERG.9 (A color version of this figure is available in the online journal.)
Retinal photoreceptors are the center of phototransduction, responsible for capturing light photons and converting light energy to bioelectrical activities. It is known that retinal photoreceptors are the primary target of age-related macular degeneration (AMD), a leading cause of severe vision loss and legal blindness. In the U.S. alone, more than 10 million people are estimated to have early AMD; 1.75 million patients are currently suffering visual impairment due to late AMD.2,3 Currently, there is no outright cure for the retinal degenerative disease that produces irreversible damage to photoreceptors and RPE. A key strategy for preventing vision loss due to late AMD is to preserve function and be vigilant for changes in early AMD signifying progression. Therefore, early detection is essential in preventing (or at least slowing) AMD.4,5 If the onset of AMD can be detected early enough, the annual savings of Medicare-only costs of visual impairment would be at least $2.25 billion.6
Structural biomarkers, such as drusen and pigmentary abnormalities in the macula, have provided valuable information for AMD tests. However, the morphological only fundus examination is not enough.7 In principle, physiological abnormality in diseased cells can occur before detectable morphological changes in the retina such as retinal cell loss and corresponding thickness changes. Therefore, functional evaluation of physiological integrity of retinal photoreceptors is desirable for early detection of AMD. Electrophysiological methods, such as electroretinography (ERG), allow objective assessment of physiological function of the retina.8 It is established that the a-wave of classic ERG reflects the physiological function of retinal photoreceptors, and the b-wave reflects the physiological function of inner retinal neurons, particularly ON-bipolar cells (Figure 1(d)).9 However, given the fact that the ERG represents the integral activity of both retinal photoreceptors and multiple inner neurons, accurate interpretation of ERG alterations in diseased conditions can be difficult. There is a need to develop an objective method to enable reliable assessment of retinal photoreceptors for early detection and treatment evaluation of AMD, retinitis pigmentosa, and other eye diseases that can cause photoreceptor dysfunctions.
Stimulus-evoked intrinsic optical signal (IOS) changes promise a new method for objective assessment of physiological function of retinal photoreceptors and inner neurons. The IOS is a common name referring to stimulus-evoked transient changes of intrinsic optical properties, such as transient light scattering, polarization, and absorption fluctuations in excitable tissues and cells.10 Because functional IOS images are constructed through computer-based dynamic differentiation of retinal images recorded at pre- and post-stimulus periods, concurrent structural and functional assessment can be naturally achieved at high resolution.11 Dynamic near infrared (NIR) light microscopy has been used for two-dimensional (2D) study of the IOS changes in freshly isolated retinas.11–16 However, given the layered structure of the retina (Figure 1(b) and (c)), NIR microscopy is not suitable for stimulus-evoked IOSs in selective cell types such as retinal photoreceptors. Retinal slices, which open a cross-section of the retina, allow simultaneous observation of stimulus-evoked IOS responses propagating from the photoreceptors to inner neurons.17 While the retinal slice provides a simple preparation for better understanding of the IOS sources and mechanisms in the delicate retina, in vivo examination of the intact retina will be mandatory for clinical application of the IOS imaging. Microlens array18 and line-scanning-19 based confocal microcopy systems have been explored to improve the axial resolution to improve the IOS detection of the retinal photoreceptor layer, and in vivo confocal IOS imaging has been demonstrated for comparative study of normal and laser-injured animal retinas.20 By providing excellent sectioning capability, optical coherence tomography (OCT) can directly differentiate individual layers in human (Figure 2(a)) and animal (Figure 2(b)) retinas. Further development of the OCT for functional IOS mapping of retinal physiology promises a revolutionary method for early detection and better treatment evaluation of eye diseases. In the following sections, we will provide a brief summary about our early time-domain OCT and recent spectral-domain OCT studies of IOS changes in the retina.
Figure 2.
(a) Representative OCT image of human retina. (b) Representative OCT image of mouse retina. NFL: nerve fiber layer; GCL: ganglion cell layer; IPL: inner plexiform layer; INL: inner nuclear layer; OPL: outer plexiform layer; ONL: outer nuclear layer; ELM: external limiting membrane; ISe: inner segment ellipsoid; OS: outer segment, RPE/BrM: retinal pigment epithelium/Bruch’s membrane. Scale bars in (a) and (b) indicate 300 µm. From Xincheng Yao’s lab image gallery.
In vitro time-domain OCT of stimulus-evoked IOSs
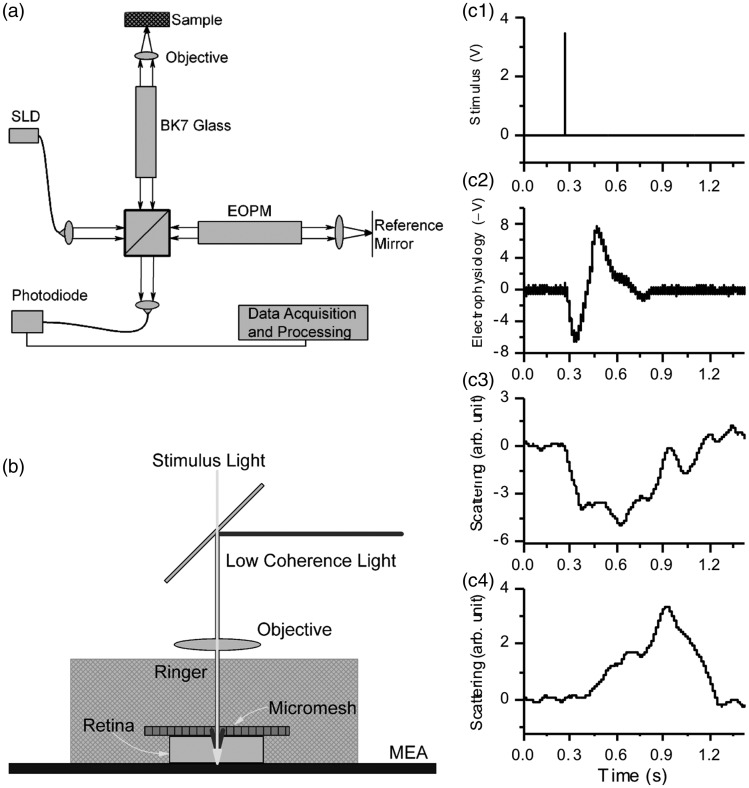
The first in vitro OCT recording of stimulus-evoked IOS changes in freshly isolated frog retinas was reported in 2005.21 This experimental study was based on a custom-designed time-domain OCT (Figure 3(a)). For time-domain OCT imaging, the optical phase of the reference beam is periodically modulated. Rapid and vibration free modulation is critical for detecting IOS changes in the retina. The custom-designed OCT employed an electro-optic phase modulator (EOPM) to achieve non-moving-parts OCT to optimize the signal-to-noise (SNR) ratio for IOS recording (Figure 3(a)). During the recording, the frog retina was placed in a custom-designed recording chamber with Ringer solution to maintain physiological function of the retina (Figure 3(b)). Depth-resolved OCT detected IOS changes at both outer photoreceptor and inner ganglion layers of frog retinas (Figure 3(c)). Bizheva et al.22 also reported time-domain OCT of the photoreceptor and plexiform layers in isolated rabbit retinas.
Figure 3.
(a) Schematic diagram of the time-domain OCT. SLD was a superluminescent laser diode with a 793-nm center wavelength and 15-nm full width at half maximum (FWHM) spectral width. EOPM was the electro-optic phase modulator. BK7 glass block was used for compensating chromatic aberration of the EOPM. A 10×/NA0.25 objective was used to illuminate the sample with a light power ∼150 μW and collect the backward scattering light. (b) During the recording, a frog retina was immersed in Ringer, and pressed to an MEA (multi-electrode array) with moderate pressure. The photoreceptor layer was upward, closest to the light source. The ganglion layer was in contact with the MEA. (c) Comparative electrophysiological and IOS recording. (C1) A 10-ms voltage pulse was used to drive a white LED (Light Emitting Diode), and the light flash stimulated the frog retina. (c2) Electrophysiological response associated with the light stimulus. (c3) Scattering response at the photoreceptor layer. (c4) Scattering response at the ganglion layer. Reprinted with permission from Yao et al.21
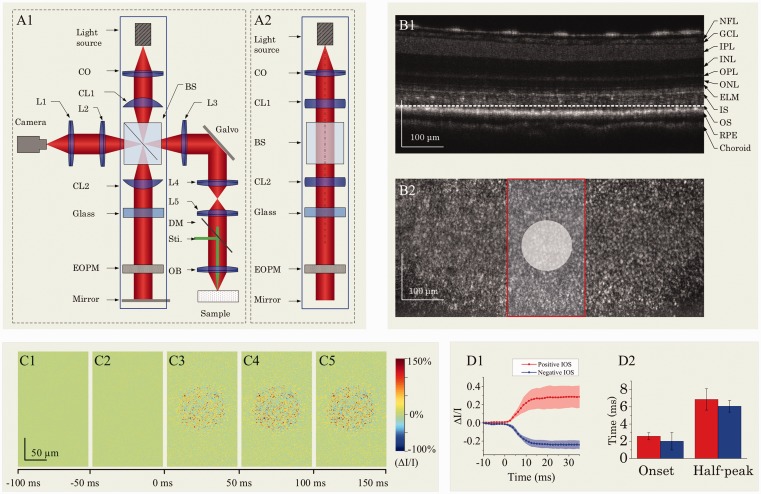
The EOPM-based OCT in Figure 3 was latterly combined with a line-scan strategy to achieve rapid en face OCT (Figure 4(a)). The EOPM-based line-scan OCT provided 4 μm axial-resolution and 2 μm lateral-resolution to differentiate individual retinal layers (Figure 4(b1)) and photoreceptors (Figure 4(b2)). By focusing the recording location at the photoreceptor outer segment in a living frog eyecup, rapid OCT revealed transient IOS almost immediately (∼2 ms) after the onset of visible light stimulation (Figure 4(d)).23
Figure 4.
(a) Schematic diagram of the time domain line-scan OCT. (a1) Top view of the system. CO: collimator; L1-L5: lenses, with focal lengths 80 mm, 40 mm, 80 mm, 40 mm, 75 mm, respectively; OB: objective (10×, NA = 0.3); CL1 and CL2: cylindrical lenses, with focal lengths 75 mm; BS: beam splitter; DM: dichroic mirror; Sti: green light stimulus; EOPM: electro-optic phase modulator. (a2) Side view of blue rectangle area in (a1). (b) Representative B-scan (b1) and en face (b2) images of a frog eyecup. The red rectangle area in (b2) shows the area where IOS images were acquired in (c). The white spot indicates the green light stimulus. (c) Representative IOS images, with time interval of 50 ms. A 10 ms green light stimulus was introduced at time 0 (c2). Rapid IOS occurred immediately after the stimulation, mixed positive and negative IOSs were observed. (d) Dynamic properties of positive (red trace) and negative (blue trace) IOSs. (d1) Separate averages of positive and negative IOSs. Red curves represent positive IOS; blue curves represent negative IOS. Shadow areas show standard deviations. (d2) Onset time and half-peak time of average IOSs. Red bars represent positive IOS; blue bars represent negative IOS. Reprinted with permission from Wang et al.23 (A color version of this figure is available in the online journal.)
In vivo spectral-domain OCT of stimulus-evoked IOSs
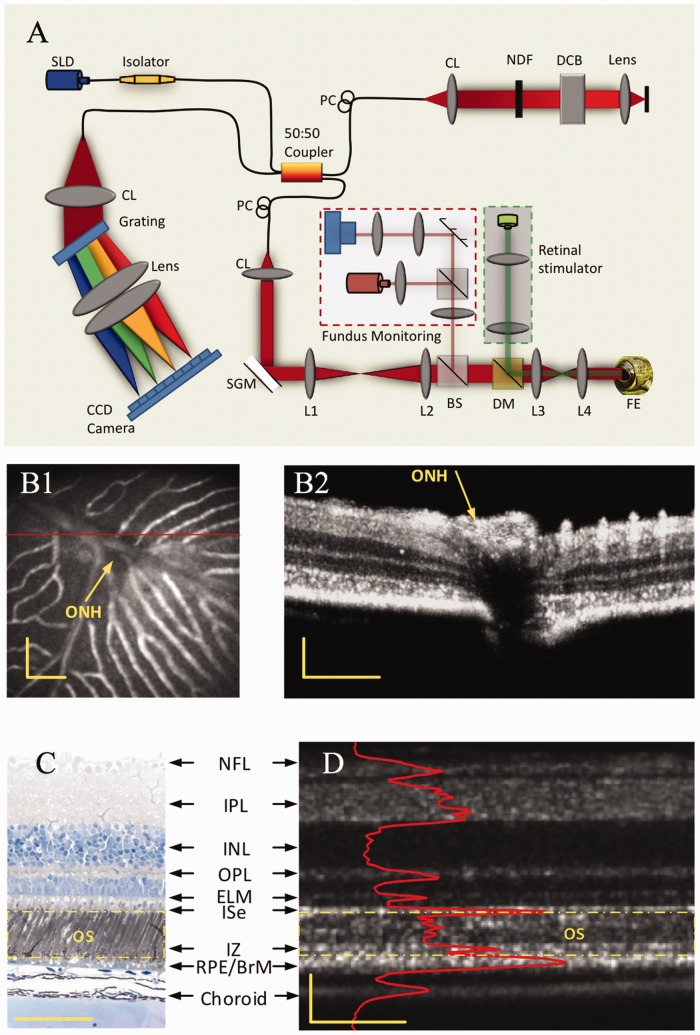
Based on Fourier transform, spectral-domain OCT enables simultaneous recording of scattering information in all depths, i.e. one OCT spectrogram corresponding to one A-line. Figure 5(a) illustrates optical layout of a custom-designed spectral-domain OCT which provided sub-cellular spatial resolution in three dimensions (3.0 μm × 3.0 μm × 3.0 μm) and millisecond temporal resolution (500 Hz) for functional imaging of retinal activation.24,25 The integrated fundus monitoring system was used to aid retinal focusing and localization, and the retinal stimulator was used to evoke physiological response and corresponding IOS changes.
Figure 5.
(a) Spectral-domain OCT with integrated fundus imager. SLD: superluminescent diode; PC: polarization controller; CL: collimation lens; NDF: neutral density filter; DCB: dispersion compensating block; SGM: scanning galvanometer mirror; BS: beam splitter; DM: dichroic mirror, FE: frog eye; CCD: charge-coupled device; L1–L4: lens. Focal lengths of lenses L1, L2, L3 and L4 were 75 mm, 100 mm, 35 mm, and 25 mm, respectively. (b1) Fundus image revealed blood vessels around the optic nerve head (ONH) of a frog retina. (b2) OCT B-scan image of the retinal area marked by the red line in (b1). (c) Histological image of a frog retina. (d) OCT B-scan image of a frog retina. The red profile in (d) shows the averaged OCT reflectance along each retinal layer, i.e. averaged A-scans. The outer segment region is marked in yellow dashed rectangles in both the histological image (c) and OCT B-scan image (d). The OCT B-scan image contains both hyperreflective and hyporeflective bands. Scale bars indicate 100 µm. Reprinted with permission from Zhang et al.24 (A color version of this figure is available in the online journal.)
Functional OCT imaging of retinal activation
The custom designed SD-OCT in Figure 5 was employed for in vivo IOS imaging of intact frogs24 and mice.26 Figure 6 illustrates representative IOS images recorded from a frog eye stimulated by a 10-ms visible light flash.24 An adaptive algorithm was developed to achieve high SNR to enable robust single-pass IOS recordings (Figure 6(a)).
Figure 6.
Representative in vivo IOS imaging. A 10-ms flash stimulus was used for retinal stimulation of the frog eye. Raw OCT images were collected with a frame rate of 100 Hz. Stimulus onset is indicated by time “0”. OCT B-scan images are presented with a linear scale, as opposed to logarithmic scale in conventional OCT systems. (a1–a3) OCT B-scan images and spatial IOS image sequences of one control and two experimental groups. All the images were averaged over 10 frames (100 ms interval). Images consisted of 140 pixels (lateral) × 200 pixels (axial), corresponding to 200 mm (lateral) × 360 mm (axial). (b) Temporal curves of the number of activated (positive and negative) pixels corresponding to (a1–a3). (c) Temporal curves of positive and negative IOSs averaged from six recording trials. (d) To better visualize the signal onset time, an enlarged profile of the early 80 ms period from (c) is illustrated. (e) IOS distribution map superimposed on the OCT B-scan image. Red and green dots in (e) present areas with positive signals (increasing reflectance) and negative signals (decreasing reflectance), respectively. Signal magnitude is not indicated in the image. (f) Comparative OCT-IOS and histological images of the outer retina. In the histological image, cone photoreceptors are highlighted in green or red to show cell sizes and locations. Cone photoreceptor outer segments (OSs) highlighted with red circles are located at the level of the rod inner segment ellipsoid (ISe). Scale bars indicate 50 µm. Reprinted with permission from Zhang et al.24 (A color version of this figure is available in the online journal.)
As shown in Figure 6(a) and (b), both positive and negative IOSs were consistently observed in adjacent retinal areas. The positive and negative IOSs reflected increasing and decreasing responses, respectively, compared to pre-stimulus image background. Therefore, high resolution is essential for functional IOS imaging to differentiate localized IOSs with opposite (positive and negative) polarities. Figure 6(c) shows averaged positive and negative IOSs of six recording trials from the same frog with identical stimulus parameters. From Figure 6(d), it was observed that the rapid IOS occurs almost immediately after the onset of the retinal stimulation. With the 10-ms visible light flash stimulation, the IOS changes were primarily observed at the photoreceptor layer, particularly the outer segment (Figure 6(e) and (f)). With increased stimulus duration,24 or repeated flash stimuli,27 i.e. flicker stimulation, stimulus-evoked IOS changes were also observed in inner retinal layers.
OCTA-guided functional OCT imaging of neural and hemodynamic activities
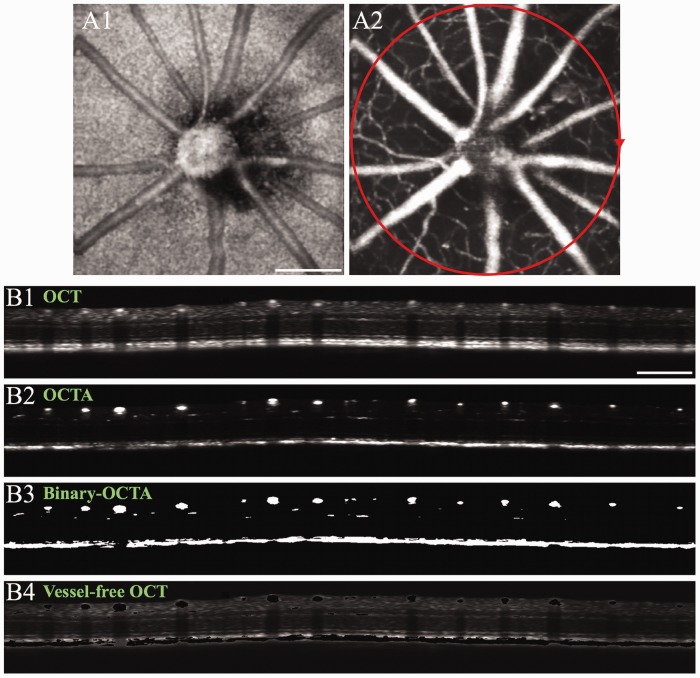
It is well known that the retina is a complex neurovascular network. Neurovascular coupling, reflecting spatial and temporal relationships between transient neural activity and hemodynamic responses (i.e. blood flow/oxygen dynamics), occurs during stimulus-evoked retinal activation. Therefore, stimulus-evoked IOS changes correlated with neural activity (i.e. neural-IOS) and transient IOS responses associated with blood dynamics (i.e. hemodynamic-IOS) are typically mixed together in the retina.27,28 OCT angiography (OCTA) can provide high-resolution mapping of retinal vasculatures at a single capillary level (Figure 7). OCTA mapping of stimulus-evoked hemodynamic responses in individual retinal layers has been demonstrated.29 Functional separation of neural-IOS and hemodynamic-IOS changes are desirable for easy evaluation of retinal physiological function. Therefore, we recently explored OCTA-guided IOS data processing to differentiate two functional images, i.e. a neural-IOS map and a hemodynamic-IOS map, from the same image dataset.27 Figure 7(b1) and (b2) shows representative B-scan OCT and OCTA, respectively. First, a global thresholding processing was applied to the OCTA image (Figure 7(b2)) to produce the binary-OCTA image of blood vessels (Figure 7(b3)). Otsu’s thresholding method was employed to automatically search for the global threshold to minimize the intra-class variance.30 The binary-OCTA was used as a mask to remove blood vessels in the OCT (Figure 7(b1)) to produce a vessel-free OCT (Figure 7(b4)). The vessel-free OCT can be used for neural-IOS processing, while OCTA (Figure 7(b2)) can be used for hemodynamic-IOS measurement.
Figure 7.
(a) Representative en face OCT (a1) and OCTA (a2) images of a mouse retina. The red circle in (a2) illustrates the circular scanning path for collecting the B-scan OCT in (b). (b) Representative B-scan OCT (b1), OCTA (b2), binary-OCTA (b3) and vessel-free OCT (b4). For vessel-free OCT (b4), the binary-OCTA (b3) was used as a mask to exclude vasculatures from the OCT image (b1). Scale bars in (a1) and (b1) indicate 500 µm. Modified with permission from Son et al.27 (A color version of this figure is available in the online journal.)
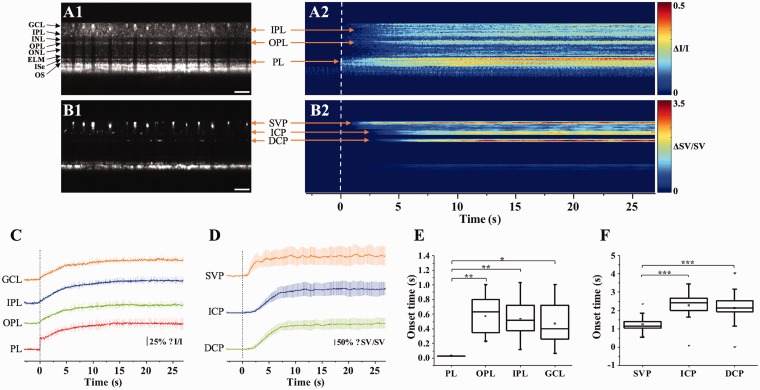
Figure 8 shows representative functional imaging of stimulus-evoked neural-IOS (Figure 8(a)) and hemodynamic-IOS (Figure 8(b)) in a mouse retina. For functional IOS imaging, dynamic B-scan OCT images were collected from the retina stimulated by a 10 Hz flicker stimulation. Dynamic speckle variance (SV) processing was employed to the OCT data to construct corresponding OCTA image.29,31 For each experiment, the total OCT recording time was 30 s, including a 3-s pre-stimulation phase, a 5-s stimulation phase, and a 22-s post-stimulation phase. Before IOS data processing, the OCT and OCTA images were flattened for easy assessment of stimulus-evoked IOS changes in different retinal layers. Figure 8(a1) and (b1) shows representative flattened B-scan OCT and OCTA images, respectively. Figure 8(a2) and (b2) shows spatiotemporal maps of neural-IOS and hemodynamic-IOS changes, respectively. Vertical dimension of the spatiotemporal IOS maps (Figure 8(a2) and (b2)) corresponds to the vertical dimension, i.e. spatial information, of the B-scan OCT images (Figure 8(a1) and (b1)). Lateral dimension of the spatiotemporal IOS maps (Figure 8(a2) and (b2)) corresponds to the recording time points, i.e. temporal information, of sequential B-scan OCT images. For each time point, i.e. a vertical line in the spatiotemporal IOS maps in Figure 8(a2) and (b2), all IOS changes at the same retinal depths, i.e. lateral dimension in Figure 8(a1) and (b1), were averaged. As shown in Figure 8(a2), rapid neural-IOS, particularly photoreceptor-IOS, was observed almost immediately after the onset of the retinal stimulation. In contrast, hemodynamic-IOS showed a significant time delay (1–2 s), compared to the rapid photoreceptor-IOS.
Figure 8.
(a) Representative flattened B-scan OCT (a1) and spatiotemporal neural-IOS map (a2). (b) Representative flattened B-scan OCTA (b1) and spatiotemporal hemodynamic-IOS map (b2). Scale bars in (a1) and (b1) indicate 500 µm. (c) Neural-IOS changes of photoreceptor layer (PL), outer plexiform layer (OPL), inner plexiform layer (IPL), and ganglion cell layer (GCL). (d) Hemodynamic-IOS changes of superficial vascular plexiform (SVP), intermediate capillary plexiform (ICP), and deep capillary plexiform (DCP). (e) Averaged onset times of neural-IOS changes at PL, OPL, IPL, and GCL. (f) Averaged onset times of hemodynamic-IOS changes of SVP, ICP, and DCP. Modified with permission from Son et al.27 (A color version of this figure is available in the online journal.)
Discussion
In summary, custom-designed OCT has been demonstrated for functional IOS imaging of retinal activation. In coordination with OCTA-guided image processing, functional OCT mapping of neural-IOS and hemodynamic-IOS changes has been validated. By providing excellent depth-resolved imaging capability, functional OCT provided the feasibility to characterize stimulus-evoked neural-IOS changes in individual retinal layers and hemodynamic-IOS changes in trilaminar vascular plexuses, i.e. superficial vascular plexiform (SVP), intermediate capillary plexiform (ICP), and deep capillary plexiform (DCP).
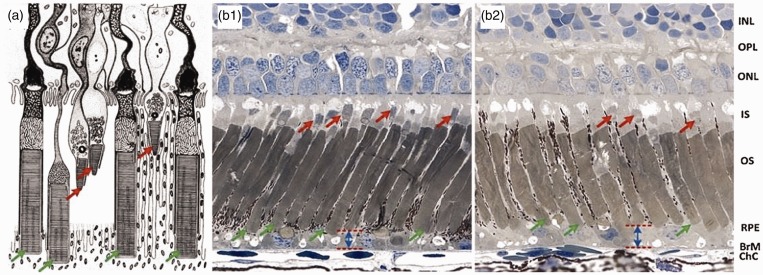
Fast photoreceptor-IOS response was observed almost immediately, particularly at the outer segment part. It is known that the photoreceptor outer segment is the center of phototransduction. We speculate that the fast photoreceptor-IOS might result from transient morphological change of photoreceptor outer segments correlated with phototransduction.32,33 Previous studies have revealed transient morphological dynamics, such as swelling changes, in stimulus-activated neural tissues.34 High-resolution microscopy of frog retinas has revealed reduced outer segment length in light-adapted retina, compared to dark-adapted condition (Figure 9).32
Figure 9.
(a) Schematic diagram of retinal photoreceptors of leopard frog. (b) Histological images of dark-adapted (b1) and light-adapted (b2) frog eyes. The red arrows indicate cone photoreceptors and the green arrows indicate rod photoreceptors. INL: inner nuclear layer; OPL: outer plexiform layer; ONL: outer nuclear layer; IS: inner segment; OS: outer segment; RPE: retina pigment epithelium; BrM: Bruch’s membrane; ChC: choriocapillaris. (a) Reprinted from Nilsson,39 with permission from Elsevier. (b) Reprinted with permission from Zhang et al.25 (A color version of this figure is available in the online journal.)
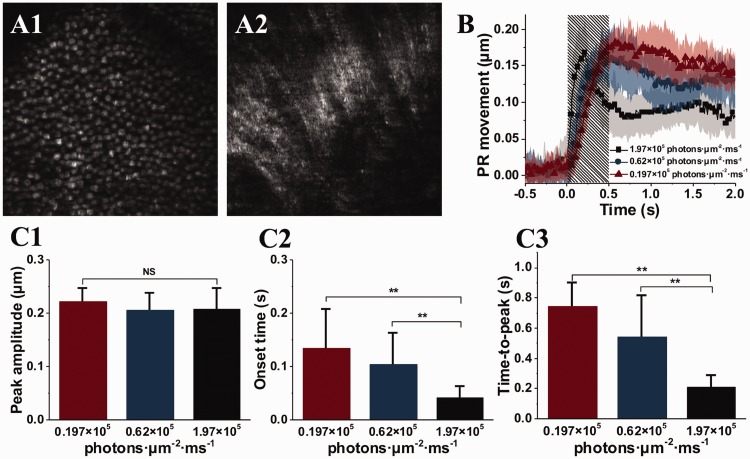
Transient photoreceptor movement has been observed in amphibian (frog) and mammalian (mouse) retinas activated by oblique visible light stimulation.35 Comparative confocal microscopy and OCT revealed that the photoreceptor movement was elicited from the outer segment part of retinal photoreceptors, predominantly rod cells.36 Time-lapse microscopy of freshly isolated photoreceptor outer segments confirmed that the transient outer segment change occurs almost immediately after the stimulus onset,32,33,35 which is consistent to the time course of fast photoreceptor-IOS in functional OCT (Figure 8). By developing a virtually structure detection (VSD) based super-resolution laser scanning ophthalmoscope (SLO),37 in vivo super-resolution imaging of transient retinal photoreceptor movement evoked by oblique light stimulation has also been demonstrated (Figure 10).38
Figure 10.
(a) Representative super-resolution of photoreceptor (a1) and ganglion fiber (a2) layers. (b) Oblique stimulation evoked transient photoreceptor (PR) movement. (c) Peak magnitude (c1), onset time (c2) and time-to-peak (C3) of the transient PR movement. (a) Reprinted with permission from Liu et al.37 (b) and (c) reprinted with permission from Lu et al.38 (A color version of this figure is available in the online journal.)
In addition to the fast photoreceptor-IOS, slow IOS changes were also observed at inner retinal layers. OCTA-guided OCT data processing was used to separate neural-IOS and hemodynamic-IOS changes. The inner neural-IOS and hemodynamic-IOS changes showed significant time delays, compared to the fast photoreceptor-IOS response. Given the different axial location and time course of the fast photoreceptor-IOS from that of inner neural-IOS and hemodynamic-IOS changes, functional OCT provides a practical solution to achieve selective IOS mapping of photoreceptor activation. We anticipate that further development of the functional OCT instrument and testing protocols, such as light adaptation control to manipulate rod and cone activities, will enable a high-resolution method for functional mapping of human photoreceptors. An objective method for functional assessment of photoreceptor physiology can benefit early detection and better treatment evaluation of AMD and other eye diseases that are known to cause photoreceptor dysfunctions.
Authors’ contributions
XY drafted the main part of the manuscript. TS, TK, and YL contributed parts of the manuscript. All authors revised the manuscript.
Declaration of conflicting interests
The author(s) declared no potential conflicts of interest with respect to the research, authorship, and/or publication of this article.
Funding
This research was supported in part by NIH grants R01 EY023522, R01 EY024628, P30 EY001792; by Richard and Loan Hill endowment; by unrestricted grant from Research to Prevent Blindness.
References:
- 1.Simple Anatomy of the Retina by Helga Kolb, http://webvision.med.utah.edu/book/part-i-foundations/simple-anatomy-of-the-retina/ (2011, accessed 10 October 2018)
- 2.Friedman DS, O'Colmain BJ, Munoz B, Tomany SC, McCarty C, de Jong PT, Nemesure B, Mitchell P, Kempen J; Eye Diseases Prevalence Research Group. Prevalence of age-related macular degeneration in the United States. Arch Ophthalmol 2004; 122:564–72 [DOI] [PubMed] [Google Scholar]
- 3.Deangelis MM, Silveira AC, Carr EA, Kim IK. Genetics of age-related macular degeneration: current concepts, future directions. Semin Ophthalmol 2011; 26:77–93 [DOI] [PMC free article] [PubMed] [Google Scholar]
- 4.Ishikawa K, Nishihara H, Ozawa S, Piao CH, Ito Y, Kondo M, Terasaki H. Focal macular electroretinograms after photodynamic therapy combined with intravitreal bevacizumab. Graefes Arch Clin Exp Ophthalmol 2011; 249:273–80 [DOI] [PubMed] [Google Scholar]
- 5.Feigl B, Morris CP. The challenge of predicting macular degeneration. Curr Med Res Opin 2011; 27:1745–8 [DOI] [PubMed] [Google Scholar]
- 6.Loewenstein A. The significance of early detection of age-related macular degeneration: Richard & Hinda Rosenthal Foundation lecture, The Macula Society 29th annual meeting. Retina 2007; 27:873–8 [DOI] [PubMed] [Google Scholar]
- 7.Sunness JS, Massof RW, Johnson MA, Bressler NM, Bressler SB, Fine SL. Diminished foveal sensitivity may predict the development of advanced age-related macular degeneration. Ophthalmology 1989; 96:375–81 [DOI] [PubMed] [Google Scholar]
- 8.Scholl HP, Zrenner E. Electrophysiology in the investigation of acquired retinal disorders. Surv Ophthalmol 2000; 45:29–47 [DOI] [PubMed] [Google Scholar]
- 9.The Electroretinogram: ERG by Ido Perlman http://webvision.med.utah.edu/book/electrophysiology/the-electroretinogram-erg/ (2015, accessed 10 October 2018)
- 10.Yao X, Wang B. Intrinsic optical signal imaging of retinal physiology: a review. J Biomed Opt 2015; 20:90901. [DOI] [PMC free article] [PubMed] [Google Scholar]
- 11.Yao XC, Zhao YB. Optical dissection of stimulus-evoked retinal activation. Opt Exp 2008; 16:12446–59 [DOI] [PubMed] [Google Scholar]
- 12.Yao XC, George JS. Near-infrared imaging of fast intrinsic optical responses in visible light-activated amphibian retina. J Biomed Opt 2006; 11:064030. [DOI] [PubMed] [Google Scholar]
- 13.Yao XC, George JS. Dynamic neuroimaging of retinal light responses using fast intrinsic optical signals. Neuroimage 2006; 33:898–906 [DOI] [PubMed] [Google Scholar]
- 14.Zhao YB, Yao XC. Intrinsic optical imaging of stimulus-modulated physiological responses in amphibian retina. Opt Lett 2008; 33:342–4 [DOI] [PubMed] [Google Scholar]
- 15.Zhang QX, Zhang Y, Lu RW, Li YC, Pittler SJ, Kraft TW, Yao X. Comparative intrinsic optical signal imaging of wild-type and mutant mouse retinas. Opt Exp 2012; 20:7646–54 [DOI] [PMC free article] [PubMed] [Google Scholar]
- 16.Li YC, Luo JM, Lu RW, Liu KM, Levy AM, Yao XC. Dynamic intrinsic optical signal monitoring of electrically stimulated inner retinal neural response. J Mod Opt 2012; 59:967-71 [DOI] [PMC free article] [PubMed] [Google Scholar]
- 17.Li YC, Strang C, Amthor FR, Liu L, Li YG, Zhang QX, Keyser K, Yao XC. Parallel optical monitoring of visual signal propagation from the photoreceptors to the inner retina layers. Opt Lett 2010; 35:1810–2 [DOI] [PMC free article] [PubMed] [Google Scholar]
- 18.Zhang QX, Wang JY, Liu L, Yao XC. Microlens array recording of localized retinal responses. Opt Lett 2010; 35:3838–40 [DOI] [PMC free article] [PubMed] [Google Scholar]
- 19.Li YG, Liu L, Amthor F, Yao XC. High-speed line-scan confocal imaging of stimulus-evoked intrinsic optical signals in the retina. Opt Lett 2010; 35:426–8 [DOI] [PMC free article] [PubMed] [Google Scholar]
- 20.Zhang Q, Lu R, Curcio CA, Yao X. In vivo confocal intrinsic optical signal identification of localized retinal dysfunction. Investig Ophthalmol Visual Sci 2012; 53:8139–45 [DOI] [PMC free article] [PubMed] [Google Scholar]
- 21.Yao XC, Yamauchi A, Perry B, George JS. Rapid optical coherence tomography and recording functional scattering changes from activated frog retina. Appl Opt 2005; 44:2019–23 [DOI] [PubMed] [Google Scholar]
- 22.Bizheva K, Pflug R, Hermann B, Povazay B, Sattmann H, Qiu P, Anger E, Reitsamer H, Popov S, Taylor JR, Unterhuber A, Ahnelt P, Drexler W. Optophysiology: depth-resolved probing of retinal physiology with functional ultrahigh-resolution optical coherence tomography. Proc Natl Acad Sci U S A 2006; 103:5066–71 [DOI] [PMC free article] [PubMed] [Google Scholar]
- 23.Wang B, Lu R, Zhang Q, Jiang Y, Yao X. En face optical coherence tomography of transient light response at photoreceptor outer segments in living frog eyecup. Opt Lett 2013; 38:4526–9 [DOI] [PMC free article] [PubMed] [Google Scholar]
- 24.Zhang Q, Lu R, Wang B, Messinger JD, Curcio CA, Yao X. Functional optical coherence tomography enables in vivo physiological assessment of retinal rod and cone photoreceptors. Sci Rep 2015; 5:9595. [DOI] [PMC free article] [PubMed] [Google Scholar]
- 25.Zhang QX, Lu RW, Messinger JD, Curcio CA, Guarcello V, Yao XC. In vivo optical coherence tomography of light-driven melanosome translocation in retinal pigment epithelium. Sci Rep 2013; 3:2644. [DOI] [PMC free article] [PubMed] [Google Scholar]
- 26.Wang B, Lu Y, Yao X. In vivo optical coherence tomography of stimulus-evoked intrinsic optical signals in mouse retinas. J Biomed Opt 2016; 21:96010. [DOI] [PMC free article] [PubMed] [Google Scholar]
- 27.Son T, Alam M, Toslak D, Wang B, Lu Y, Yao X. Functional optical coherence tomography of neurovascular coupling interactions in the retina. J Biophotonics 2018. [Epub ahead of print]. [DOI] [PMC free article] [PubMed] [Google Scholar]
- 28.Schallek J, Li H, Kardon R, Kwon Y, Abramoff M, Soliz P, Ts'o D. Stimulus-evoked intrinsic optical signals in the retina: spatial and temporal characteristics. Invest Ophthalmol Visual Sci 2009; 50:4865–72 [DOI] [PMC free article] [PubMed] [Google Scholar]
- 29.Son T, Wang B, Thapa D, Lu Y, Chen Y, Cao D, Yao X. Optical coherence tomography angiography of stimulus evoked hemodynamic responses in individual retinal layers. Biomed Opt Exp 2016; 7:3151–62 [DOI] [PMC free article] [PubMed] [Google Scholar]
- 30.Otsu N. A threshold selection method from gray-level histograms. IEEE Trans Syst Man Cybernet 1979; 9:62–6 [Google Scholar]
- 31.Zhang A, Zhang Q, Chen CL, Wang RK. Methods and algorithms for optical coherence tomography-based angiography: a review and comparison. J Biomed Opt 2015; 20:100901. [DOI] [PMC free article] [PubMed] [Google Scholar]
- 32.Zhao X, Thapa D, Wang B, Lu Y, Gai S, Yao X. Stimulus-evoked outer segment changes in rod photoreceptors. J Biomed Opt 2016; 21:65006. [DOI] [PMC free article] [PubMed] [Google Scholar]
- 33.Lu Y, Wang B, Pepperberg DR, Yao X. Stimulus-evoked outer segment changes occur before the hyperpolarization of retinal photoreceptors. Biomed Opt Exp 2017; 8:38–47 [DOI] [PMC free article] [PubMed] [Google Scholar]
- 34.Yao XC, Rector DM, George JS. Optical lever recording of displacements from activated lobster nerve bundles and Nitella internodes. Appl Opt 2003; 42:2972–8 [DOI] [PubMed] [Google Scholar]
- 35.Lu R, Levy AM, Zhang Q, Pittler SJ, Yao X. Dynamic near-infrared imaging reveals transient phototropic change in retinal rod photoreceptors. J Biomed Opt 2013; 18:106013. [DOI] [PMC free article] [PubMed] [Google Scholar]
- 36.Wang B, Zhang Q, Lu R, Zhi Y, Yao X. Functional optical coherence tomography reveals transient phototropic change of photoreceptor outer segments. Opt Lett 2014; 39:69236. [DOI] [PMC free article] [PubMed] [Google Scholar]
- 37.Liu C, Zhi Y, Wang B, Thapa D, Chen Y, Alam M, Lu Y, Yao X. In vivo super-resolution retinal imaging through virtually structured detection. J Biomed Opt 2016; 21:120502. [DOI] [PMC free article] [PubMed] [Google Scholar]
- 38.Lu Y, Liu C, Yao X. In vivo super-resolution imaging of transient retinal phototropism evoked by oblique light stimulation. J Biomed Opt 2018; 23:1–4 [DOI] [PMC free article] [PubMed] [Google Scholar]
- 39.Nilsson SE. An electron microscopic classification of the retinal receptors of the leopard frog (Rana pipiens). J Ultrastruct Res 1964; 10:390–416 [DOI] [PubMed] [Google Scholar]


