

Abstract
Progranulin (PGRN) is predominantly expressed by microglia in the brain, and genetic and experimental evidence suggests a critical role in Alzheimer's disease (AD). We asked whether PGRN expression is changed in a disease severity‐specific manner in AD. We measured PGRN in cerebrospinal fluid (CSF) in two of the best‐characterized AD patient cohorts, namely the Dominant Inherited Alzheimer's Disease Network (DIAN) and the Alzheimer's Disease Neuroimaging Initiative (ADNI). In carriers of AD causing dominant mutations, cross‐sectionally assessed CSF PGRN increased over the course of the disease and significantly differed from non‐carriers 10 years before the expected symptom onset. In late‐onset AD, higher CSF PGRN was associated with more advanced disease stages and cognitive impairment. Higher CSF PGRN was associated with higher CSF soluble TREM2 (triggering receptor expressed on myeloid cells 2) only when there was underlying pathology, but not in controls. In conclusion, we demonstrate that, although CSF PGRN is not a diagnostic biomarker for AD, it may together with sTREM2 reflect microglial activation during the disease.
Keywords: Alzheimer's disease, biomarker, microglia, progranulin, TREM2
Subject Categories: Biomarkers & Diagnostic Imaging, Neuroscience
Introduction
Haploinsufficiency of the gene encoding progranulin (PGRN) leads to frontotemporal lobar degeneration (FTLD) with TAR DNA binding protein 43 (TDP‐43) deposition (FTLD‐TDP) (Baker et al, 2006; Cruts et al, 2006; Neumann et al, 2006). Reduced PGRN protein in plasma, serum or cerebrospinal fluid (CSF) has been shown to be a reliable diagnostic biomarker for early detection of progranulin (GRN) mutation carriers (Ghidoni et al, 2008; Finch et al, 2009; Sleegers et al, 2009). Certain GRN variants may also increase the risk for Alzheimer's disease (AD) (Brouwers et al, 2008; Rademakers et al, 2008; Viswanathan et al, 2009; Lee et al, 2011; Cruchaga et al, 2012; Sheng et al, 2014; Xu et al, 2017), yet associations could not be confirmed in some other studies (Fenoglio et al, 2009; Mateo et al, 2013). Studies in AD mouse models indicated that PGRN is strongly increased in microglia clustering around amyloid plaques (Pereson et al, 2009) and may also affect amyloid β‐peptide (Aβ) and tau deposition. PGRN may have beneficial effects on Aβ deposition, since PGRN deficiency in animal models increases Aβ deposition (Minami et al, 2014) and elevating PGRN expression reduces the amyloid plaque burden (Minami et al, 2014; Van Kampen & Kay, 2017). However, it has also been observed that PGRN deficiency leads to a decrease in diffuse Aβ plaque load (Takahashi et al, 2017; Hosokawa et al, 2018), which may point to a detrimental effect of PGRN in Aβ deposition. In regard to tau pathology, PGRN deficiency accelerates tau deposition and phosphorylation in human tau‐expressing mice (Hosokawa et al, 2015; Takahashi et al, 2017). Furthermore, an AD‐associated GRN variant (rs5848), which causes a decrease in PGRN levels in plasma and CSF (Rademakers et al, 2008; Nicholson et al, 2014; Morenas‐Rodríguez et al, 2015), is associated with increased CSF T‐tau levels in participants of the ADNI study (Takahashi et al, 2017). Together, these results indicate a protective role of PGRN against the development of tau pathology and/or neurodegeneration.
PGRN is a 593 amino acid protein that contains seven and a half tandem repeats forming the granulin domains (Bateman et al, 1990; Bhandari et al, 1992). It is targeted through the secretory pathway and secreted into the extracellular space. Secreted PGRN can be taken up and targeted to endosomes/lysosomes (Hu et al, 2010; Zhou et al, 2015b). Proteolytic processing of full‐length PGRN may generate individual granulin peptides (Kleinberger et al, 2013; Holler et al, 2017). Within the brain, PGRN is predominantly expressed by microglia (Zhang et al, 2014; Lui et al, 2016; Chang et al, 2017), but some expression is also observed in neurons. Moreover, PGRN is significantly increased upon microglial activation (Daniel et al, 2000; Naphade et al, 2010; Petkau et al, 2010; Philips et al, 2010; Kleinberger et al, 2013; Suh et al, 2014). PGRN may be involved in the modulation of neuroinflammation since PGRN‐deficient mice exhibit increased microglial activation and astrogliosis, as well as augmented expression of proinflammatory cytokines (Yin et al, 2009, 2010; Ahmed et al, 2010; Martens et al, 2012; Wils et al, 2012; Filiano et al, 2013; Minami et al, 2014). Whereas deficiency in the triggering receptor expressed on myeloid cells 2 (TREM2) locks microglia in a homeostatic stage (Mazaheri et al, 2017), loss of PGRN leads to their hyperactivation. Thus, deficiency of PGRN and TREM2 results in opposite functional deficits (Götzl et al, submitted).
Although genetic data and functional analyses in animal models provide some evidence for an involvement of PGRN in AD, no changes in CSF PGRN in AD compared to healthy controls have been reported so far (Nicholson et al, 2014; Körtvélyessy et al, 2015; Morenas‐Rodríguez et al, 2015; Wilke et al, 2017). However, these studies focused primarily on AD dementia and did not investigate the entire continuum of AD. Given that CSF biomarkers, such as the shed ectodomain of the triggering receptor expressed on myeloid cells 2 (sTREM2), show dynamic changes throughout the course of AD (Suárez‐Calvet et al, 2016a,b), we aimed to cross‐sectionally assess CSF PGRN changes at different stages of the disease. To this end, we studied a sample of persons at‐risk for autosomal dominant AD (ADAD) recruited within the Dominantly Inherited AD Network (DIAN; http://dian.wustl.edu) (Bateman et al, 2012) and participants with late‐onset AD from the Alzheimer's Disease Neuroimaging Initiative (ADNI; http://adni.loni.usc.edu; Weiner et al, 2012). We investigated whether CSF PGRN (i) increases in relation to the clinical course of AD; (ii) is associated with cognitive impairment and neuroimaging markers of neurodegeneration (fludeoxyglucose positron emission tomography, FDG‐PET and hippocampal volume) in subjects with AD; and (iii) is associated with the microglial‐derived protein sTREM2 as well as biomarkers of amyloid and tau pathology.
Results
CSF PGRN increases throughout the course of autosomal dominant Alzheimer's disease
Cross‐sectionally, we assessed CSF PGRN in 215 participants from the DIAN initiative, including 130 mutation carriers (MC) and 85 non‐carriers (NC; Table 1). All analyses described were adjusted for gender, age and APOE ε4 status, unless stated otherwise.
Table 1.
DIAN participants' characteristics
| Autosomal dominant Alzheimer's disease (DIAN study) | |||
|---|---|---|---|
| Non‐carriers (NC) (n = 85) | Mutation carriers (MC) (n = 130) | P‐value (group effect) | |
| Age, years | 40.0 (10.8) | 39.9 (10.7) | 0.955 |
| Females, % | 55.3 | 49.2 | 0.384 |
| APOE ε4 carriers, % | 35.3 | 27.7 | 0.237 |
| Participant EYO, y | −6.81 (11.7) | −6.68 (10.7) | 0.931 |
| Education level, y | 14.8 (2.40) | 13.7 (3.19) | 0.005a |
| MMSE, scores | 29.0 (1.26) | 25.6 (6.16) | < 0.0001a |
| CSF biomarkers, pg/mlb | |||
| T‐tau | 60.1 (28.1) | 130 (97.0) | < 0.0001a |
| P‐tau181P | 30.5 (10.3) | 69.8 (42.0) | < 0.0001a |
| Aβ1–42 | 425 (136) | 322 (160) | < 0.0001a |
| sTREM2 | 2,796 (1,305) | 3,520 (1,640) | 0.0007a |
| PGRNc | 927 (174) | 1,041 (199) | 0.00004a |
| Cognitive status, %d | |||
| CDR = 0 | 96.5 | 43.1 | |
| CDR = 0.5 | 3.5 | 39.2 | |
| CDR = 1 | 0 | 11.5 | |
| CDR = 2–3 | 0 | 6.1 | |
| Family mutations, %e | |||
| PSEN1 | 58.8 | 77.7 | |
| PSEN2 | 14.1 | 8.5 | |
| APP | 27.1 | 13.8 | |
Aβ1–42, amyloid‐β 42; AD, Alzheimer disease; APOE, apolipoprotein E; APP, amyloid precursor protein; CSF, cerebrospinal fluid; EYO, estimated years from expected symptom onset; MMSE, Mini‐Mental State Examination; PSEN1, presenilin 1; PSEN2, presenilin 2; P‐tau181P, tau phosphorylated at threonine 181; T‐tau, total tau; y, years.
Data are expressed as mean (M) and standard deviation (SD) or percentage (%), as appropriate. Pearson's chi‐square tests were used for the group comparisons of categorical variables and two‐sample independent t‐tests to compare continuous variables.
Significant differences. The P‐values indicated in the last column refer to the group effects in these tests.
CSF core biomarkers in DIAN were measured using the Luminex bead‐based multiplexed xMAP technology (INNO‐BIA AlzBio3, Innogenetics).
CSF PGRN differences were assessed by a linear model adjusted for age, gender and APOE ε4 status (see main text).
Cognitive status was defined by the clinical dementia rating (CDR) score (0, cognitively normal; 0.5, very mild; 1, mild; 2, moderate; 3, severe dementia).
In NC participants, the mutation present in their family is shown.
The levels of CSF PGRN were significantly increased in MC compared to NC (F 1,210 = 17.6, P = 0.00004, Fig 1A, Appendix Table S1). In contrast to CSF sTREM2 (Henjum et al, 2016; Heslegrave et al, 2016; Piccio et al, 2016; Suárez‐Calvet et al, 2016a,b), CSF PGRN was not significantly associated with age, neither in the entire sample (β = 0.118, P = 0.079), nor when stratifying by mutation status (for NC: β = 0.125, P = 0.283; for MC: β = 0.131, P = 0.142, Fig 1B). Consistent with previous publications (Nicholson et al, 2014; Morenas‐Rodríguez et al, 2015), CSF PGRN was higher in males than in females (F 1,210 = 6.35, P = 0.012, Fig 1C) and were not affected by APOE ε4 status (F 1,210 = 0.041, P = 0.840). CSF PGRN did not differ between the three ADAD‐associated genes (PSEN1, PSEN2 and APP) among the MC participants (F 2,124 = 0.77, P = 0.464, Fig 1D).
Figure 1. Association of CSF PGRN with mutation status, age and gender.
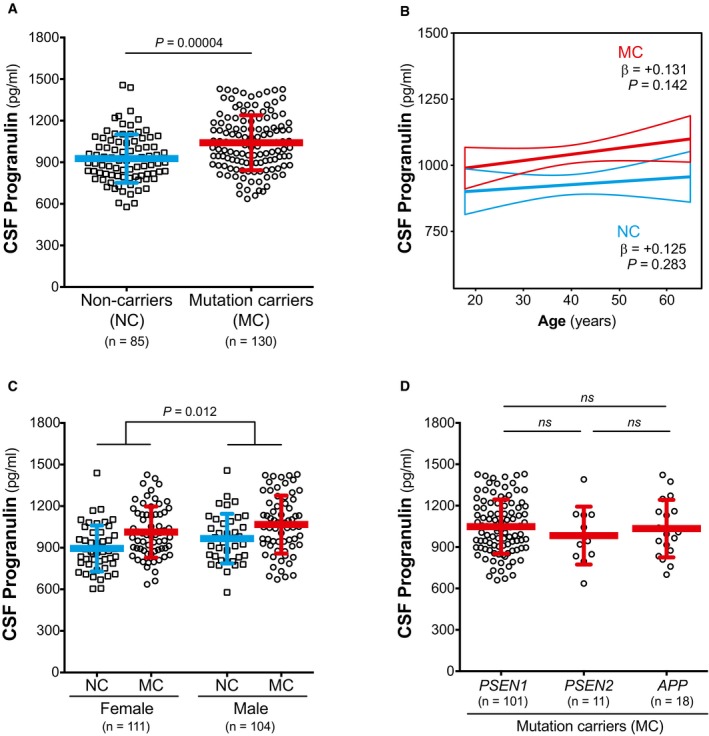
- CSF PGRN is increased in mutation carriers (MC) compared to non‐carriers (NC).
- CSF PGRN is not associated with age in either NC or MC.
- CSF PGRN is increased in males compared to females.
- CSF PGRN levels do not differ among MC participants carrying a PSEN1, PSEN2 or APP mutation.
We determined how CSF PGRN changes as a function of the estimated years from expected symptom onset (EYO) in MC compared to NC. Mean estimated levels of CSF PGRN at consecutive 5‐year interval EYO were computed by a linear regression model including mutation status, EYO and gender as predictor variables (see Statistical analysis section). As described by Bateman et al (2012), we tested first‐, second‐ and third‐order EYO terms (EYO, EYO2 and EYO3, respectively) as well as their interaction with mutation status. The first‐order (i.e. linear) model best fitted the data (Appendix Table S2). The interaction of EYO with mutation status was a significant predictor of CSF PGRN changes (P = 0.041), indicating that the changes in CSF PGRN as a function of EYO differ between MC and NC. We compared the estimated CSF PGRN at 5‐year EYO intervals by t‐tests and observed that CSF PGRN started to be significantly increased in MC compared to NC at EYO = −10 (Table 2, Fig 2A, Appendix Table S3).
Table 2.
CSF PGRN estimates (pg/ml) in MCs and NCs as a function of EYO
| Estimated years from expected symptom onset (EYO) | ||||||||
|---|---|---|---|---|---|---|---|---|
| −25 | −20 | −15 | −10 | −5 | 0 | +5 | +10 | |
| Non‐carriers | 974 | 978 | 983 | 988 | 992 | 997 | 1,002 | 1,006 |
| Mutation carriers | 992 | 1,022 | 1,052 | 1,082 | 1,112 | 1,142 | 1,172 | 1,202 |
| Difference | 18 | 44 | 69 | 94 | 120 | 145 | 170 | 196 |
| 95% CI | [−104, 140] | [−64, 151] | [−27, 165] | [4, 184] | [29, 210] | [48, 242] | [62, 279] | [72, 319] |
| P‐value | 0.768 | 0.423 | 0.159 | 0.040a | 0.010a | 0.004a | 0.002a | 0.002a |
CI, confidence interval.
Mean estimated levels of CSF PGRN were obtained by a linear model including gender, mutation status, EYO and the interaction between mutation status and EYO as covariates (see Statistical analysis section and Appendix Table S2). For each EYO, the group difference, 95% CI and the P‐value for the two‐sample independent t‐test are reported. Participants with EYO > +20 (1 NC and 2 MC) were excluded from the analysis. The same analysis including the PGRN outliers and those participants with an EYO > +20 yielded identical results (Appendix Table S3). Differences are calculated from unrounded values.
Significant difference.
Figure 2. Changes in CSF PGRN as a function of EYO.

- CSF PGRN as a function of EYO in mutation carriers (MC, red) and non‐carriers (NC, blue). The solid lines indicate the regression line for each of the groups and the 95% confidence interval (CI) calculated by a linear model adjusting by gender. The interaction term of mutation status and EYO is significant (P = 0.041), also when including PGRN outliers and participants with EYO > +20 (P = 0.030). Individual data points are not displayed to prevent disclosure of mutation status.
- The graph depicts the standardized differences in CSF PGRN between MCs and NCs as a function of EYO, in the context of other biomarker and cognitive changes. The curves were generated by the linear model that best fit each marker (see Statistical analysis section and Appendix Table S2). CSF PGRN is significantly increased in MC compared to NC 10 years before the expected symptom onset (shadowed area) after brain amyloidosis and brain injury (as measured by CSF T‐tau) have started, and shortly before CSF sTREM2 starts to increase.
Following the approach of previous DIAN studies (Bateman et al, 2012; Fagan et al, 2014; Suárez‐Calvet et al, 2016a,b), we added CSF PGRN in the temporal sequence of biomarker changes within the course of ADAD (Fig 2B). Like CSF sTREM2, changes in CSF PGRN occurred after alterations in markers for brain amyloidosis and neuronal injury, as measured by CSF T‐tau.
Next, we compared CSF PGRN in MC at different clinical stages defined by the clinical dementia rating (CDR) score with that of the NC. We hence compared four groups: NC, cognitively normal (CDR = 0) MC, very mild dementia (CDR = 0.5) MC and mild‐to‐severe dementia (CDR > 1) MC. Participants with a CDR ≥ 1 were grouped together because of the low number of subjects in these groups (Table 1). We conducted an analysis of covariance (ANCOVA) adjusted for age, gender, APOE ε4 status and education, and we observed a significant difference between the four groups (F 3,207 = 5.77, P = 0.001). A least significant difference (LSD) pair‐wise post hoc comparisons revealed that all MC groups (CDR = 0: M = 1002, SD = 186; CDR = 0.5: M = 1072, SD = 201; CDR ≥ 1: M = 1065, SD = 214; pg/ml) had significantly higher CSF PGRN than the NC (M = 927 pg/ml, SD = 174; P = 0.026, P = 0.0001 and P = 0.018, respectively). No differences were found between the MC groups at different clinical stages. Likewise, CSF PGRN levels were not associated with Mini‐Mental State Examination (MMSE; P = 0.881) or CDR sum of boxes (CDR‐SB; P = 0.812) among MC.
CSF PGRN increases throughout the course of late‐onset Alzheimer's disease
To further validate our findings in subjects with late‐onset AD, we studied a total of 1,017 participants of the ADNI study (demographics of the entire ADNI sample are summarized in Appendix Table S4). In the entire sample, and consistent with the findings in ADAD, CSF PGRN was higher in males than females (F 1,1013 = 26.4, P < 0.0001, Appendix Table S5). A trend towards lower PGRN was observed in APOE ε4 carriers (F 1,1013 = 3.40, P = 0.066), but was not associated with age (β = +0.049, P = 0.118).
In order to study the changes in CSF PGRN at different stages of disease severity, we defined disease stage according to the recently proposed biomarker‐based A/T/N framework (Jack et al, 2016a) in combination with the CDR score (Morris, 1993; Table 3). The A/T/N classification is the basis of the 2018 National Institute on Aging–Alzheimer's Association (NIA‐AA) Research Framework (Jack et al, 2018) and defines three binary biomarker categories: (i) aggregated Aβ (A+/A−), (ii) aggregated tau (T+/T−) and (iii) neurodegeneration or neuronal injury (N+/N−). Herein, each of these categories was defined using the AD CSF core biomarkers, namely CSF Aβ1–42 (A), P‐tau181P (T) and T‐tau (N). The aggregated tau (T) and neurodegeneration (N) groups were merged together to simplify the number of groups to compare (only 5.3% of the participants of the ADNI total sample displayed discrepancies between the T and N biomarker groups; see Materials and Methods section for a comprehensive description on the classification). We also classified the participants based on their clinical status (C), as measured by the well‐established CDR global score (Morris, 1993), into cognitively unimpaired (CDR = 0), very mild dementia (CDR = 0.5) and mild dementia (CDR = 1). The combination of both the biomarker and the clinical classification rendered twelve different groups that are summarized in Table 3. After classifying the participants of the ADNI sample, we analysed the data following two approaches. In a first approach, we attempted to model disease stages within the Alzheimer's continuum as a combination of biomarkers and clinical symptoms similar to what was proposed by the previous 2011 NIA‐AA diagnostic criteria (Albert et al, 2011; McKhann et al, 2011; Sperling et al, 2011), and it was done in order to render the disease staging in late‐onset AD more comparable to that in ADAD defined by EYO. Second, in an exploratory approach, we compared PGRN levels between the different A/T/N categories within each clinical stage.
Table 3.
Classification of ADNI participants based on their biomarker profile and clinical stage

Thus, we first asked whether CSF PGRN increases in relation to the biomarker‐defined clinical stages, and hence parallels PGRN changes as a function of EYO in ADAD. For this purpose, we compared the “healthy control” group (highlighted in light grey in Table 3) with those groups that belong to the Alzheimer's continuum (highlighted in middle grey in Table 3). We hence compared five groups in this first analysis, namely (i) “healthy controls”, (ii) “Preclinical AD A+/TN−” (iii) “Preclinical AD A+/TN+” (iv) “AD CDR = 0.5” and (v) “AD CDR = 1”.
The demographics and clinical features of these groups are summarized in Table 4. We conducted an ANCOVA controlling for age, gender and APOE ε4 status, and we found that CSF PGRN significantly differed between groups (F 4,594 = 7.32, P < 0.0001). Bonferroni corrected pair‐wise post hoc comparisons indicated that CSF PGRN was significantly higher in the “AD CDR = 1” group compared to the “healthy controls” (P = 0.006) and “Preclinical AD A+/TN−” (P < 0.0001) groups (Fig 3 and Table 4). Interestingly, the “Preclinical AD A+/TN−” group had significantly lower CSF PGRN than the rest of the Alzheimer's continuum groups (Fig 3 and Table 4) but not to “healthy controls”. No other group differences were found.
Table 4.
ADNI participants' characteristics for the control and Alzheimer's continuum groups in ADNI
| Healthy controls (n = 128) | Alzheimer's continuum (n = 474) | P‐value (group effect) | ||||
|---|---|---|---|---|---|---|
| Preclinical AD A+/TN− (n = 56) | Preclinical AD A+/TN+ (n = 48) | AD CDR = 0.5 (n = 289) | AD CDR = 1 (n = 81) | |||
| Age, years | 72.5 (5.37) | 73.2 (5.96) | 76.5 (5.37) | 73.3 (7.05) | 73.8 (9.27) | 0.017a |
| Female, % | 48.4 | 46.4 | 52.1 | 42.6 | 50.6 | 0.542 |
| APOE ε4 carriers, % | 14.8 | 39.3 | 58.3 | 76.5 | 74.1 | < 0.0001a |
| GRN rs5848 TT carriers, %b | 5.20 | 13.2 | 6.90 | 13.6 | 14.8 | 0.472 |
| Education, y | 16.3 (2.79) | 16.5 (2.74) | 16.5 (2.47) | 15.9 (2.87) | 15.1 (2.78) | 0.010a |
| Cognitive tests, scores | ||||||
| ADNI‐Mem | 1.14 (0.59) | 1.04 (0.61) | 0.86 (0.56) | −0.28 (0.64) | −1.02 (0.46) | < 0.0001a |
| ADNI‐EF | 0.94 (0.75) | 0.74 (0.70) | 0.40 (0.61) | −0.12 (0.79) | −1.07 (0.78) | < 0.0001a |
| ADAS‐Cog11 | 5.96 (3.12) | 5.85 (3.06) | 6.54 (3.01) | 13.2 (5.34) | 23.2 (6.98) | < 0.0001a |
| ADAS‐Cog13 | 8.94 (4.57) | 9.27 (4.51) | 10.2 (4.45) | 21.2 (7.38) | 34.6 (7.95) | < 0.0001a |
| MMSE | 29.1 (1.12) | 28.9 (1.23) | 29.0 (1.20) | 26.3 (2.39) | 22.7 (2.06) | < 0.0001a |
| CDR‐SB | 0.016 (0.09) | 0.054 (0.16) | 0.073 (0.21) | 2.09 (1.09) | 5.62 (1.17) | < 0.0001a |
| CSF biomarkers, pg/mlc | ||||||
| T‐tau | 184 (31.8) | 166 (41) | 329 (77.5) | 382 (135) | 395 (137) | < 0.0001a |
| P‐tau181P | 16.3 (2.87) | 15.4 (4.09) | 33.0 (8.93) | 39.1 (14.5) | 39.4 (15.1) | < 0.0001a |
| Aβ1–42 | 1,455 (227) | 724 (193) | 712 (173) | 636 (167) | 575 (159) | < 0.0001a |
| PGRNd | 1,502 (279) | 1,394 (365) | 1,569 (305) | 1,541 (343) | 1,649 (375) | < 0.0001a |
A, amyloid‐β biomarker status; Aβ1–42, amyloid‐β 42; AD, Alzheimer disease; APOE, apolipoprotein E; ADAS‐Cog, Alzheimer's disease Assessment Scale—cognitive subscale; ADNI‐Mem, ADNI memory composite score; ADNI‐EF, ADNI executive function composite score; CDR, clinical dementia rating; CDR‐SB, clinical dementia rating sum of boxes; CSF, cerebrospinal fluid; MMSE, Mini‐Mental State Examination; N, neurodegeneration biomarker status; P‐tau181P, tau phosphorylated at threonine 181; T, tau pathology biomarker status; T‐tau, total tau; y, years.
Data are expressed as mean (M) and standard deviation (SD) or percentage (%), as appropriate. Pearson's chi‐square tests were used for the group comparisons of categorical variables and one‐way ANOVA to compare continuous variables.
Significant differences. The P‐values indicated in the last column refer to the group effects in these tests.
GRN rs5848 genotype was available in 77 “healthy controls” (60%), 38 “Preclinical AD A+/TN−” (68%), 29 “Preclinical AD A+/TN+” (60%), 154 “AD CDR = 0.5” (53%) and 54 “AD CDR = 1” (67%).
The CSF core biomarker measurements were performed using the electrochemiluminescence immunoassays, total‐tau CSF, phospho‐tau(181P) CSF and Elecsys β‐amyloid(1–42) CSF. The Elecsys β‐amyloid(1–42) assay has an upper technical limit of 1700 pg/ml; the values above this limit were truncated to this value.
CSF PGRN levels were log‐transformed and assessed by a linear model adjusted for age, gender and APOE ε4 status (see main text).
Figure 3. CSF PGRN levels across the Alzheimer's continuum .

Scatter plot representing the levels of CSF PGRN in healthy controls (depicted in blue) and the different stages of the Alzheimer's continuum (depicted in red). The blue and the red bars represent the mean and the standard deviation (SD). The analysis and graphs were performed excluding CSF PGRN outliers (1 “healthy control”, 1 “Preclinical AD A+/TN−”, 4 “AD CDR = 0.5” and 1 “AD CDR = 1”). Including them yielded a similar result, and CSF PGRN was still significantly higher in the “AD CDR = 1” group compared to the “healthy controls” (P = 0.001) and “Preclinical AD A+/TN−” (P = 0.0001) groups. P‐values were assessed by a one‐way analysis of covariance adjusted for age, gender and APOE ε4, followed by Bonferroni corrected pair‐wise post hoc comparisons. A: amyloid‐β biomarker status; AD: Alzheimer's disease; CDR: clinical dementia rating; CSF, cerebrospinal fluid; N, neurodegeneration biomarker status; T: tau pathology biomarker status.
Given that GRN rs5848 is a well‐known modifier of PGRN levels (Rademakers et al, 2008; Nicholson et al, 2014; Morenas‐Rodríguez et al, 2015), we repeated the same analysis but also accounting for the rs5848 genotype, which was available for 58.5% of the cases (see Table 4). CSF PGRN still significantly differed between groups (F 4,342 = 5.66, P = 0.0002), where significant differences were observed when “AD CDR = 1” was compared to “healthy controls” (P = 0.030) and “Preclinical AD A+/TN−” (P = 0.0001) groups in Bonferroni corrected pair‐wise post hoc comparisons. Similarly, CSF PGRN remained lower in “Preclinical AD A+/TN−” compared to “AD CDR = 0.5” (P = 0.002) and “AD CDR = 1” (P = 0.0001) groups and a tendency existed when compared to “Preclinical AD A+/TN+” (P = 0.082). Consistent with previous reports (Rademakers et al, 2008; Nicholson et al, 2014; Morenas‐Rodríguez et al, 2015), there was a significant effect of the GRN rs5848 genotype on CSF PGRN levels (F 2,342 = 20.6, P < 0.0001), such that the CSF PGRN mean level of the GRN rs5848 TT carriers (M = 1348 pg/ml, SD = 330) was significantly lower than that of the rs5848 CT carriers (M = 1524 pg/ml, SD = 277, P = 0.0001) and rs5848 CC carriers (M = 1659 pg/ml, SD = 379, P < 0.0001) groups (Bonferroni corrected pair‐wise post hoc comparisons). Together, the CSF PGRN changes across biomarker‐defined clinical stages are consistent with the increase we found in ADAD throughout EYO.
To further confirm that CSF PGRN changes across the disease course, we also tested whether CSF PGRN levels are associated with cognitive and functional scores in those participants that fall in the Alzheimer's continuum category (Table 5; Fig 4). Our primary cognitive measures were the composite scores ADNI‐Mem (Fig 4A), for memory performance, and ADNI‐EF (Fig 4B), for executive function, since they have been previously validated in the ADNI study, are robust and have external validity (Crane et al, 2012; Gibbons et al, 2012; Habeck et al, 2012). We computed three linear regression models, including as main predictors: unadjusted (Model 1); adjusted for age, gender, APOE ε4 status and education (Model 2); and additionally adjusted for CSF Aβ1–42 and CSF T‐tau (Model 3, Table 5). Higher CSF PGRN was associated with lower memory performance as measured by ADNI‐Mem (β = −0.145, P = 0.002) and executive function as assessed by ADNI‐EF (β = −0.145, P = 0.002) in an unadjusted model (Model 1, Table 5 and Appendix Table S6). These associations remained significant after adjustment for age, gender, APOE ε4 status and education (Model 2, ADNI‐Mem: β = −0.140, P = 0.002, Fig 4A; ADNI‐EF: β = −0.150, P = 0.0008, Fig 4B; Table 5 and Appendix Table S6). We also studied ADAS‐Cog 11, ADAS‐Cog 13, MMSE and CDR‐SB as secondary cognitive measures, and the results were similar (Fig 4C–F, Table 5 and Appendix Table S6). The associations remain significant after accounting for Aβ1–42 and T‐tau (Model 3) for ADNI‐EF, ADAS‐Cog 11 and ADAS‐Cog 13, and a tendency existed for ADNI‐Mem and MMSE (Table 5, Appendix Table S6), indicating that the association between CSF PGRN and cognitive scores is, at least in part, not dependent on the AD CSF core biomarkers.
Table 5.
Associations of CSF PGRN with cognitive measures in the Alzheimer's continuum category (ADNI sample)
| Model 1 (unadjusted) | Model 2 (adjusted for age, gender, APOE ε4 and education) | Model 3 (also adjusted for Aβ1–42 and T‐tau) | ||||
|---|---|---|---|---|---|---|
| β | P | β | P | β | P | |
| ADNI‐Mem | −0.145 | 0.002a | −0.140 | 0.002a | −0.080 | 0.064 |
| ADNI‐EF | −0.145 | 0.002a | −0.150 | 0.0008a | −0.116 | 0.001a |
| ADAS‐Cog 11 | +0.138 | 0.003a | +0.135 | 0.003a | +0.095 | 0.036a |
| ADAS‐Cog 13 | +0.149 | 0.001a | +0.148 | 0.001a | +0.108 | 0.016a |
| MMSE | −0.126 | 0.006a | −0.126 | 0.006a | −0.087 | 0.052 |
| CDR‐SB | +0.174 | 0.011a | +0.125 | 0.007a | +0.070 | 0.119 |
Aβ1–42, amyloid‐β 42; ADAS‐Cog, Alzheimer's disease Assessment Scale—cognitive subscale; ADNI‐Mem, ADNI memory composite score; ADNI‐EF, ADNI executive function composite score; CDR‐SB, clinical dementia rating sum of boxes; MMSE, Mini‐Mental State Examination; T‐tau, total tau.
Associations between CSF PGRN and cognitive measures were studied only in the participants of the Alzheimer's continuum (n = 474) and were assessed by three different linear regression models. The standardized regression coefficients (β) and the P‐values are shown.
Note that higher levels of CSF PGRN are associated with worse cognitive performance in all tests investigated even when age, gender APOE ε4 status and education (Model 2) are accounted. The associations still remain after adding Aβ1–42 and T‐tau as added in the model (Model 3) in all tests except in ADNI‐Mem, MMSE and CDR‐SB.
The analysis was performed excluding CSF PGRN outliers. The same analysis including these outliers yielded similar results (Appendix Table S6). There were two subjects without ADAS‐Cog11 score and six subjects without ADAS‐Cog13 scores.
Significant differences.
Figure 4. CSF PGRN as a function of cognitive function.

Scatter plots representing the association of CSF PGRN with different cognitive tests. Only the subjects of the Alzheimer's continuum group (n = 474) were included. In all tests studied, higher levels of CSF PGRN were associated with worse cognitive performance (namely lower scores in ADNI‐Mem, ADNI‐EF and MMSE and higher scores in ADAS‐Cog11, ADAS‐Cog13 and CDR‐SB). The analysis and the graphs are excluding PGRN outliers; including them rendered similar results (Appendix Table S6). Each point depicts the value of CSF PGRN and the corresponding cognitive test score of a participant. The solid lines indicate the regression line and the 95% confidence interval (CI) calculated by a linear model (Model 1, unadjusted). Table 5 shows the standardized regression coefficients (β) and the P‐values calculated by different models. ADAS‐Cog, Alzheimer's disease Assessment Scale—cognitive subscale; ADNI‐Mem: ADNI memory composite score; ADNI‐EF: ADNI executive function composite score; CDR‐SB: clinical dementia rating sum of boxes; MMSE, Mini‐Mental State Examination.
We also tested whether CSF PGRN is associated with neuroimaging biomarkers of neurodegeneration typically affected in AD, namely temporo‐parietal FDG‐PET uptake and total hippocampal volume, in the Alzheimer's continuum category (Fig 5). In a linear regression analysis adjusted for age, gender, APOE ε4 status and education, higher CSF PGRN was associated with lower temporo‐parietal FDG‐PET uptake (β = −0.133, P = 0.010) (Fig 5A), but not total hippocampal volume (β = −0.063, P = 0.151, Fig 5B).
Figure 5. CSF PGRN as a function of neuroimaging biomarkers.

-
A, BScatter plots representing the association of CSF PGRN with temporo‐parietal FDG‐PET uptake (A) and total hippocampal volume (B) within the subjects of the Alzheimer's continuum group (n = 474). Each point depicts the value of CSF PGRN and the corresponding neuroimaging biomarker of a participant. The solid lines indicate the regression line and the 95% confidence interval (CI). The regression coefficients (β) and the P‐values calculated by a linear model adjusted for age, gender, APOE ε4 and education. FDG‐PET: fludeoxyglucose positron emission tomography; SUVR: standardized uptake value ratio.
In the second approach, we examined CSF PGRN between biomarker profile [as defined by the A/T/N classification (Jack et al, 2016a)] within each clinical stage (Fig EV1A). Unlike the former analysis of the Alzheimer's continuum, this is an unbiased comparison that does not assume any particular sequence of biomarkers in the course of the disease. Appendix Table S4 displays a summary of the demographics of the entire ADNI sample, analysed here. As expected, the CDR = 1 clinical stage had some biomarker profiles with low number of subjects that preclude any comparisons but are shown in Fig EV1A for the sake of completeness. Following this approach, we found that the “A−TN+” biomarker profiles (i.e. SNAP) had the highest CSF PGRN, which was significantly higher than the rest of the biomarker profiles within the same clinical stage (Fig EV1A). On the contrary, the “A+TN−” biomarker profiles had the lowest CSF PGRN. We next grouped the subjects that fall into each of the biomarker category of “suspected non‐Alzheimer's pathophysiology” (SNAP; Table 3, highlighted in dark grey) (Jack et al, 2012, 2016b; Caroli et al, 2015; Dani et al, 2017) and we compared them to the healthy controls and the Alzheimer's continuum category as a whole. CSF PGRN significantly differ between categories (F 2,778 = 24.7, P < 0.0001, Fig EV1B), and Bonferroni corrected pair‐wise post hoc tests showed that CSF PGRN was significantly higher in the SNAP category compared to the healthy controls (P < 0.0001) and Alzheimer's continuum categories (P < 0.0001). Finally, we also tested the association between CSF PGRN and cognitive function and neuroimaging biomarkers within the SNAP category, with the same linear regression models we applied in the analysis focused on the Alzheimer's continuum category. Strikingly, and in contrast with the results in the Alzheimer's continuum, CSF PGRN was not associated with cognitive decline in the SNAP group in any of the models tested (Appendix Table S7). In line with this finding, CSF PGRN was also not associated with temporo‐parietal FDG‐PET uptake in the SNAP group (β = +0.102, P = 0.203). These results suggest that, despite the fact that CSF PGRN is increased in SNAP, it selectively associates with disease severity in AD.
Figure EV1. CSF PGRN levels in the A/T/N framework.

- Scatter plot representing the levels of CSF PGRN for each of the four biomarker profiles within each clinical staging, as defined by CDR. CDR = 1 stage comprises some biomarker profiles that do not contain enough participants to perform statistical analysis but are nevertheless shown in the figure for completeness. Each biomarker category is represented in a different colour. Healthy controls are depicted in blue, Alzheimer's continuum category in red and SNAP category in green. Purple depicts biomarker profiles not assigned in any category in the present study.
-
Scatter plot grouping the three biomarker categories: healthy controls, all the participants belonging to the Alzheimer's continuum category and the suspected non‐Alzheimer's pathophysiology (SNAP) category.Solid bars represent the mean and the standard deviation (SD). P‐values were assessed by a one‐way analysis of covariance adjusted for age, gender and APOE ε4, followed by Bonferroni corrected pair‐wise post hoc comparisons. The analysis and graphs were performed excluding PGRN outliers (1 “healthy control”, 1 “Preclinical AD A+/TN−”, 4 “AD CDR = 0.5”, 3 “CDR = 0.5 A−TN−”, 1 “CDR = 0.5 A+TN−”, 1 “AD CDR = 1”). Including them yielded a similar result.
CSF PGRN is not a clinical diagnostic biomarker for AD
We assessed the diagnostic accuracy of CSF PGRN to discriminate between AD and controls. To this regard, a receiver operating characteristic (ROC) curve analysis was undertaken (Fig EV2). The area under the curve (AUC) was 0.655 (95% CI 0.581–0.729, P = 0.0001, Fig EV2A) for discriminating ADAD mutation carriers from non‐carriers of the DIAN study, and 0.607 (95% CI 0.528–0.686, P = 0.009, Fig EV2B) for discriminating late‐onset AD CDR = 1 from healthy controls. Although the significant P‐values denote that the AUC of CSF PGRN is significantly different from the area under the diagonal, which corresponds to a random performance of a test, these are low AUC that indicate a poor accuracy to discriminate between AD and controls. Together with the fact that CSF PGRN considerably overlaps between groups, these results show that, consistent with previous data (Nicholson et al, 2014; Körtvélyessy et al, 2015; Morenas‐Rodríguez et al, 2015; Wilke et al, 2017), CSF PGRN is not useful as a diagnostic marker in AD.
Figure EV2. Diagnostic accuracy of CSF PGRN as an AD biomarker.

ROC analysis was performed to test the accuracy to discriminate between ADAD mutation carriers and non‐carriers of the DIAN study (A) and late‐onset AD with mild dementia (CDR = 1) from healthy controls of the ADNI study (B). The areas under the curve (AUCs), their 95% confidence interval (CI) intervals and the P‐values are reported. Optimal cut‐offs were derived based on the Youden index, and the sensitivity and specificity were calculated based on these cut‐offs. AD: Alzheimer's disease; ADAD: autosomal dominant Alzheimer's disease; AUC: area under the curve; CDR: clinical dementia rating; HC: healthy controls; MC: mutation carriers; NC: non‐carriers.
CSF PGRN is associated with CSF sTREM2 and markers of neurodegeneration in both autosomal dominant and late‐onset Alzheimer's disease
We and others previously described an increase in the microglial‐derived protein sTREM2 in the CSF of both ADAD and late‐onset AD patients (Heslegrave et al, 2016; Piccio et al, 2016; Suárez‐Calvet et al, 2016a,b). Since CSF PGRN also gradually increases during the course of the disease and it is mainly produced by activated microglia (Daniel et al, 2000; Naphade et al, 2010; Petkau et al, 2010; Philips et al, 2010; Kleinberger et al, 2013; Suh et al, 2014), we investigated whether these two proteins are associated (Figs 6A and B, and 7A–C). In a linear regression model, we found that CSF PGRN and CSF sTREM2 were significantly associated in ADAD mutation carriers of the DIAN study (β = +0.514, P < 0.0001, Fig 6B). Similarly, CSF PGRN and sTREM2 were also significantly associated in individuals of the Alzheimer's continuum (β = +0.344, P < 0.0001, Fig 7B) and the SNAP category (β = +0.296, P < 0.0001, Fig 7C) of the ADNI study. Importantly, these associations only occurred in AD and SNAP since no association was found in the NC of the DIAN study (β = +0.094, P = 0.424, Fig 6A) and in the healthy controls of the ADNI study (β = +0.106, P = 0.246, Fig 7A). Together, these results suggest that, whenever there is neurodegeneration (triggered by amyloidosis or other causes), there is a concurrent release of the microglial proteins PGRN and sTREM2 into the CSF.
Figure 6. Association of CSF PGRN with AD core CSF biomarkers in ADAD (DIAN).

-
A–HScatter plots representing the associations of CSF PGRN with CSF sTREM2 and each of the AD CSF core biomarkers (T‐tau, P‐tau181P and Aβ1−42) in non‐carriers (NC, blue; A, C, E and G) and in mutation carriers (MC, red; B, D, F and H). Each point depicts the value of CSF PGRN and the corresponding biomarker of a subject and the solid lines indicate the regression line and the 95% confidence interval (CI) for each of the groups. The standardized regression coefficients (β) and the P‐values are shown and were computed using a linear model adjusting for age, gender and APOE ε4. The sample contained some outliers (defined as 3 SDs below or above the group mean) of the CSF core markers of AD. The results shown in the figure are excluding these outliers. We also performed the analysis including these outliers which yielded similar results (Appendix Table S8). Aβ1–42: amyloid‐β 42; T‐tau: total tau; P‐tau: tau phosphorylated at threonine 181.
Figure 7. Association of CSF PGRN with AD core CSF biomarkers in late‐onset AD (ADNI).

-
A–LScatter plots representing the associations of CSF PGRN with CSF sTREM2 and each of the AD CSF core biomarkers (T‐tau, P‐tau181P and Aβ1–42) in healthy controls (blue; A, D, G and J), Alzheimer's continuum (red; B, E, H and K) and “suspected non‐Alzheimer's pathophysiology (SNAP)” groups (green; C, F, I and L). Each point depicts the value of CSF PGRN and the corresponding biomarker of a subject, and the solid lines indicate the regression line and the 95% confidence interval (CI) for each of the groups. The standardized regression coefficients (β) and the P‐values are shown and were computed using a linear model adjusting for age, gender and APOE ε4. The sample contained some outliers (defined as 3 SDs below or above the group mean) of the CSF core markers of AD, and the analysis including these outliers yielded similar results (Appendix Table S8). The Aβ1–42 values used for the association test are those based on an extrapolation curve since the upper technical limit is 1,700 pg/ml. We also tested the associations with Aβ1–42 values truncated at the upper technical limit and the result was similar. Aβ1–42: amyloid‐β 42; T‐tau: total tau; P‐tau: tau phosphorylated at threonine 181; SNAP: suspected non‐Alzheimer's pathophysiology.
We also tested the associations between CSF PGRN and each of the core CSF biomarkers of AD (T‐tau, P‐tau181P and Aβ1–42) in linear regression models for both ADAD (DIAN) and late‐onset AD (ADNI) (Figs 6C–H and 7D–L; Appendix Table S8 summarizes the results including biomarker outliers). The results paralleled those we previously found for CSF sTREM2 (Suárez‐Calvet et al, 2016a,b). CSF PGRN was associated with CSF T‐tau and CSF P‐tau181P, markers of neurodegeneration and neurofibrillary tangle degeneration, respectively, in both ADAD mutations carriers (T‐tau: β = +0.258 P = 0.008; P‐tau181P: β = +0.191, P = 0.041; Fig 6D and F) and NC (T‐tau: β = +0.240 P = 0.032; P‐tau181P: β = +0.290, P = 0.008, Fig 6C and E). Interestingly, this association was only present in the ADNI subjects of the Alzheimer's continuum (T‐tau: β = +0.295 P < 0.0001; P‐tau181P: β = +0.280, P < 0.0001; Fig 7E and H), but not in healthy controls (T‐tau: β = +0.157 P = 0.087; P‐tau181P: β = +0.118, P = 0.195; Fig 7D and G) or SNAP subjects (T‐tau: β = +0.043 P = 0.564; P‐tau181P: β = +0.104, P = 0.172; Fig 7F and I). These findings are consistent with the fact that CSF PGRN is only associated with cognitive impairment in the Alzheimer's continuum category but not in SNAP and support the idea that CSF PGRN parallels the burden of the disease specifically in AD.
In contrast, we did not observe an association between CSF PGRN and Aβ1–42 in either NC or MC of the DIAN sample (Fig 6G and H) and only a weak association was found in the Alzheimer's continuum and SNAP participants of the ADNI sample (Fig 7J–L).
Discussion
In this cross‐sectional study, we found that CSF PGRN increases throughout the course of AD, both in ADAD and in late‐onset AD. Furthermore, CSF PGRN is associated with the microglial‐derived protein sTREM2 and with markers of neuronal injury (T‐tau) and neurofibrillary tangle degeneration (P‐tau181P). Given that both PGRN and sTREM2 are predominantly expressed in microglia within the brain, our findings provide further evidence for a crucial role of microglia in modulation of onset and progression of AD. While CSF PGRN cannot serve as a diagnostic marker in AD, PGRN may serve as microglial activity marker that, together with sTREM2, could allow tracking microglial phenotypes not only during the course of the disease but also during therapeutic interventions. Furthermore, since loss of TREM2 and PGRN results in opposite phenotypes (Götzl et al, submitted), our findings may also allow to track different activation stages of microglia upon TREM2 or PGRN loss of function. Our study also further reinforces that PGRN is relevant not only for FTD but also for AD.
Although the results in ADAD and late‐onset AD consistently show a continuous increase in CSF PGRN while disease progresses, differences between ADAD and late‐onset AD were observed. While in ADAD CSF PGRN increased early in the disease (10 years before the expected symptom onset), in late‐onset AD, the CSF PGRN levels did not reach a significant increase compared to healthy controls until the mild dementia stage (CDR = 1). Importantly, however, all late‐onset AD groups in the Alzheimer's continuum had increased CSF PGRN levels compared with the earliest stage of AD, the “Preclinical AD A+TN−” group, which had the lowest CSF PGRN levels. This means that once neurodegeneration and neurofibrillary tangle degeneration have started (as expressed by the N and T positivity, respectively), CSF PGRN increases. This parallels what occurs in ADAD, where CSF T‐tau (and hence, probably neurodegeneration as well) significantly increases 15 years before the symptom onset (Bateman et al, 2012; Fagan et al, 2014; Suárez‐Calvet et al, 2016a,b) and this is followed by the later increase in CSF PGRN (EYO = −10, as shown in the present study) and CSF sTREM2 (EYO = −5; Suárez‐Calvet et al, 2016a,b). Our conclusion is further supported by the fact that CSF PGRN is associated with CSF T‐tau, P‐tau181P, cognitive impairment and temporo‐parietal FDG specifically in late‐onset AD, but not in SNAP. This may indicate that, although CSF PGRN production may be increased whenever there is neuronal injury, CSF PGRN is specifically coupled to the progression of neurodegeneration in AD. In contrast, CSF PGRN was not associated with hippocampal volume, which may suggest a more complex link between inflammatory‐related biomarkers such as CSF PGRN and structural imaging. In fact, CSF sTREM2 was found to be positively associated with grey matter volume in mild cognitive impairment due to AD, despite the fact that CSF sTREM2 increases throughout the early stages of the disease, which was attributed to a possible brain swelling (Gispert et al, 2016). CSF PGRN was not either associated with cognitive measurements in ADAD, despite its increase throughout EYO and its clear association with CSF T‐tau and P‐tau181P. This may suggest that in ADAD, CSF PGRN increases early in the disease but remains stable throughout the later clinical progression. In ADAD, the causative PSEN1, PSEN2 and APP mutations are such strong driving forces of disease pathology that other factors, such as PGRN, may be less associated with cognition.
In contrast to our findings, previous studies did not detect an increase of CSF PGRN in AD (Nicholson et al, 2014; Körtvélyessy et al, 2015; Morenas‐Rodríguez et al, 2015; Wilke et al, 2017). This is likely due to the fact that DIAN and ADNI provide a number of samples and an exhaustive clinical data that is unrivalled by any other cohort. In DIAN, we can compare mutation carriers, which are destined to develop AD, with the best controls possible, that is, their non‐carriers' siblings. A further advantage of studying ADAD is the use of the concept of estimated years from expected symptom onset (EYO) as a proxy of disease evolution to predict a temporal progression of CSF PGRN, despite the fact that this is a cross‐sectional study. This approach has been well validated by studies of the DIAN consortium that have shown that there is a high correlation between the parental age of onset and the mean age at onset of the affected family members (from which EYO is derived) and the actual age of onset (Ryman et al, 2014). Finally, in our study we applied an unbiased approach to classify the participants of ADNI, based on biomarker profile (A/T/N) and cognition (C), which made us independent of different diagnostic schemes in different centres (Jack et al, 2016a). That allowed us to study those groups that are included in the Alzheimer's continuum, from preclinical to mild dementia stages of the disease, and compare them with the evolution of the disease in ADAD as defined by EYO.
The precise mechanism underlying the increase in CSF PGRN during AD has yet to be determined. Since PGRN is highly increased upon activation of microglia (Petkau et al, 2010), we speculate that increased CSF PGRN reflects elevated microglial function. It is well established that activation of microglia occurs in AD (Lyman et al, 2014; Heneka et al, 2015) and, in fact, we and others have previously shown that CSF sTREM2 also increases throughout the evolution of the disease (Heslegrave et al, 2016; Piccio et al, 2016; Suárez‐Calvet et al, 2016a,b). A remarkable finding of this study is that higher CSF PGRN levels are associated with higher CSF sTREM2 levels exclusively when disease occurs (either in ADAD MC, late‐onset AD or in SNAP) but not in controls. This may indicate that these two proteins are released by microglia adopting a disease‐associated signature (Keren‐Shaul et al, 2017; Krasemann et al, 2017). However, it is also possible that these two proteins reflect different populations of microglia co‐existing in the disease and may even have opposing effects on disease. While lack of TREM2 locks microglia in a homeostatic state (Mazaheri et al, 2017), lack of PGRN locks microglia in a hyperactive state (Götzl et al, submitted). Whether these responses are beneficial or detrimental in the disease may depend on the stage of the disease and needs to be addressed in longitudinal studies. The fact that CSF PGRN is associated with the microglial‐derived protein CSF sTREM2 and both are associated with markers of neuronal injury and neurofibrillary tangle degeneration suggests that elevated levels of CSF PGRN and CSF sTREM2 early during the disease reflect a microglial response to neuronal injury. In line with this, recent studies demonstrated that disease‐associated TREM2 variants cause a loss of function suggesting that TREM2 is protective (Kleinberger et al, 2014, 2017; Wang et al, 2015; Song et al, 2018). Similarly, haploinsufficiency of PGRN causes FTD (Baker et al, 2006; Cruts et al, 2006), and a complete loss of PGRN results in a lysosomal storage disorder with severe neurodegeneration (Smith et al, 2012; Götzl et al, 2014). Therefore, TREM2 and PGRN may have a protective function at least early during the disease. TREM2 clearly has a cell‐autonomous function mediated via DAP12 signalling within microglia (Colonna & Wang, 2016). However, sTREM2, which is released on the plasma membrane, may also have non‐cell‐autonomous functions. Similarly, PGRN is either targeted directly from the trans‐Golgi to lysosomes (where it then may have cell‐autonomous functions) or released via the secretory pathway (Götzl et al, 2016). In that case PGRN, like sTREM2, may have intrinsic functions within microglia, but both proteins may be able to affect cellular functions in non‐microglial cells as well.
Finally, it is important to note that CSF PGRN has no utility as a diagnostic marker in AD since the values overlap considerably between groups. This study has to be interpreted from the perspective of the pathophysiological importance of PGRN in AD, and not as the evaluation of a putative diagnostic biomarker. Taken together, PGRN and sTREM2 may both be increased early in the disease upon an initial response of microglia to first neuronal injury. Their CSF levels may therefore allow conclusions about the functional status of microglia. This is also of specific value for the investigation of novel strategies aiming to modulate microglial activity.
Materials and Methods
DIAN participants and study design
The DIAN study is a multicentre study initiated in 2008 that aims to develop a registry of families with known ADAD mutations (namely PSEN1, PSEN2 or APP) and investigate the pathophysiological changes that occur in the different stages of AD (Bateman et al, 2012; Morris et al, 2012; Suárez‐Calvet et al, 2016a,b). We measured CSF PGRN from a total of 218 participants, 131 mutation carriers (MC) and 87 non‐carriers (NC). All DIAN participants underwent a comprehensive clinical and neuropsychological evaluation (Bateman et al, 2012; Storandt et al, 2014). CSF collection follows standard procedures (Fagan et al, 2014; Monserrate et al, 2015), and the measurements of T‐tau, P‐tau181P and CSF Aβ1–42 were performed by the Luminex bead‐based multiplexed xMAP technology (INNO‐BIA AlzBio3, Innogenetics; Fagan et al, 2014). The estimated years from expected symptom onset (EYO) is calculated as the difference between the participant's age at evaluation and the mean age at onset of all other affected family members (Bateman et al, 2012; Ryman et al, 2014).
ADNI participants and study design
The ADNI project (http://adni.loni.usc.edu) is a multicentre longitudinal study led by Principal Investigator Michael Weiner and with the main goal to develop and validate biomarkers for subject selection and as surrogate outcome measures in late‐onset AD (Weiner et al, 2017). Inclusion and exclusion criteria for the ADNI study were previously described comprehensively (Petersen et al, 2010).
For the present study, we measured CSF PGRN in a cross‐sectional sample of the ADNI project consisting of a total of 1,028 individuals. The criteria to select the participants are described in the Appendix Table S9. The CSF PGRN measurements were uploaded to the ADNI database (http://adni.loni.usc.edu) on 16/03/2018, and all the data from ADNI used in this study were downloaded on 21/03/2018.
The CSF core biomarker measurements in ADNI were performed using the electrochemiluminescence immunoassays Elecsys total‐tau CSF, phosphor‐tau(181P) CSF and β‐amyloid (1–42) CSF on a fully automated Elecsys cobas e 601 instrument (Roche) and a single lot of reagents for each of the three measured biomarkers (provided in UPENNBIOMK9.csv file available at http://adni.loni.usc.edu). These immunoassays are for investigational use only. They are currently under development by Roche Diagnostics and not commercially available yet. The Elecsys β‐amyloid (1–42) CSF assay measuring range beyond the upper technical limit has not been formally established. Therefore, use of values above the upper technical limit, which are provided based on an extrapolation of the calibration curve, is restricted to exploratory research purposes and is excluded for clinical decision making or for the derivation of medical decision points. The analyte measuring ranges (lower technical limit to upper technical limit) of these assays are the following: 80–1,300 pg/ml for total‐tau CSF, 8–120 pg/ml for phosphor‐tau(181P) and 200–1,700 pg/ml for Elecsys β‐amyloid (1–42) CSF immunoassays. There were 160 values of Aβ1–42 that were above the upper technical limit and were truncated to 1,700 pg/ml. There were no samples with T‐tau or P‐tau181P values above its respective upper technical limit of quantification. For Aβ1–42, exploratory measurements are available based on the extrapolation of the calibration curve. The associations of the CSF biomarkers described in the text are using these extrapolated values. The analysis using the Aβ1–42 truncated values and those using the extrapolated measurements yielded similar results.
We classified the ADNI participants in a descriptive unbiased approach (Jack et al, 2016a) into two different schemes. First, their biomarker profile, which is defined by the three different pathologic processes that occur in AD and that a biomarker can measure, that is: (i) aggregated Aβ (A, as defined by CSF Aβ1–42); (ii) aggregated tau (T, as defined by CSF P‐tau181P); (iii) neurodegeneration or neuronal injury (N, as defined by CSF T‐tau). We binarized each of the biomarker group into positive (+, abnormal) or negative (−, normal) based on the reported cut‐offs for each of the biomarkers (Hansson et al, 2018). Levels below 976.6 pg/ml (Aβ1–42) or above 21.8 pg/ml (P‐tau181P) and 245 pg/ml (T‐tau) were categorized as positive (A+, T+, N+, respectively). To reduce the number of groups, we merged the aggregated tau (T) and neurodegeneration (N) groups. If either aggregated tau (T) or neurodegeneration (N) was abnormal (T+ or N+), participants were classified as TN abnormal (TN+). If both aggregated tau (T) and neurodegeneration (N) were normal (T− and N−), participants were classified as TN normal (TN−). Note that in the “healthy control” group, we set the criteria that both aggregated tau (T) and neurodegeneration (N) biomarker profile should be normal, so that we ensure that this group is indeed free of pathology. Importantly, only 54 participants (5.3% of the total sample) displayed discrepancies between the T and N biomarker groups. Second, we classified the participants based on clinical symptoms based on the clinical dementia rating (CDR) global score (Morris, 1993) into cognitively unimpaired (CDR = 0), very mild dementia (CDR = 0.5) and mild dementia (CDR = 1). In the sample studied, there were no participants with moderate or severe dementia (CDR = 2–3). The combination of both the biomarker and the clinical classification rendered 12 different groups that are summarized in Table 3.
Cognition in ADNI participants was assessed by ADNI‐Mem, ADNI‐EF, ADAS‐Cog 11, ADAS‐Cog 13, MMSE and CDR‐SB. ADNI‐Mem and ADNI‐EF are both composite scores developed by ADNI. ADNI‐Mem is derived from of the following test scores: Rey Auditory Verbal Learning test, Alzheimer's Disease Assessment Schedule‐Cognition (ADAS‐Cog), MMSE and Logical Memory (Crane et al, 2012). The ADNI‐EF is derived from the following tests: Wechsler Adult Intelligence Scale—Revised Digit Symbol Substitution, Digit Span Backwards, Trials A and B, Category Fluency and Clock Drawing (Gibbons et al, 2012).
Hippocampal volumes based on FreeSurfer segmentation and FDG‐PET ROI SUVRs derived from meta‐analytically regions of AD‐associated hypometabolism located within the angular gyrus, posterior cingulate and inferior temporal lobe were downloaded from the ADNI database. The MRI and FDG‐PET ROI segmentation has been described in detail previously (Fischl et al, 2002; Landau et al, 2011). Hippocampal volumes were further adjusted for intracranial volume using linear regression, following previous recommendations (Jack et al, 2017).
Ethical considerations
The study was approved by the institutional review board (IRB) of all participating centres in DIAN and ADNI, as well as our local IRB (LMU). All study participants (or their relatives) provided written informed consent.
CSF progranulin (PGRN) measurement
CSF PGRN was measured by an ELISA protocol previously established by our group using the MSD Platform (Capell et al, 2011). The ELISA consists of a Streptavidin‐coated 96‐well plates (MSD Streptavidin Gold Plates, cat. no. L15SA); a biotinylated polyclonal goat anti‐human PGRN capture antibody (BAF2420, R&D Systems; 0.2 μg/ml, 25 μl/well); a monoclonal mouse anti‐human PGRN detection antibody (MAB2420, R&D Systems; 0.25 μg/ml, 25 μl/well); and a SULFO‐TAG‐labelled goat polyclonal anti‐mouse IgG secondary antibody (MSD, cat. no. R32AC; 0.5 μg/ml, 25 μl/well). All antibodies were diluted in 0.5% bovine serum albumin (BSA) and 0.05% Tween‐20 in PBS buffer (pH = 7.4). Recombinant human PGRN protein (His Tag PGRN—Sino Biological, cat. no. 10826‐H08H) was used as a standard (15.6–2,000 pg/ml). In brief, Streptavidin‐coated 96‐well plates were blocked overnight at 4°C in blocking buffer [0.5% BSA and 0.05% Tween‐20 in PBS (pH = 7.4)]. The plates were next incubated with the capture antibody for 1 h at room temperature (RT). They were subsequently washed four times with washing buffer (0.05% Tween‐20 in PBS) and incubated for 2 h at RT with the CSF and the internal standard (IS) samples diluted 1:2.5 in assay buffer [0.25% BSA and 0.05% Tween‐20 in PBS (pH = 7.4)] or the recombinant human PGRN protein for the standard curve also diluted in assay buffer. CSF samples were randomly distributed across plates and measured in triplicates (DIAN samples) or in duplicates (ADNI samples). The operators were blinded to the clinical information. Plates were again washed four times with washing buffer before incubation for 1 h at RT with the detector antibody. After four additional washing steps, plates were incubated with the secondary antibody for 1 h in the dark. Last, plates were washed four times with washing buffer followed by two washing steps in PBS. The electrochemical signal was developed by adding MSD read buffer T (cat. no. R‐92TC) and the light emission measured using the MESO QuickPlex SQ 120. The ELISA showed good accurate results in the spike recovery (98%) experiments and minimal measurement variation (CV = 4%) between freeze–thaw cycles (nine cycles).
The measurement of all the DIAN samples was performed in a single day (22/11/2016), and three CSF samples (internal standards, IS) were loaded in all plates. All IS used in this study consisted of pooled CSFs from diagnostic clinical routine leftovers from the Ludwig‐Maximilians‐Universität München (LMU) Department of Neurology (Munich, Germany). All patients gave their written consent, and the study was approved by the local IRB. The interplate coefficient of variation (CV) for each of the IS was 3.6, 5.4 and 6.7%. The mean intraplate CV was 2.1%, and all replicate measures had a CV ≤ 15%. The raw values are provided as pg/ml.
The measurements of the ADNI samples were performed on four different days (between the 27/11/2017 and 06/12/2017). Four CSF‐IS samples were loaded in all plates. The interplate CV for each of the IS was 4.3, 3.8, 3.4 and 5.4%. The mean intraplate CV was 2.2%, and all replicate measures had a CV ≤ 15%. Given that the ADNI measurements were done in several days, we corrected the raw measurements based on values of the four IS that were loaded on all plates. The concentration of each IS in an individual plate (plate x) was expressed as a percentage of the mean concentration across all plates as follows:
a1 (%) in plate x = [(concentration of IS1 in plate x)/(mean concentration of IS1 in all plates)] × 100
a2 (%) in plate x = [(concentration of IS2 in plate x)/(mean concentration of IS2 in all plates)] × 100
a3 (%) in plate x = [(concentration of IS3 in plate x)/(mean concentration of IS3 in all plates)] × 100
a4 (%) in plate x = [(concentration of IS4 in plate x)/(mean concentration of IS4 in all plates)] × 100
The mean of the percentages (Ax) for all the IS (a1, a2, a3, a4) in plate x was calculated, and the following correction factor was computed for each individual plate:
The raw values were multiplied by the correction factor of the corresponding plate; the corrected values are provided as the variable “MSD_PGRNCORRECTED” in the ADNI database. Due to the low interplate CV, the corrected and raw PGRN values in the ADNI sample are highly correlated (Spearman ρ = 0.985; P < 0.0001).
The mean CSF PGRN level of our MSD‐based assay (1,007 pg/ml) was similar to that published with other assays (Huchtemann et al, 2015; Zhou et al, 2015a; Berghoff et al, 2016; Meeter et al, 2016; Kimura et al, 2017; Schreiber et al, 2018), albeit lower than those measured by the more widely used commercial assay from Adipogen (Ghidoni et al, 2008; De Riz et al, 2010; Vercellino et al, 2011; Nicholson et al, 2014; Morenas‐Rodríguez et al, 2015; Feneberg et al, 2016; Molgaard et al, 2016; Willemse et al, 2016; Wilke et al, 2017). We therefore compared our MSD‐based ELISA with that from Adipogen (cat. no. AG‐45A‐0018YEK‐KI01, Seoul, Korea). We prepared 39 different CSF pool samples from leftovers of the LMU Department of Neurology, as described above. We measured these CSF samples simultaneously in both the MSD‐based and the Adipogen assays, following the manufacturer's instructors, and each sample in duplicate. The standard curves for each of the assays are shown in Appendix Fig S1A and B. As expected, the mean levels of CSF PGRN were lower in the MSD‐based assay (mean = 1430 pg/ml, SD = 220) compared to the Adipogen assay (mean = 4,400pg/ml, SD = 900), but they were highly correlated between them (Spearman ρ = 0.74; P < 0.0001; Appendix Fig S1C).
CSF sTREM2 measurement
CSF sTREM2 measurements from the DIAN study were previously reported (Suárez‐Calvet et al, 2016a,b) and are expressed relative to an IS. Measurements of the ADNI samples were done with the same ELISA protocol with minor changes. Briefly, the assay is based on the MSD platform and it is comprehensively described in previous publications (Kleinberger et al, 2014; Suárez‐Calvet et al, 2016a,b). The assay consists of a Streptavidin‐coated 96‐well plates (MSD Streptavidin Gold Plates, cat. no. L15SA); a biotinylated polyclonal goat IgG anti‐human TREM2 antibody (R&D Systems, cat. no. BAF1828; 0.25 μg/ml, 25 μl/well) as capture antibody, which is raised against amino acids 19‐174 of human TREM2; a monoclonal mouse IgG anti‐human TREM2 antibody (Santa Cruz Biotechnology, B‐3, cat. no. sc373828; 1 μg/ml, 50 μl/well) as a detection antibody, which is raised against amino acids 1–160 of human TREM2; and a SULFO‐TAG‐labelled goat polyclonal anti‐mouse IgG secondary antibody (MSD, cat. no. R32AC; 0.5 μg/ml, 25 μl/well). All antibodies were diluted in 1% BSA and 0.05% Tween‐20 in PBS buffer (pH = 7.4). Recombinant human TREM2 protein (Hölzel Diagnostika, cat. no. 11084‐H08H), corresponding to the extracellular domain of human TREM2 (amino acids 19–174), was used as a standard (62.5–8,000 pg/ml). In brief, Streptavidin‐coated 96‐well plates were blocked overnight at 4°C in blocking buffer [3% bovine serum albumin (BSA) and 0.05% Tween‐20 in PBS (pH = 7.4); 300 μl/well]. The plates were next incubated with the capture antibody for 1 h at RT. They were subsequently washed four times with washing buffer (200 μl/well; 0.05% Tween‐20 in PBS). Thereafter, the recombinant human TREM2 protein (standard curve), the blanks, and the CSF and the internal standard (IS) samples (duplicates; dilution factor: 4) were diluted in assay buffer [0.25% BSA and 0.05% Tween‐20 in PBS (pH = 7.4)] supplemented with protease inhibitors (Sigma; Cat. # P8340) and incubated (50 μl/well) for 2 h at RT. This dilution was previously selected because it showed the best recovery and linearity performance (Kleinberger et al, 2014). Plates were again washed four times with washing buffer before incubation for 1 h at RT with detection antibody. After four additional washing steps, plates were incubated with SULFO‐tag conjugated secondary antibody for 1 h in the dark at RT. Last, plates were washed four times with washing buffer followed by two washing steps in PBS. The electrochemical signal was developed by adding 150 μl/well MSD read buffer T (cat. no. R‐92TC) and the light emission measured using the MESO QuickPlex SQ 120. Raw values are provided as pg/ml.
All CSF samples were distributed randomly across plates, measured in duplicate and simultaneously to CSF PGRN (i.e. between 27/11/2017 and 06/12/2017). The mean intraplate CV was 3.1%, and all duplicate measures had a CV < 15%. Alike the CSF PGRN ELISA, four CSF IS samples were loaded in all plates. The interplate CV for each of the IS was 11.4, 12.2, 10.5 and 7.1%. We corrected the raw measurements based on values of the four IS that were loaded on all plates in a similar manner as in CSF PGRN measurements. Consequently, the corrected values were used and are available in the ADNI database as variables “MSD_sTREM2CORRECTED”.
Statistical analysis
In both DIAN and ADNI samples, we only included in our study participants that had the following data available: age, gender and the three AD CSF core biomarkers (Aβ1–42, T‐tau, P‐tau181P). Within each of the samples, we determined the CSF PGRN outliers, as defined as values differing 3 standard deviations from the mean (3 outliers in the DIAN sample and 11 in the ADNI sample). In order to rule out that our results are not driven by extreme values, all the analysis described in the main text are performed without these outliers. Nevertheless, including them did not affect the main results (as shown in the main text and in Appendix Tables S1, S3, S5, S6 and S8). In the DIAN sample, CSF PGRN followed a normal distribution as assessed by visual inspection of histogram and after testing by Kolmogorov–Smirnov test (P = 0.062). In contrast, CSF PGRN in ADNI did not follow a normal distribution (Kolmogorov–Smirnov test, P = 0.0001). After a log10 transformation, it followed a normal distribution (Kolmogorov–Smirnov test, P = 0.200). All the statistical analyses in the ADNI sample were hence performed with the log10‐transformed values.
The data from the DIAN sample (Data Freeze 9) were studied in a similar approach to that we previously applied (Suárez‐Calvet et al, 2016a,b). In brief, comparisons of demographic, clinical and biochemical data between NC and MC were performed by Pearson's chi‐square tests or t‐tests, as appropriate. A linear regression analysis was used to test the effect of the mutation status, age, gender and APOE ε4 status in the levels of CSF PGRN (Appendix Table S1). In additional linear effects models, we compared the levels of CSF PGRN between carriers of the three mutated genes (i.e. PSEN1, PSEN2 and APP).
In order to test how CSF PGRN levels change as a function of EYO (as shown in Table 2 and Fig 2), we used a similar approach to that previously published (Bateman et al, 2012; Fagan et al, 2014; Suárez‐Calvet et al, 2016a,b). We constructed a linear mixed model with mutation status, EYO (and its interaction with mutation status) and gender as fixed effects and family affiliation as random effect. Next, we performed a polynomial regression analysis including EYO quadratic (EYO2) and cubic (EYO3) terms and their interactions with mutation status. We determined the model that best fitted the data by forward selection of the predictors, and the final model was chosen based on the Akaike information criterion (AIC; a lower AIC indicating a better fit; see Appendix Table S2). For CSF PGRN, the linear model (first‐order EYO) showed the best fit. In previous studies, we used linear mixed‐effects models with family membership as a random effect to adjust for differences in biomarker levels between families. Here, we found no significant differences in CSF PGRN levels between families (F 93,114 = 1.04, P = 0.426) and we therefore used simple linear regression in all the following analysis.
We computed the estimated levels of CSF PGRN at each 5‐year interval of EYO based on the established regression models, and we determined the group differences between MC and NC for each 5‐year EYO interval by t‐tests, as done in previous DIAN studies (Bateman et al, 2012; Fagan et al, 2014; Suárez‐Calvet et al, 2016a,b). Comparisons between MC and NC were restricted at EYO ranging from −25 to +10, due to the low number of subjects at more extreme values of EYO.
In order to represent the progression of CSF PGRN throughout the evolution of the disease and compare it with other biomarkers and cognitive measures, we followed the approach of previous DIAN studies (Bateman et al, 2012; Suárez‐Calvet et al, 2016a,b); that is, the predicted difference between MC and NC at each EYO generated by the same final linear mixed‐effects model described above was divided by the standard deviation of clinical, cognitive, imaging and biochemical measures of the pooled sample, so that all variables were in a standardized and comparable scale (Fig 2B, Appendix Table S2). These figures were built with SAS software (SAS Institute).
We compared CSF PGRN levels between NC and MC in different clinical stages (determined by global CDR) in an analysis of covariance (ANCOVA) controlling for age, gender, APOE ε4 and education, followed by post hoc least significant difference (LSD) for pair‐wise comparisons. Individuals falling into CDR = 1 to CDR = 3 were grouped together due to the low number of subjects in these stages.
In ADNI, demographic, clinical and biochemical data group comparisons were performed by one‐way ANOVA or Pearson's chi‐square tests, as appropriate. To test whether CSF PGRN changed across the Alzheimer's continuum, we applied an ANCOVA including the biomarker‐defined stages of AD, gender and APOE ε4 status as fixed effects and age as covariate, followed by Bonferroni corrected pair‐wise post hoc comparisons. An additional analysis was performed adding the GRN rs5848 genotype as a covariate. A similar approach was used for comparisons between biomarker categories shown in Fig EV1A.
To study the associations between CSF PGRN and cognitive and functional scores, we applied three linear regression models. Model 1 was unadjusted, Model 2 included age, gender, APOE ε4 and education as covariates, and Model 3 included the former covariates and also CSF Aβ1–42 and CSF T‐tau.
The association between CSF PGRN and temporo‐parietal FDG‐PET and total hippocampal volume was tested with a linear regression adjusted for age, gender, APOE ε4 and education. Analyses including hippocampal volume were adjusted for intracranial volume.
The diagnostic value of CSF PGRN to discriminate AD (ADAD or late‐onset AD) from controls was tested with a receiver operating characteristic (ROC) analysis. We computed areas under the curve (AUC), and we tested whether they were significantly different from the null hypothesis that the AUC equals 0.50, which corresponds to a random test.
Finally, the association between CSF PGRN and CSF sTREM2 and the CSF core biomarkers for AD (T‐tau, P‐tau181P, Aβ1–42) was studied with a linear model adjusted for age, gender and APOE ε4 status. The analysis was performed stratifying for the mutation status (DIAN) or classifying the subjects in the healthy controls, Alzheimer's continuum or SNAP categories (ADNI). The standardized regression coefficients (β) are reported. In order to rule out that the associations were driven by extreme values, we performed the analysis both including and excluding biomarker outliers (defined as AD CSF core biomarkers 3 standard deviations below or above the group mean) and the analysis yielded similar results (Appendix Table S8).
Statistical analysis was performed in SPSS IBM, version 20.0, statistical software and the free statistical software R (http://www.r-project.org/). Figures were built using GraphPad Prism or R. All tests were two‐tailed, with a significance level of α = 0.05.
Author contributions
MS‐C, AC, EM‐R, KF, GK, EE, YD and LP performed the experiments. MS‐C, AC, MAAC, EM‐R, NF, YD, LP, CC, CMK, ME and CH analysed and interpreted the data. YD, LP, CMK and CC involved in extracting the genetic data. KP, RJB, AMF, JCM, JL, AD, MJ, CLM, MNR, JMR, LMS, JQT and MW contributed with patient samples and/or data. MS‐C, ME and CH designed the study and wrote the manuscript. All authors critically reviewed and approved the final manuscript.
Conflict of interest
C.H. collaborates with DENALI Therapeutics. The remaining authors declare that they have no conflict of interest.
The paper explained.
Problem
Alzheimer's disease (AD) is the most frequent neurodegenerative disorder. Besides β‐amyloid and tau deposits, all AD brains invariantly show neuroinflammatory symptoms associated with microgliosis. Progranulin (PGRN), a secreted protein whose loss of function is associated with frontotemporal lobar degeneration and neuronal ceroid lipofuscinosis, is also genetically involved in AD. In the brain, PGRN is predominantly expressed in microglia. In this study, we investigated PGRN concentration in the cerebrospinal fluid (CSF) of two of the largest and best characterized AD patient cohorts, namely the Dominant Inherited Alzheimer's Disease Network (DIAN), which includes families with autosomal dominant AD (ADAD), and the Alzheimer's Disease Neuroimaging Initiative (ADNI), which studies the evolution of late‐onset AD.
Results
In carriers of ADAD causing dominant mutations (DIAN), we found that CSF PGRN increased 10 years before the expected symptom onset. In late‐onset AD (ADNI), higher CSF PGRN was associated with more advanced disease stages as well as cognitive impairment. CSF PGRN was associated with levels of proteolytically generated soluble TREM2 (sTREM2), a protein described to be a central regulator of microglial function and known to increase 5 years before the expected symptom onset. Importantly, the association between CSF sTREM2 and CSF PGRN was only observed when there was underlying pathology, but not in controls.
Impact
CSF PGRN together with CSF sTREM2 may serve as a microglia activity marker in AD and could be used to prove target engagement in clinical trials aiming to modulate microglial activity.
For more information
All data of the ADNI study (including the CSF PGRN and sTREM2 reported in this study) are publicly available in http://adni.loni.usc.edu/.
Supporting information
Appendix
Expanded View Figures PDF
Review Process File
Acknowledgements
We would like to thank Tammie Benzinger, Krista Moulder, Peter Wang, Chengjie Xiong, Michael Donohue, Thomas Montine, Jihn K. Hsiao, Jacob Alexander and all the researchers in the DIAN and in the ADNI initiatives. We also thank Brigitte Nuscher and Nicole Exner for technical assistance and José Luís Molinuevo and Nicholas Ashton for critically reading the manuscript and helpful discussion. This work was supported by the Deutsche Forschungsgemeinschaft (DFG) within the framework of the Munich Cluster for Systems Neurology (EXC 1010 SyNergy), a DFG funded Koselleck Project (HA1737/16‐1 to C.H.) and the FTD Biomarker Award. Data collection and sharing for this project were supported by The Dominantly Inherited Alzheimer's Network (DIAN, UF1AG032438) funded by the National Institute on Aging (NIA), the German Center for Neurodegenerative Diseases (DZNE), Raul Carrea Institute for Neurological Research (FLENI), Partial support by the Research and Development Grants for Dementia from Japan Agency for Medical Research and Development, AMED, and the Korea Health Technology R&D Project through the Korea Health Industry Development Institute (KHIDI). This manuscript has been reviewed by DIAN study investigators for scientific content and consistency of data interpretation with previous DIAN study publications. We acknowledge the altruism of the participants and their families and contributions of the DIAN research and support staff at each of the participating sites for their contributions to this study. This work was also supported by grants from the HHS | NIH | National Institute on Aging (NIA) (R01AG044546, RF1AG053303, R01AG058501 and U01AG058922). YD is supported by an HHS | NIH | National Institute of Mental Health (NIMH) institutional training grant (T32MH014877). LP was supported by a grant from the Fondazione Italiana Sclerosi Multipla (FISM) (FISM 2017/R/20). EM was supported by a grant from the Ad‐Hoc Committee for Young Neurologist (Spanish Society of Neurology) and Health Institute Carlos III (funding programme for the mobility of the researchers).
EMBO Mol Med (2018) 10:e9712
Contributor Information
Marc Suárez‐Calvet, Email: msuarez@barcelonabeta.org.
Christian Haass, Email: christian.haass@mail03.med.uni-muenchen.de.
References
- Ahmed Z, Sheng H, Xu YF, Lin WL, Innes AE, Gass J, Yu X, Wuertzer CA, Hou H, Chiba S et al (2010) Accelerated lipofuscinosis and ubiquitination in granulin knockout mice suggest a role for progranulin in successful aging. Am J Pathol 177: 311–324 [DOI] [PMC free article] [PubMed] [Google Scholar]
- Albert MS, DeKosky ST, Dickson D, Dubois B, Feldman HH, Fox NC, Gamst A, Holtzman DM, Jagust WJ, Petersen RC et al (2011) The diagnosis of mild cognitive impairment due to Alzheimer's disease: recommendations from the National Institute on Aging‐Alzheimer's Association workgroups on diagnostic guidelines for Alzheimer's disease. Alzheimers Dement 7: 270–279 [DOI] [PMC free article] [PubMed] [Google Scholar]
- Baker M, Mackenzie IR, Pickering‐Brown SM, Gass J, Rademakers R, Lindholm C, Snowden J, Adamson J, Sadovnick AD, Rollinson S et al (2006) Mutations in progranulin cause tau‐negative frontotemporal dementia linked to chromosome 17. Nature 442: 916–919 [DOI] [PubMed] [Google Scholar]
- Bateman A, Belcourt D, Bennett H, Lazure C, Solomon S (1990) Granulins, a novel class of peptide from leukocytes. Biochem Biophys Res Commun 173: 1161–1168 [DOI] [PubMed] [Google Scholar]
- Bateman RJ, Xiong C, Benzinger TL, Fagan AM, Goate A, Fox NC, Marcus DS, Cairns NJ, Xie X, Blazey TM et al (2012) Clinical and biomarker changes in dominantly inherited Alzheimer's disease. N Engl J Med 367: 795–804 [DOI] [PMC free article] [PubMed] [Google Scholar]
- Berghoff M, Hochberg A, Schmid A, Schlegel J, Karrasch T, Kaps M, Schäffler A (2016) Quantification and regulation of the adipokines resistin and progranulin in human cerebrospinal fluid. Eur J Clin Invest 46: 15–26 [DOI] [PubMed] [Google Scholar]
- Bhandari V, Palfree RG, Bateman A (1992) Isolation and sequence of the granulin precursor cDNA from human bone marrow reveals tandem cysteine‐rich granulin domains. Proc Natl Acad Sci USA 89: 1715–1719 [DOI] [PMC free article] [PubMed] [Google Scholar]
- Brouwers N, Sleegers K, Engelborghs S, Maurer‐Stroh S, Gijselinck I, van der Zee J, Pickut BA, Van den Broeck M, Mattheijssens M, Peeters K et al (2008) Genetic variability in progranulin contributes to risk for clinically diagnosed Alzheimer disease. Neurology 71: 656–664 [DOI] [PubMed] [Google Scholar]
- Capell A, Liebscher S, Fellerer K, Brouwers N, Willem M, Lammich S, Gijselinck I, Bittner T, Carlson AM, Sasse F et al (2011) Rescue of progranulin deficiency associated with frontotemporal lobar degeneration by alkalizing reagents and inhibition of vacuolar ATPase. J Neurosci 31: 1885–1894 [DOI] [PMC free article] [PubMed] [Google Scholar]
- Caroli A, Prestia A, Galluzzi S, Ferrari C, van der Flier WM, Ossenkoppele R, Van Berckel B, Barkhof F, Teunissen C, Wall AE et al (2015) Mild cognitive impairment with suspected nonamyloid pathology (SNAP): prediction of progression. Neurology 84: 508–515 [DOI] [PMC free article] [PubMed] [Google Scholar]
- Chang MC, Srinivasan K, Friedman BA, Suto E, Modrusan Z, Lee WP, Kaminker JS, Hansen DV, Sheng M (2017) Progranulin deficiency causes impairment of autophagy and TDP‐43 accumulation. J Exp Med 214: 2611–2628 [DOI] [PMC free article] [PubMed] [Google Scholar]
- Colonna M, Wang Y (2016) TREM2 variants: new keys to decipher Alzheimer disease pathogenesis. Nat Rev Neurosci 17: 201–207 [DOI] [PubMed] [Google Scholar]
- Crane PK, Carle A, Gibbons LE, Insel P, Mackin RS, Gross A, Jones RN, Mukherjee S, Curtis SM, Harvey D et al (2012) Development and assessment of a composite score for memory in the Alzheimer's Disease Neuroimaging Initiative (ADNI). Brain Imaging Behav 6: 502–516 [DOI] [PMC free article] [PubMed] [Google Scholar]
- Cruchaga C, Chakraverty S, Mayo K, Vallania FL, Mitra RD, Faber K, Williamson J, Bird T, Diaz‐Arrastia R, Foroud TM et al (2012) Rare variants in APP, PSEN1 and PSEN2 increase risk for AD in late‐onset Alzheimer's disease families. PLoS ONE 7: e31039 [DOI] [PMC free article] [PubMed] [Google Scholar]
- Cruts M, Gijselinck I, van der Zee J, Engelborghs S, Wils H, Pirici D, Rademakers R, Vandenberghe R, Dermaut B, Martin JJ et al (2006) Null mutations in progranulin cause ubiquitin‐positive frontotemporal dementia linked to chromosome 17q21. Nature 442: 920–924 [DOI] [PubMed] [Google Scholar]
- Dani M, Brooks DJ, Edison P (2017) Suspected non‐Alzheimer's pathology – Is it non‐Alzheimer's or non‐amyloid? Ageing Res Rev 36: 20–31 [DOI] [PubMed] [Google Scholar]
- Daniel R, He Z, Carmichael KP, Halper J, Bateman A (2000) Cellular localization of gene expression for progranulin. J Histochem Cytochem 48: 999–1009 [DOI] [PubMed] [Google Scholar]
- De Riz M, Galimberti D, Fenoglio C, Piccio LM, Scalabrini D, Venturelli E, Pietroboni A, Piola M, Naismith RT, Parks BJ et al (2010) Cerebrospinal fluid progranulin levels in patients with different multiple sclerosis subtypes. Neurosci Lett 469: 234–236 [DOI] [PMC free article] [PubMed] [Google Scholar]
- Fagan AM, Xiong C, Jasielec MS, Bateman RJ, Goate AM, Benzinger TL, Ghetti B, Martins RN, Masters CL, Mayeux R et al (2014) Longitudinal change in CSF biomarkers in autosomal‐dominant Alzheimer's disease. Sci Transl Med 6: 226ra30 [DOI] [PMC free article] [PubMed] [Google Scholar]
- Feneberg E, Steinacker P, Volk AE, Weishaupt JH, Wollmer MA, Boxer A, Tumani H, Ludolph AC, Otto M (2016) Progranulin as a candidate biomarker for therapeutic trial in patients with ALS and FTLD. J Neural Transm 123: 289–296 [DOI] [PubMed] [Google Scholar]
- Fenoglio C, Galimberti D, Cortini F, Kauwe JS, Cruchaga C, Venturelli E, Villa C, Serpente M, Scalabrini D, Mayo K et al (2009) Rs5848 variant influences GRN mRNA levels in brain and peripheral mononuclear cells in patients with Alzheimer's disease. J Alzheimer's Dis 18: 603–612 [DOI] [PMC free article] [PubMed] [Google Scholar]
- Filiano AJ, Martens LH, Young AH, Warmus BA, Zhou P, Diaz‐Ramirez G, Jiao J, Zhang Z, Huang EJ, Gao FB et al (2013) Dissociation of frontotemporal dementia‐related deficits and neuroinflammation in progranulin haploinsufficient mice. J Neurosci 33: 5352–5361 [DOI] [PMC free article] [PubMed] [Google Scholar]
- Finch N, Baker M, Crook R, Swanson K, Kuntz K, Surtees R, Bisceglio G, Rovelet‐Lecrux A, Boeve B, Petersen RC et al (2009) Plasma progranulin levels predict progranulin mutation status in frontotemporal dementia patients and asymptomatic family members. Brain 132: 583–591 [DOI] [PMC free article] [PubMed] [Google Scholar]
- Fischl B, Salat DH, Busa E, Albert M, Dieterich M, Haselgrove C, van der Kouwe A, Killiany R, Kennedy D, Klaveness S et al (2002) Whole brain segmentation: automated labeling of neuroanatomical structures in the human brain. Neuron 33: 341–355 [DOI] [PubMed] [Google Scholar]
- Ghidoni R, Benussi L, Glionna M, Franzoni M, Binetti G (2008) Low plasma progranulin levels predict progranulin mutations in frontotemporal lobar degeneration. Neurology 71: 1235–1239 [DOI] [PubMed] [Google Scholar]
- Gibbons LE, Carle AC, Mackin RS, Harvey D, Mukherjee S, Insel P, Curtis SM, Mungas D, Crane PK, Alzheimer's Disease Neuroimaging Initiative (2012) A composite score for executive functioning, validated in Alzheimer's Disease Neuroimaging Initiative (ADNI) participants with baseline mild cognitive impairment. Brain Imaging Behav 6: 517–527 [DOI] [PMC free article] [PubMed] [Google Scholar]
- Gispert JD, Suárez‐Calvet M, Monté GC, Tucholka A, Falcon C, Rojas S, Rami L, Sánchez‐Valle R, Lladó A, Kleinberger G et al (2016) Cerebrospinal fluid sTREM2 levels are associated with gray matter volume increases and reduced diffusivity in early Alzheimer's disease. Alzheimer's Dement 12: 1259–1272 [DOI] [PubMed] [Google Scholar]
- Götzl JK, Mori K, Damme M, Fellerer K, Tahirovic S, Kleinberger G, Janssens J, van der Zee J, Lang CM, Kremmer E et al (2014) Common pathobiochemical hallmarks of progranulin‐associated frontotemporal lobar degeneration and neuronal ceroid lipofuscinosis. Acta Neuropathol 127: 845–860 [DOI] [PubMed] [Google Scholar]
- Götzl JK, Lang CM, Haass C, Capell A (2016) Impaired protein degradation in FTLD and related disorders. Ageing Res Rev 32: 122–139 [DOI] [PubMed] [Google Scholar]
- Habeck C, Risacher S, Lee GJ, Glymour MM, Mormino E, Mukherjee S, Kim S, Nho K, DeCarli C, Saykin AJ et al (2012) Relationship between baseline brain metabolism measured using [18F]FDG PET and memory and executive function in prodromal and early Alzheimer's disease. Brain Imaging Behav 6: 568–583 [DOI] [PMC free article] [PubMed] [Google Scholar]
- Hansson O, Seibyl J, Stomrud E, Zetterberg H, Trojanowski JQ, Bittner T, Lifke V, Corradini V, Eichenlaub U, Batrla R et al (2018) CSF biomarkers of Alzheimer's disease concord with amyloid‐β PET and predict clinical progression: a study of fully automated immunoassays in BioFINDER and ADNI cohorts. Alzheimer's Dement 14: 1470–1481 [DOI] [PMC free article] [PubMed] [Google Scholar]
- Heneka MT, Carson MJ, El Khoury J, Landreth GE, Brosseron F, Feinstein DL, Jacobs AH, Wyss‐Coray T, Vitorica J, Ransohoff RM et al (2015) Neuroinflammation in Alzheimer's disease. Lancet Neurol 14: 388–405 [DOI] [PMC free article] [PubMed] [Google Scholar]
- Henjum K, Almdahl IS, Årskog V, Minthon L, Hansson O, Fladby T, Nilsson LN (2016) Cerebrospinal fluid soluble TREM2 in aging and Alzheimer's disease. Alzheimers Res Ther 8: 17 [DOI] [PMC free article] [PubMed] [Google Scholar]
- Heslegrave A, Heywood W, Paterson R, Magdalinou N, Svensson J, Johansson P, Öhrfelt A, Blennow K, Hardy J, Schott J et al (2016) Increased cerebrospinal fluid soluble TREM2 concentration in Alzheimer's disease. Mol Neurodegener 11: 3 [DOI] [PMC free article] [PubMed] [Google Scholar]
- Holler CJ, Taylor G, Deng Q, Kukar T (2017) Intracellular proteolysis of progranulin generates stable, lysosomal granulins that are haploinsufficient in patients with frontotemporal dementia caused by GRN mutations. eNeuro 4: ENEURO.0100‐17.2017 [DOI] [PMC free article] [PubMed] [Google Scholar]
- Hosokawa M, Arai T, Masuda‐Suzukake M, Kondo H, Matsuwaki T, Nishihara M, Hasegawa M, Akiyama H (2015) Progranulin reduction is associated with increased Tau phosphorylation in P301L Tau transgenic mice. J Neuropathol Exp Neurol 74: 158–165 [DOI] [PubMed] [Google Scholar]
- Hosokawa M, Tanaka Y, Arai T, Kondo H, Akiyama H, Hasegawa M (2018) Progranulin haploinsufficiency reduces amyloid beta deposition in Alzheimer's disease model mice. Exp Anim 67: 63–70 [DOI] [PMC free article] [PubMed] [Google Scholar]
- Hu F, Padukkavidana T, Vægter CB, Brady OA, Zheng Y, Mackenzie IR, Feldman HH, Nykjaer A, Strittmatter SM (2010) Sortilin‐mediated endocytosis determines levels of the frontotemporal dementia protein, progranulin. Neuron 68: 654–667 [DOI] [PMC free article] [PubMed] [Google Scholar]
- Huchtemann T, Körtvélyessy P, Feistner H, Heinze HJ, Bittner D (2015) Progranulin levels in status epilepticus as a marker of neuronal recovery and neuroprotection. Epilepsy Behav 49: 170–172 [DOI] [PubMed] [Google Scholar]
- Jack CR, Knopman DS, Weigand SD, Wiste HJ, Vemuri P, Lowe V, Kantarci K, Gunter JL, Senjem ML, Ivnik RJ et al (2012) An operational approach to National Institute on Aging‐Alzheimer's Association criteria for preclinical Alzheimer disease. Ann Neurol 71: 765–775 [DOI] [PMC free article] [PubMed] [Google Scholar]
- Jack CR, Bennett DA, Blennow K, Carrillo MC, Feldman HH, Frisoni GB, Hampel H, Jagust WJ, Johnson KA, Knopman DS et al (2016a) A/T/N: an unbiased descriptive classification scheme for Alzheimer disease biomarkers. Neurology 87: 539–547 [DOI] [PMC free article] [PubMed] [Google Scholar]
- Jack CR, Knopman DS, Chételat G, Dickson D, Fagan AM, Frisoni GB, Jagust W, Mormino EC, Petersen RC, Sperling RA et al (2016b) Suspected non‐Alzheimer disease pathophysiology — concept and controversy. Nat Rev Neurol 12: 117–124 [DOI] [PMC free article] [PubMed] [Google Scholar]
- Jack CR, Wiste HJ, Weigand SD, Therneau TM, Lowe VJ, Knopman DS, Gunter JL, Senjem ML, Jones DT, Kantarci K et al (2017) Defining imaging biomarker cut points for brain aging and Alzheimer's disease. Alzheimer's Dement 13: 205–216 [DOI] [PMC free article] [PubMed] [Google Scholar]
- Jack CR, Bennett DA, Blennow K, Carrillo MC, Dunn B, Haeberlein SB, Holtzman DM, Jagust W, Jessen F, Karlawish J et al (2018) NIA‐AA research framework: toward a biological definition of Alzheimer's disease. Alzheimer's Dement 14: 535–562 [DOI] [PMC free article] [PubMed] [Google Scholar]
- Keren‐Shaul H, Spinrad A, Weiner A, Matcovitch‐Natan O, Dvir‐Szternfeld R, Ulland TK, David E, Baruch K, Lara‐Astaiso D, Toth B et al (2017) A unique microglia type associated with restricting development of Alzheimer's disease. Cell 169: 1276–1290.e17 [DOI] [PubMed] [Google Scholar]
- Kimura A, Takemura M, Saito K, Serrero G, Yoshikura N, Hayashi Y, Inuzuka T (2017) Increased cerebrospinal fluid progranulin correlates with interleukin‐6 in the acute phase of neuromyelitis optica spectrum disorder. J Neuroimmunol 305: 175–181 [DOI] [PubMed] [Google Scholar]
- Kleinberger G, Capell A, Haass C, Van Broeckhoven C (2013) Mechanisms of granulin deficiency: lessons from cellular and animal models. Mol Neurobiol 47: 337–360 [DOI] [PMC free article] [PubMed] [Google Scholar]
- Kleinberger G, Yamanishi Y, Suárez‐Calvet M, Czirr E, Lohmann E, Cuyvers E, Struyfs H, Pettkus N, Wenninger‐Weinzierl A, Mazaheri F et al (2014) TREM2 mutations implicated in neurodegeneration impair cell surface transport and phagocytosis. Sci Transl Med 6: 243ra86 [DOI] [PubMed] [Google Scholar]
- Kleinberger G, Brendel M, Mracsko E, Wefers B, Groeneweg L, Xiang X, Focke C, Deußing M, Suárez‐Calvet M, Mazaheri F et al (2017) The FTD‐like syndrome causing TREM2 T66M mutation impairs microglia function, brain perfusion, and glucose metabolism. EMBO J 36: 1837–1853 [DOI] [PMC free article] [PubMed] [Google Scholar]
- Körtvélyessy P, Gukasjan A, Sweeney‐Reed CM, Heinze HJ, Thurner L, Bittner DM (2015) Progranulin and amyloid‐β levels: relationship to neuropsychology in frontotemporal and Alzheimer's disease. J Alzheimer's Dis 46: 375–380 [DOI] [PubMed] [Google Scholar]
- Krasemann S, Madore C, Cialic R, Baufeld C, Fatimy RE, Beckers L, Loughlin EO, Xu Y, Greco DJ, Smith ST et al (2017) The TREM2‐APOE pathway drives the transcriptional phenotype of dysfunctional microglia in neurodegenerative diseases. Immunity 47: 566–581.e9 [DOI] [PMC free article] [PubMed] [Google Scholar]
- Landau SM, Harvey D, Madison CM, Koeppe RA, Reiman EM, Foster NL, Weiner MW, Jagust WJ (2011) Associations between cognitive, functional, and FDG‐PET measures of decline in AD and MCI. Neurobiol Aging 32: 1207–1218 [DOI] [PMC free article] [PubMed] [Google Scholar]
- Lee MJ, Chen TF, Cheng TW, Chiu MJ (2011) rs5848 variant of progranulin gene is a risk of Alzheimer's disease in the Taiwanese population. Neurodegener Dis 8: 216–220 [DOI] [PubMed] [Google Scholar]
- Lui H, Zhang J, Makinson SR, Cahill MK, Kelley KW, Huang HY, Shang Y, Oldham MC, Martens LH, Gao F et al (2016) Progranulin deficiency promotes circuit‐specific synaptic pruning by microglia via complement activation. Cell 165: 921–935 [DOI] [PMC free article] [PubMed] [Google Scholar]
- Lyman M, Lloyd DG, Ji X, Vizcaychipi MP, Ma D (2014) Neuroinflammation: the role and consequences. Neurosci Res 79: 1–12 [DOI] [PubMed] [Google Scholar]
- Martens LH, Zhang J, Barmada SJ, Zhou P, Kamiya S, Sun B, Min SW, Gan L, Finkbeiner S, Huang EJ et al (2012) Progranulin deficiency promotes neuroinflammation and neuron loss following toxin‐induced injury. J Clin Invest 122: 3955–3959 [DOI] [PMC free article] [PubMed] [Google Scholar]
- Mateo I, González‐Aramburu I, Pozueta A, Vázquez‐Higuera JL, Rodríguez‐Rodríguez E, Sánchez‐Juan P, Calero M, Dobato JL, Infante J, Berciano J et al (2013) Reduced serum progranulin level might be associated with Parkinson's disease risk. Eur J Neurol 20: 1571–1573 [DOI] [PubMed] [Google Scholar]
- Mazaheri F, Snaidero N, Kleinberger G, Madore C, Daria A, Werner G, Krasemann S, Capell A, Trümbach D, Wurst W et al (2017) TREM2 deficiency impairs chemotaxis and microglial responses to neuronal injury. EMBO Rep 18: 1186–1198 [DOI] [PMC free article] [PubMed] [Google Scholar]
- McKhann GM, Knopman DS, Chertkow H, Hyman BT, Jack CR, Kawas CH, Klunk WE, Koroshetz WJ, Manly JJ, Mayeux R et al (2011) The diagnosis of dementia due to Alzheimer's disease: recommendations from the National Institute on Aging‐Alzheimer's Association workgroups on diagnostic guidelines for Alzheimer's disease. Alzheimers Dement 7: 263–269 [DOI] [PMC free article] [PubMed] [Google Scholar]
- Meeter LH, Patzke H, Loewen G, Dopper EG, Pijnenburg YA, van Minkelen R, van Swieten JC (2016) Progranulin levels in plasma and cerebrospinal fluid in granulin mutation carriers. Dement Geriatr Cogn Dis Extra 6: 330–340 [DOI] [PMC free article] [PubMed] [Google Scholar]
- Minami SS, Min SW, Krabbe G, Wang C, Zhou Y, Asgarov R, Li Y, Martens LH, Elia LP, Ward ME et al (2014) Progranulin protects against amyloid β deposition and toxicity in Alzheimer's disease mouse models. Nat Med 20: 1157–1164 [DOI] [PMC free article] [PubMed] [Google Scholar]
- Molgaard S, Demontis D, Nicholson AM, Finch NA, Petersen RC, Petersen CM, Rademakers R, Nykjaer A, Glerup S (2016) Soluble sortilin is present in excess and positively correlates with progranulin in CSF of aging individuals. Exp Gerontol 84: 96–100 [DOI] [PubMed] [Google Scholar]
- Monserrate AE, Ryman DC, Ma S, Xiong C, Noble JM, Ringman JM, Morris JC, Danek A, Müller‐Sarnowski F, Clifford DB et al (2015) Factors associated with the onset and persistence of post‐lumbar puncture headache. JAMA Neurol 72: 325–332 [DOI] [PMC free article] [PubMed] [Google Scholar]
- Morenas‐Rodríguez E, Cervera‐Carles L, Vilaplana E, Alcolea D, Carmona‐Iragui M, Dols‐Icardo O, Ribosa‐Nogué R, Muñoz‐Llahuna L, Sala I, Belén Sánchez‐Saudinós M et al (2015) Progranulin protein levels in cerebrospinal fluid in primary neurodegenerative dementias. J Alzheimer's Dis 50: 539–546 [DOI] [PubMed] [Google Scholar]
- Morris JC (1993) The clinical dementia rating (CDR): current version and scoring rules. Neurology 43: 2412–2414 [DOI] [PubMed] [Google Scholar]
- Morris JC, Aisen PS, Bateman RJ, Benzinger TL, Cairns NJ, Fagan AM, Ghetti B, Goate AM, Holtzman DM, Klunk WE et al (2012) Developing an international network for Alzheimer's research: the Dominantly Inherited Alzheimer Network. Clin Invest 2: 975–984 [DOI] [PMC free article] [PubMed] [Google Scholar]
- Naphade SB, Kigerl KA, Jakeman LB, Kostyk SK, Popovich PG, Kuret J (2010) Progranulin expression is upregulated after spinal contusion in mice. Acta Neuropathol 119: 123–133 [DOI] [PMC free article] [PubMed] [Google Scholar]
- Neumann M, Sampathu DM, Kwong LK, Truax AC, Micsenyi MC, Chou TT, Bruce J, Schuck T, Grossman M, Clark CM et al (2006) Ubiquitinated TDP‐43 in frontotemporal lobar degeneration and amyotrophic lateral sclerosis. Science 314: 130–133 [DOI] [PubMed] [Google Scholar]
- Nicholson AM, Finch NA, Thomas CS, Wojtas A, Rutherford NJ, Mielke MM, Roberts RO, Boeve BF, Knopman DS, Petersen RC et al (2014) Progranulin protein levels are differently regulated in plasma and CSF. Neurology 82: 1871–1878 [DOI] [PMC free article] [PubMed] [Google Scholar]
- Pereson S, Wils H, Kleinberger G, McGowan E, Vandewoestyne M, Van Broeck B, Joris G, Cuijt I, Deforce D, Hutton M et al (2009) Progranulin expression correlates with dense‐core amyloid plaque burden in Alzheimer disease mouse models. J Pathol 219: 173–181 [DOI] [PubMed] [Google Scholar]
- Petersen RC, Aisen PS, Beckett LA, Donohue MC, Gamst AC, Harvey DJ, Jack CR, Jagust WJ, Shaw LM, Toga AW et al (2010) Alzheimer's Disease Neuroimaging Initiative (ADNI): clinical characterization. Neurology 74: 201–209 [DOI] [PMC free article] [PubMed] [Google Scholar]
- Petkau TL, Neal SJ, Orban PC, MacDonald JL, Hill AM, Lu G, Feldman HH, Mackenzie IR, Leavitt BR (2010) Progranulin expression in the developing and adult murine brain. J Comp Neurol 518: 3931–3947 [DOI] [PubMed] [Google Scholar]
- Philips T, De Muynck L, Thu HN, Weynants B, Vanacker P, Dhondt J, Sleegers K, Schelhaas HJ, Verbeek M, Vandenberghe R et al (2010) Microglial upregulation of progranulin as a marker of motor neuron degeneration. J Neuropathol Exp Neurol 69: 1191–1200 [DOI] [PubMed] [Google Scholar]
- Piccio L, Deming Y, Del‐Águila JL, Ghezzi L, Holtzman DM, Fagan AM, Fenoglio C, Galimberti D, Borroni B, Cruchaga C (2016) Cerebrospinal fluid soluble TREM2 is higher in Alzheimer disease and associated with mutation status. Acta Neuropathol 131: 925–933 [DOI] [PMC free article] [PubMed] [Google Scholar]
- Rademakers R, Eriksen JL, Baker M, Robinson T, Ahmed Z, Lincoln SJ, Finch N, Rutherford NJ, Crook RJ, Josephs KA et al (2008) Common variation in the miR‐659 binding‐site of GRN is a major risk factor for TDP43‐positive frontotemporal dementia. Hum Mol Genet 17: 3631–3642 [DOI] [PMC free article] [PubMed] [Google Scholar]
- Ryman DC, Acosta‐Baena N, Aisen PS, Bird T, Danek A, Fox NC, Goate A, Frommelt P, Ghetti B, Langbaum JB et al (2014) Symptom onset in autosomal dominant Alzheimer disease: a systematic review and meta‐analysis. Neurology 83: 253–260 [DOI] [PMC free article] [PubMed] [Google Scholar]
- Schreiber S, Debska‐Vielhaber G, Abdulla S, Machts J, Schreiber F, Kropf S, KÖrtvelyessy P, KÖrner S, Kollewe K, Petri S et al (2018) Peripheral nerve atrophy together with higher cerebrospinal fluid progranulin indicate axonal damage in amyotrophic lateral sclerosis. Muscle Nerve 57: 273–278 [DOI] [PubMed] [Google Scholar]
- Sheng J, Su L, Xu Z, Chen G (2014) Progranulin polymorphism rs5848 is associated with increased risk of Alzheimer's disease. Gene 542: 141–145 [DOI] [PubMed] [Google Scholar]
- Sleegers K, Brouwers N, Van Damme P, Engelborghs S, Gijselinck I, van der Zee J, Peeters K, Mattheijssens M, Cruts M, Vandenberghe R et al (2009) Serum biomarker for progranulin‐associated frontotemporal lobar degeneration. Ann Neurol 65: 603–609 [DOI] [PubMed] [Google Scholar]
- Smith KR, Damiano J, Franceschetti S, Carpenter S, Canafoglia L, Morbin M, Rossi G, Pareyson D, Mole SE, Staropoli JF et al (2012) Strikingly different clinicopathological phenotypes determined by progranulin‐mutation dosage. Am J Hum Genet 90: 1102–1107 [DOI] [PMC free article] [PubMed] [Google Scholar]
- Song WM, Joshita S, Zhou Y, Ulland TK, Gilfillan S, Colonna M (2018) Humanized TREM2 mice reveal microglia‐intrinsic and ‐extrinsic effects of R47H polymorphism. J Exp Med 215: 745–760 [DOI] [PMC free article] [PubMed] [Google Scholar]
- Sperling RA, Aisen PS, Beckett LA, Bennett DA, Craft S, Fagan AM, Iwatsubo T, Jack CR, Kaye J, Montine TJ et al (2011) Toward defining the preclinical stages of Alzheimer's disease: recommendations from the National Institute on Aging‐Alzheimer's Association workgroups on diagnostic guidelines for Alzheimer's disease. Alzheimers Dement 7: 280–292 [DOI] [PMC free article] [PubMed] [Google Scholar]
- Storandt M, Balota DA, Aschenbrenner AJ, Morris JC (2014) Clinical and psychological characteristics of the initial cohort of the Dominantly Inherited Alzheimer Network (DIAN). Neuropsychology 28: 19–29 [DOI] [PMC free article] [PubMed] [Google Scholar]
- Suárez‐Calvet M, Araque Caballero MÁ, Kleinberger G, Bateman RJ, Fagan AM, Morris JC, Levin J, Danek A, Ewers M, Haass C, Dominantly Inherited Alzheimer Network (2016a) Early changes in CSF sTREM2 in dominantly inherited Alzheimer's disease occur after amyloid deposition and neuronal injury. Sci Transl Med 8: 369ra178 [DOI] [PMC free article] [PubMed] [Google Scholar]
- Suárez‐Calvet M, Kleinberger G, Araque Caballero MÁ, Brendel M, Rominger A, Alcolea D, Fortea J, Lleó A, Blesa R, Gispert JD et al (2016b) sTREM2 cerebrospinal fluid levels are a potential biomarker for microglia activity in early‐stage Alzheimer's disease and associate with neuronal injury markers. EMBO Mol Med 8: 466–476 [DOI] [PMC free article] [PubMed] [Google Scholar]
- Suh HS, Gelman BB, Lee SC (2014) Potential roles of microglial cell progranulin in HIV‐associated CNS pathologies and neurocognitive impairment. J Neuroimmune Pharmacol 9: 117–132 [DOI] [PMC free article] [PubMed] [Google Scholar]
- Takahashi H, Klein ZA, Bhagat SM, Kaufman AC, Kostylev MA, Ikezu T, Strittmatter SM, Alzheimer's Disease Neuroimaging Initiative (2017) Opposing effects of progranulin deficiency on amyloid and tau pathologies via microglial TYROBP network. Acta Neuropathol 133: 785–807 [DOI] [PMC free article] [PubMed] [Google Scholar]
- Van Kampen JM, Kay DG (2017) Progranulin gene delivery reduces plaque burden and synaptic atrophy in a mouse model of Alzheimer's disease. PLoS ONE 12: e0182896 [DOI] [PMC free article] [PubMed] [Google Scholar]
- Vercellino M, Grifoni S, Romagnolo A, Masera S, Mattioda A, Trebini C, Chiavazza C, Caligiana L, Capello E, Mancardi GL et al (2011) Progranulin expression in brain tissue and cerebrospinal fluid levels in multiple sclerosis. Mult Scler J 17: 1194–1201 [DOI] [PubMed] [Google Scholar]
- Viswanathan J, Mäkinen P, Helisalmi S, Haapasalo A, Soininen H, Hiltunen M (2009) An association study between granulin gene polymorphisms and Alzheimer's disease in finnish population. Am J Med Genet Part B Neuropsychiatr Genet 150: 747–750 [DOI] [PubMed] [Google Scholar]
- Wang Y, Cella M, Mallinson K, Ulrich JD, Young KL, Robinette ML, Gilfillan S, Krishnan GM, Sudhakar S, Zinselmeyer BH et al (2015) TREM2 lipid sensing sustains the microglial response in an Alzheimer's disease model. Cell 160: 1061–1071 [DOI] [PMC free article] [PubMed] [Google Scholar]
- Weiner MW, Veitch DP, Aisen PS, Beckett LA, Cairns NJ, Green RC, Harvey D, Jack CR, Jagust W, Liu E et al (2012) The Alzheimer's Disease Neuroimaging Initiative: a review of papers published since its inception. Alzheimer's Dement 8: S1–S68 [DOI] [PMC free article] [PubMed] [Google Scholar]
- Weiner MW, Veitch DP, Aisen PS, Beckett LA, Cairns NJ, Green RC, Harvey D, Jack CR, Jagust W, Morris JC et al (2017) Recent publications from the Alzheimer's disease neuroimaging initiative: reviewing progress toward improved AD clinical trials. Alzheimer's Dement 13: e1–e85 [DOI] [PMC free article] [PubMed] [Google Scholar]
- Wilke C, Gillardon F, Deuschle C, Hobert MA, Jansen IE, Metzger FG, Heutink P, Gasser T, Maetzler W, Blauwendraat C et al (2017) Cerebrospinal fluid progranulin, but not serum progranulin, is reduced in GRN‐negative frontotemporal dementia. Neurodegener Dis 17: 83–88 [DOI] [PubMed] [Google Scholar]
- Willemse EA, Durieux‐Lu S, van der Flier WM, Pijnenburg YA, de Jonge R, Teunissen CE (2016) Stability of progranulin under pre‐analytical conditions in serum and cerebrospinal fluid. J Alzheimers Dis 53: 107–116 [DOI] [PubMed] [Google Scholar]
- Wils H, Kleinberger G, Pereson S, Janssens J, Capell A, Van Dam D, Cuijt I, Joris G, De Deyn PP, Haass C et al (2012) Cellular ageing, increased mortality and FTLD‐TDP‐associated neuropathology in progranulin knockout mice. J Pathol 228: 67–76 [DOI] [PubMed] [Google Scholar]
- Xu HM, Tan L, Wan Y, Tan MS, Zhang W, Zheng ZJ, Kong LL, Wang ZX, Jiang T, Tan L et al (2017) PGRN is associated with late‐onset Alzheimer's disease: a case‐control replication study and meta‐analysis. Mol Neurobiol 54: 1187–1195 [DOI] [PubMed] [Google Scholar]
- Yin F, Banerjee R, Thomas B, Zhou P, Qian L, Jia T, Ma X, Ma Y, Iadecola C, Beal MF et al (2009) Exaggerated inflammation, impaired host defense, and neuropathology in progranulin‐deficient mice. J Exp Med 207: 117–128 [DOI] [PMC free article] [PubMed] [Google Scholar]
- Yin F, Dumont M, Banerjee R, Ma Y, Li H, Lin MT, Beal MF, Nathan C, Thomas B, Ding A (2010) Behavioral deficits and progressive neuropathology in progranulin‐deficient mice: a mouse model of frontotemporal dementia. FASEB J 24: 4639–4647 [DOI] [PMC free article] [PubMed] [Google Scholar]
- Zhang Y, Chen K, Sloan SA, Bennett ML, Scholze AR, O'Keeffe S, Phatnani HP, Guarnieri P, Caneda C, Ruderisch N et al (2014) An RNA‐sequencing transcriptome and splicing database of glia, neurons, and vascular cells of the cerebral cortex. J Neurosci 34: 11929–11947 [DOI] [PMC free article] [PubMed] [Google Scholar]
- Zhou C, Xie G, Wang C, Zhang Z, Chen Q, Zhang L, Wu L, Wei Y, Ding H, Hang C et al (2015a) Decreased progranulin levels in patients and rats with subarachnoid hemorrhage: a potential role in inhibiting inflammation by suppressing neutrophil recruitment. J Neuroinflammation 12: 200 [DOI] [PMC free article] [PubMed] [Google Scholar]
- Zhou X, Sun L, Bastos de Oliveira F, Qi X, Brown WJ, Smolka MB, Sun Y, Hu F (2015b) Prosaposin facilitates sortilin‐independent lysosomal trafficking of progranulin. J Cell Biol 210: 991–1002 [DOI] [PMC free article] [PubMed] [Google Scholar]
Associated Data
This section collects any data citations, data availability statements, or supplementary materials included in this article.
Supplementary Materials
Appendix
Expanded View Figures PDF
Review Process File