

Abstract
Efforts in the field of synchrotron footprinting are progressing rapidly, with two major footprinting centers in the United States, one on the east coast at the National Synchrotron Light Source II, and one on the west coast at the Advanced Light Source (ALS). This article describes recent technical advances in the technique at the Advanced Light Source, and describes the types of biological problems that can be addressed using the new methods and instrumentation.
Keywords: Synchrotron, footprinting, hydroxyl radical footprinting, x-ray, beamline, radiolysis, radiolytic labeling, Advanced Light Source
1. INTRODUCTION
Radiolytic labeling of proteins is a dose driven process; a high concentration of hydroxyl radicals (•OH) must be achieved to overcome recombination and radical scavenging reactions. Large protein complexes and membrane proteins often require additives such as cofactors and detergents that scavenge •OH radicals, deplete dissolved O2, and reduce the effective dose to the protein. In addition, secondary radiation damage by peroxide and superoxide species can damage or unfold protein molecules [1, 2]. The secondary damage is time dependent and causes specific structural perturbations as irradiation progresses. Therefore, a short, high-dose exposure is essential for maintaining the structural integrity of protein systems and is a key factor in obtaining high quality data. Synchrotron X-ray beamlines can provide the high flux density necessary for generating a high concentration of hydroxyl radicals on a short timescale.
The use of synchrotron X-ray beams to produce hydroxyl radicals for footprinting experiments is a relatively new development in the footprinting field. The application of synchrotron Hydroxyl Radical Footprinting (HRF) to investigate structural features and conformational changes of nucleic acids and proteins in the solution state was originally developed at the NSLS synchrotron in the late nineties [3] and has now transitioned to the X-ray Footprinting (XFP) beamline at the NSLS II, as described in the article by J. Bohon in this issue. The method has been successfully applied to systems ranging from single domain proteins to in-vivo ribonucleoprotein assemblies and has grown substantially in the past several decades [4–12]. HRF was introduced to the ALS in 2013 [13], and synchrotron X-ray footprinting programs are now available in the United States at two national synchrotron facilities: XFP at the National Synchrotron Light Source II on the East Coast, and the relatively new footprinting facility at the Advanced Light Source (ALS) on the West Coast.
The mass spectrometry instrumentation necessary for downstream analysis is generally performed at Case Western Reserve University for the east coast synchrotron, and at the Joint Bioenergy Institute facility for the west coast synchrotron. In addition, the feasibility of synchrotron footprinting in the United States has been conducted at several other synchrotron light sources [14]. Internationally, the feasibility of footprinting at the SOLEIL synchrotron facility in France has recently been demonstrated [15]. This paper describes advances made at the ALS since the inception of the program there, and future plans for the program.
2. FOOTPRINTING AT THE ALS
The ALS synchrotron supports both soft and hard X-ray programs, depending on the characteristics of the insertion device or bend magnet capable. Macromolecular crystallography at the ALS utilizes X-rays in the hard X-ray regime of 5–15 keV via a Wiggler insertion device [16] and superbend magnets [17]. Footprinting at the ALS was first demonstrated on beamline 5.3.1, a bend magnet source [13] utilizing a focusing mirror to focus the white-light beam into a 100 micron spot. The focused beam, combined with a microfluidic flow cell setup enabled exposures in the double-digit microsecond regime to be sufficient for labeling of protein in the megadalton size range [13]. Currently, the program resides at beamline 3.2.1, a bend magnet source without a focusing mirror. Figure 1 shows the ALS bend magnet spectrum for a ring current of 500 mA and a ring energy of 1.9 GeV, and the theoretical calculation of photons absorbed by water-based samples, comparing absorption with and without a glass capillary. While the entire range of wavelengths will produce hydroxyl radicals, penetration depth into the sample varies substantially over the range of X-rays produced. While the primary mechanism for production of hydroxyl radicals from water is described elsewhere [1], other factors that affect the steady-state concentration of hydroxyl radicals include absorption by air, absorption by the sample container (typically glass), and buffer contents which may contribute to scavenging of radicals. The higher the dose and the shorter the exposure time, the better the signal resolution in the data, the lower the secondary damage effects, and the larger the complex that can be studied. Figure 2 compares the dose response curves and total ion chromatograph mass spectrometry results from a focused (5.3.1) vs. an unfocused (3.2.1) white-light bend magnet source at the ALS. We are now developing several methodologies at beamline 3.2.1 to increase the dose received by the sample while maintaining microsecond exposure times. In parallel, we are commissioning ALS beamline 3.3.1, which takes light from the same bend magnet source as 3.2.1, as a dedicated footprinting beamline.
Figure 1.
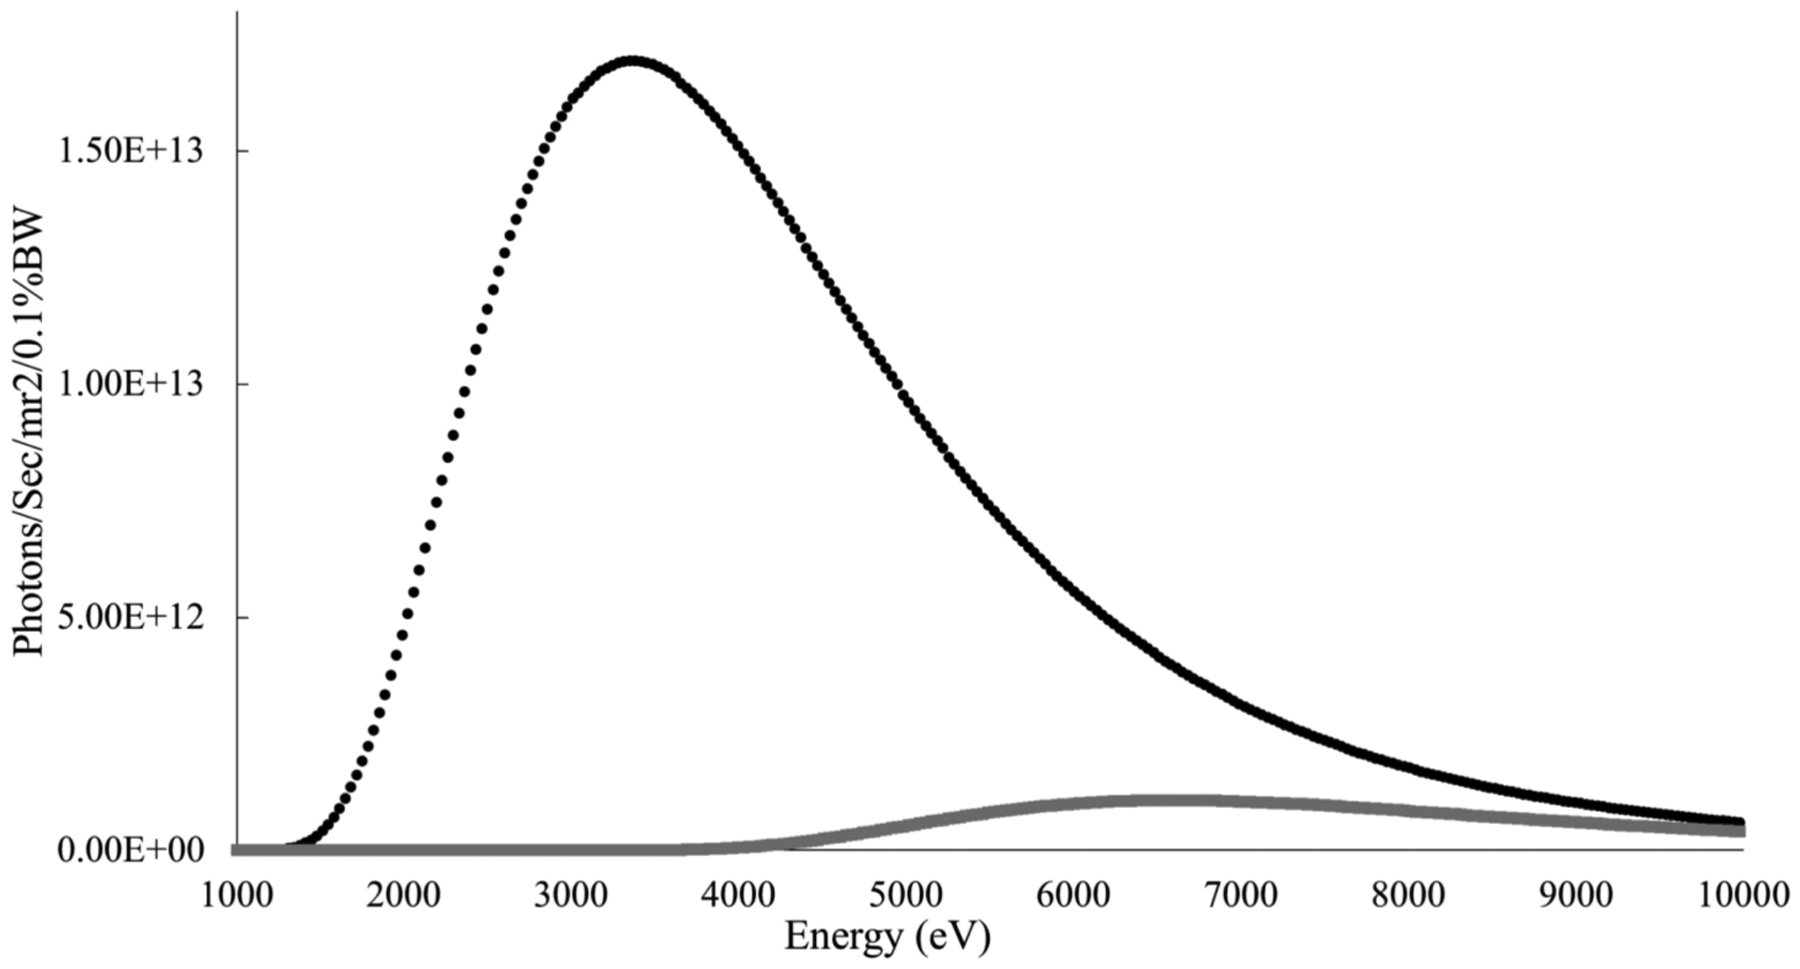
Black line: Calculated absorption spectrum assuming a water-based sample in a full range X-ray beam from an ALS bend magnet at 500 mA ring current and 1.9 GeV ring energy, a 150 μm sample thickness, 1 cm of air transmission, and a 125 μm beryllium window. Gray line: same calculation including an 80 μm glass window. Calculations performed using data from the Center for X-ray Optics Web application (cxro.lbl.gov).
Figure 2.

Dose response curves for a 40 kDa protein at a focused (left) vs unfocused (right) white-light bend magnet beamline source at the ALS. Top: comparison of exposure times necessary for the same amount of modification. Solid lines (red and black) represent pseudo unimolecular fit using full and first 3 data points respectively. Solid blue line represents a fit to y=y0+Aexp(−kt).
Bottom: Total Ion Chromatogram (TIC) achieved for 0 and maximum dose. More damage was observed for the N-terminal portion of the protein using 50 msec exposure as opposed to 0.6 msecs.
3. NEW METHODOLOGIES TO INCREASE DOSE
In the current implementation of the footprinting experiment at the ALS, protein samples in liquid form are passed via syringe pump through a capillary in the path of the X-ray beam [18]. The speed and capillary volume determine the exposure time. Minimizing sample volume is imperative for studies in which multiple samples in gradients of conditions must be analyzed. However, as the tubing diameter decreases, the relative absorption path of capillary material increases relative to absorption path in the sample, and relative dose decreases. Thus, as sample volume requirements decrease, the dose lost to absorption by the capillary goes up substantially. For example, polymicro capillaries suitable for X-ray exposure are available through molex (www.molex.com) in sizes of inner to outer diameter ratios of 100/164, 200/360, and 50/150 microns, corresponding to ratios of sample pathlength to glass pathlength of 1.2, 1.1, and 0.7 (assuming X-rays pass through one-half of the capillary wall and then are absorbed by the full sample pathlength). In figure 1, the integrated photons under the absorption curve for the container-less sample vs. the sample contained behind 80 μm of glass is a factor of ten higher. In addition, because the experiment uses flow rate to control exposure time, the glass capillary is exposed far longer to the beam than the sample. In our current configuration, achieving a 2 ms exposure for a sample volume of 100 μl in a 200 μm inner diameter capillary requires 8 seconds of beam on glass. Damage to the glass is often visible as blackened areas where the beam impinges on the glass, indicating sustained absorption of the X-rays by the glass, and possible local heating of the sample from the glass. Theoretical calculations indicate that a 10-fold increase in the flux density to the sample is possible by removal of the glass entirely (integrated number of photons under the curves in Figure 1), and preliminary experiments conducted at beamline 3.2.1 support these calculations (Figure 3). In these experiments, we compared achievable dose for capillary flow, Acoustic Drop Ejection (ADE) droplet generation, and falling drops. We apertured the beam to 2 mm in the vertical, and aligned the droplet injector manually above the 2 mm aperture. We ran two controls, first using the standard capillary flow method, and second using simple free-falling droplets. For all experiments, we used 10 μM Alexa488 dye in phosphate buffer and measured the photobleaching of the dye upon X-ray exposure to evaluate the effective dose on the sample [3]. For this method, hydroxyl radicals produced by exposure to the X-ray beam permanently alter the dye structure and reduce its fluorescence capability. Measuring the loss of fluorescence of the dye is standard in X-ray footprinting experiments to assess the concentration of radicals and determine dose required for further experiments [3, 19]. Droplets of 3 nl volume and 170 μm diameter were launched vertically downward via the acoustic ejector directly through the 2 mm path of the X-ray beam and collected in a tube filled with a quencher. In our implementation, a 15 MHz ultrasonic tone burst (50μs duration) was focused on the sample-air interface of a sample reservoir to produce the droplets. The sample reservoir (10 μl) was constantly replenished via capillary feed line attached to a syringe pump so that ejection could proceed continually. Commercially available implementations (e.g., via LabCyte) eject from a larger sample reservoir (e.g., a well plate) without replenishment of the well. The ADE generated a fly speed of approximately 1 m/s, corresponding to a 1 millisecond exposure, and resulted in a 15 % decrease in the fluorescence intensity of the dye (Figure 3). In contrast, a 1 millisecond exposure using a standard 200 μm ID capillary generated a 7% decrease, which indicated a net 2-fold increase in dose on the sample using ADE. For the free falling drop we obtained a 20% decrease in a 40 millisecond exposure. These results strongly support the use of the drop-on-demand ejection method to increase dose and efficiency of the HRF method.
Figure 3.
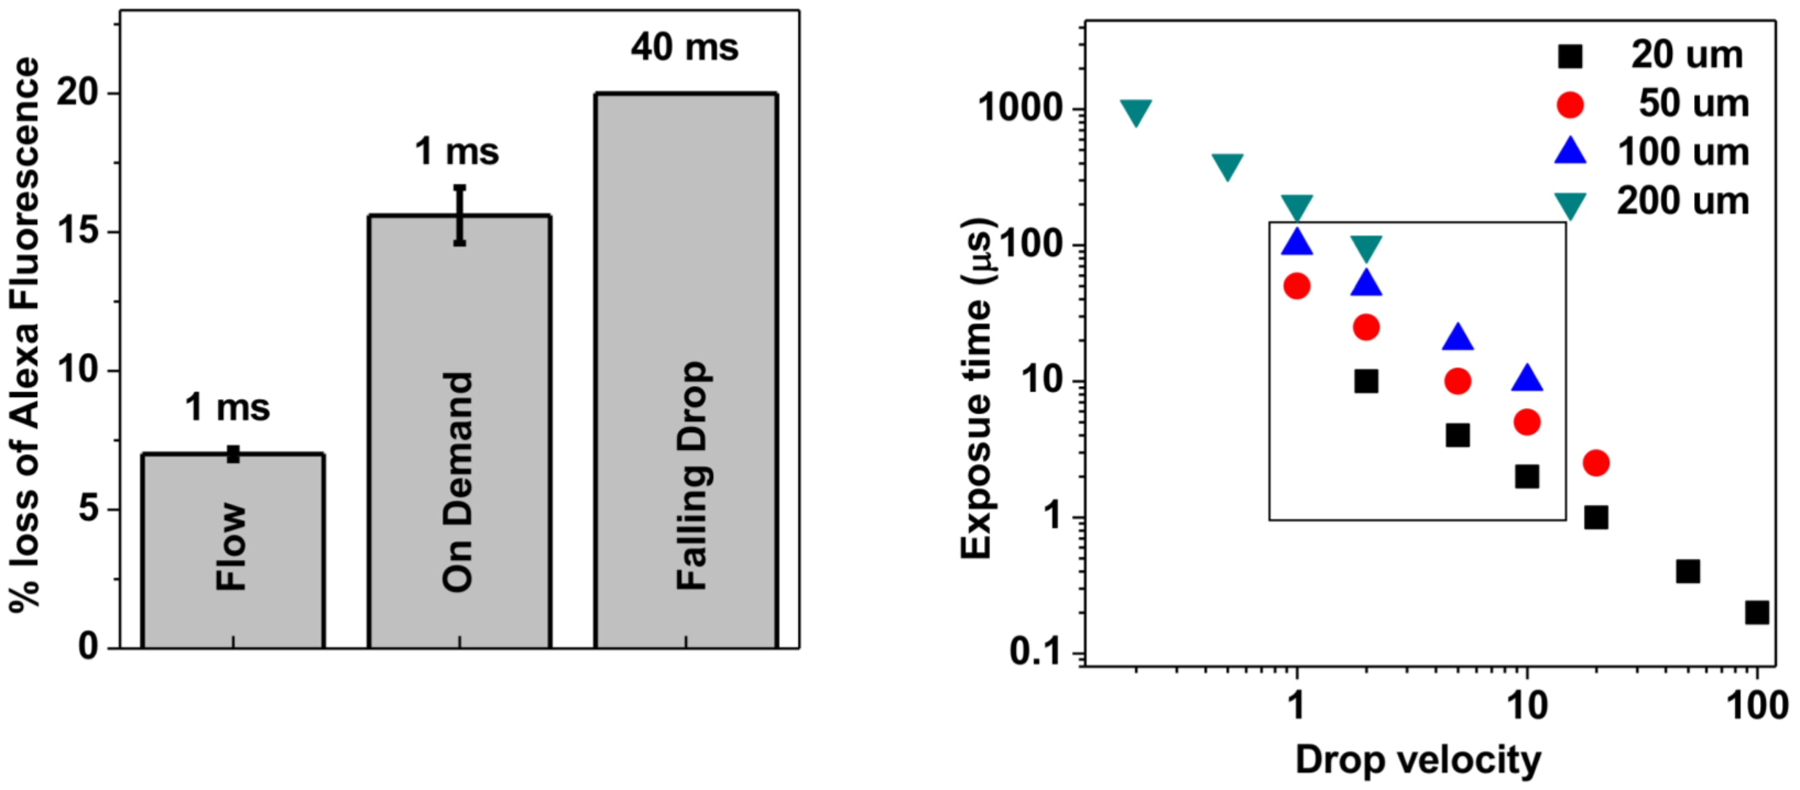
Left: Effect of X-ray dose on Alexa488 fluorescence quenching between ADE (150 μm droplet diameter, 1 ms exposure), microfluidic flow (200 μm ID, 1 ms exposure), and simple droplet falling under gravity (drop volume 2.5 microliter, point of acceleration 3.2 mm before the beam intersection, 40 ms exposure). Experiment was carried out at ALS 3.2.1. Error represents standard deviation from the mean from 6/7 experimental repeats. ADE ejection showed a 2-fold increase in dose relative to capillary flow, while falling drops showed a 4-fold increase. Right: Theoretical prediction to show the range of drop velocity that will be most useful for HRF. The dots represent the optimum range of velocities for a given diameter of the droplet, assuming that the FWHM of the beam is equal to the drop diameter. Note that under this condition a large drop will have lower dose and will require slower speed to get adequate modification. The ideal range of drop diameter (FWHM of the focused beam) and drop velocities for HRF are shown within the box.
4. MEASURE OF DOSAGE
Another important aspect of the X-ray footprinting experiment is the measure and standardization of dose received by the sample. In practice, the Alexa488 fluorophore is added to protein solutions of various concentrations, and photobleaching is quantitated via a fluorimeter. Once dosage is measured and the proper exposure range is determined, samples are run without the dye. While fluorescence inactivation of the Alexa488 dye is one measure of effective dose to the sample, the color change of the fluorophore is also observed, and is related to the dose received by the sample. We have tested a preliminary setup in which an inline camera is used to quantitate color of a falling drop. Preliminary experiments were conducted using a Canon XS40HS camera and the ImageJ [20] software to manually analyze color in 500 μm droplets falling through a ~4 mm wide visible light beam, demonstrating the feasibility of the method (Figure 4). The change in color due to decreasing concentration of Alex488 dye, equivalent to increasing damage from an X-ray beam, is clearly visible. In standard Alexa488 dose response experiments, a factor of 20–40% change in fluorescence is typically enough to determine dosage requirements. In the preliminary data, we achieved this level of differentiation, though the scattered light background was high. Sensitivity will be gained by equipping the camera with a bandpass filter to exclude scattered light from the excitation source. Another advantage of the drop-on-demand and real time color monitoring technology is that it will only require 10–20 μl of sample per dose response point.
Figure 4.

High-speed camera images of falling drops with various concentrations of Alexa488 dye (left) and manual colorimetry measurements of the drops (right).
5. FUTURE DIRECTIONS
While beamline 5.3.1 is no longer available for footprinting experiments, and beamline 3.2.1 is shared with other user programs, ALS beamline 3.3.1 is available for development of a dedicated X-ray footprinting facility. We plan to install the focusing mirror previously utilized at NSLS beamline X18A [21], and generously provided to our group for incorporation into the 3.3.1 beamline. This mirror has a 31.6 mm sagittal radius with an overall size of 700 mm long, 100 mm wide, and 32 mm high. Metrology results performed at the ALS show a tangential slope RMS of 6.3 μrad. Figure 5 shows the calculated spot at the sample in 3.3.1 utilizing this mirror, and positioned in the optical layout 11.5 meters from the source. Ray tracing was performed using SHADOW [22]. Flux density at 5.3.1 with a platinum coated toroidal focusing mirror suitable for focusing a white-light (1 − 13 keV) X-ray beam produced a flux of ~1×10¹⁶ photons/sec in a 10 × 200 μm spot, and the planned mirror installation at 3.3.1 will achieve a similar flux density at the focal point (Figure 5). This improvement will enable detailed characterization of membrane proteins and larger protein complexes, as described by the article by S. Gupta in this issue. In parallel, we have introduced a new standard flow liquid chromatography method with a high degree of chromatographic reproducibility and increased throughput for sample analysis [23]. Peak identification and area analysis are carried out in a semi-automated fashion using Mascot, Skyline and instrument based software [24]. We are extending the use of Skyline to fully automate the processing of HRF data to produce accurate dose response plots per residue based on m/z (mass to charge ratio), isotopic m/z distribution of m/z of various charge states, retention time, and MS/MS sequencing. While commercial automated data processing programs do now exist, for example ProtMap [25], they are expensive, typically requiring a yearly license. We plan to develop and incorporate free-of-charge automated data analysis as part of a high-throughput HRF facility. Developing the footprinting methodology at a synchrotron facility allows the development of a User Program, and facilitates synergies between various structural methods. Our ultimate goal is to create a User Program in HRF at the ALS which enables users to collect high-quality data on complex systems in a straight-forward and high-throughput manner. In addition, there is excellent complementarity between HRF and other synchrotron-based structural methods such as Small-Angle Scattering (SAXS) and Macromolecular Crystallography (MX). Combining structural methods is now often necessary to characterize complex protein structures in order to generate an understanding of challenging biological questions.
Figure 5.
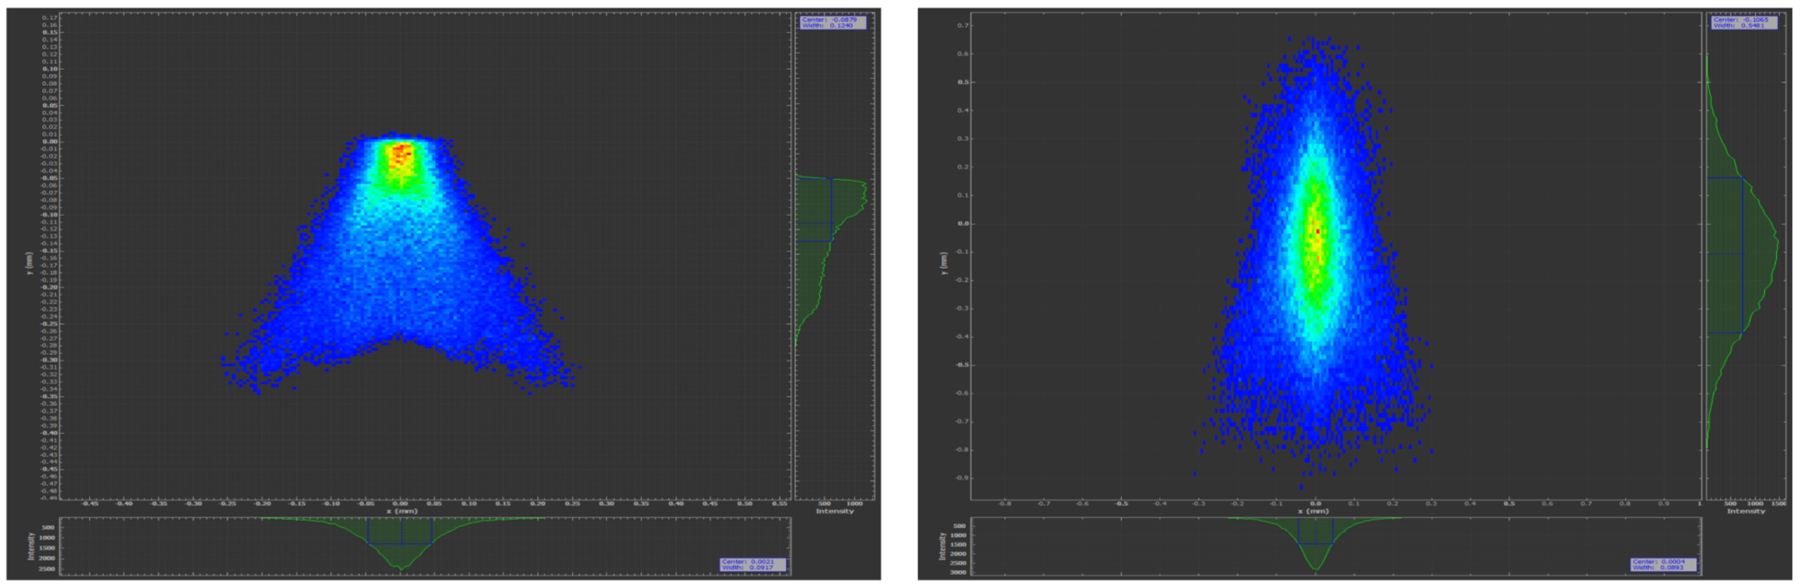
Calculated spot size at sample at ALS beamline 3.3.1 assuming NSLS X18A mirror at 2:1 geometry. Ideal focus (left) is 125 × 91 μm, while focus with estimated slope errors (right) is 500 × 90 μm.
CONCLUSION
HRF has been successfully demonstrated at the ALS beamline 5.3.1, a bend magnet focused white light beamline. Efforts are underway to install a focusing mirror on ALS beamline 3.3.1, a currently unused bend magnet white light beamline, as part of a current effort to build a dedicated HRF facility at the ALS. Preliminary drop-on-demand experiments have demonstrated that high flux density combined with container-less sample presentation to the X-ray beam enable high-dose HRF experiments, which in turn yield high quality data with minimal sample requirements. The ultimate goal of these efforts is to develop a high-throughput User Program at the ALS, in which HRF data collection is facilitated via drop-on-demand instrumentation and data analysis is facilitated through automation.
ACKNOWLEDGEMENTS
We thank J. Feng for experimental support at the beamline 5.3.1 of the ALS, and F. Fuller for assistance with the acoustic droplet generator at beamline 3.2.1. We thank Michael Sullivan for providing the NSLS X18 mirror and tank assembly. The Advanced Light Source and the Joint BioEnergy Institute are supported by the Office of Science, Office of Basic Energy Sciences under Contract No. DE-AC02-05CH11231. This work was supported by National Institutes of Health (NIH) grant R01-GM126218.
LIST OF ABBREVIATIONS
- ADE
Acoustic Drop Ejection
- ALS
Advanced Light Source
- HRF
Hydroxyl Radical Footprinting
- MX
Macromolecular Crystallography
- SAXS
Small Angle X-ray Scattering
- XRF
X-ray Footprinting beamline
Footnotes
CONFLICT OF INTEREST
The authors declare no conflict of interest, financial or otherwise.
REFERENCES
- [1].Xu G; Chance MR Hydroxyl radical-mediated modification of proteins as probes for structural proteomics. Chem. Rev, 2007, 107(8), 3514–3543. [DOI] [PubMed] [Google Scholar]
- [2].Liljenzin J Radiation Effects on Matter. In: Radiochemistry and Nuclear Chemistry, 3rd ed.; Choppin GR; ed.; Butterworth-Heinemann: Oxford, United Kingdom, 2002. [Google Scholar]
- [3].Gupta S; Sullivan M; Toomey J; Kiselar J; Chance MR The beamline X28C of the center for synchrotron biosciences: A national resource for biomolecular structure and dynamics experiments using synchrotron footprinting. J. Synchrotron Radiat, 2007, 14(Pt 3), 233–243. [DOI] [PubMed] [Google Scholar]
- [4].Clatterbuck Soper SF; Dator RP; Limbach PA; Woodson SA In vivo X-ray footprinting of pre-30S ribosomes reveals chaperone-dependent remodeling of late assembly intermediates. Mol. Cell, 2013, 52(4), 506–516. [DOI] [PMC free article] [PubMed] [Google Scholar]
- [5].Hulscher RM; Bohon J; Rappe MC; Gupta S; D’Mello R; Sullivan M; Ralston CY; Chance MR; Woodson SA Probing the structure of ribosome assembly intermediates in vivo using DMS and hydroxyl radical footprinting. Methods, 2016, 103, 49–56. [DOI] [PMC free article] [PubMed] [Google Scholar]
- [6].Orban T; Gupta S; Palczewski K; Chance MR Visualizing water molecules in transmembrane proteins using radiolytic labeling methods. Biochemistry, 2010, 49(5), 827–834. [DOI] [PMC free article] [PubMed] [Google Scholar]
- [7].Bohon J; Jennings LD; Phillips CM; Licht S; Chance MR Synchrotron protein footprinting supports substrate translocation by ClpA via ATP-induced movements of the D2 loop. Structure, 2008, 16(8), 1157–1165. [DOI] [PMC free article] [PubMed] [Google Scholar]
- [8].Kiselar JG; Mahaffy R; Pollard TD; Almo SC; Chance MR Visualizing Arp2/3 complex activation mediated by binding of ATP and WASp using structural mass spectrometry. Proc. Natl. Acad. Sci. USA, 2007, 104(5), 1552–1557. [DOI] [PMC free article] [PubMed] [Google Scholar]
- [9].Gupta S; Cheng H; Mollah AK; Jamison E; Morris S; Chance MR; Khrapunov S; Brenowitz M DNA and protein footprinting analysis of the modulation of DNA binding by the N-terminal domain of the Saccharomyces cerevisiae TATA binding protein. Biochemistry, 2007, 46(35), 9886–9898. [DOI] [PubMed] [Google Scholar]
- [10].Gupta S; Chai J; Cheng J; D’Mello R; Chance MR; Fu D Visualizing the kinetic power stroke that drives proton-coupled zinc(II) transport. Nature, 2014, 512(7512), 101–104. [DOI] [PMC free article] [PubMed] [Google Scholar]
- [11].Gupta S; Guttman M; Leverenz RL; Zhumadilova K; Pawlowski EG; Petzold CJ; Lee KK; Ralston CY; Kerfeld CA Local and global structural drivers for the photoactivation of the orange carotenoid protein. Proc. Natl. Acad. Sci. USA, 2015, 112(41), E5567–E5574. [DOI] [PMC free article] [PubMed] [Google Scholar]
- [12].Deperalta G; Alvarez M; Bechtel C; Dong K; McDonald R; Ling V Structural analysis of a therapeutic monoclonal antibody dimer by hydroxyl radical footprinting. MAbs, 2013, 5(1), 86–101. [DOI] [PMC free article] [PubMed] [Google Scholar]
- [13].Gupta S; Celestre R; Petzold CJ; Chance MR; Ralston C Development of a microsecond X-ray protein footprinting facility at the advanced light source. J. Synchrotron Radiat, 2014, 21(Pt 4), 690–699. [DOI] [PMC free article] [PubMed] [Google Scholar]
- [14].Bohon J; D’Mello R; Ralston C; Gupta S; Chance MR Synchrotron X-ray footprinting on tour. J. Synchrotron Radiat, 2014, 21, 8. [DOI] [PMC free article] [PubMed] [Google Scholar]
- [15].Baud A; Ayme L; Gonnet F; Salard I; Gohon Y; Jolivet P; Brodolin K; Da Silva P; Giuliani A; Sclavi B; Chardot T; Mercere P; Roblin P; Daniel R, SOLEIL shining on the solution-state structure of biomacromolecules by synchrotron X-ray footprinting at the Metrology beamline. J. Synchrotron Radiat, 2017, 24(Pt 3), 576–585. [DOI] [PubMed] [Google Scholar]
- [16].Earnest T; Padmore H; Cork C; Behrsing R; Kim SH The macromolecular crystallography facility at the advanced light source. J. Crystal Growth, 1996, 168(1–4), 5. [Google Scholar]
- [17].MacDowell AA; Celestre RS; Howells M; McKinney W; Krupnick J; Cambie D; Domning EE; Duarte RM; Kelez N; Plate DW; Cork CW; Earnest TN; Dickert J; Meigs G; Ralston C; Holton JM; Alber T; Berger JM; Agard DA; Padmore HA Suite of three protein crystallography beamlines with single superconducting bend magnet as the source. J. Synchrotron Radiat, 2004, 11(Pt 6), 447–455. [DOI] [PubMed] [Google Scholar]
- [18].Gupta S; Feng J; Chan LJ; Petzold CJ; Ralston CY Synchrotron X-ray footprinting as a method to visualize water in proteins. J. Synchrotron Radiat, 2016, 23(Pt 5), 1056–1069. [DOI] [PMC free article] [PubMed] [Google Scholar]
- [19].Gupta S; Bavro VN; D’Mello R; Tucker SJ; Venien-Bryan C; Chance MR Conformational changes during the gating of a potassium channel revealed by structural mass spectrometry. Structure, 2010, 18(7), 839–846. [DOI] [PMC free article] [PubMed] [Google Scholar]
- [20].Schneider CA; Rasband WS; Eliceiri KW NIH Image to Image J: 25 years of image analysis. Nat. Methods, 2012, 9(7), 671–675. [DOI] [PMC free article] [PubMed] [Google Scholar]
- [21].Ehrlich SN; Hanson JC; Camara AL; Barrio L; Estrella M; Zhou G; Si R; Khalid S; Wang Q Combined XRD and XAS. Nucl. Inst. Methods Phys. Res. A, 2011, 646(1), 3. [Google Scholar]
- [22].del Rio MS; Canestrari N; Jiang F; Cerrina F SHADOW3: A new version of the synchrotron X-ray optics modelling package. J. Synchrotron Radiat, 2011, 18(Pt 5), 708–716. [DOI] [PMC free article] [PubMed] [Google Scholar]
- [23].Gonzalez Fernandez-Nino SM; Smith-Moritz AM; Chan LJ; Adams PD; Heazlewood JL; Petzold CJ Standard flow liquid chromatography for shotgun proteomics in bioenergy research. Front Bioeng. Biotechnol, 2015, 3, 44. [DOI] [PMC free article] [PubMed] [Google Scholar]
- [24].MacLean B; Tomazela DM; Shulman N; Chambers M; Finney GL; Frewen B; Kern R; Tabb DL; Liebler DC; MacCoss MJ Skyline: An open source document editor for creating and analyzing targeted proteomics experiments. Bioinformatics, 2010, 26(7), 966–968. [DOI] [PMC free article] [PubMed] [Google Scholar]
- [25].Kaur P; Kiselar JG; Chance MR Integrated algorithms for high-throughput examination of covalently labeled biomolecules by structural mass spectrometry. Anal. Chem, 2009, 81(19), 8141–8149. [DOI] [PMC free article] [PubMed] [Google Scholar]