

Abstract
Background
Easily accessible biomarkers are needed for the early identification of individuals at risk of developing Alzheimer's disease (AD) in large population screening strategies.
Objectives
This study evaluated the potential of plasma β-amyloid (Aβ) biomarkers in identifying early stages of AD and predicting cognitive decline over the following two years.
Design
Total plasma Aβ42/40 ratio (TP42/40) was determined in 83 cognitively normal individuals (CN) and 145 subjects with amnestic mild cognitive impairment (a-MCI) stratified by an FDG-PET AD-risk pattern.
Results
Significant lower TP42/40 ratio was found in a-MCI patients compared to CN. Moreover, a-MCIs with a highrisk FDG-PET pattern for AD showed even lower plasma ratio levels. Low TP42/40 at baseline increased the risk of progression to dementia by 70%. Furthermore, TP42/40 was inversely associated with neocortical amyloid deposition (measured with PiB-PET) and was concordant with the AD biomarker profile in cerebrospinal fluid (CSF).
Conclusions
TP42/40 demonstrated value in the identification of individuals suffering a-MCI, in the prediction of progression to dementia, and in the detection of underlying AD pathology revealed by FDG-PET, Amyloid-PET and CSF biomarkers, being, thus, consistently associated with all the well-established indicators of AD.
Key words: β-amyloid (Aβ), Alzheimer's disease, plasma, biomarker, Aβ ratio
Introduction
Alzheimer's disease (AD) is a progressive condition characterized by a loss of synaptic integrity and consequent neurodegeneration caused by a series of pathological events, including deposition of amyloid-β (Aβ) peptides in cerebral plaques and tau protein aggregation in neurofibrillary tangles (1). AD represents the most common form of dementia, currently affecting over 46 million people worlwide, and is associated with large economical and personal costs. Being able to delay the onset of AD by just a year could significantly reduce the AD cases expected in the coming decades (2). However, the complexity of AD makes it difficult to evaluate therapies and even to detect preclinical and prodromal stages of the disease.
Early application of a potential therapy for AD, specially those targeting Aβ, may significantly increase its efficacy. In this line, success of secondary prevention clinical trials may depend on the inclusion of a wellcharacterised population at pre-dementia stages of the disease (3, 4). Thus, objective identification of individuals suffering (or at risk of developing) the disease early on in the pathological process has become a key aspect in AD research. In this scenario, there is growing need for biomarkers of AD pathology to improve not only drug development and efficient disease progression monitoring, but also to help in population selection and enrichment strategies in clinical trials (5). An objective and accesible biomarker able to reflect the pathological process of AD leading to clinical symptoms is necessary.
Figure 1.

TP42/40 levels in the different groups of the study population and TP42/40 utility in detecting progression to AD
Current diagnostic criteria consider the concept of mild cognitive impairment (MCI) as a prodromal state of Alzheimer's dementia (6). This concept is derived from neuropsychological findings and describes subclasses of MCI: the amnestic type (a-MCI) with memory deficits only, and non-amnestic type (na-MCI) with deficits in at least one cognitive domain other than memory. Additionally, neuroimaging techniques have been developed to identify even earlier stages in the prodromal subclassification of AD based on [18F]-fluorodeoxyglucose positron emission tomography (FDG-PET) neuroimaging (7).
Cerebrospinal fluid (CSF) biomarkers, including Aβ peptides and tau, reflect key processes of AD pathophysiology (8). Amyloid burden in brain is also measured by amyloid-beta positron emission tomography (Aβ-PET) using radioligands specific for Aβ fibrils (9). Both CSF and Aβ-PET biomarkers have demonstrated value in the early detection of AD (10, 11). Nevertheless, they have several limitations, such as economic costs, invasiveness and limited availability in primary healthcare, that highlight the relevance of a more accesible peripheric biomarker to be easily applied in large population screening.
However, despite the general agreement of the association of CSF Aβ levels with AD, studies evaluating the corresponding peripheric Aβ biomarkers in plasma Aβ have shown discrepant results. Some studies found a lack of association between plasma Aβ levels and AD (12, 13, 14), while others showed associations in opposite directions (15, 16). Nevertheless, recent works including large populations of well-characterised participants found consistent lower levels of plasma Aβ42/40 ratio with increased risk of incident AD (17, 18, 19). Furthermore, we recently showed an association between low total plasma Aβ42/40 (TP42/40) ratio and evidence of a pathological event of AD measured by Aβ-PET in a preclinical cohort from the AIBL study (20). These findings are also in line with recently published studies using mass-spectrometry based methods which showed reduced plasma Aβ42/40 ratio associated with neocortical Aβ burden (21, 22).
This work was aimed to determine: (i) the potential of TP42/40 to detect a-MCI in a cohort from the AB255 study; (ii) whether TP42/40 demonstrates the ability to distinguish between a-MCI with an FDG-PET pattern of AD and a-MCI without this pattern; (iii) the value of TP42/40 as a marker of risk of conversion from a-MCI to AD in the 2 years of follow-up of the study; (iv) the degree of concordance of TP42/40 with CSF and Aβ-PET biomarkers.
Methods
The AB255 study
The AB255 study is a multicenter longitudinal study with evaluations of the cognitive state of individuals at 0, 12 and 24 months (see Appendix, Figure S1). Participants were recruited and assessed at 19 clinical memory research sites in Spain, Italy, Sweden and France. The study was comprised of 228 participants over 65 years of age, including 83 cognitively normal (CN) individuals and 145 age-paired subjects with probable a-MCI (6). All subjects were subjected to structural Magnetic Resonance Imaging (MRI), and had the following inclusion criteria: no personal history of significant neurological or psychiatric illnesses; independence in important and basic daily activities; normal performance (according to age and academic level) in the Mini-Mental State Examination (MMSE); a Hachinski ischemic scale score ≤4; score on the Geriatric Depression scale ≤11; at least minimal elementary school; capacity to undertake cognitive tests; and good visual and audio acuity. Those subjects with significant vascular pathology on MRI, which could relate to memory deficits, and/or contraindications for neuroimaging administration were excluded from the study.
Clinical diagnosis
Diagnosis of each participant was performed using a battery of neuropsychological tests (23) and neurological examination. Specific inclusion criteria and neuropsychological battery description is provided in the Appendix. Briefly, CN individuals showed no memory complaints or other cognitive deficiencies and no close family history of dementia. They scored 0 on the Clinical Dementia Rating (CDR) scale, and showed normal performance in the item recognition of a list of words from the test of Learning and Deferred Recall of the Wechsler Memory Scale (WMS) as well as in the Free and Cued Selective Reminding Test (FCSRT).
The a-MCI patients fulfilled Petersen's diagnostic criteria (24). a-MCIs showed a score on the CDR scale of 0.5, with a 0.5 or 1 score for memory, low performance in WMS and Buschke FCSRT, and a score ≤39 in the Interview for Deterioration in Daily Activities (IDDD). All the participants of the study were monitored for 2 years to evaluate their changes in cognitive performance. DSMIV criteria (25) for dementia were applied to evaluate progression to dementia through the follow-up. As a whole, 62 a-MCI patients progressed to AD dementia during the two year study period (incident AD subgroup, a-MCIprog), which implied a conversion rate of 42.8%, whereas 81 remained stable (a-MCIsta)
The a-MCI participants underwent further subclassification based on an FDG-PET pattern of neurodegeneration, either suggestive or not, of a mild cognitive impairment due to AD using a visual analysis of images as proposed by Jagust et al. (26). Thus, the a-MCI group was subdivided into patients with a high level of likelihood of suffering AD according to a positive FDG-PET pattern (a-MCIFDG(+)), and those with low risk of AD according to a negative FDG-PET pattern (a-MCIFDG(-)). a-MCIFDG(+) subjects had to fulfill evidence of uni- or bilateral hypometabolism in at least two out of the three following cerebral regions: temporal, parietal or posterior cingulate, or show uni- or bilateral cingulate or parietal hypometabolism.
Sample collection
Blood samples were collected after overnight fasting at 0, 12 and 24 months in 10ml EDTA tubes containing one pill of a protease inhibitor cocktail (CompleteMini, Roche). Samples were immediately cooled to 2-8°C until processing by centrifugation at 2500xg for 15 min at 4°C within 30h of collection. Plasma was transferred to polypropylene tubes, conveniently aliquoted to avoid any extra freeze/thaw cycle, and stored at -80°C until analysis. Before blood centrifugation, an aliquot of complete blood was reserved and store at -80°C to carry out APOE genotyping.
CSF was obtained at baseline in a subcohort of 43 individuals from two different centers following standardized procedures previously described by the Alzheimer Disease Neuroimaging Initiative (www.adniinfo. org). Briefly, 10ml of CSF were collected by standard lumbar puncture using atraumatic needles (25 gauge), immediately frozen after extraction and stored at -80°. CSF was shipped to the laboratory of analysis in dry ice, thawed, aliquoted into polypropylene tubes and conserved at -80°C until analysis.
Neuroimaging analysis
FDG-PET was performed following standard procedures detailed in Appendix, methods. Cortical Aβ burden was assessed at baseline in a separate subcohort of 59 individuals from Fundació ACE using 11C-Pittsburg compound B (PiB-PET). Detailed procedures of neuroimaging acquisition and analysis are described by Espinosa et al. (27). Imaging data were analyzed using the Fundació ACE Pipeline for Neuroimaging Analysis, available at http://detritus.fundacioace.com/. Participants with PiB-PET measures were classified as β-amyloid positive (PET-Aβ(+)) or β-amyloid negative (PET-Aβ(-)) with relation to a cut-off of 1.4 SUVR (28).
Analysis of samples
Plasma Aβ40 and Aβ42 levels were quantified using ELISA kits ABtest40 and ABtest42, respectively (Araclon Biotech Ltd, Spain). Total Aβ in plasma was obtained by proprietary treatment of the plasma samples before analysis. The specific analytical procedures followed and performance characteristics of these tests are described elsewhere (29). In this work, total in plasma Aβ42/Aβ40 ratio (TP42/40) was evaluated as a biomarker for AD.
Aβ levels were also determined in CSF using ABtest40 and ABtest42 after adaptation of the quantification range of the assays to the peptide levels existing in this fluid. Aβ40 and Aβ42 were measured in 100-fold and 20-fold diluted CSF, respectively, following the standard procedure and reactants of ABtest (29, 30). Total-tau (tTau) and 181phospo-tau (pTau) were determined in an external laboratory using INNOTEST (Innogenetics, now Fujirebio, Ghent, Belgium).
Each analysis was carried out using fresh aliquots of samples and being blinded to any characteristic of the individuals. Samples were randomized and encoded by an external CRO to guarantee the validity of results.
APOE genotyping
APOE genotyping was performed by DNA extraction from blood cells and restriction analysis of the pattern of fragments obtained after digestion with HhaI (31).
Statistical analysis
Statistical analyses were carried out using SPSS Version 22 for Windows (SPSS Inc., Chicago, IL) and R Statistical Environment 3.4. Two-tailed Comparisons of demographic variables and biomarkers among groups were performed using Pearson's χ2 test for categorical variables and Mann-Whitney U test for continuous variables (not normally distributed). Generalized linear regression models (GLM) adjusted for significant demographic covariates (age, APOE genotype and education level; gender was not significantly associated either with TP42/40 or clinical diagnosis) were performed to evaluate the association of TP42/40 levels and the cognitive status of the individuals determined by clinical assessment, FDG-PET neurodegeneration pattern and Aβ-PET status.
A multivariate Cox proportional hazard model was performed to estimate the relationship of baseline TP42/40 levels with the risk of progression to AD during the follow-up period. The ability of TP42/40 to predict those individuals who would progress to dementia was evaluated using logistic regression models and receiver operating characteristic (ROC) analysis. In these regression analyses, TP42/40 was dichotomized with regard to the median of the whole population (0.116). All models were adjusted for age, APOE genotype and education.
Further analyses of the association of plasma TP42/40 with CSF and Aβ-PET biomarkers was carried out using Spearman's Rank correlation and linear regression models (LRM) that allowed adjusting for significant demographic covariates (age, APOE genotype and education).
Results
Quantification of Aβ40 and Aβ42 levels in plasma was performed using ABtest40 and ABtest42, which had been previously validated in an independent work (29). In the AB255 study, variability was further evaluated within the study by repeating the same plasma control samples (n=3) in every microplate. Mean intra-assay and inter-assay coefficients of variation were 7.0% and 3.4% for ABtest40, and 9.35% and 10.60% for ABtest42, respectively. Descriptive statistics of the study population is presented in Table 1.
Table 1.
Characteristics of the population from the AB255 study: demographic variables and descriptive biomarker statistics
| CN | Total a-MCI | P-value a-MCI vs CN | a-MCIFDG(−) | P-value a-MCIFDG(−)vs CN | a-MCIMCIFDG(−) | P-value a-MCIMCIFDG(+)vs CN | P-value a-MCIMCIFDG(+)vs a-MCIMCIFDG(−) | |||||
|---|---|---|---|---|---|---|---|---|---|---|---|---|
| Variable | n | Value | n | Value | n | Value | n | Value | ||||
| n whole population | 83 | 145 | 105 | 40 | ||||||||
| Age (mean±SD) | 83 | 72.07±4.69 | 145 | 73.87±5.11 | 0.01 | 105 | 74.15±5.29 | 0.008 | 40 | 73.13±4.58 | 0.176 | 0.352 |
| Gender (n, % female) | 83 | 39 (46.9%) | 145 | 75 (51.7%) | 0.491 | 105 | 58 (55.2%) | 0.261 | 40 | 17 (42.5%) | 0.641 | 0.308 |
| APOE ε4 carriers (n, %) | 83 | 15 (18.1%) | 145 | 80 (55.2%) | <0.001 | 105 | 49 (46.7%) | <0.001 | 40 | 31 (77.5%) | <0.001 | 0.001 |
| Education level (years±SD) | 81 | 11.44±4.04 | 136 | 9.20±4.04 | <0.001 | 99 | 8.75±3.75 | <0.001 | 37 | 10.41±4.57 | 0.107 | 0.06 |
| TP42/40 (mean±SD) | 83 | 0.123±0.024 | 143 | 0.113±0.025 | 0.001 | 104 | 0.116±0.026 | 0.013 | 39 | 0.104±0.022 | <0.001 | 0.006 |
| CSF Aβ42/40 (mean pg/ml±SD) | 25 | 0.095±0.044 | 16 | 0.069±0.037 | 0.055 | 9 | 0.082±0.044 | 0.565 | 7 | 0.051±0.014 | 0.008 | 0.174 |
| tTau (mean pg/ml±SD) | 27 | 274.70±153.67 | 16 | 466.19±317.13 | 0.014 | 9 | 358.00±141.79 | 0.127 | 7 | 605.29±429.54 | 0.017 | 0.21 |
| pTau (mean pg/ ml±SD) | 27 | 38.22±19.51 | 16 | 59.75±34.05 | 0.014 | 9 | 49.11±20.34 | 0.157 | 7 | 73.42±44.25 | 0.011 | 0.252 |
| PiB-PET (mean SUVR± SD) | 39 | 1.17±0.19 | 20 | 1.50±0.30 | <0.001 | 12 | 1.49±0.30 | 0.006 | 8 | 1.52±0.32 | 0.007 | 0.624 |
P-value refers to U Mann-Whitney test for continuous variables and Pearson's χ2 test for categorical variables. CN, cognitively normal subjects; Total a-MCI, complete population of amnestic mild cognitive impairment individuals; a-MCIFDG(-), a-MCI subjects with low probability of AD according to a FDG-PET neurodegeneration pattern; a-MCIFDG(+), a-MCI subjects with high probability of AD according to a FDG-PET neurodegeneration pattern; SD, standard deviation; SUVR, standardized uptake value ratio: CSF: cerebrospinal fluid; tTau: total Tau protein; pTau: phosphorylated Tau protein; Aβ: beta-amyloid peptide.
Cross-sectional analysis
At baseline, plasma TP42/40 ratio was significantly lower (Mann-Whitney test, p=0.001) in a-MCI compared to cognitively normal individuals (Table 1 and Figure 1A), with a reduction of 8.1% in TP42/40 levels. Generalized linear models confirmed the significance of the inverse association (p=0.046) between TP42/40 and clinical diagnosis after adjusting for covariates (Table 2). This association was repeated in a consistent pattern throughout the different time-points of the study, in which even lower levels of TP42/40 were found in the incident AD group (Figure 1B and 1C).
Table 2.
Association of plasma TP42/40 with prodromal stages of AD
| β | 95% CI | P value | |
|---|---|---|---|
| CN vs. a-MCI | −1.958 | −3.882 to −0.034 | 0.046 |
| Association with FDG-PET | |||
| CN vs. a-MCIFDG(+) | −4.568 | −7.453 to −1.683 | 0.002 |
| a-MCIFDG(-) vs. a-MCIFDG(+) | −3.283 | −5.862 to −0.704 | 0.013 |
| Association with progression to AD | |||
| CN vs. a-MCIsta | −0.932 | −3.080 to 1.216 | 0.395 |
| CN vs. a-MCIprog | −3.212 | −5.752 to −0.672 | 0.013 |
| a-MCIsta vs. a-MCIprog | −2.828 | −5.160 to −0.496 | 0.017 |
Comparison of TP42/40 levels between groups was carried out using generalized linear models adjusted for age, APOE genotype and education level. TP42/40 levels were compared between CN and a-MCI individuals, and between the subclassification of a-MCI subjects based on FDG-PET at baseline. β, coefficient of GLM regression; 95% CI, 95% confidence interval; CN, cognitively normal individuals; a-MCI, amnestic mild cognitive impairment; a-MCIFDG(-), a-MCI subjects with low probability of AD according to a FDG-PET neurodegeneration pattern; a-MCIFDG(+), a-MCI subjects with high probability of AD according to a FDG-PET neurodegeneration pattern. a-MCIsta, a-MCI stables at the end of the follow-up; a-MCIprog, a-MCI at baseline who progressed to AD dementia during the study period.
Patients were separated at baseline into those with either a positive or negative FDG-PET pattern of cortical hypometabolism suggestive of AD (a-MCIFDG(+) and a-MCIFDG(-), respectively). a-MCIFDG(+) individuals showed a lower TP42/40 ratio than those classified as a-MCIFDG(-) (Figure 1D). After adjusting for demographic covariates in GLM, TP42/40 levels in the a-MCIFDG(+) group were significantly reduced compared both to CN (β=−4.57, p=0.002) and to a-MCIFDG(-) (β=−3.29, p=0.013) (Table 2). Patients classified as a-MCIFDG(+ showed a 15.4% reduction of TP42/40 with regard to CN.
A TP42/40 levels and the risk of progression to AD
During the two years of follow-up, 62 a-MCI individuals (42.8%) progressed to AD. In terms of progression to AD dementia, 52.4% of a-MCI subjects with low TP42/40 ratio (below the median of the study population) at baseline progressed to AD within 24 months, whereas only 28.8% of those with high TP42/40 did. The a-MCI subjects who progressed to AD (a-MCIprog) showed significantly lower baseline levels (p=0.017) of TP42/40 than a-MCI participants who remained stable (a-MCIsta) after follow-up (Figure 1E). Low TP42/40 ratio at baseline implied an increase of ≈70% in the risk of progression from a-MCI to AD (Hazard Ratio, HR=1.687, CI 95% 1.058-2.691, p=0.028). ROC analysis evaluating the discrimination ability of baseline TP42/40 to detect a-MCIprog, with regard to cognitively normal stability, gave a significant AUC of 0.857, with sensitivity and specificity above 70% at Youden's optimized cut-off (Figure 1F).
Correlation of plasma TP42/40 with Aβ-PET and CSF biomarkers
A significant inverse correlation between plasma TP42/40 and the PiB-PET SUVR (Spearman's Rank coefficient rs=−0.464, p<0.001) was found (Figure 2), being also statistically significant in a LRM adjusted for age, education and APOE genotype (linear regression coefficient β=−0.39, p<0.0021). At baseline, plasma TP42/40 showed a direct association with CSF Aβ42 levels (rs=0.549, p<0.001), which was also statistically significant in adjusted LRM (β=0.382, p=0.021). This direct association was also found for the CSF Aβ42/40 ratio (rs=0.407, p=0.008), although it lost statistical significance after adjusting for covariates in LRM (β=0.245, p=0.138). A significant inverse correlation (Figure 2) of TP42/40 with tau levels in CSF (tTau rs=−0.314, p=0.031; pTau rs=0.-329, p=0.040) was also found (adjusted LRM: tTau β=−0.348, p=0.043; pTau=−0.342, p=0.055). Thus, low plasma TP42/40 ratio was concordant with the CSF biomarker profile characteristic of AD, as well as with Aβ load in brain.
Figure 2.
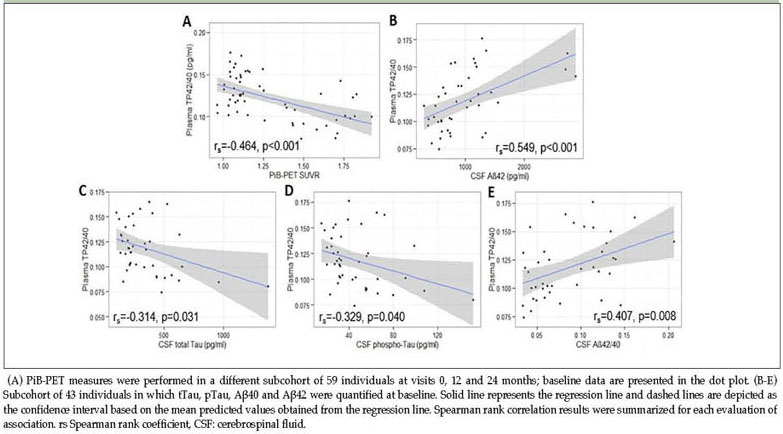
Correlation of plasma TP42/40 with cortical Aβ deposition and CSF biomarkers at baseline
Additionally, TP42/40 levels were compared between amyloid positive and negative individuals with regard to their brain Aβ levels measured with PiB-PET at baseline. Significantly lower TP42/40 was found in PET-Aβ(+) participants (β=−15.7, CI 95% −25.2 to −6.2, p=0.001) in a GLM adjusted for age, education and APOE genotype, compared to PET-Aβ(-) individuals.
Discussion
In the present work, significantly lower levels of plasma TP42/40 ratio were consistently found in prodromal stages of AD. Participants classified as a-MCI showed lower TP42/40 than CN at the three time-points analyzed (baseline, 12 and 24 months of follow-up). Moreover, TP42/40 levels were even lower in those patients with incident AD. The consistency of this association throughout the entire follow-up gives reliability to the results, and is in accordance with other studies in which low plasma Aβ42/40 ratios are associated with increased risk of dementia (17, 18, 19, 32, 33), and greater cognitive decline (34, 35). Nevertheless, studies evaluating the association of plasma Aβ levels with AD severity have also provided controversial results, showing either no association (12, 13, 14) or contradictory results (15, 16).
In this study, a-MCI participants were subclassified based on visual interpretation of FDG-PET scans (26) in order to separate the a-MCI subjects showing a hypometabolism pattern suggestive of high risk of early progression to AD dementia (a-MCIFDG(+)) from those subjects with a negative FDG-PET pattern of neurodegeneration (a-MCIFDG(-)). In fact, 72.4% of the a-MCIFDG(+ subjects progressed to dementia during follow-up, whereas only 31.4% of those a-MCIFDG(-) did, validating also the applicability of this approach to detect disease progression in the short term among individuals at prodromal stages of AD. The association of low TP42/40 with prodromal stages of AD was further confirmed in this study as lower levels of TP42/40 were found in those a-MCIFDG(+ compared to the a-MCIFDG(-).
Aβ plasma levels were also evaluated in this study as predictors of disease progression, and we found that a low TP42/40 ratio at baseline related to a 70% increase in the risk of progression from a-MCI to AD dementia in two years. This finding is highly consistent with the results from a meta-analysis including more than 10,000 subjects, in which similar overall risk ratios were obtained with low Aβ42/40 plasma levels (36). Those a-MCI subjects progressing to AD were detected based on the baseline levels of TP42/40 with over 70% specificity and sensitivity. Although this diagnostic performance may not be sufficient to set plasma Aβ42/40 ratio as a standalone diagnostic referent for probability of AD, these results support its potential as a screening tool to select individuals more prone to develop dementia in a stepped diagnosis process, as is common in most branches of diagnostic medicine.
A significant inverse association was also found between the TP42/40 ratio and the neocortical Aβ deposition evaluated by PiB-PET in a subcohort of 59 individuals. Previous studies from different groups also found this inverse association of plasma Aβ42/40 ratio and cortical Aβ burden (21, 22, 37, 38). Furthermore, results from a work from our group, specifically evaluating plasma TP42/40 association with Aβ-PET, showed also reduced levels of TP42/40 ratio with brain Aβ load in an independent cohort from the AIBL study (20). The results from the AB255 study validate our prior observation of TP42/40 as a biomarker mirroring the Aβ accumulation process in brain. In fact, despite coming from completely independent populations, the significantly lower TP42/40 ratio found in AB255 PET-Aβ(+) subjects are remarkably consistent with our previous results from the AIBL study (20).
The AB255 study also included a subcohort of participants from whom CSF was extracted. Despite the small sample size of this cohort (n=43), significant correlations of TP42/40 with not only CSF Aβ species, but also with markers of neurodegeneration such as pTau and tTau, were obtained (Figure 2). Low TP42/40 was associated with the biomarker signature of AD in CSF (39), characterized by low Aβ42 and high tau levels. This finding was in agreement with previous studies showing significant correlations between Aβ levels in plasma and CSF (38, 40), but not with other studies that did not find a plasma-CSF correlation (16, 41). Limited sample size and follow-up times of this substudy limit hypothesis making in this regard. Thus, although plasma TP42/40 may be reflecting pathological changes occurring in CSF, further investigation needs to be undertaken to establish the possible dynamics of the association and whether it is maintained over time and disease stage.
Moreover, a deep understanding of Aβ biology in plasma is needed. ABtest allows determination of the total Aβ peptide quantifiable in plasma from a more comprehensive quantification approach (29), which could be relevant for consistency of results. Differences among studies could be partly due to the different nature of the Aβ quantified (14). Furthermore, the diverse sources of peripheral Aβ (42) and their modulation by other factors unrelated to amyloid brain pathology (38) may be blurring its potential as an AD biomarker. Yet, a considerable percentage of plasma Aβ was confirmed to come from central nervous system (21), enabling the reflection of brain Aβ pathology with blood Aβ measurements. In particular, recent results from different groups are in agreement with our findings despite using a different quantification method, confirming an inverse association between plasma Aβ42/40 ratio and Aβ-PET imaging load (21, 22).
The small differences (8.1% reduction in the a-MCI group, and 15.4% in a-MCIFDG(+) subgroup compared to the CN group), together with the significant overlap of plasma Aβ42/40 levels between groups found by us and others (20, 21, 43), could limit the potential use of a plasma biomarker as a “one shot” diagnostic tool. Plasma Aβ quantification requires an extra level of sensitivity, precision and accuracy to overcome the small TP42/40 difference (effect size) existing among diagnostic groups. General performance of ABtest has been previously assessed in a complete validation study (29). Additionally, the specific ABtest reproducibility throughout this study was also evaluated, showing an overall variability of 7.6%, which is in accordance with previous performance testing and the precision found in the quantification of Aβ in plasma with automated methods(44). Although it may be still insufficient to establish plasma Aβ as a diagnostic tool, TP42/40 ratio emerges as a valuable screening biomarker to be used before considering CSF or PET testing.
Further studies with increased sample size are needed to validate these results and to establish practical cutoffs. Due to the multifactorial and complex nature of AD, a combination of several markers and risk factors, and not a singular measurement, will probably be needed to identify those individuals at risk. Association of the TP42/40 ratio with the severity of AD may not be sufficient to establish a diagnosis based on it. Nevertheless, large population screening in primary clinical practice could be performed by the use of a sequential diagnostic procedure. An accessible plasma measurement showing a high negative predictive value could be used as a first step to exclude most of those without the condition and, then, apply a confirmatory second step based on, for example, neuroimaging or CSF. It would imply a decrease in the number of invasive and costly techniques, such as CSF and PET, that could be used in a confirmative second step, reducing overall costs and logistic difficulties of clinical trials (45).
In conclusion, there is an increasing body of evidence that TP42/40, as measured by ABtest40 and ABtest42, is a useful first step screening tool and predictor of AD progression and severity. These results are congruent with a considerable number of studies reporting an inverse association of plasma Aβ42/40 ratios with AD. The fact that TP42/40 ratio was associated with various other correlates of the presence of the disease, such as clinical assessment, FDG-PET and PiBPET neuroimaging, and CSF biomarkers, adds value to the results presented here. Moreover, our findings validate previous results with ABtest in an independent population, conferring reliability to the measure. Although larger studies should be completed to establish definite cut-offs and practical application, plasma TP42/40 ratio appears progressively consolidated as a cost-effective tool, which could be useful in the screening process for secondary prevention clinical trials in AD and, eventually, for population management in primary care settings.
Funding: This work was funded by Araclon Biotech. Fundació ACE Memory Clinic, as well as the Spanish Ministry of Health through Instituto de Salud Carlos III (Madrid) (FISS PI10/00954) and by Agència d'Avaluació de Tecnologia i Recerca Mèdiques, Departament de Salut de la Generalitat de Catalunya (RECERCALIA grant 390/06/2009). Araclon Biotech was the main funder of the study, participating in conceptualization, design, data collection and manuscript preparation.
Conflict of interest: VPG, PP, JR, ISJ, LS, IM and MS are employees of Araclon Biotech. All other co-authors do not have conflicts of interest related to this study.
Ethical standards: The study was approved by the CEIC ethic committee 2009/5455, and all participants provided written informed consent prior to inclusion. Patient recruitment and collection protocols were in accordance with ethical standards according to WMA Declaration of Helsinki-Ethical Principles for Medical Research Involving Human Subjects.
Acknowledgments: The authors would like to thank the participants and collaborators of this study, and the entire AB255 Study Group.
Other AB255 Study Group collaborators: Miguel Goñi7; Francesc Pujadas8; Alberto Villarejo9; Ana Frank10; Jordi Peña-Casanova11; Manuel Fernández12; Gerard Piñol13; Rafael Blesa14; Pedro Gil15; Luis F. Pascual16; Miquel Aguilar17; Giovanni B Frisoni18; Jorge Matias-Guiu15; Niels Andreasen9; Carmen Antúnez20; Bruno Vellas21; Jacques Touchon22 (7. Hospital Divino Vallés, Burgos, Spain; 8. Hospital Universitari Vall d'Hebrón, Barcelona, Spain; 9. Hospital Doce de Octubre, Madrid, Spain; 10. Hospital La Paz, Madrid, Spain; 11. Hospital del Mar, Barcelona, Spain; 12. CAE Oroitu Algorta, Vizcaya, Spain; 13. Hospital Santa María de Lleida, Lleida, Spain; 14. Hospital de la Santa Creu i Sant Pau, Barcelona, Spain; 15. Hospital Clínico San Carlos, Madrid, Spain; 16. Hospital Lozano Blesa, Zaragoza, Spain; 17. Hospital Universitari Mútua Terrassa, Terrassa, Spain; 18. IRCCS Centro San Giovanni di Dio FBF, Brescia, Italy; 19. Karolinska Institutet, Stockholm, Sweden; 20. Hospital Virgen de la Arrixaca, Fundación Alzheimur, Murcia, Spain; 21. Hôpital CHU La Grave, Casselardit, Toulouse, France; 22. Hôpital Gui de Chauliac, CHU, Montpellier, France)
Electronic supplementary material
Supplementary material is available for this article at https://doi.org/10.14283/jpad.2018.41 and is accessible for authorized users.
Appendix
References
- 1.Lacosta AM, Insua D, Badi H, Pesini P, Sarasa M. Neurofibrillary Tangles of Abetax–40 in Alzheimer's Disease Brains. J Alzheimers Dis. 2017;58:661–667. doi: 10.3233/JAD-170163. 10.3233/JAD-170163 PubMed PMID: 28453491. [DOI] [PubMed] [Google Scholar]
- 2.Brookmeyer R, Johnson E, Ziegler–Graham K, Arrighi HM. Forecasting the global burden of Alzheimer's disease. Alzheimers Dement. 2007;3:186–191. doi: 10.1016/j.jalz.2007.04.381. 10.1016/j.jalz.2007.04.381 PubMed PMID: 19595937. [DOI] [PubMed] [Google Scholar]
- 3.Doody RS, Thomas RG, Farlow M, et al. Phase 3 trials of solanezumab for mild–to–moderate Alzheimer's disease. N Engl J Med. 2014;370:311–321. doi: 10.1056/NEJMoa1312889. 10.1056/NEJMoa1312889 PubMed PMID: 24450890. [DOI] [PubMed] [Google Scholar]
- 4.Salloway S, Sperling R, Fox NC, et al. Two phase 3 trials of bapineuzumab in mild–to–moderate Alzheimer's disease. N Engl J Med. 2014;370:322–333. doi: 10.1056/NEJMoa1304839. 10.1056/NEJMoa1304839 PubMed PMID: 24450891, PMCID 4159618. [DOI] [PMC free article] [PubMed] [Google Scholar]
- 5.Sperling RA, Rentz DM, Johnson KA, et al. The A4 study: stopping AD before symptoms begin? Sci Transl Med. 2014 doi: 10.1126/scitranslmed.3007941. [DOI] [PMC free article] [PubMed] [Google Scholar]
- 6.Albert MS, DeKosky ST, Dickson D, et al. The diagnosis of mild cognitive impairment due to Alzheimer's disease: recommendations from the National Institute on Aging–Alzheimer's Association workgroups on diagnostic guidelines for Alzheimer's disease. 2011 doi: 10.1016/j.jalz.2011.03.008. [DOI] [PMC free article] [PubMed] [Google Scholar]
- 7.Bohnen NI, Djang DS, Herholz K, Anzai Y, Minoshima S. Effectiveness and safety of 18F–FDG PET in the evaluation of dementia: a review of the recent literature. J Nucl Med. 2012 doi: 10.2967/jnumed.111.096578. [DOI] [PubMed] [Google Scholar]
- 8.Fagan AM, Mintun MA, Mach RH, et al. Inverse relation between in vivo amyloid imaging load and cerebrospinal fluid Abeta42 in humans. Ann Neurol. 2006;59:512–519. doi: 10.1002/ana.20730. 10.1002/ana.20730 PubMed PMID: 16372280. [DOI] [PubMed] [Google Scholar]
- 9.Weiner MW, Veitch DP, Aisen PS, et al. The Alzheimer's Disease Neuroimaging Initiative: a review of papers published since its inception. Alzheimers Dement. 2012 doi: 10.1016/j.jalz.2011.09.172. [DOI] [PMC free article] [PubMed] [Google Scholar]
- 10.Rowe CC, Bourgeat P, Ellis KA, et al. Predicting Alzheimer disease with beta–amyloid imaging: results from the Australian imaging, biomarkers, and lifestyle study of ageing. Ann Neurol. 2013:905–913. doi: 10.1002/ana.24040. [DOI] [PubMed] [Google Scholar]
- 11.Blennow K, Dubois B, Fagan AM, Lewczuk P, de Leon MJ, Hampel H. Clinical utility of cerebrospinal fluid biomarkers in the diagnosis of early Alzheimer's disease. Alzheimers Dement. 2015:58–69. doi: 10.1016/j.jalz.2014.02.004. [DOI] [PMC free article] [PubMed] [Google Scholar]
- 12.Hansson O, Zetterberg H, Vanmechelen E, et al. Evaluation of plasma Abeta(40) and Abeta(42) as predictors of conversion to Alzheimer's disease in patients with mild cognitive impairment. Neurobiol Aging. 2010:357–367. doi: 10.1016/j.neurobiolaging.2008.03.027. [DOI] [PubMed] [Google Scholar]
- 13.Lopez OL, Kuller LH, Mehta PD, et al. Plasma amyloid levels and the risk of AD in normal subjects in the Cardiovascular Health Study. Neurology. 2008;70:1664–1671. doi: 10.1212/01.wnl.0000306696.82017.66. 10.1212/01.wnl.0000306696.82017.66 PubMed PMID: 18401021, PMCID 2670993. [DOI] [PMC free article] [PubMed] [Google Scholar]
- 14.Lovheim H, Elgh F, Johansson A, et al. Plasma concentrations of free amyloidbeta cannot predict the development of Alzheimer's disease. 2016 doi: 10.1016/j.jalz.2016.08.016. [DOI] [PubMed] [Google Scholar]
- 15.Cosentino SA, Stern Y, Sokolov E, et al. Plasma beta–Amyloid and Cognitive Decline. 2010 doi: 10.1001/archneurol.2010.189. [DOI] [PMC free article] [PubMed] [Google Scholar]
- 16.Mehta PD, Pirttila T, Patrick BA, Barshatzky M, Mehta SP. Amyloid beta protein 1–40 and 1–42 levels in matched cerebrospinal fluid and plasma from patients with Alzheimer disease. Neurosci Lett. 2001;304:102–106. doi: 10.1016/s0304-3940(01)01754-2. 10.1016/S0304-3940(01)01754-2 PubMed PMID: 11335065. [DOI] [PubMed] [Google Scholar]
- 17.Chouraki V, Beiser A, Younkin L, et al. Plasma amyloid–beta and risk of Alzheimer's disease in the Framingham Heart Study. Alzheimers Dement. 2015:249–257. doi: 10.1016/j.jalz.2014.07.001. [DOI] [PMC free article] [PubMed] [Google Scholar]
- 18.Graff–Radford NR, Crook JE, Lucas J, et al. Association of low plasma Abeta42/Abeta40 ratios with increased imminent risk for mild cognitive impairment and Alzheimer disease. Arch Neurol. 2007:354–362. doi: 10.1001/archneur.64.3.354. [DOI] [PubMed] [Google Scholar]
- 19.Lambert JC, Schraen–Maschke S, Richard F, et al. Association of plasma amyloid beta with risk of dementia: the prospective Three–City Study. Neurology. 2009;73:847–853. doi: 10.1212/WNL.0b013e3181b78448. 10.1212/WNL.0b013e3181b78448 PubMed PMID: 19752451. [DOI] [PubMed] [Google Scholar]
- 20.Fandos N, Perez–Grijalba V, Pesini P, et al. Plasma amyloid beta 42/40 ratios as biomarkers for amyloid beta cerebral deposition in cognitively normal individuals. Alzheimers Dement (Amst) 2017;8:179–187. doi: 10.1016/j.dadm.2017.07.004. [DOI] [PMC free article] [PubMed] [Google Scholar]
- 21.Ovod V, Ramsey KN, Mawuenyega KG, et al. Amyloid beta concentrations and stable isotope labeling kinetics of human plasma specific to central nervous system amyloidosis. Alzheimers Dement. 2017:841–849. doi: 10.1016/j.jalz.2017.06.2266. [DOI] [PMC free article] [PubMed] [Google Scholar]
- 22.Nakamura A, Kaneko N, Villemagne VL, et al. High performance plasma amyloid–beta biomarkers for Alzheimer's disease. Nature. 2018;554:249–254. doi: 10.1038/nature25456. 10.1038/nature25456 PubMed PMID: 29420472. [DOI] [PubMed] [Google Scholar]
- 23.Lezak MD, Howieson DB, Loring DW. Oxofrd University Press; New York: 2004. Neuropsychological Assessment, 4th Edition ed. [Google Scholar]
- 24.Petersen RC. Mild cognitive impairment as a diagnostic entity. J Intern Med. 2004:183–194. doi: 10.1111/j.1365-2796.2004.01388.x. [DOI] [PubMed] [Google Scholar]
- 25.American Psychiatric Association . American Psychiatric Association; Washington D.C.: 2000. Diagnostic and Statistical Manual of Mental Disorders, 4th Edition ed. [Google Scholar]
- 26.Jagust W, Reed B, Mungas D, Ellis W, Decarli C. What does fluorodeoxyglucose PET imaging add to a clinical diagnosis of dementia. Neurology. 2007;69:871–877. doi: 10.1212/01.wnl.0000269790.05105.16. 10.1212/01.wnl.0000269790.05105.16 PubMed PMID: 17724289. [DOI] [PubMed] [Google Scholar]
- 27.Espinosa A, Alegret M, Pesini P, et al. Cognitive Composites Domain Scores Related to Neuroimaging Biomarkers within Probable–Amnestic Mild Cognitive Impairment–Storage Subtype. J Alzheimers Dis. 2017;57:447–459. doi: 10.3233/JAD-161223. 10.3233/JAD-161223 PubMed PMID: 28269787, PMCID 5366247. [DOI] [PMC free article] [PubMed] [Google Scholar]
- 28.Nordberg A, Carter SF, Rinne J, et al. A European multicentre PET study of fibrillar amyloid in Alzheimer's disease. Eur J Nucl Med Mol Imaging. 2013:104–114. doi: 10.1007/s00259-012-2237-2. [DOI] [PMC free article] [PubMed] [Google Scholar]
- 29.Perez–Grijalba V, Fandos N, Canudas J, et al. Validation of Immunoassay–Based Tools for the Comprehensive Quantification of Abeta40 and Abeta42 Peptides in Plasma. J Alzheimers Dis. 2016;54:751–762. doi: 10.3233/JAD-160325. 10.3233/JAD-160325 PubMed PMID: 27567833, PMCID 5044780. [DOI] [PMC free article] [PubMed] [Google Scholar]
- 30.Perez–Grijalba V, Pesini P, Allue JA, et al. Abeta1–17 is a major amyloid–beta fragment isoform in cerebrospinal fluid and blood with possible diagnostic value in Alzheimer's disease. J Alzheimers Dis. 2015;43:47–56. doi: 10.3233/JAD-140156. 10.3233/JAD-140156 PubMed PMID: 25061046. [DOI] [PubMed] [Google Scholar]
- 31.Hixson JE, Vernier DT. Restriction isotyping of human apolipoprotein E by gene amplification and cleavage with HhaI. J Lipid Res. 1990:545–548. [PubMed] [Google Scholar]
- 32.van OM, Hofman A, Soares HD, Koudstaal PJ, Breteler MM. Plasma Abeta(1–40) and Abeta(1–42) and the risk of dementia: a prospective case–cohort study. Lancet Neurol. 2006 doi: 10.1016/S1474-4422(06)70501-4. [DOI] [PubMed] [Google Scholar]
- 33.Abdullah L, Luis C, Paris D, et al. Serum Abeta levels as predictors of conversion to mild cognitive impairment/Alzheimer disease in an ADAPT subcohort. Mol Med. 2009:432–437. doi: 10.2119/molmed.2009.00083. [DOI] [PMC free article] [PubMed] [Google Scholar]
- 34.Yaffe K, Weston A, Graff–Radford NR, et al. Association of plasma betaamyloid level and cognitive reserve with subsequent 19;305:261–266. [DOI] [PMC free article] [PubMed]
- 35.Okereke OI, Xia W, Selkoe DJ, Grodstein F. Ten–year change in plasma amyloid beta levels and late–life cognitive decline. Arch Neurol. 2009 doi: 10.1001/archneurol.2009.207. [DOI] [PMC free article] [PubMed] [Google Scholar]
- 36.Koyama A, Okereke OI, Yang T, Blacker D, Selkoe DJ, Grodstein F. Plasma amyloid–beta as a predictor of dementia and cognitive decline: a systematic review and meta–analysis. Arch Neurol. 2012 doi: 10.1001/archneurol.2011.1841. [DOI] [PMC free article] [PubMed] [Google Scholar]
- 37.Rembach A, Watt AD, Wilson WJ, et al. Plasma amyloid–beta levels are significantly associated with a transition toward Alzheimer's disease as measured by cognitive decline and change in neocortical amyloid burden. J Alzheimers Dis. 2014;40:95–104. doi: 10.3233/JAD-131802. 10.3233/JAD-131802 PubMed PMID: 24334723. [DOI] [PubMed] [Google Scholar]
- 38.Janelidze S, Stomrud E, Palmqvist S, et al. Plasma beta–amyloid in Alzheimer's disease and vascular disease. Sci Rep. 2016;6:26801. doi: 10.1038/srep26801. 10.1038/srep26801 PubMed PMID: 27241045, PMCID 4886210. [DOI] [PMC free article] [PubMed] [Google Scholar]
- 39.Shaw LM, Vanderstichele H, Knapik–Czajka M, et al. Cerebrospinal fluid biomarker signature in Alzheimer's disease neuroimaging initiative subjects. Ann Neurol. 2009:403–413. doi: 10.1002/ana.21610. [DOI] [PMC free article] [PubMed] [Google Scholar]
- 40.Toledo JB, Vanderstichele H, Figurski M, et al. Factors affecting Abeta plasma levels and their utility as biomarkers in ADNI. Acta Neuropathol. 2011 doi: 10.1007/s00401-011-0861-8. [DOI] [PMC free article] [PubMed] [Google Scholar]
- 41.Vanderstichele H, Van KE, Hesse C, et al. Standardization of measurement of beta–amyloid(1–42) in cerebrospinal fluid and plasma. Amyloid. 2000:245–258. doi: 10.3109/13506120009146438. [DOI] [PubMed] [Google Scholar]
- 42.Roher AE, Esh CL, Kokjohn TA, et al. Amyloid beta peptides in human plasma and tissues and their significance for Alzheimer's disease. Alzheimers Dement. 2009:18–29. doi: 10.1016/j.jalz.2008.10.004. [DOI] [PMC free article] [PubMed] [Google Scholar]
- 43.Poljak A, Crawford JD, Smythe GA, et al. The Relationship Between Plasma Abeta Levels, Cognitive Function and Brain Volumetrics: Sydney Memory and Ageing Study. Curr Alzheimer Res. 2016;13:243–255. doi: 10.2174/1567205013666151218150202. 10.2174/1567205013666151218150202 PubMed PMID: 26679856. [DOI] [PubMed] [Google Scholar]
- 44.Figurski MJ, Waligorska T, Toledo J, et al. Improved protocol for measurement of plasma beta–amyloid in longitudinal evaluation of Alzheimer's Disease Neuroimaging Initiative study patients. Alzheimers Dement. 2012:250–260. doi: 10.1016/j.jalz.2012.01.001. [DOI] [PMC free article] [PubMed] [Google Scholar]
- 45.Insel PS, Mattsson N, Mackin RS, et al. Biomarkers and cognitive endpoints to optimize trials in Alzheimer's disease. Clin Transl Neurol. 2015:534–547. doi: 10.1002/acn3.192. [DOI] [PMC free article] [PubMed] [Google Scholar]
Associated Data
This section collects any data citations, data availability statements, or supplementary materials included in this article.
Supplementary Materials
Appendix