

Abstract
Real-time functional magnetic resonance imaging (fMRI) neurofeedback is an experimental framework in which fMRI signals are presented to participants in a real-time manner to change their behaviors. Changes in behaviors after real-time fMRI neurofeedback are postulated to be caused by neural plasticity driven by the induction of specific targeted activities at the neuronal level (targeted neural plasticity model). However, some research groups argued that behavioral changes in conventional real-time fMRI neurofeedback studies are explained by alternative accounts, including the placebo effect and physiological artifacts. Recently, decoded neurofeedback (DecNef) has been developed as a result of adapting new technological advancements, including implicit neurofeedback and fMRI multivariate analyses. DecNef provides strong evidence for the targeted neural plasticity model while refuting the abovementioned alternative accounts. In this review, we first discuss how DecNef refutes the alternative accounts. Second, we propose a model that shows how targeted neural plasticity occurs at the neuronal level during DecNef training. Finally, we discuss computational and empirical evidence that supports the model. Clarification of the neural mechanisms of DecNef would lead to the development of more advanced fMRI neurofeedback methods that may serve as powerful tools for both basic and clinical research.
Keywords: Functional magnetic resonance imaging (fMRI), Decoded neurofeedback (DecNef)
1. Introduction
Real-time functional magnetic resonance imaging (fMRI) neurofeedback refers to a tool that provides participants with real-time feedback based on fMRI signals to modify participants’ behavior (Sitaram et al., 2017). This article reviews findings obtained from the use of a new real-time fMRI neurofeedback method, termed decoded neurofeedback (DecNef) (Shibata et al., 2011), and discusses how DecNef modifies neural mechanisms that subsequently result in behavioral changes.
DecNef has been developed by integrating recently advanced technologies of real-time fMRI neurofeedback, including implicit neurofeedback, and the introduction of an fMRI multivariate analysis to real-time fMRI neurofeedback (Shibata et al., 2011; Watanabe et al., 2017). In most conventional real-time fMRI neurofeedback studies, feedback is based on the overall mean amplitude of fMRI signals within a target brain region, and participants are provided with certain explicit strategies to effectively regulate their brain activities (deCharms et al., 2004, 2005; Scharnowski et al., 2012; Scheinost et al., 2013). On the other hand, DecNef induces specific fMRI signal patterns in a local and target brain region and changes a specific behavior without participants’ awareness of the purpose of the experiment (Amano et al., 2016; Cortese et al., 2016, 2017; Koizumi et al., 2016; Shibata et al., 2011, 2016b; Taschereau-Dumouchel et al., 2018). DecNef has been reported to change various behaviors, including visual sensitivity (Shibata et al., 2011), color perception (Amano et al., 2016), fear memory (Koizumi et al., 2016; Taschereau-Dumouchel et al., 2018), perceptual confidence (Cortese et al., 2016, 2017) and facial preference (Shibata et al., 2016b). Importantly, DecNef resulted in behavioral changes in a study using a double-blind procedure (Taschereau-Dumouchel et al., 2018).
Despite these successful results, the underlying neural mechanisms of DecNef remain unclear. For instance, some research groups argued that, at least in conventional real-time fMRI neurofeedback studies, the effects of neurofeedback training could be explained by the placebo effect or physiological artifacts (Thibault et al., 2016, 2017b, 2017a). Thus, in an attempt to obtain a comprehensive understanding of the neural mechanisms of DecNef, discussions and examinations of whether the neural and behavioral changes reported in the previous DecNef studies occurred due to DecNef training itself or other factors, including the placebo effect and physiological artifacts, are important. In this review, we propose the “targeted neural plasticity model” in which DecNef leads to plasticity at the neuronal level in a target brain region, which in turn causes behavioral changes.
First, we describe how the results of DecNef support the targeted neural plasticity model and refute alternative accounts, including the placebo effect and physiological artifacts. Second, we explain computational aspects of the model. In particular, we discuss how specific activities at the neuronal level are induced by neurofeedback signals that are generated at the voxel (a spatial unit of fMRI signals) level. Third, based on datasets obtained from previous DecNef studies (Amano et al., 2016; Cortese et al., 2016; Koizumi et al., 2016; Shibata et al., 2011, 2016b), we provide empirical evidence to support the model. Finally, we show the results of neural-network simulations based on the model and indicate how DecNef may selectively enhance specific activities at the neuronal level based on the feedback signal computed at the voxel level. Clarification of these mechanisms would further advance fMRI neurofeedback techniques as powerful neuroscientific tools.
2. How DecNef results support the target plasticity model
We propose the targeted neural plasticity model, in which DecNef induces specific target activities at the neuronal level in a target brain region and repetitive inductions of these activities cause plasticity, which in turn results in a specific behavioral change, to clarify how DecNef sequentially alters neural mechanisms and behaviors (Fig. 1, red arrows).
Fig. 1. Possible mechanisms by which DecNef induces changes in a target behavior.

In the targeted neural plasticity model (red arrows), the induction of specific target activities at the neuronal level by DecNef drives neural plasticity in a target region that is manifested as changes in a target behavior. In alternative accounts (blue arrows), various cognitive factors and physiological artifacts lead to changes in neuronal activities outside the target activities during fMRI neurofeedback training. In this case, changes in behaviors, if any, are not attributed merely to neural plasticity driven by induction of the targeted activities at the neuronal level in the target region. See also Table 1 for a detailed list of these alternative accounts.
We first outline the characteristics of DecNef and achievements of studies using DecNef (Amano et al., 2016; Cortese et al., 2016, 2017; Koizumi et al., 2016; Shibata et al., 2011, 2016b; Taschereau-Dumouchel et al., 2018). Next, we indicate the validity of this model while refuting alternative accounts.
2.1. Outline of DecNef
DecNef has been developed as a result of the integration of recently advanced technologies, including implicit neurofeedback and fMRI multivariate analysis. In the following sections, we describe each of these methodological aspects of DecNef.
2.1.1. Implicit neurofeedback
An implicit neurofeedback method provides participants with no explicit instructions to achieve better neurofeedback performance during fMRI neurofeedback training (Watanabe et al., 2017). This implicit neurofeedback differs from conventional methods in which participants are provided with guidance and/or certain explicit strategies to effectively regulate their fMRI signals. At the end of each trial of a neurofeedback training session, participants are presented with a number or a visual stimulus that reflects how well induced fMRI signals from the target brain region reflect a predetermined criterion. In an implicit neurofeedback method, participants are merely asked to make an effort to achieve better scores, without being informed of the purpose of the experiment, how the criterion has been determined or how to match induced fMRI signals to the criterion. According to recent studies, the implicit neurofeedback procedure works well and significant behavioral changes have occurred as a result of training with implicit neurofeedback (Amano et al., 2016; Cortese et al., 2016, 2017; Koizumi et al., 2016; Ramot et al., 2016; Sepulveda et al., 2016; Shibata et al., 2011, 2016b; Taschereau-Dumouchel et al., 2018). One advantage of implicit neurofeedback is that this type of feedback reduces or eliminates the possibility that a specific intention or explicit strategy influences changes in neural activity related to the intention or strategy and participants’ behavior (Watanabe et al., 2017).
2.1.2. Introduction of an fMRI multivariate analysis to neurofeedback
Real-time fMRI neurofeedback technologies have been greatly advanced as a result of introducing an fMRI multivariate analysis to neurofeedback. The fMRI multivariate analysis is a method to extract or decode certain information from fMRI signal patterns (Haxby et al., 2001; Haynes and Rees, 2005; Kamitani and Tong, 2005). For example, the multivariate analysis enables researchers to identify an orientation that is presented to a participant among different orientations based on fMRI signal patterns in the visual cortex with high accuracy (Haynes and Rees, 2005; Kamitani and Tong, 2005). The introduction of the multivariate analysis allows neurofeedback to obtain information about signal patterns in a target region (deBettencourt et al., 2015; La Conte et al., 2007; Shibata et al., 2011).
In a study by Shibata and colleagues (Shibata et al., 2011), neurofeedback training was conducted with feedback scores based on the multivariate signals of activations induced by exposure to a specific orientation. In the first stage, a decoder was constructed to classify an fMRI signal pattern into one of three different orientations using the multivariate method. Participants were exposed to each of the three orientations in an MRI scanner and fMRI signal patterns in the early visual cortex were measured. Based on the measured fMRI signal patterns, a machine-learning algorithm (Yamashita et al., 2008) computed a set of decoder weights for voxels in the early visual cortex to classify the fMRI signal patterns into one of the three orientations. In the second stage, one of the three orientations was selected as a target orientation for neurofeedback training. An fMRI signal pattern corresponding to the target orientation was defined as a target fMRI signal pattern. In the third stage, participants underwent real-time neurofeedback training to learn to achieve a larger feedback score. During this ‘induction’ stage, a measured fMRI signal pattern in the early visual cortex was input into the decoder in real time. Feedback scores reflected the output of the decoder that represents likelihood of the target orientation. In this type of neurofeedback training, a disk was presented to participants, and a size of the disk reflected feedback scores. Participants were instructed to increase the size of the disk to the greatest extent possible. By doing so, participants obtained feedback information based on a neural pattern in the target area, and repetitive feedback leads to plasticity related to the neural pattern.
2.2. Characteristics of DecNef
Here, we summarize the characteristics of DecNef.
2.2.1. Successful induction of fMRI signal patterns
Using DecNef, participants successfully learned to induce a target fMRI signal pattern in a target region (Amano et al., 2016; Cortese et al., 2016, 2017; Koizumi et al., 2016; Shibata et al., 2011, 2016b; Taschereau-Dumouchel et al., 2018). For example, DecNef training significantly increased the likelihood of the target orientation from fMRI patterns of activation in early visual areas, which was the targeted area (Shibata et al., 2011).
2.2.2. Locational specificity of induced fMRI signals
In DecNef studies, the induction of a target fMRI signal pattern is mostly confined to the targeted local cortical region (Amano et al., 2016; Cortese et al., 2016, 2017; Koizumi et al., 2016; Shibata et al., 2011, 2016b; Taschereau-Dumouchel et al., 2018). The location-specific induction of the target fMRI signal pattern was tested using a method termed leak analysis, which employs the logic described below. During DecNef training, the size of a feedback disk is based on the similarity between a current fMRI signal pattern and the target fMRI signal pattern in the target region. However, this procedure alone does not ensure that the induction of the target fMRI signal pattern is confined to the target region. In concert with the successful induction of the target pattern in the target region, fMRI signal patterns representing the induced information may occur in some other regions outside the target region during DecNef training. If the target pattern in the target region “leaked out” and induced the patterns representing the induced information in other regions, the fMRI signal patterns in those regions should be able to reconstruct the information related to the target patterns in the target region. In the aforementioned orientation DecNef study, the results of the leak analysis showed that fMRI signal patterns located outside the early visual cortex during DecNef training were not informative to estimate the likelihood of a target orientation computed from fMRI signal patterns within the early visual cortex (Shibata et al., 2011). Based on this result, orientation-related information did not leak from the early visual cortex to other regions outside the early visual cortex during orientation DecNef training.
Results of recent DecNef studies further supported this locational specificity (Amano et al., 2016; Shibata et al., 2016b). In these studies, significant information leakage from a target region to regions outside the target region occurred when participants were presented with actual visual stimuli (Amano et al., 2016) or asked to report their preferences to presented face stimuli (Shibata et al., 2016b). Thus, the information leak analysis possesses a sufficient power to sensitively detect information leak from the target region to other regions. However, during DecNef training, significant information leak to regions outside the target region has not been observed (Amano et al., 2016; Shibata et al., 2016b). The results of these two analyses further support the locational specificity during DecNef training. However, the absence of significance during DecNef training does not necessarily indicate an absence of the leak during DecNef training. Thus, a direct statistical comparison between the results of the two analyses will be necessary in future studies.
2.2.3. Specificity of behavioral changes
DecNef induces a specific behavioral change (Amano et al., 2016; Cortese et al., 2016, 2017; Koizumi et al., 2016; Shibata et al., 2011, 2016b; Taschereau-Dumouchel et al., 2018). For instance, in the orientation DecNef study, participants’ visual sensitivity was specifically improved for the target orientation, but not for nontarget orientations (Shibata et al., 2011). Since a specific pattern of behavior tends to be subserved by a certain neural activity pattern(s), DecNef is likely to induce specific activity pattern(s) at the neuronal level.
2.2.4. No awareness of the material to be learned
As mentioned above, during DecNef training, participants are largely unaware of the purpose of experiments and what feedback scores represent during DecNef training (Amano et al., 2016; Cortese et al., 2016, 2017; Koizumi et al., 2016; Shibata et al., 2011, 2016b; Taschereau-Dumouchel et al., 2018). This finding was confirmed by two observations. First, answers to the questionnaires administered after the entire DecNef procedure have shown that the explicit strategies participants thought they had employed during DecNef training generally were not related to the purpose of the experiment. Only two of the total number of 90 participants in the previous DecNef studies reported that they occasionally used a strategy related to a target stimulus during DecNef training. Second, even after participants were informed about the general purpose of the experiment, they were not able to specify exactly what they learned. In the orientation DecNef study (Shibata et al., 2011), after the end of the experiment, participants were informed of the general purpose of the experiment but not in as much detail regarding what orientation was supposed to be learned. Then, they were asked to choose which one of three different orientations they thought was supposed to be learned. The percentage of participants who chose the correct orientation was not significantly different from chance. These results have also been observed in other DecNef studies (Amano et al., 2016; Cortese et al., 2016, 2017; Koizumi et al., 2016; Shibata et al., 2016b; Taschereau-Dumouchel et al., 2018). Based on these findings, DecNef changes participants’ behavior in a targeted fashion without participants’ knowledge of the target material to be learned.
This implicit nature of DecNef is potentially suitable for avoiding the aversive natures of conventional therapeutic methods, such as prolonged exposure therapy that aims to reduce the mental distress from which a patient suffers. A problem with exposure therapy is that the therapy requires the patient to remember an incident associated with the distress, causing a high rate of dropout from therapy (Schnurr et al., 2007). However, because the participants were unaware of the purpose of the DecNef experiments, DecNef would be particularly effective on reducing distress (Watanabe et al., 2017). For instance, DecNef induces a target fMRI signal pattern that represents a certain visual stimulus related to fearful experiences without evoking participants’ fear responses to the aversive stimulus (Koizumi et al., 2016), at least partially because DecNef did not present the aversive stimulus.
2.2.5. Replication of DecNef results using a double-blind procedure
The abovementioned reduction in fear responses by DecNef have been replicated in another DecNef experiment that included a double-blind procedure (Taschereau-Dumouchel et al., 2018). In a double-blind procedure, neither participants nor experimenters were informed of which condition or group a participant was assigned (Linden and Turner, 2016; Thibault et al., 2017a, 2017b). This procedure excludes the possibility that observed fMRI signals and resulting behavioral changes are attributed to the placebo effect and/or specific experimental biases when participants guess the purpose of the experiment. Thus, the replication of the reduction in fear responses with the double-blind procedure indicates that the placebo effect and experimental biases are unlikely to explain the reduction in fear responses.
Notably, the standard DecNef and double-blind DecNef techniques utilize basically the same experimental procedure, except for the double-blind procedure to ensure that both participants and experimenters were unaware of the purpose of the experiment. Thus, this replication of the reduction in fear responses through the double-blind DecNef experiment suggests that the same or similar mechanisms underlie learning induced with the standard DecNef and double-blind DecNef methods.
2.3. DecNef refutes alternative accounts to the targeted neural plasticity model
The targeted neural plasticity model assumes that real-time fMRI neurofeedback changes behaviors due to neural plasticity by inducing specific activities at a neuronal level. However, a research group has suggested that changes in fMRI signals and behaviors reported in conventional fMRI neurofeedback studies are reflected by other mechanisms than targeted neural plasticity (Thibault et al., 2016, 2017b, 2017a). In conventional fMRI neurofeedback studies, participants were provided with explicit cognitive strategies that enabled them to effectively regulate fMRI signals in a target region (deCharms et al., 2004, 2005; Scharnowski et al., 2012; Scheinost et al., 2013). In addition, in most cases, feedback signals reflected the overall fMRI amplitudes averaged over voxels within a target brain region or a difference in the overall amplitudes between the target and other regions (deCharms et al., 2004, 2005; Scharnowski et al., 2012; Scheinost et al., 2013; Sepulveda et al., 2016; Weiskopf et al., 2003). Under such experimental settings, various factors, including the placebo effect and physiological artifacts, may influence fMRI signals and behaviors (Table 1; see Thibault et al., 2017b for a systematic review). In other words, behavioral changes observed in the conventional fMRI neurofeedback studies might not be due to the induction of neural activities that were targeted during neurofeedback training (Fig. 1, blue arrows). This criticism has prompted alternative accounts than the targeted neural plasticity model that have been proposed to explain the results of conventional fMRI neurofeedback studies (Thibault et al., 2017a, 2017b). In this section, we summarize each of these accounts and conclude that none of these accounts applies to DecNef.
Table 1.
Real-time fMRI neurofeedback methods and possible accounts of results obtained by each of the methods. In conventional fMRI neurofeedback methods, participants were provided with explicit cognitive strategies so that the participants could effectively regulate fMRI signals in a target region. In addition, in most cases feedback signals reflected the overall fMRI amplitudes averaged over voxels within the target brain region or a difference in the overall amplitudes between the target region and another control region. 〇 : this account may explain results, △: this account unlikely explains results, ×: this account is impossible to explain results.
 |
2.3.1. Effects of conscious strategy
In conventional fMRI neurofeedback studies, participants are instructed to use a certain explicit strategy in order to regulate fMRI signals in a target region (deCharms et al., 2004, 2005; Scharnowski et al., 2012; Scheinost et al., 2013). However, this procedure raises the possibility that neural activities in the target region contain the activities related to the strategy itself. Namely, if participants explicitly use a specific strategy during fMRI neurofeedback training, it may activate neurons outside and inside the target region. Neuronal activities outside the target region might lead to behavioral changes.
However, this outcome is unlikely to occur with DecNef in which implicit neurofeedback is used and participants remain unaware of the purpose of the experiments during training (see Section 2.2.4 for details).
2.3.2. Cardiorespiratory artifact
Respiration influences fMRI signals (Thibault et al., 2017b). Cardiorespiratory changes cause a global increase or decrease in fMRI signal amplitudes (Abbott et al., 2005; Kastrup et al., 1999). Thus, one possibility is that induced changes in fMRI signals are not due to changes in neural activity but to cardiorespiratory regulation that participants implicitly learned to induce during fMRI neurofeedback training.
However, the cardiorespiratory artifact is highly unlikely to account for the results of DecNef. As discussed above (Section 2.2.1), DecNef allows participants to induce a fine-grained fMRI signal pattern in a local brain region. The induction of localized fMRI signal patterns is not caused by cardiorespiratory regulation that leads to global changes in fMRI signal amplitudes. Furthermore, cardiorespiratory artifacts are unlikely to cause behavioral changes, including the increased sensitivity to a specific target orientation (Shibata et al., 2011).
2.3.3. Leakage of neuronal activities from a target region to other regions
Another possibility is that the induced neuronal activities would leak out from the target region and activate specific neurons outside the target region. If this possibility is true, then subsequent behavioral changes may be interpreted as resulting from neural plasticity that occurred outside the target region.
However, this possibility was refuted by a number of DecNef studies (Amano et al., 2016; Cortese et al., 2016, 2017; Koizumi et al., 2016; Shibata et al., 2011, 2016b; Taschereau-Dumouchel et al., 2018). First, induced fMRI signal patterns are largely confined to a target region (Section 2.2.2). Second, behavioral changes are highly correlated with induced fMRI signal patterns in the target region (Section 2.2.3). These results are consistent with our model that DecNef activates specific neurons and induces neural plasticity in the target region.
2.3.4. Experimenter effect
An experimenter effect refers to an experimental artifact in which participants consciously or unconsciously aim to produce the results that meet their presumption of the experimenter’s expectations (Kennedy and Taddonio, 1976). In conventional fMRI neurofeedback studies, experimenters typically determine to which condition and/or experimental group each participant is assigned. In this procedure, experimenter effects may occur; participants may try to employ specific strategies based on what they think experimenters expect them to do.
However, DecNef results are highly unlikely to be contaminated by the experimenter effect. Notably, in the DecNef studies, participants remained unaware of the purpose of the experiment (Section 2.2.4) and behavioral changes were still obtained in the DecNef experiment using the double-blind procedure (Section 2.2.5). Under these experimental conditions, participants would not have the opportunity to determine the experimenter’s expected results.
2.3.5. Use of a specific strategy without awareness
One may argue that participants use a specific strategy without being aware of using the strategy. Without the instruction to use explicit strategies (Section 2.3.1), first, participants might somehow manage to notice the true workings of fMRI neurofeedback training and develop a strategy that closely matches the target behavior. Second, if participants were unaware of the use of the strategy or forgot that they had used the strategy during fMRI neurofeedback training, it may not be reported in a postexperiment questionnaire. In this case, changes in behaviors might occur due to the use of this type of unconscious strategy.
This account is also highly unlikely to explain the results of DecNef studies. First, with an implicit neurofeedback method, participants would not be likely to determine the true purpose of DecNef experiments and therefore to develop an effective conscious or unconscious strategy for DecNef training. Second, a recent DecNef study using the double-blind procedure (Taschereau-Dumouchel et al., 2018) replicated the reduction in fear responses reported in a DecNef study that did not use the double-blind procedure (Koizumi et al., 2016). The same result from the double-blind experiment further reduces the probability that participants used a specific strategy that led to the behavioral changes after DecNef training. Third, the use of an effective strategy, if any, should lead to better neurofeedback scores, and this successful experience of an association between the effective strategy and better neurofeedback scores should be clearly remembered by participants. However, participants’ reports on their strategies were not related to the true workings of the experiment (Section 2.2.4). Thus, it is unlikely that participants used a specific strategy during DecNef training.
The five accounts mentioned above are highly unlikely to explain the results of DecNef. Yet, DecNef leads to a specific change in a target behavior, but not in nontarget behaviors (Section 2.2.3) (Amano et al., 2016; Cortese et al., 2016, 2017; Koizumi et al., 2016; Shibata et al., 2011, 2016b; Taschereau-Dumouchel et al., 2018). All of these findings are consistent with the targeted neural plasticity model and refutes all of the other accounts discussed above.
3. Proposed mechanisms of targeted neural plasticity
How does targeted neural plasticity occur through DecNef? As discussed above, during DecNef training, the induction of specific target activities at the neuronal level in a target region is likely to cause neural plasticity that is manifested as changes in behavior.
In this section, we first introduce a prerequisite and an assumption by which DecNef may critically achieve the target neural plasticity. The proposed reinforcement learning characteristics necessitate a low dimensionality of neuronal activities. Furthermore, a target neuronal activity is included in the spontaneous neuronal activities of a target region from the beginning of the induction stage. Next, we discuss the computational plausibility of the prerequisite and assumption. Third, we discuss how the target neural plasticity model built based on the prerequisite and assumption (Fig. 2) resolves possible computational issues in DecNef.
Fig. 2.
Schematic of the proposed model of targeted neural plasticity through DecNef.
3.1. Reinforcement learning based on feedback signals during DecNef
How does the brain learn to induce specific target activities at the neuronal level based on feedback signals during DecNef training? Since DecNef is a type of learning in the brain, it should follow at least one of the three learning principles: unsupervised, supervised and reinforcement learning (Doya, 1999). Unsupervised learning is driven by the principle of an increased probability of previous activities based on external sensory inputs, including visual stimuli. Supervised learning is based on the principle that neural activities are modified toward exact target activities as teaching signals. Reinforcement learning occurs by the modification of neural activities such that specific neuronal activities become more likely to occur when the activities are correlated with a reward.
First, unsupervised learning does not match the DecNef procedures. As described above, unsupervised learning is driven by external sensory inputs including visual stimuli that are intended to be learned during DecNef training. However, these external inputs are not presented to participants during DecNef training. A feedback signal about the success of DecNef induction, which is visually presented to participants in the form of the size of a disk, is not designed to contain any information related to the stimulus (e.g., orientation, color, or preference) to be learned.
Second, supervised learning may not occur through DecNef either. As described above, supervised learning requires target neuronal activities that are presented to participants as teaching signals. A feedback signal presented to participants during DecNef training represents a single scalar value, not a target neural activity itself. Thus, the feedback does not work as a teaching signal for supervised learning.
While the two aforementioned types of learning principles are not driving factors of DecNef, the principle of reinforcement learning seems to fit well with DecNef. During DecNef experiments, a monetary reward is given to participants in proportion to a feedback score based on an fMRI signal pattern in a target region. Thus, the feedback score is regarded as a reward and serves as a reinforcement factor (Fetz, 1969; Haruno and Kawato, 2006; Haruno et al., 2004; Rosenfeld et al., 1969). Reward-driven learning specifically enhances target neuronal activities among other nontarget activities. Thus, a reasonable assumption is that targeted neural plasticity induced by DecNef occurs through reinforcement learning.
3.2. Low dimensionality of neuronal activities
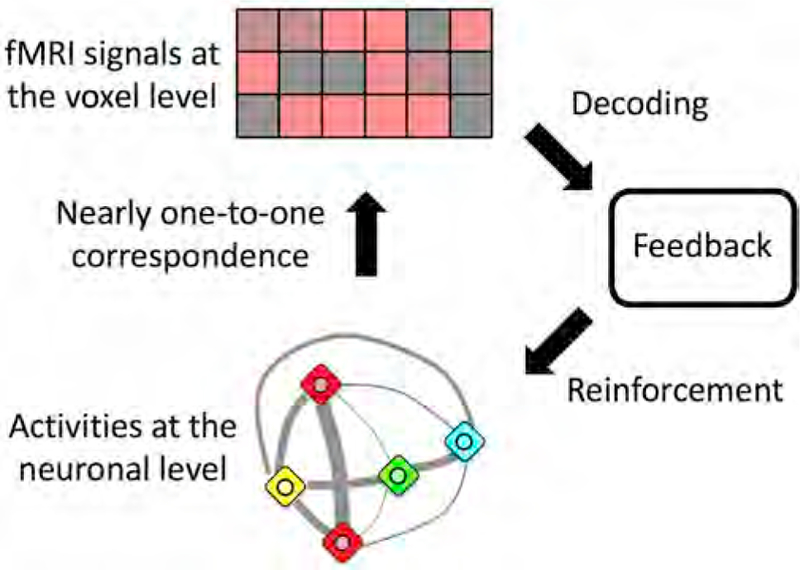
One question is how the induction of target activities at the neuronal level occurs based on feedback signals computed at the voxel level. Since each voxel typically represents activity signals from millions of neurons, logically, the same fMRI signal pattern measured at the voxel level can be generated from a large number of different patterns of neuronal activities. Therefore, a one-to-many correspondence from an fMRI activity pattern to neuronal activity patterns may exist. In addition, only a subset of neuronal activities from the entire space of possible neuronal activities may be related to a target behavior. This mapping issue has prompted some researchers to postulate that the manipulation of fMRI signal patterns at the voxel level does not induce a specific pattern of target activities at the neuronal level (Huang, 2016).
However, this potential ill-posed problem caused by the one-to-many correspondence is unlikely to occur in the processing of information by the brain (Watanabe et al., 2017). Some principles of brain processing have recently been shown to function as constraints to resolve or loosen the one-to-many correspondence issue. Neuronal activities do not occur randomly because of abundant synaptic connections among neurons (Blumenfeld et al., 2006; Goldberg et al., 2004). Physiological studies have shown that spontaneous activities of neurons in a brain subsystem are strongly correlated and constrained on a particular low-dimensional manifold (Berkes et al., 2011; Kenet et al., 2003; Luczak et al., 2009; Mochol et al., 2015; Renart et al., 2010; Ringach, 2009; Sadtler et al., 2014). If neuronal activities are constrained on a low-dimensional manifold, fMRI signal patterns should also be constrained on a low-dimensional manifold at the voxel level. These constraints would make the ill-posed problem due to the one-to-many correspondence unlikely.
3.3. Inclusion of target neuronal activities in spontaneous neuronal activities
How are specific target activities induced at the neuronal level in a target region during DecNef training? According to the procedure of the decoder construction stage of DecNef experiments (see Section 2.1.2 for details), target activities at the neuronal level should be determined based on specific sensory stimuli or tasks in the decoder construction stage. However, during DecNef training in the induction stage, participants are not presented with the stimuli or asked to perform the tasks. Thus, the target activities must be induced without the stimuli or tasks. If the target activities do not overlap with neuronal activities that initially occur in the induction stage, the brain should not easily be able to increase the contributions of the target neuronal activities in the target region during DecNef training (Sadtler et al., 2014).
Importantly, the results of recent physiological studies suggest an overlap between spontaneous neuronal activities and activities evoked by the presentation of sensory stimuli or performance of certain tasks (Luczak et al., 2009; Sadtler et al., 2014). Specifically, as shown in the study by Sadtler et al., animals more effectively learn to induce target activities of neurons when the target activities are included in a repertoire of activities of those neurons at the beginning of training.
Thus, to enable efficient learning of induction of target neuronal activities it is reasonable to assume that the target neuronal activities are included in neuronal activities present at the beginning of DecNef training.
3.4. Mechanisms of targeted neural plasticity
The abovementioned prerequisite and characteristics delineate possible mechanisms of targeted neural plasticity as described below. First, the induction of target activities at the neuronal level in a target region occurs without performance of a task or presentation of sensory stimuli that evoke the target activities because spontaneous activities already include target activities (Section 3.3). Second, the low dimensionality of activities at the neuronal level in a target region (Section 3.2) enables the induction of target activities at the neuronal level based on feedback signals computed at the voxel level. Third, due to reinforcement learning (Section 3.1), repetitive pairing of the induction of the target neuronal activities and monetary reward (i.e., larger feedback score) drives neural plasticity in the region. These plastic changes at the neuronal level eventually manifest as changes in a target behavior.
3.5. Resolution of the curse of dimensionality
The proposed mechanisms of the model may lead to the resolution of the potential computational problem in DecNef training. While a feedback score presented during DecNef training is one-dimensional scalar value (i.e., the size of a disk), a target region typically contains several hundred or more voxels that would result in a huge number of possible fMRI signal patterns. This large voxel space could pose a problem called the curse of dimensionality in the context of reinforcement learning; the number of potential fMRI signal patterns would be too large for participants to complete a search for inducing a target fMRI signal pattern within a period of DecNef training (Huang, 2016). However, in the DecNef studies, participants often showed significant induction learning within a few hundred trials (Amano et al., 2016; Shibata et al., 2011, 2016b), indicating that the curse of dimensionality does not realistically apply to DecNef.
How does DecNef circumvent the curse of dimensionality? Based on the prerequisite we identified, fMRI signal patterns should be constrained on a low-dimensional manifold due to the low dimensionality of neuronal activities. Then, the curse of dimensionality should not be a problem since the number of possible fMRI signal patterns is substantially reduced (Watanabe et al., 2017).
In addition to the low dimensionality of fMRI signal patterns, another reason why the curse of dimensionality should not apply to DecNef has been identified (Watanabe et al., 2017). Functions used as decoders in the DecNef studies are either pseudolinear (Amano et al., 2016; Cortese et al., 2016, 2017; Koizumi et al., 2016; Shibata et al., 2011; Taschereau-Dumouchel et al., 2018) or linear (Shibata et al., 2016b) and monotonically increasing functions. In this case, it is possible to calculate an error signal for each voxel within a target region (see Appendix A for details). Thus, using these decoders, reinforcement learning to induce a specific fMRI signal pattern is simplified to learning that induces a certain fMRI signal amplitude in each voxel. In other words, using linear functions as decoders, the search for inducing the specific pattern is no longer required (Watanabe et al., 2017).
4. Empirical support for the proposed model
In this section, we introduce experimental support for the characteristics, prerequisite, major prediction, and assumption of the targeted plasticity model. For this purpose, we reanalyzed fMRI datasets obtained from five previous DecNef studies (Amano et al., 2016; Cortese et al., 2016; Koizumi et al., 2016; Shibata et al., 2011, 2016b). First, we show the results of the reanalyses that support the main characteristics, prerequisite and assumption: reinforcement learning, low dimensionality of neuronal activities and inclusion of target neuronal activities in spontaneous neuronal activities in a target region (Section 4.1–4.3). Then, we show that changes in fMRI signal patterns as a result of DecNef training are consistent with the major prediction of the model (see Section 4.4).
4.1. Experimental support for the reinforcement learning characteristics
In this section, we provide experimental support for the reinforcement learning characteristics (see Section 3.1 for details).
4.1.1. Responses of reward-related brain regions to feedback scores during DecNef training
If targeted neural plasticity through DecNef occurs based on reinforcement learning, neural circuits that have been implicated in reward processing should be activated by feedback signals during DecNef training. In particular, fMRI signal amplitudes in reward-related regions, including the ventral striatum and putamen (Haruno and Kawato, 2006), should be correlated with the size of feedback signals.
We conducted a standard general linear model (GLM) analysis (Paulesu et al., 1995; see Appendix B for details) on a combined dataset from 73 participants in the five DecNef studies to test this hypothesis (Amano et al., 2016; Cortese et al., 2016; Koizumi et al., 2016; Shibata et al., 2011, 2016b). Notably, the datasets from 17 participants in a recent DecNef study (Taschereau-Dumouchel et al., 2018) were not included in this analysis since this study had not been published when we started the analysis. According to the results of the GLM analysis, the size of the feedback disk was significantly correlated with fMRI amplitudes in response to the presentation of the disk in the ventral striatum, putamen and medial prefrontal cortex (Fig. 3A; two-tailed one-sample t-test, P < 0.05 after Bonferroni correction for multiple comparisons across voxels), all of which have been suggested to be related to reward-related processing (Behrens et al., 2007; Haruno and Kawato, 2006). This result is consistent with the hypothesis.
Fig. 3. Results of the GLM analysis of datasets obtained from DecNef studies.

(A) Responses to the feedback disk during DecNef training. In the colored voxels, fMRI signal amplitudes in response to the disk were significantly correlated with the size of the disk (two-tailed one-sample t-test, P < 0.05 after Bonferroni correction; see Appendix B for details of the analysis). (B) Activation observed during the induction period in which participants were asked to regulate brain activation. The colored voxels showed significant increases in the fMRI signal amplitude during the induction period (two-tailed one-sample t-test, P < 0.05 after Bonferroni correction).
4.1.2. Overlaps among brain networks of conventional fMRI neurofeedback, DecNef and brain-machine interfaces
It has been suggested that reinforcement learning also plays a role in the training on conventional fMRI neurofeedback and brain-machine interfaces (Emmert et al., 2016; Kasahara et al., 2015; Papageorgiou et al., 2013; Sitaram et al., 2017). During training on conventional fMRI neurofeedback, brain-machine interfaces and DecNef, participants are required to learn to induce target neural activities based on feedback signals. If reinforcement learning is a common principle for conventional fMRI neurofeedback, brain-machine interfaces and DecNef, overlaps are predicted to occur between brain networks involved in DecNef training and networks that have been suggested to be involved in conventional fMRI neurofeedback and brain-machine interfaces. We conducted the GLM analysis to specify regions that are activated during the induction period in which participants were asked to regulate their brain activities to test this prediction.
Significant increases in fMRI signal amplitudes were observed in the insular, cerebellum, supplementary motor area, posterior parietal cortex and dorsal striatum during the induction period (Fig. 3B; two-tailed one-sample t-test, P < 0.05 after Bonferroni correction for multiple comparisons across voxels). Importantly, different target regions (early visual, cingulate, parietal and frontal cortices) were used across the five DecNef studies. Thus, the abovementioned regions were significantly activated, regardless of which brain region was selected as a target region during DecNef training. In addition, these regions are included in the network that has been suggested to be involved in neurofeedback and brain-machine interfaces (Emmert et al., 2016; Kasahara et al., 2015; Papageorgiou et al., 2013; Sitaram et al., 2017). Based on these results, the induction of neural activities through DecNef shares a common neural basis with the learning of conventional neurofeedback and brain-machine interfaces.
4.2. Experimental support for the low dimensionality prerequisite
The low dimensionality prerequisite (see Section 3.2 for details) indicates that activities at the neuronal level in a target region are constrained to a low-dimensional manifold due to abundant synaptic connections among neurons. As described in Section 3.2, the low dimensionality of neuronal activities also constrains fMRI signal patterns at the voxel level on a low-dimensional manifold. This low dimensionality is the prerequisite for efficient reinforcement learning (see Section 3.5). Thus, according to the low dimensionality prerequisite, the fMRI signal patterns in target regions are not random, but highly structured, and therefore, low-dimensional.
We reanalyzed fMRI signal patterns in the target regions in each of the five DecNef studies to test this hypothesis (Amano et al., 2016; Cortese et al., 2016; Koizumi et al., 2016; Shibata et al., 2011, 2016b) using the principal component analysis (PCA). PCA quantifies the components of fMRI signal patterns (Behroozi et al., 2011; Shibata et al., 2016a) (see Appendix C for examples of PCA results for individual participants). In particular, we used a proportion of principal components (PCs) that account for 80% of the data variance (PC80%) (Mazzucato et al., 2016) as an estimate of dimensionality of fMRI signal patterns. This threshold of 80% has frequently been employed in other studies using PCA (Varmuza and Filzmoser, 2009; Zuur et al., 2007). If 80% of PCs is necessary to account for 80% of the variance in fMRI signal patterns, we predict that fMRI signal patterns are close to random, and therefore, high-dimensional. If the proportion of PCs accounting for 80% of data variance is significantly less than 80%, we presume that fMRI signal patterns are not random, but low-dimensional.
First, PCA was applied to fMRI signal patterns measured in the induction stages of each DecNef experiment. In the orientation DecNef study, for instance, (Shibata et al., 2011), PC80% was significantly less than 80% in the induction stage (two-tailed one-sample t-test, P < 10−9; Fig. 4A, red bar). The same pattern of statistical results was obtained in the other four DecNef studies (Fig. 4B–E, red bars). Thus, fMRI signal patterns in the target regions during DecNef training were not random, but well structured, and thus low-dimensional.
Fig. 4. PCA results.

(A) Results from an analysis of the data reported by Shibata et al., in 2011 in which the early visual cortex (V1 and V2) was targeted. (B) Results from an analysis of the data reported by Amano et al., in 2016 in which the early visual cortex (V1 and V2) was targeted. (C) Results from an analysis of the data reported by Koizumi et al., in 2016 in which the early visual cortex (V1 and V2) was targeted. (D) Results from an analysis of the data reported by Shibata et al., in 2016 in which the cingulate cortex was targeted. (E) Results from an analysis of the data reported by Cortese et al., in 2016 in which the parietal and frontal cortices were targeted. (F) Summary of the five studies. The red and blue bars represent the results of the induction and decoder construction (DC) stages, respectively. The magenta bars show the results of the PCA in which transformation loadings were computed from fMRI data in the DC stage and proportions of PCs accounting for 80% of the variance (PC80%) were calculated from fMRI data obtained from the entire period of the induction stage (DC → Induction PCA). The results of the DC → Induction PCA indicate that if PC80% is significantly less than 80%, fMRI signal patterns in the Induction stage contain subcomponents of fMRI signal patterns in the DC stage. In all PCAs for each study, PC80% was significantly less than 80% (two-tailed one-sample t-test, P < 10–4). Black lines in the box plots represent median values. Areas with darker colors indicate 95% confidence intervals and areas with lighter colors indicate 1 SD. Gray dots show individual data points.
Second, PCA was applied to fMRI signal patterns obtained from the decoder construction (DC) stage in the same way as described above. In the orientation DecNef study (Shibata et al., 2011), PC80% was also significantly less than 80% in the DC stage (two-tailed one-sample t-test, P < 10−8; Fig. 4A, blue bars). Basically the same pattern of statistical results was obtained in the other four DecNef studies (Fig. 4B–E, blue bars). These results satisfy the prerequisite that fMRI signal patterns in a target region of DecNef are constrained to a low-dimensional manifold.
4.3. Experimental support for the target neuronal activities included in neuronal activities existing at the beginning of DecNef training
In this section, we provide experimental support for the model characteristic that target neuronal activities are already included in neuronal activities existing at the beginning of DecNef training (see Section 3.3 for details). If this prerequisite is satisfied in DecNef training, the inclusion of the target activities in activities recorded during DecNef training should be reflected in relationships between fMRI signal patterns in the DC and induction stages of DecNef experiments. In particular, we tested two predictions derived from this prerequisite, as detailed below.
4.3.1. FMRI signal patterns in the induction stage contain subcomponents of fMRI signal patterns in the DC stage
In DecNef experiments, a target fMRI signal pattern in a target brain region in the induction stage is determined by a decoder while utilizing fMRI signal patterns measured in the DC stage (Section 2.1.2). In the subsequent induction stage, the target fMRI signal pattern is induced. Thus, it is expected that fMRI signal patterns in the induction stage as a whole contain subcomponents of fMRI signal patterns in the DC stage.
We tested this core assertion of the target neural plasticity model by performing the analysis described below. First, PCs and transformation loadings were computed based on fMRI signal patterns recorded in the DC stage. Second, the transformation loadings were applied to fMRI signal patterns obtained from all training days during the induction stage. We call this method the DC → Induction PCA. If less than 80% of PCs in the DC stage is necessary to account for 80% of the variance in fMRI signal patterns measured in the induction stage, we assert that fMRI signal patterns in the induction stage contain subcomponents of fMRI signal patterns in the DC stage.
For the orientation DecNef study, PC80% was significantly less than 80% (two-tailed one-sample t-test, P < 10−4; Fig. 4A, magenta bar). The same statistical tendencies of results of the DC → Induction PCA were also obtained for the other four studies (Fig. 4B–E, magenta bars). These results are consistent with the major assertion of the target neural plasticity model.
4.3.2. A target pattern is contained in fMRI signal patterns in the induction stage from the beginning of DecNef training
The results obtained in the above sections support the major assertion that target neuronal activities are induced in neuronal activities recorded over the entire course of DecNef training. However, we have not yet determined whether a target fMRI pattern is included in fMRI signal patterns from the beginning in the induction stage. If the answer is no, the aforementioned results would indicate that the target pattern was newly generated by DecNef training during the induction period.
We conducted another analysis to clarify whether a target fMRI pattern occurs from the beginning in fMRI signal patterns in the induction stage. First, PCs and the transformation loadings were computed based on fMRI signal patterns recorded on each day of the induction stage. Second, the transformation loadings were applied to fMRI signal patterns in the DC stage. We call this method the day-by-day Induction → DC PCA. This day-by-day Induction → DC PCA represents the extent to which the PCs in each day of the induction stage account for the variance in the fMRI data in the DC stage. If DecNef training newly generated the target fMRI signal pattern that was not contained in the fMRI signal patterns at the beginning in the induction stage, this newly generated pattern should result in changes in a PC space that in turn lead to significant decrease in the proportion of PCs of day-by-day induction stage that account for 80% of the data variance in the DC stage.
We applied the day-by-day Induction → DC PCA to fMRI data obtained in the orientation DecNef study (Shibata et al., 2011). Since this study utilized the longest training period (10 days) among the previous DecNef studies, we should be able to detect any potential changes in PC80% that occurred during the 10 days of the induction stage. However, we did not observe significant changes in PC80% between Day 1 and Day 10 (Fig. 5A). This result contrasts the alternative possibility that the target pattern was newly generated by DecNef training. Thus, a target fMRI pattern is already included in fMRI signal patterns existing from the beginning of the induction stage. Collectively, these results are consistent with the characteristics of the model in which target neuronal activities are included in neuronal activities present at the beginning of DecNef training.
Fig. 5. PCA results across the 10 training days.

(A) The results of the Induction → decoder construction (DC) PCA for each of the 10 days during DecNef training in the study by Shibata et al. published in 2011. Transformation loadings were computed based on fMRI data obtained from each of the 10 days during the induction stage, and the transformation loadings were applied to fMRI data in the DC stage. No significant change in the proportions of PCs accounting for 80% of the variance (PC80%) was found. (B) The results of the DC → Induction PCA. A trend toward a decrease in PC80% on Day 10 was observed compared to Day 1 (one-tailed paired t-test, P = 0.056). (C) An additional analysis of data shown in (B). The PCs included in PC80% were classified into top and bottom halves according to contributions to orientation decoding (see the text for details). A significant increase in the variance accounted for (VAF) by the top-half PCs was observed on Day 10 compared to Day 1 (green; one-tailed paired t-test, P = 0.037). The exact opposite change was observed in VAF by the bottom-half PCs (black). This opposite change occurred because a total VAF by the top- and bottom-half PCs should always be 80%. Shaded areas represent SEM.
4.4. Experimental support for the major prediction of the model
As described in Section 3.4, the results of DecNef experiments are explainable by the mechanisms of the targeted neural plasticity model. Namely, repetitive inductions of specific target neuronal activities in a target region drive neural plasticity, which in turn leads to behavioral changes. If so, it can be hypothesized that DecNef renders changes in fMRI signal patterns in the induction stage closer to a target fMRI signal pattern. In other words, fMRI signal patterns in a target region should contribute to the target pattern during DecNef training to a greater extent. We again focused on the orientation DecNef study (Shibata et al., 2011) that employed the longest training period (10 days) among the previous DecNef studies to test this major prediction of the model.
We tested this prediction using two steps (Steps 1 and 2). In Step 1, we tested whether fMRI signal patterns observed in the induction stage contained more subcomponents of fMRI signal patterns recorded in the DC stage after DecNef training compared to the beginning of DecNef training. In Step 2, we tested if the increased subcomponents are related to orientation information.
For Step 1, we conducted the DC → Induction PCA (see Section 4.3.1 for details) on a daily basis. The transformation loadings computed based on fMRI data in the DC stage were applied to fMRI signal patterns obtained on each of the 10 days in the induction stage. PC80% reflects the proportion of PCs in the DC stage that is necessary to account for 80% of the variance in fMRI signal patterns on each day of the induction stage. Thus, a significant decrease in PC80% during the induction stage would indicate that fMRI signal patterns in the induction stage contain more subcomponents of fMRI signal patterns in the DC stage as a result of DecNef training. The results of the day-by-day DC → Induction PCA showed a decrease in PC80% on Day 10 compared to Day 1, with a probability close to a significance threshold (one-tailed paired t-test, P = 0.056; Fig. 5B).
In Step 2, we tested whether the decrease in PC80% is explained by changes in PCs that contain orientation information about visual stimuli and contribute to the decoding of orientations. As mentioned above, the orientation DecNef study was aimed at enhancing the orientation processing of a target orientation in the target region (the early visual cortex). The results of Step 1 are consistent with the prediction that fMRI signal patterns in the induction stage became closer to an fMRI signal pattern that represent the target orientation. We divided the PCs included in PC80% (Fig. 5B) into the top and bottom halves according to the extent to which each PC contributed to orientation decoding to further test this prediction. The contribution of each PC was quantified by calculating the absolute value of the inner product between the transformation loading vector and the weights of the decoder on voxels in the target region for each participant. If the changes in fMRI signal patterns in the induction stage are specifically due to changes in the orientation-related PCs, the variance accounted for (VAF) by the top-half PCs should specifically increase during the induction period. As predicted, the VAF by the top-half PCs was significantly greater on Day 10 than on Day 1 (Fig. 5C, green; one-tailed paired t-test, P = 0.037).
These results are consistent with the major prediction of the model that as participants learn during DecNef training, fMRI signal patterns in a target region change in a manner approaching a target fMRI signal pattern to a greater degree.
4.5. Complementary analyses
While the PCA results shown above are consistent with the characteristics, prerequisite, major prediction, and assumption of the model, some researchers may wonder about the robustness and validity of the results, depending on specific details of the analysis methods (PC80%) shown in Sections 4.2–4.4. Thus, we conducted new analyses that are complementary to PC80%. First, the results of PCA were replicated with a different method (Figs. 6 and 7). Second, we excluded the possibility that the differences in the results of the DC → Induction PCA and Induction → DC PCA (Fig. 5A, B, 7A and 7B) were due to differences in fMRI signal qualities between the DC and induction stages.
Fig. 6. The results of the PCA based on the complementary method (VAF by the top 10% of PCs).

(A) Results from an analysis of the data reported by Shibata et al., in 2011 in which the early visual cortex (V1 and V2) was targeted. (B) Results from an analysis of the data reported by Amano et al., in 2016 in which the early visual cortex (V1 and V2) was targeted. (C) Results from an analysis of the data reported by Koizumi et al., in 2016 in which the early visual cortex (V1 and V2) was targeted. (D) Results from an analysis of the data reported by Shibata et al., in 2016 in which the cingulate cortex was targeted. (E) Results from an analysis of the data reported by Cortese et al., in 2016 in which the parietal and frontal cortices were targeted. (F) Summary of the five studies. The red and blue bars represent the results of the induction and decoder construction (DC) stages, respectively. The magenta bars show the results of the PCA in which transformation loadings were computed from fMRI data in the DC stage and VAF by the top 10% of PCs was calculated from fMRI data obtained from the entire period of the induction stage (DC → Induction PCA). The results of the DC → Induction PCA indicate that if the VAF by the top 10% of PCs is significantly greater than 10%, fMRI signal patterns in the Induction stage contain subcomponents of fMRI signal patterns in the DC stage. In all PCAs for each study, VAF by the top 10% of PCs was significantly greater than 10% (two-tailed one-sample t-test, P < 10–5). Black lines in the box plots represent median values. Areas with darker colors indicate 95% confidence intervals and areas with lighter colors indicate 1 SD. Gray dots show individual data points.
Fig. 7. PCA results calculated across 10 training days based on the complementary method (VAF by the top 10% of PCs).

(A) The results of the Induction → decoder construction (DC) PCA for each of the 10 days during DecNef training in the study by Shibata et al. reported in 2011. Transformation loadings were computed based on fMRI data obtained from each of 10 days during the induction stage, and the transformation loadings were applied to fMRI data in the DC stage. No significant change in VAF by the top 10% of PCs was observed. (B) The results of the DC → Induction PCA. A trend toward an increase in VAF by the top 10% of PCs was observed on Day 10 compared to Day 1 (one-tailed paired t-test, P = 0.055). (C) An additional analysis of the data shown in (B). The top 10% of PCs were classified into top and bottom halves according to contributions to orientation decoding (see text for details). A significant increase in VAF by the top-half PCs was observed on Day 10 compared to Day 1 (green; one-tailed paired t-test, P = 0.033). No significant change in VAF by the bottom-half PCs (black) was identified. Shaded areas represent SEM.
4.5.1. PCA based on VAF by the top 10% of PCs
In the aforementioned PCA, we used a proportion of PCs that accounts for 80% of the data variance (PC80%) as an estimate of the dimensionality of fMRI signal patterns since this metric was used in a previous study (Mazzucato et al., 2016). However, this method may exhibit potential bias, since the proportions of PCs vary across participants.
We conducted an additional PCA based on a complementary method, which used the same proportion of PCs (10%, arbitrary determined) across participants, to test the robustness of the original PCA results. In this method, we calculated VAF by the top 10% of PCs. If VAF by the top 10% of PCs only accounted for approximately 10% of the variance in fMRI signal patterns, we would predict that fMRI signal patterns are close to random, and therefore, high-dimensional. If VAF by the top 10% of PCs was significantly greater than 10% of the variance, we would predict that fMRI signal patterns are not random and low-dimensional. Other aspects of PCA were identical to those of the original method using PC80%, as described in Sections 4.2–4.4.
As shown in Figs. 6 and 7, the results of the PCA based on the complementary method were highly consistent with those based on the original method. First, for both the DC and induction stages, VAF by the top 10% of PCs was significantly greater than 10% (Fig. 6, red and blue bars). Second, the results of the DC → Induction PCA showed that the top 10% of PCs in the DC stage accounted for more than 10% of the variance of fMRI signal patterns measured in the induction stage (Fig. 6, magenta bars). Third, the results of the day-by-day Induction → DC PCA on the orientation DecNef study showed no significant changes in VAF by the top 10% of PCs (Fig. 7A). Fourth, the results of the day-by-day DC → Induction PCA on the orientation DecNef study showed that VAF by orientation-related PCs was significantly greater on Day 10 than on Day 1 (Fig. 7B and C). Based on these results, the characteristics, prerequisite, major prediction, and assumption of the targeted plasticity model are supported by the results of both the original and complementary PCA methods.
4.5.2. Comparison of fMRI signal qualities between the DC and induction stages
Based on the differences between the results of the day-by-day Induction → DC PCA (Figs. 5A and 7A) and day-by-day DC → induction PCA (Fig. 5B, C, 7B and 7C), we argue that fMRI signal patterns in the early visual cortex contained orientation-related components at the beginning of the induction stage and that these components became stronger after DecNef training. However, the differences might have been derived from other factors, such as differences in fMRI signal qualities between the induction and DC stages.
We compared fMRI signal amplitudes of each of voxels within the early visual cortex between the induction and DC stages (Fig. 8) to test whether the overall amplitudes were different between the two stages. In the induction stage, fMRI signal amplitudes during the induction period were z-score-normalized in each fMRI run and averaged over all runs for each voxel. In the DC stage, fMRI responses to orientation stimuli were also z-score-normalized in each fMRI run and averaged over all runs for each voxel. Namely, we compared overall mean absolute values of the z-scores across the voxels between the two stages. A significant difference between these values was not observed (Fig. 8A; two-tailed paired t-test, P = 0.662). We also tested if the mean absolute z-scores recorded during the 10-day induction stage were consistent between Day 1 and Day 10. A significant change in the mean z-scores between Day 10 and Day 1 was not observed (Fig. 8B; two-tailed paired t-test, P = 0.638). These results are inconsistent with the possibility that the differences in the results between the Induction → DC and DC → Induction PCA are due to differences in fMRI signal qualities between the two stages.
Fig. 8. Comparison of fMRI signal qualities.

(A) Mean absolute z-scores across voxels for the induction and decoder construction (DC) stages. No significant difference was observed between values (two-tailed paired t-test, P = 0.662). Black lines in the box plots represent median values. Areas with darker colors indicate 95% confidence intervals and areas with lighter colors indicate 1 SD. Gray dots show individual data points. (B). Mean absolute z-scores across voxels on each day of the induction stage. No significant difference was observed between Day 1 and Day 10 (two-tailed paired t-test, P = 0.638). Shaded areas represent SEM.
5. Neural network simulation of the proposed model
Can we pragmatically induce target activities at the neuronal level with the characteristics, prerequisite and assumption of the model, such as reinforcement learning, low dimensionality of neural activities and inclusion of target neuronal activities in spontaneous neuronal activities in a target region? To further examine computational plausibility of the principles, we tested whether target activities are efficiently induced by DecNef at the neuronal level by performing a biologically plausible neural network simulation that includes the characteristics, prerequisite and assumption. We used the simulation to test whether target activities at the neuronal level are induced in the neural network simulation under a computational environment that mimicked DecNef experiments.
A computational simulation with reinforcement learning replicates the results of the orientation DecNef study (Oblak et al., 2017). However, this study simulated learning only at the voxel level, without addressing the correspondence between activities at the neuronal level and fMRI signal patterns at the voxel level. Computations both at neuronal and voxel levels and their interactions must be included to clarify the neural mechanisms of DecNef since we assume that DecNef causes neural plasticity at the neuronal level.
This simulation focused on plasticity in the early visual cortex because half of the DecNef studies have targeted the early visual cortex (Amano et al., 2016; Koizumi et al., 2016; Shibata et al., 2011). In particular, we conducted the simulation based on the results of the orientation DecNef study (Shibata et al., 2011) since a well-established neural network model of orientation processing in the early visual cortex exists (Blumenfeld et al., 2006; Goldberg et al., 2004). We tested whether orientation processing at the neuronal level is modified by feedback based on voxel-level activities during DecNef training.
5.1. Structure of the simulation
The model used in the simulation consisted of neuronal-level and voxel-level layers (Fig. 9; see Appendix D for details).
Fig. 9. Schematic of the structure of the neural network simulation.

See the text and Appendix D for details.
We applied a well-established neural network to the neuronal-level layer (Blumenfeld et al., 2006; Goldberg et al., 2004). This network is composed of a number of neurons that were interconnected with each other through synapses. Each neuron has unique orientation selectivity, analogous to neurons in the early visual cortex (Hubel et al., 1978). In this network, neurons that have similar orientation selectivities share strong bidirectionally connected positive synaptic weights while synaptic weights between neurons with different types of orientation selectivity are weakly positive or negative (Blumenfeld et al., 2006; Goldberg et al., 2004). Due to this synaptic weight pattern, neuronal activities are constrained on a low-dimensional manifold, termed a ring attractor (Blumenfeld et al., 2006; Goldberg et al., 2004). After initial random activities are assigned to the neurons, an activity pattern of the neurons converges to one of the points on a ring-shaped manifold composed of activity patterns evoked by orientation stimuli.
Feedback scores were computed based on fMRI signal patterns at the voxel-level layer (Fig. 9). We specifically employed the model reported by Kamitani and Tong that describes how fMRI signal patterns occur based on activities of neurons in the early visual cortex (Kamitani and Tong, 2005). In this model, each voxel in the early visual cortex has a weak orientation selectivity that presumably reflects a nonuniform distribution of orientation columns in the voxel. Using this model, we computed fMRI signal patterns at the voxel-level layer based on the activities of neurons in the neuronal-level layer.
In the simulation, we first constructed an orientation decoder based on fMRI signal patterns obtained from the voxel-level layer. As in the decoder construction stage of the orientation DecNef experiment (Shibata et al., 2011), we trained a decoder using fMRI signal patterns evoked by the presentations of actual orientation stimuli.
Next, the induction stage of the simulation was conducted with the same procedure as the orientation DecNef experiment (Shibata et al., 2011). Feedback scores reflected the likelihood of a target orientation computed at the voxel-level layer. Based on the feedback scores, synaptic weights among the neurons at the neuronal-level layer were updated. This update followed the Hebbian rule modulated by reinforcement signals driven by the feedback (see Appendix D for details). We tested whether under this learning framework, the dynamics of activities of neurons at the neuronal-level layer changes such that these neuronal activities will be more likely to converge to activities related to a target orientation through DecNef.
5.2. Results of the simulation
Based on the results of the simulation, after DecNef training, activities at the neuronal-level layer became more converged to the activities corresponding to a target orientation than other nontarget orientations. Fig. 10 shows the distributions of the likelihood that activities with random initial values converged to activities corresponding to different orientations. Before DecNef training, the distribution was close to uniform, indicating that an activity pattern with random initial values converged equally likely to each of different orientations (Fig. 10, blue). After DecNef training, the distribution became bell-shaped around the target orientation (Fig. 10, red). The probability of the target orientation was significantly higher after training than before training (two-tailed paired t-test, P = 0.003). Thus, DecNef-specific orientation-related activities at the neuronal-level layer are efficiently enhanced by feedback based on activities at the voxel-level layer within a reasonable number of neurofeedback trials (1800 trials; see Appendix D for details).
Fig. 10. The results of the neural network simulation.

Each line shows a probability distribution of the likelihood that the activities of neurons in the neuronal-level layer with random initial values converged to activities corresponding to different orientations before (blue) and after (red) DecNef training. The simulation was repeated 10 times with slightly different initial parameters to account for the diversity of 10 participants in the original study (Shibata et al., 2011). Shaded areas represent SEM. See Appendix D.4 for details.
5.3. Implications of the generalizability of the simulation
Does the proposed model account for the results of other DecNef studies examining functions or features other than orientation? Although the current simulation focused on orientation processing in the early visual cortex, a similar computational simulation should work for other brain regions where the activities of neurons are constrained on a low-dimensional manifold. As discussed in Section 3.2, previous physiological studies have reported these types of low-dimensional manifolds in the visual, auditory, motor, and prefrontal cortices (Berkes et al., 2011; Kenet et al., 2003; Luczak et al., 2009; Mochol et al., 2015; Renart et al., 2010; Ringach, 2009). Our PCA on fMRI signal patterns of DecNef studies described in the previous section also indicates low dimensionality. Thus, the proposed model is likely applicable to neuronal dynamics in various cortical regions. Indeed, recent DecNef studies have shown that induction learning occurs in regions outside the early visual cortex (Cortese et al., 2016, 2017; Shibata et al., 2016b; Taschereau-Dumouchel et al., 2018).
6. Limitations
While the results of our analyses and simulations provide empirical and computational support for the targeted neural plasticity model, these analyses and simulations have certain limitations. We discuss these limitations below.
First, some of the PCA results (Figs. 5 and 7) were based on fMRI data obtained only from the orientation DecNef study (Shibata et al., 2011). The reason for analyzing this limited dataset was that this study had the longest training period (10 days) among the previous DecNef studies, allowing us to examine the temporal characteristics of changes in fMRI signal patterns during DecNef training. Many other studies used three days of DecNef training. Since other DecNef studies focused on other types of processing, such as color, preference, fear memory and confidence, we were unable to clearly determine whether these PCA results would be generalized to types of processing other than orientation.
Second, the purpose of the simulations was to show that the principles of DecNef that we presume enable to circumvent the potential computational problems due to the one-to-many correspondence from fMRI activity patterns to neuronal activity patterns and the curse of dimensionality. Thus, we did not plan or intend that the simulations would quantitatively explain every aspect of the experimental data reported in the DecNef studies.
Some researchers may question whether a discrepancy indeed exists between the simulation and experimental data. We found one instance of results that were inconsistent with the results of the simulations. The results of the simulations showed that after DecNef training, the activities of neurons in the neuronal-level layer with random initial values became more converged to the activities corresponding to a target orientation than other nontarget orientations (Fig. 10). Based on the results, we predicted that after DecNef training, fMRI signal patterns, even those recorded in the baseline period of the induction stage, became closer to fMRI signal patterns that represent the target orientation, regardless of whether participants were asked to regulate their brain activities. We conducted the DC → Induction PCA on fMRI data obtained from a baseline period during which participants were merely asked to fixate on the center of a display at the beginning of each fMRI run to test this hypothesis. If the prediction was correct, a proportion of PCs that account for 80% of the data variance during the baseline period (PC80%) should be significantly smaller on Day 10 than on Day 1. However, we did not detect a significant change in PC80% (Fig. 11; one-tailed paired t-test, P = 0.149). Thus, a more complex model will be necessary to completely explain every aspect of the experimental data reported in the DecNef studies.
Fig. 11. Results of the DC → Induction PCA on fMRI data obtained from a baseline period.

No significant difference in the proportions of PCs accounting for 80% of the variance was observed between Day 1 and Day 10 (one-tailed paired t-test, P = 0.149). Shaded areas represent SEM.
Third, researchers may refute our assumption that the low dimensionality of fMRI signals (Figs. 4 and 6) indicates a low dimensionality of neuronal activities. The low dimensionality of the fMRI signals might merely be determined by the physiological mechanisms by which fMRI signal are measured that do not depend on the dimensionality of the underlying neuronal activities. Since a causal relationship between dimensionalities at the neuronal and fMRI voxel levels is still being debated, we only presume that a low dimensionality of fMRI signals indicates a low dimensionality of the neuronal activities. However, the assumption is likely to be valid for the following reasons. First, the relationship between neural activities and fMRI signals has been extensively investigated (Logothetis et al., 2001; Logothetis and Wandell, 2004). The relationship is almost linear, at least under a certain environment. Second, as discussed in Section 3.2, a growing number of studies has reported the low dimensionality of neuronal activities in various cortical areas, including the sensory and prefrontal cortices (Berkes et al., 2011; Kenet et al., 2003; Luczak et al., 2009; Mochol et al., 2015; Renart et al., 2010; Ringach, 2009; Sadtler et al., 2014). Third, the dimensionality of fMRI signal patterns is modulated by a task and context (Diedrichsen et al., 2013). This context- and task-dependent modulation of dimensionality should not occur if the dimensionality of fMRI signals is only determined by the physiological mechanisms for fMRI measurements. These findings collectively support the validity of the assumption that the dimensionality of fMRI signals reflects the dimensionality of neuronal activities.
7. Conclusions
In this review, we discussed possible neural mechanisms of DecNef that alter a target behavior. First, we have proposed and introduced experimental support for the targeted neural plasticity model in which DecNef changes specific neural activities, leading to a certain behavior change, and refuted other proposed accounts for the behavioral changes. Second, we have proposed reinforcement learning with a low dimensionality of activities at the neuronal level in a target region as major mechanism of the model. Third, we have shown that both the results of the reanalyses of fMRI data and neural network simulation are consistent with the characteristics, prerequisite, major prediction, and assumption of the model. This global framework will prompt new investigations that directly measure DecNef-induced changes in neuronal activity in an animal brain.
Acknowledgements
We thank Dr. Kaoru Amano and Dr. Ai Koizumi for providing the fMRI data used in the meta-analysis.
Funding sources
This research was conducted as part of the “Application of DecNef for development of diagnostic and cure system for mental disorders and construction of clinical application bases” of the Strategic Research Program for Brain Sciences from Japan Agency for Medical Research and development (AMED) and also supported by AMED under Grant Number JP18dm0307008. TW is also partially supported by NIH grants R01EY019466 and EY027841, YS by NSF grant BCS 1539717, KS by JSPS KAKENHI Grant Number 17H04789 and MK by the ImPACT Program of Council for Science, Technology and Innovation (Cabinet Office, Government of Japan).
Appendices.
A. Details of avoiding the curse of dimensionality for linear decoders
In this section, we describe how reinforcement learning to induce a target fMRI signal pattern is transformed into quasi-supervised learning that induces a certain fMRI signal amplitude in each voxel within a target region using a linear or pseudolinear decoder during DecNef training (see Section 3.5). This principle can be applied to both regression and classification problems, regardless of the numbers of classes.
First, let us focus on the simplest case: a linear regression. A reward value r reflects a feedback score computed as a linear weighted sum of fMRI signal amplitudes across N voxels in a target region. Thus, r is obtained from the equation
Here, Ai represents the fMRI signal amplitude of ith voxel. Wi indicates a linear weight for the ith voxel; b corresponds to a constant value. In reinforcement learning, an efficient change in Ai is calculated to increase the reward by a small amount Δr
Thus, in the case of the linear regression, learning can occur separately for each of the voxels in the target region.
Second, we focus on the case of a binary classification, such as logistic regression. r is obtained with the equation
where f represents a sigmoid function, which is pseudolinear and monotonically increasing function. In this case, a change in Ai is described by
Thus, an fMRI signal amplitude can be updated separately for each of the voxels.
Third, let us consider a case of a classification with M classes. The value for r is obtained with the equation
Here, T corresponds to a target class during DecNef training. Again, f represents a sigmoid function. As in the second case, a change in Ai is described by
Thus, the same learning rule can be used for the multiclass case.
B. Details of GLM analysis
A standard GLM analysis (Paulesu et al., 1995) was conducted. We analyzed five fMRI datasets obtained from experiments in which participants underwent training with DecNef (Amano et al., 2016; Cortese et al., 2016; Koizumi et al., 2016; Shibata et al., 2011, 2016b). All analyses were conducted using SPM8 (http://www.fil.ion.ucl.ac.uk/spm/software/spm8/). Before preprocessing and statistical analyses, we discarded the first 15 fMRI volumes in each fMRI run. Preprocessing of fMRI data was conducted as described below. First, motion correction was conducted for each fMRI run. In the motion correction step, all fMRI volumes in the run were aligned to a mean volume of the run. Second, slice timing correction was conducted. Third, the motion-corrected fMRI volumes were spatially normalized to MNI space using a transformation matrix obtained from the normalization of the mean fMRI volume to the EPI template in SPM8. Finally, the normalized volumes were spatially smoothed with an isotropic Gaussian kernel of 8 mm (full-width at half-maximum).
The GLM analysis consisted of first- and second-level analyses. In the first-level analysis, we modeled all types of events that occurred in each trial of DecNef training for each study (Fig. A1; see original articles for details of time-courses and events for a trial). Six head motion parameters were also included in the model as nuisance regressors. We specifically focused on the following contrasts: induction period vs. fixation period and the correlation between activation amplitudes in a feedback period and neurofeedback scores. The induction period refers to the period in which participants were asked to regulate their neuronal activities. The feedback period is the period in which neurofeedback scores were presented to participants.
In the second-level analysis, contrast maps from all five studies and all participants were combined for each of the two contrasts mentioned above. We used the t-test to determine whether the mean contrast value was significantly greater than zero for each voxel. P-values were corrected using Bonferroni correction for multiple comparisons across voxels.
Fig. A.1. Representative time course of a trial during DecNef training.

In the induction period, participants were asked to regulate their brain activities. During the fixation period and intertrial interval (ITI), participants were asked to fixate on the center of the display. In the feedback period, participants were presented with a feedback disk. See the original articles for detailed descriptions of the experiments. (A) Representative time course used in the study by Shibata et al., in 2011. (B) Representative time course used in the studies by Amano et al., in 2016 and Koizumi et al., in 2016. (C) Representative time course employed in the 2016 study by Shibata et al. (D) Representative time course employed in the study by Cortese et al., in 2016.1
C. Representative PCA results
Here, we present representative PCA results for individual participants in the study by Shibata et al., in 2011 in which the early visual cortex was used as a target region for DecNef.
Fig. A.2. Relationships between variance accounted for (VAF) and numbers of principal components (PCs) for individual participants in Shibata et al. (2011).

Each panel represents one participant. Red and blue lines represent results from the PCA in the induction and decoder construction (DC) stages, respectively. Magenta lines show results from the PCA in which transformation loadings were computed from fMRI data in the DC stage and VAF was calculated from fMRI data obtained from the entire period of the induction stage (DC → Induction PCA).2
D. Details of the simulation
Codes for the simulation are available at our webpage (https://bicr.atr.jp/decnefpro/?page_id=222).
D.1. Neuronal-level layer
The neuronal-level layer consisted of the well-established neural network model (Blumenfeld et al., 2006). Synaptic weights among neurons are defined as follows:
where for a given neuron i, θi represents a preferred orientation of the neuron and ri measures the degree to which the response of neuron i is modulated by the orientation of the stimulus (i.e., selectivity). The parameter J2 > 0 is a global scaling factor of this term, and the parameter J0 represents global excitation (if J0 > 0) or global inhibition (if J0 < 0). We maintained all the parameters described in the original paper (Blumenfeld et al., 2006), except for the data-driven variables. Specifically, we computed the preferred orientation θ by training a self-organizing map (SOM, or Kohonen map) with a size of 42 × 17 on a set of orientation stimuli (Gabor patches). The 20 × 20 stimuli could adopt one of six different orientations (i.e., 30, 60, 90, …, 180 deg) and one of eight different signal-to-noise ratios (SNRs) (i.e., 0.2, 0.3, …, 0.9). For each combination of an orientation and SNR, 50 samples were generated, for a total of 2400 orientation stimuli to train the SOM. Therefore, the weights of the SOM represented the preferred orientation θ. According to the original paper, J2 = 5 and J0 = —2 were used, and for simplicity we kept a constant selectivity of ri = 1.
The evolution of the neuronal activity mi at a given neuron i is described by the standard rate equation:
where is the derivative of mi, is the input to neuron i due to recurrent connections, is the afferent input, τ = 10 is a time constant, T = 1 is the firing threshold and ▯+ represents the ramp gain function ([γ]+ = γ if γ > 0 and[γ]+ = 0 if γ ≤ 0). The recurrent input is computed using the following equation:
where the integral is calculated over the whole neuronal region and A = 11:7 mm2 represents the area of that region.
The model formulated above exhibits spontaneous activity when the afferent input is constant and exceeds a threshold (i.e., and C > T). After a short transient, this activity converges toward one of the available orientation patterns, according to a uniform distribution. Otherwise, if the input is structured according to a specific orientation stimulus, the evoked activity of the recurrent network will always converge toward the pattern of that specific orientation. Given a desired orientation ϕaff, the afferent input is computed as follows:
where ε = 0:1 is the modulation of the orientation encoding term.
D.2. Voxel-level layer and decoder construction
The voxel-level layer was modeled according to the technique proposed in a previous study (Kamitani and Tong, 2005). The position of the 714 (i.e., 42 × 17) neurons was randomly permuted and arranged on a one-dimensional column. Then, this column was partitioned into 50 blocks, representing the 50 voxels. The activity of the neurons within a partition was averaged to represent the voxel intensity. The partitioning was jittered on each trial according to a Gaussian distribution with an SD of 20% of the voxel size to simulate head motions during fMRI measurements. Moreover, random Gaussian noise was added to the activity at SNR sufficient to achieve an average decoding accuracy of 80%, as described in the next paragraph.
A voxel-level sparse logistic regression decoder (Yamashita et al., 2008) was trained to classify a voxel intensity pattern into one of three different orientations (10, 70, and 130 deg). For this purpose, the evoked activity at the neuronal-level layer was simulated, followed by a projection to the voxel-level layer. This procedure was performed 100 times for each orientation to create a training set, and another 100 times to create a test set. As explained above, the parameters in the voxel-level layer were tuned to achieve an average test decoding accuracy (i.e., average sensitivity) of 80%.
D.3. DecNef induction and synaptic plasticity
During the DecNef simulation, synaptic weights among neurons at the neuronal-level layer were updated according to the Hebbian rule. In each simulated trial, the network spontaneously converged toward one of the orientation patterns, and it was rewarded if the pattern was congruent with the target orientation pattern. The reward was computed by applying the decoder to voxel intensities. Specifically, the synaptic weights at the neuronal-level layer were updated, depending on whether the decoded angle θ corresponded to the target angle :
where Wij[n+1] is the synaptic weight between neuron i and j at iteration n + 1, ξ is the learning rate, and Xi[n] is the activation of neuron i at iteration
D.4. DecNef simulation
We accounted for the diversity of participants by creating different conditions for the simulation. For a given condition, a new SOM at the neuronal-level layer and W were constructed and a synaptic learning rate ξ was assigned. We created 10 different conditions in which the learning rate ξ varied on an evenly spaced set of 10 values over the interval [0.00004, 0.0001]. For each condition of the simulation, the DecNef induction was repeated 1800 times (i.e., trials), as described in the original paper (Shibata et al., 2011).
Footnotes
Declaration of interest
A potential financial conflict of interest exists; the authors are the inventors of patents related to the decoded neurofeedback method discussed in this article, while the original assignee of the patents is ATR, with which the authors are affiliated.
References
- Abbott DF, Opdam HI, Briellmann RS, Jackson GD, 2005. Brief breath holding may confound functional magnetic resonance imaging studies. Hum. Brain Mapp 24, 284–290. [DOI] [PMC free article] [PubMed] [Google Scholar]
- Amano K, Shibata K, Kawato M, Sasaki Y, Watanabe T, 2016. Learning to associate orientation with color in early visual areas by associative decoded fMRI neurofeedback. Curr. Biol 26, 1861–1866. [DOI] [PMC free article] [PubMed] [Google Scholar]
- Behrens TE, Woolrich MW, Walton ME, Rushworth MF, 2007. Learning the value of information in an uncertain world. Nat. Neurosci 10, 1214–1221. [DOI] [PubMed] [Google Scholar]
- Behroozi M, Daliri MR, Boyaci H, 2011. Statistical analysis methods for the fMRI data. Basic Clin. Neurosci 2, 67–74. [Google Scholar]
- Berkes P, Orban G, Lengyel M, Fiser J, 2011. Spontaneous cortical activity reveals hallmarks of an optimal internal model of the environment. Science 331, 83–87. [DOI] [PMC free article] [PubMed] [Google Scholar]
- Blumenfeld B, Bibitchkov D, Tsodyks M, 2006. Neural network model of the primary visual cortex: from functional architecture to lateral connectivity and back. J. Comput. Neurosci 20, 219–241. [DOI] [PMC free article] [PubMed] [Google Scholar]
- Cortese A, Amano K, Koizumi A, Kawato M, Lau H, 2016. Multivoxel neurofeedback selectively modulates confidence without changing perceptual performance. Nat. Commun 7, 13669. [DOI] [PMC free article] [PubMed] [Google Scholar]
- Cortese A, Amano K, Koizumi A, Lau H, Kawato M, 2017. Decoded fMRI neurofeedback can induce bidirectional confidence changes within single participants. NeuroImage 149, 323–337. [DOI] [PMC free article] [PubMed] [Google Scholar]
- deBettencourt MT, Cohen JD, Lee RF, Norman KA, Turk-Browne NB, 2015. Closed-loop training of attention with real-time brain imaging. Nat. Neurosci 18, 470–475. [DOI] [PMC free article] [PubMed] [Google Scholar]
- deCharms RC, Christoff K, Glover GH, Pauly JM, Whitfield S, Gabrieli JD, 2004. Learned regulation of spatially localized brain activation using real-time fMRI. NeuroImage 21, 436–443. [DOI] [PubMed] [Google Scholar]
- deCharms RC, Maeda F, Glover GH, Ludlow D, Pauly JM, Soneji D, Gabrieli JD, Mackey SC, 2005. Control over brain activation and pain learned by using real-time functional MRI. Proc. Natl. Acad. Sci. U. S. A 102, 18626–18631. [DOI] [PMC free article] [PubMed] [Google Scholar]
- Diedrichsen J, Wiestler T, Ejaz N, 2013. A multivariate method to determine the dimensionality of neural representation from population activity. NeuroImage 76, 225–235. [DOI] [PMC free article] [PubMed] [Google Scholar]
- Doya K, 1999. What are the computations of the cerebellum, the basal ganglia and the cerebral cortex? Neural Network 12, 961–974. [DOI] [PubMed] [Google Scholar]
- Emmert K, Kopel R, Sulzer J, Bruhl AB, Berman BD, Linden DEJ, Horovitz SG, Breimhorst M, Caria A, Frank S, Johnston S, Long Z, Paret C, Robineau F, Veit R, Bartsch A, Beckmann CF, Van De Ville D, Haller S, 2016. Meta-analysis of real-time fMRI neurofeedback studies using individual participant data: how is brain regulation mediated? NeuroImage 124, 806–812. [DOI] [PubMed] [Google Scholar]
- Fetz EE, 1969. Operant conditioning of cortical unit activity. Science 163, 955–958. [DOI] [PubMed] [Google Scholar]
- Goldberg JA, Rokni U, Sompolinsky H, 2004. Patterns of ongoing activity and the functional architecture of the primary visual cortex. Neuron 42, 489–500. [DOI] [PubMed] [Google Scholar]
- Haruno M, Kawato M, 2006. Different neural correlates of reward expectation and reward expectation error in the putamen and caudate nucleus during stimulus-action-reward association learning. J. Neurophysiol 95, 948–959. [DOI] [PubMed] [Google Scholar]
- Haruno M, Kuroda T, Doya K, Toyama K, Kimura M, Samejima K, Imamizu H, Kawato M, 2004. A neural correlate of reward-based behavioral learning in caudate nucleus: a functional magnetic resonance imaging study of a stochastic decision task. J. Neurosci 24, 1660–1665. [DOI] [PMC free article] [PubMed] [Google Scholar]
- Haxby JV, Gobbini MI, Furey ML, Ishai A, Schouten JL, Pietrini P, 2001. Distributed and overlapping representations of faces and objects in ventral temporal cortex. Science 293, 2425–2430. [DOI] [PubMed] [Google Scholar]
- Haynes J-D, Rees G, 2005. Predicting the orientation of invisible stimuli from activity in human primary visual cortex. Nat. Neurosci 8, 686–691. [DOI] [PubMed] [Google Scholar]
- Huang TR, 2016. Hebbian Plasticity for Improving Perceptual Decisions 1612.03270.
- Hubel DH, Wiesel TN, Stryker MP, 1978. Anatomical demonstration of orientation columns in macaque monkey. J. Comp. Neurol 177, 361–380. [DOI] [PubMed] [Google Scholar]
- Kamitani Y, Tong F, 2005. Decoding the visual and subjective contents of the human brain. Nat. Neurosci 8, 679–685. [DOI] [PMC free article] [PubMed] [Google Scholar]
- Kasahara K, DaSalla CS, Honda M, Hanakawa T, 2015. Neuroanatomical correlates of brain-computer interface performance. NeuroImage 110, 95–100. [DOI] [PubMed] [Google Scholar]
- Kastrup A, Kruger G, Glover GH, Moseley ME, 1999. Assessment of cerebral oxidative metabolism with breath holding and fMRI. Magn. Reson. Med 42, 608–611. [DOI] [PubMed] [Google Scholar]
- Kenet T, Bibitchkov D, Tsodyks M, Grinvald A, Arieli A, 2003. Spontaneously emerging cortical representations of visual attributes. Nature 425, 954–956. [DOI] [PubMed] [Google Scholar]
- Kennedy JE, Taddonio JL, 1976. Experimenter effects in parapsychological research. J. Parapsychol 40, 1–33. [Google Scholar]
- Koizumi A, Amano K, Cortese A, Shibata K, Yoshida W, Seymour B, Kawato M, Lau H, 2016. Fear reduction without fear through reinforcement of neural activity that bypasses conscious exposure. Nat Hum Behav 1, 0006. [DOI] [PMC free article] [PubMed] [Google Scholar]
- La Conte SM, Peltier SJ, Hu XP, 2007. Real-time fMRI using brain-state classification. Hum. Brain Mapp 28, 1033–1044. [DOI] [PMC free article] [PubMed] [Google Scholar]
- Linden DE, Turner DL, 2016. Real-time functional magnetic resonance imaging neurofeedback in motor neurorehabilitation. Curr. Opin. Neurol 29, 412–418. [DOI] [PMC free article] [PubMed] [Google Scholar]
- Logothetis NK, Pauls J, Augath M, Trinath T, Oeltermann A, 2001. Neurophysiological investigation of the basis of the fMRI signal. Nature 412, 150–157. [DOI] [PubMed] [Google Scholar]
- Logothetis NK, Wandell BA, 2004. Interpreting the BOLD signal. Annu. Rev. Physiol 66, 735–769. [DOI] [PubMed] [Google Scholar]
- Luczak A, Bartho P, Harris KD, 2009. Spontaneous events outline the realm of possible sensory responses in neocortical populations. Neuron 62, 413–425. [DOI] [PMC free article] [PubMed] [Google Scholar]
- Mazzucato L, Fontanini A, La Camera G, 2016. Stimuli reduce the dimensionality of cortical activity. Front. Syst. Neurosci 10, 11. [DOI] [PMC free article] [PubMed] [Google Scholar]
- Mochol G, Hermoso-Mendizabal A, Sakata S, Harris KD, de la Rocha J, 2015. Stochastic transitions into silence cause noise correlations in cortical circuits. Proc. Natl. Acad. Sci. U. S. A 112, 3529–3534. [DOI] [PMC free article] [PubMed] [Google Scholar]
- Oblak EF, Lewis-Peacock JA, Sulzer JS, 2017. Self-regulation strategy, feedback timing and hemodynamic properties modulate learning in a simulated fMRI neurofeedback environment. PLoS Comput. Biol 13, e1005681. [DOI] [PMC free article] [PubMed] [Google Scholar]
- Papageorgiou TD, Lisinski JM, McHenry MA, White JP, LaConte SM, 2013. Brain-computer interfaces increase whole-brain signal to noise. Proc. Natl. Acad. Sci. U. S. A 110, 13630–13635. [DOI] [PMC free article] [PubMed] [Google Scholar]
- Paulesu E, Connelly A, Frith CD, Friston KJ, Heather J, Myers R, Gadian DG, Frackowiak RS, 1995. Functional MR imaging correlations with positron emission tomography. Initial experience using a cognitive activation paradigm on verbal working memory. Neuroimaging Clin 5, 207–225. [PubMed] [Google Scholar]
- Ramot M, Grossman S, Friedman D, Malach R, 2016. Covert neurofeedback without awareness shapes cortical network spontaneous connectivity. Proc. Natl. Acad. Sci. U. S. A 113, E2413–E2420. [DOI] [PMC free article] [PubMed] [Google Scholar]
- Renart A, de la Rocha J, Bartho P, Hollender L, Parga N, Reyes A, Harris KD, 2010. The asynchronous state in cortical circuits. Science 327, 587–590. [DOI] [PMC free article] [PubMed] [Google Scholar]
- Ringach DL, 2009. Spontaneous and driven cortical activity: implications for computation. Curr. Opin. Neurobiol 19, 439–444. [DOI] [PMC free article] [PubMed] [Google Scholar]
- Rosenfeld JP, Rudell AP, Fox SS, 1969. Operant control of neural events in humans. Science 165, 821–823. [DOI] [PubMed] [Google Scholar]
- Sadtler PT, Quick KM, Golub MD, Chase SM, Ryu SI, Tyler-Kabara EC, Yu BM, Batista AP, 2014. Neural constraints on learning. Nature 512, 423–426. [DOI] [PMC free article] [PubMed] [Google Scholar]
- Scharnowski F, Hutton C, Josephs O, Weiskopf N, Rees G, 2012. Improving visual perception through neurofeedback. J. Neurosci 32, 17830–17841. [DOI] [PMC free article] [PubMed] [Google Scholar]
- Scheinost D, Stoica T, Saksa J, Papademetris X, Constable RT, Pittenger C, Hampson M, 2013. Orbitofrontal cortex neurofeedback produces lasting changes in contamination anxiety and resting-state connectivity. Transl. Psychiatry 3, e250. [DOI] [PMC free article] [PubMed] [Google Scholar]
- Schnurr PP, Friedman MJ, Engel CC, Foa EB, Shea MT, Chow BK, Resick PA, Thurston V, Orsillo SM, Haug R, Turner C, Bernardy N, 2007. Cognitive behavioral therapy for posttraumatic stress disorder in women: a randomized controlled trial. J. Am. Med. Assoc 297, 820–830. [DOI] [PubMed] [Google Scholar]
- Sepulveda P, Sitaram R, Rana M, Montalba C, Tejos C, Ruiz S, 2016. How feedback, motor imagery, and reward influence brain self-regulation using real-time fMRI. Hum. Brain Mapp 37, 3153–3171. [DOI] [PMC free article] [PubMed] [Google Scholar]
- Shibata K, Sasaki Y, Watanabe T, Kawato M, 2016a. Response to Comment on ‘Perceptual Learning Incepted by Decoded FMRI Neurofeedback without Stimulus Presentation’; How Can a Decoded Neurofeedback Method (DecNef) Lead to Successful Reinforcement and Visual Perceptual Learning? 1612.04234.
- Shibata K, Watanabe T, Kawato M, Sasaki Y, 2016b. Differential activation patterns in the same brain region led to opposite emotional states. PLoS Biol 14, e1002546. [DOI] [PMC free article] [PubMed] [Google Scholar]
- Shibata K, Watanabe T, Sasaki Y, Kawato M, 2011. Perceptual learning incepted by decoded fMRI neurofeedback without stimulus presentation. Science 334, 1413–1415. [DOI] [PMC free article] [PubMed] [Google Scholar]
- Sitaram R, Ros T, Stoeckel L, Haller S, Scharnowski F, Lewis-Peacock J, Weiskopf N, Blefari ML, Rana M, Oblak E, Birbaumer N, Sulzer J, 2017. Closed-loop brain training: the science of neurofeedback. Nat. Rev. Neurosci 18, 86–100. [DOI] [PubMed] [Google Scholar]
- Taschereau-Dumouchel V, Cortese A, Chiba T, Knotts JD, Kawato M, Lau H, 2018. Towards an unconscious neural reinforcement intervention for common fears. Proc. Natl. Acad. Sci. U. S. A 115, 3470–3475. [DOI] [PMC free article] [PubMed] [Google Scholar]
- Thibault RT, Lifshitz M, Raz A, 2016. The self-regulating brain and neurofeedback: experimental science and clinical promise. Cortex 74, 247–261. [DOI] [PubMed] [Google Scholar]
- Thibault RT, Lifshitz M, Raz A, 2017a. Neurofeedback or neuroplacebo? Brain 140, 862–864. [DOI] [PubMed] [Google Scholar]
- Thibault RT, MacPherson A, Lifshitz M, Roth RR, Raz A, 2017b. Neurofeedback with fMRI: a critical systematic review. Neuroimage 172, 786–807. [DOI] [PubMed] [Google Scholar]
- Varmuza K, Filzmoser P, 2009. Introduction to Multivariate Statistical Analysis in Chemometrics CRC Press, Florida. [Google Scholar]
- Watanabe T, Sasaki Y, Shibata K, Kawato M, 2017. Advances in fMRI real-time neurofeedback. Trends Cognit. Sci 21, 997–1010. [DOI] [PMC free article] [PubMed] [Google Scholar]
- Weiskopf N, Veit R, Erb M, Mathiak K, Grodd W, Goebel R, Birbaumer N, 2003. Physiological self-regulation of regional brain activity using real-time functional magnetic resonance imaging (fMRI): methodology and exemplary data. NeuroImage 19, 577–586. [DOI] [PubMed] [Google Scholar]
- Yamashita O, Sato MA, Yoshioka T, Tong F, Kamitani Y, 2008. Sparse estimation automatically selects voxels relevant for the decoding of fMRI activity patterns. NeuroImage 42, 1414–1429. [DOI] [PMC free article] [PubMed] [Google Scholar]
- Zuur A, Leno EN, Smith GM, 2007. Anslysing Ecological Data (Statistics for Biology and Health) Springer, New York. [Google Scholar]