

SUMMARY
The nature of obesity-associated islet inflammation and its impact on β cell abnormalities remains poorly defined. Here, we explore immune cell components of islet inflammation and define their roles in regulating β cell function and proliferation. Islet inflammation in obese mice is dominated by macrophages. We identify two islet-resident macrophage populations, characterized by their anatomical distributions, distinct phenotypes, and functional properties. Obesity induces the local expansion of resident intra-islet macrophages, independent of recruitment from circulating monocytes. Functionally, intra-islet macrophages impair β cell function in a cell-cell contact-dependent manner. Increased engulfment of β cell insulin secretory granules by intra-islet macrophages in obese mice may contribute to restricting insulin secretion. In contrast, both intra- and peri-islet macrophage populations from obese mice promote β cell proliferation in a PDGFR signaling-dependent manner. Together, these data define distinct roles and mechanisms for islet macrophages in the regulation of islet β cells.
In Brief
The crosstalk between immune cells and β cells in obesity is poorly understood. Ying et al. report that local macrophages drive obesity-associated islet inflammation through proliferation and that the accumulated islet macrophages affect both β cell replication and function through distinct mechanisms.
Graphical Abstract

INTRODUCTION
Obesity is associated with low-grade tissue inflammation, which manifests in multiple organs, including adipose tissue, liver, muscle, and pancreatic islets (Donath et al., 2013; Donath and Shoelson, 2011; Lackey and Olefsky, 2016; Lee et al., 2018). This chronic metabolic inflammation (metaflammation) plays a critical role in causing insulin resistance (Gregor and Hotamisligil, 2011; Hotamisligil, 2017; Lackey and Olefsky, 2016). Insulin resistance provokes a compensatory expansion of pancreatic β cell mass, resulting in a transient period of hyperinsulinemia. The eventual failure of these compensatory responses in β cells is a hallmark of type 2 diabetes mellitus (T2DM) (Talchai et al., 2009). The mechanisms that trigger compensatory expansion of β cells and subsequent β cell dysfunction remain poorly understood. It is postulated that local tissue cues in pancreatic islets may play a crucial role in obesity-associated β cell alterations (Aamodt and Powers, 2017). Several mechanisms have been implicated, including amyloid deposition (Haataja et al., 2008; Kamata et al., 2014; Masters et al., 2010; Meier et al., 2014; Westwell-Roper et al., 2014), glucolipotoxicity (Robertson, 2009), endoplasmic reticulum stress, and oxidative metabolism (Hasnain et al., 2014; Hotamisligil, 2010).
A common feature underlying all these mechanisms is the initiation and amplification of inflammatory responses (Donath, 2013; Eguchi and Nagai, 2017). During the course of obesity, islet inflammation is evident, characterized by the accumulation of immune cells (Butcher et al., 2014; Eguchi and Nagai, 2017) and elevated production of inflammatory cytokines and chemokines (Butcher et al., 2014; Donath et al., 2008b). A few studies have reported increased numbers of myeloid-lineage cells (primarily monocytes and macrophages) in the islets of obese animal models and humans (Cucak et al., 2014; Eguchi et al., 2012; Ehses et al., 2007; Richardson et al., 2009). While these studies suggest a potential role for immune cells (e.g., macrophages) in obesity-associated β cell dysfunction, key questions remain: what are the phenotypes and functional specifications of these macrophages? Are other immune cells also involved in obesity associated islet inflammation?
Macrophages reside in all organs (Gordon and Plüddemann, 2017). In the developing pancreas, macrophages are essential for islet morphogenesis (Geutskens et al., 2005). The dearth of macrophages in op/op mice, due to the lack of colony stimulating factor 1 (CSF-1), compromises pancreatic islet development and β cell expansion (Banaei-Bouchareb et al., 2004; Geutskens et al., 2005). Under inflammatory conditions, macrophages are key players in orchestrating the initiation, specification, and resolution of tissue-specific inflammation (Lee et al., 2018; Medzhitov, 2008; Murray and Wynn, 2011). Recently, several studies have reported the connection between islet inflammation and b cell dysfunction (Eguchi et al., 2012; West-well-Roper et al., 2014). In these studies, islet macrophages exhibited a pro-inflammatory phenotype (Eguchi et al., 2012; Westwell-Roper et al., 2014), suggesting a role of islet macrophages to impact β cell function. However, the sources of these macrophages remain controversial. Eguchi et al. reported that blood Ly6C+ monocyte-derived, not tissue-resident, macrophages were the pathogenic cells that dampened β cell function (Eguchi et al., 2012). However, other reports showed that resident macrophages impair β cell function (Westwell-Roper et al., 2014). Moreover, whether macrophages also participate in the adaptive expansion of β cell mass in the pre-diabetic stage remains to be determined.
Here, we applied both diet-induced and genetically induced rodent models of obesity to define the nature of islet inflammation. Our data revealed new features of obesity-associated islet metaflammation, highlighting the dominant role of islet-resident macrophages in the immunopathology affecting β cell dysfunction. We also assessed the heterogeneity and functionality of these islet macrophages. Specifically, we identified two distinct subsets of islet macrophages, distinguished by anatomical distribution and phenotypes. We found that high-fat diet (HFD) triggered a local expansion of intra-islet macrophages, independent of recruitment from circulating monocytes. Finally, we demonstrated that intra-islet macrophages exerted a role in regulating both β cell proliferation and function, suggesting a complex crosstalk network between immune and β cells.
RESULTS
Identification of Islet-Resident Myeloid Subsets in Lean and Obese Mice
Increased numbers of immune cells in the pancreas during the development of obesity and T2DM have been reported (Cucak et al., 2014; Eguchi et al., 2012; Ehses et al., 2007; Richardson et al., 2009). However, the phenotypic and functional profiles of these islet immune cells have not been elucidated. We analyzed longitudinal changes in leukocyte populations (CD45+) in pancreatic islets of male C57BL/6 (B6) mice fed HFD for 1–30 weeks. Twenty-four-week-old mice fed a normal chow diet (NCD) were used as controls. Using only DAPI staining, the islets of Langerhans can be clearly distinguished from the exocrine pancreas (Figure S1A). CD45+ immune cells are detected in the islets at low abundance in NCD mice. Short-term (<5 weeks) HFD feeding modestly, and non-significantly, increased the accumulation of immune cells. However, islet accumulation of immune cells was dramatically increased after more prolonged HFD feeding (>16 weeks) (Figure 1A). Thus, flow cytometry analyses revealed that the CD45+ cell population was increased in 16-week HFD mouse islets, compared with age-matched NCD controls (Figure S1B). An extended period of HFD feeding up to 30 weeks did not further increase immune cell accumulation, suggesting a possible saturation of niche occupancy in pancreatic islets by immune cells. On the other hand, the number of CD45+ cells was comparable between young (8-week-old) and aged (36-week-old) NCD islets (Figure S1C), suggesting that aging alone does not induce islet inflammation. CD45+ cell accumulation was also observed in pancreatic islets of leptin-deficient (ob/ob) mice (Figure S1D).
Figure 1. Obesity-Associated Islet Inflammation Is Dominated by Myeloid Lineage Cells.

(A) Immunofluorescence staining of pancreatic frozen sections prepared from wild-type B6 mice fed with HFD for various periods of time as indicated. 24-week-old NCD mice were used as controls. (Left) Representative images of CD45 staining. Dotted line depicts the border of an islet (same depiction for the rest of the figures). (Right) Statistics of the number of CD45+ cells per islet. 5–7 mice per group.
(B) The expression of CD11b and Ly6C in CD45+ immune cells Isolated from the pancreases of age-matched NCD and HFD mice (with HFD for 16 weeks), respectively.
(C) The fractionations of islet immune cells as in (B) based on their expression of CD11c and F4/80and analyzed by flow cytometry. Shown are the percentages of each subset in CD45+ CD11b+ cells.
(D) The mean fluorescence intensity (MFIs) of F4/80 and CD11c proteins in the R1 and R2 subsets from NCD and HFD mice, as in (C).
(E) The percentages of the R1 (F4/80hiCD11c−) and R2 (F4/80loCD11c+) subsets in the islets of NCD and HFD mice as in (C).
(F) Immunofluorescence staining of pancreatic frozen sections of NCD and HFD mice as in (A) to examine the expression patterns of CD11c and MHCII.
Student’s t test was used, and statistic data are expressed as mean ± SEM. Data are representative of three(A–E), and four(F) experiments. (B–F) n = 3–4 in each group. *p < 0.05; **p < 0.01; n.s., non-significant. Scale bar, 50 μm.
Also see Figures S1–S3.
To dissect the cellular components of CD45+ immune cells in obese islets, we performed flow cytometric analysis using antibodies against specific immune cell surface markers. We found that the majority of islet-accumulated immune cells were CD11b+, indicating a myeloid lineage (Figure 1B). A small proportion (2%–3%) of CD11b+ cells were also Ly6C+. However, HFD did not increase the percentage of these CD11b+Ly6C+ monocytes in the islets (Figure 1B). We next parsed out subpopulations of CD11b+Ly6C− cells using two surface markers: CD11c and F4/80. As shown in Figure 1C, we found two distinct subsets (namely, CD11c− [R1] and CD11c+ [R2]) in both NCD and HFD mouse islets. Both subsets were positive for F4/80, except that the expression of F4/80 was substantially greater in the R1 compared to the R2 subset (Figures 1C, 1D, and S2A). Moreover, the expression of CD11c was significantly higher in the R2 cells compared to R1 cells in both NCD and HFD mice (Figures 1C, 1D, and S2B). Interestingly, the ratio between these two myeloid subsets was substantially changed after HFD feeding. In NCD mice, the majority (82.6% ± 0.96%) of the islet immune cells were the CD11c− subset, whereas, in HFD mice, the dominant islet immune compartment was the CD11c− subset (68.3% ± 3.1%) (Figure 1E). We next examined these subpopulations in situ using immunofluorescence staining. Consistent with the flow cytometric data, there were very few CD11c+ cells in NCD islets. However, the number of these cells was significantly increased after 16 weeks of HFD (Figure 1F). Of note, these CD11c+ cells were localized to the intra-islet compartment (Figures 1F and S2B). The majority (>90%) of these intra-islet CD11c+ cells expressed high levels of the major histocompatibility complex class II (MHCII) (Figure S2C). A similar pattern of islet accumulation of CD11c+ cells was also observed in ob/ob mice (Figure S1E). In contrast, the CD11c− subset was highly enriched in the capsular area surrounding the islets, and HFD altered neither the abundance of these cells nor their tissue localization (Figure S1F). However, HFD also increased the expression of MHCII in these peri-islet cells (77% were MHCII+) (Figure S2C). Together, our studies identified two islet myeloid populations: intra-islet CD11c+ and peri-islet CD11c− cells, respectively. Obesity had a marked effect to increase the intra-islet CD11c+ population.
Our flow cytometric analyses of dispersed islets from either NCD or HFD mice did not reveal any population of adaptive immune cells (Figure S3A). To further confirm this, we performed immunostaining of frozen pancreatic sections from both NCD and HFD mice. At all time points from 1 week until 30 weeks of HFD feeding, there was no sign of T cell (either CD4+ or CD8+) or B cell (CD19+) accumulation in the islets (Figures S3B and S3C). However, in the exocrine pancreas, CD4+ and CD8+ T cells can be detected at low abundance level, and there was no difference between NCD and HFD mice (Figure S3D and data not shown). These results suggest the unique nature of obesity-associated islet inflammation, whereby myeloid lineages dominate islet-inflammation, without the involvement of adaptive immune cells.
Obesity Alters the Islet Macrophage Transcriptome
To define the lineage identity and functional properties of these islet myeloid subtypes under lean or obese conditions, we isolated each population from the islets of NCD and HFD mice and performed RNA-sequencing (RNA-seq) analysis. Hierarchical clustering analysis showed that the replicates of each cell subset were clustered together (Figure S4). First, we asked whether these islet myeloid cells (especially the intra-islet CD11c+ subset) were macrophages or dendritic cells (DCs). Thus, we analyzed the expression of reported macrophage-specific (Gautier et al., 2012) and DC-specific genes (Miller et al., 2012) in each subset. We found that the transcriptomes of both intra-islet CD11c+ and peri-islet CD11c− cells exhibited a clear skewing toward the macrophage, and not DC, identity (Figure S5A). Furthermore, using quantitative RT-PCR and flow cytometry, we analyzed the expression of a panel of markers that are either macrophage specific (Mertk and CD64) (Gautier et al., 2012), or DC specific (Zbtb46) (Meredith et al., 2012; Satpathy et al., 2012). Mertk, but not Zbtb46, was abundantly expressed in intra-islet CD11c+ cells sorted from either NCD or HFD mice (Figure S5B), supporting a macrophage phenotype. Both CD11c+ and CD11c− cells from NCD or HFD mice were positive for CD64 expression (Figure S5C), consistent with a macrophage phenotype (Figure S5C). Thus, both intra-islet CD11c+ and peri-islet CD11c− myeloid subsets are macrophages.
Next, we asked how obesity altered the gene expression profiles of these two islet macrophage subtypes. Compared to macrophages isolated from other tissues, including brain, kidney, liver, skin, and subcutaneous fat (Mass et al., 2016; Pirzgalska et al., 2017), the intra-islet macrophages (ii-macs) and peri-islet macrophages (pi-macs) from either NCD or HFD mice clustered together, regardless of metabolic conditions (Figure 2A), suggesting that the local tissue environment is key to establishing the transcriptional program of these cells (Gosselin et al., 2014; Lavin et al., 2014). Next, we examined how obesity affected the pro- (M1-like) versus anti-inflammatory (M2-like) status of intra- and peri-islet macrophages. Using M1 and M2 macrophage gene signatures from published resources (Jablonski et al., 2015; Murray, 2017), we found that only a small fraction of M1 signature genes were upregulated by HFD in either intra-islet, or peri-islet, macrophages (Figure 2B, clusters 1 and 2). Of note, other subsets of M1 genes were even downregulated by HFD (Figure 2B, clusters 3 and 4). On the other hand, distinct subsets of M2 signature genes in intra-islet or peri-islet macrophages were downregulated by HFD (Figure 2C, clusters 1 and 2). Thus, the gene expression influenced by HFD in these islet macrophage subtypes spread along a broad spectrum of macrophage differentiation, rather than a simple M1 or M2 polarization. We then asked what signaling pathways were specifically regulated by HFD in islet macrophages. Interestingly, HFD exerted a more profound effect on peri-islet than on intra-islet macrophages, based on the numbers of differentially expressed (DE) genes (Figure 2D versus Figure 2F). Using gene ontology (GO) algorithms, we performed functional annotations of these DE genes. We found that the top enriched pathways in HFD-upregulated genes in the intra-islet macrophages were linked to hormone production and synapse formation (Figure 2E). In contrast, HFD-downregulated genes in the intra-islet macrophages were mostly linked to cell trafficking and immune regulation (Figure 2E; Tables S1 and S2). In parallel, GO analysis of DE genes in the peri-islet macrophages showed that HFD-upregulated genes were enriched in pathways of signal release and cell-cell adhesion, whereas HFD-downregulated genes were more relevant to myeloid activation, or GTPase signaling (Figure 2G; Tables S3 and S4). Thus, HFD induced diverse effects, and not just a shift of M1/M2 status, in islet macrophages.
Figure 2. Transcriptional Profiles of Islet Macrophages.

(A) PCA analysis of islet macrophages under NCD and HFD conditions, in comparison with macrophages from other tissues.
(B and C) The expression of M1 (B) and M2 (C) signature genes in isolated islet macrophages from NCD and HFD mice. Mean values from three replicates were shown.
(D) Volcano plot showing the fold change (x axis) versus adjusted (adj.) p value(y axis) of the transcriptomes of CD11c+ intra-islet macrophages (ii-macs) between NCD and HFD mice. Genes highlighted in red or blue are based on the thresholds of Log2 fold change > 1 and adj. p value < 0.01.
(E) Top 5 pathways in ii-macs that were either activated (red) or repressed (blue) by HFD. “log10(P)” is the enrichment p value in log base 10.
(F) Volcano plot showing the fold change (x axis) versus adj. p value (y axis) of the transcriptomes of CD11c− peri-islet macrophages (pi-macs) between NCD and HFD mice. Genes highlighted in red or blue are based on the thresholds of Log2 fold change > 1 and adj. p value < 0.01.
(G) Top 5 pathways in pi-macs that were either activated (red) or repressed (blue) by HFD. “log10(P)” is the enrichment p value in log base 10. Data are representative of three replicates. ii-macs, intra-islet CD11c+ macrophages; pi-macs, peri-islet CD11c− macrophages; SubQ, subcutaneous; GO, gene ontology.
Islet Macrophages Are Not Recruited from Circulating Monocytes
We next examined the sources of these two subsets of islet macrophages. Previous studies have reported that Ly6C+ monocytes were recruited into pancreatic islets in an experimental model of T2DM induced by saturated fatty acids (Eguchi et al., 2012). We assessed this possibility in HFD mice. Using an adoptive transfer system (Figure 3A), blood Ly6C+ monocytes from either ACTbEGFP (Okabe et al., 1997) or Ccr2RFP/RFP mice (Saederup et al., 2010) were sorted, mixed at a 1:1 ratio, and intravenously (i.v.) transferred into HFD mice. 1 week after the transfer, pancreatic frozen sections were analyzed for the accumulation of transferred cells. There were no RFP+ monocytes observed in the pancreas, suggesting that tissue accumulation of transferred monocytes is CCR2 dependent, as previously implicated in adipose tissue (Weisberg et al., 2006). In contrast, wild-type (WT) EGFP+ monocytes were detected in pancreatic sections. Surprisingly, these monocytes accumulated in the capsular area of the islets (Figure 3B), with almost no infiltration into the islets. To understand why monocytes were “trapped” in the peripheral area of the islets, we examined the expression of the CCR2 ligand –CCL2 (also called MCP-1) in situ. Interestingly, we found a higher gradient of CCL2 surrounding the islets (Figure 3C, left). Over 85% of CCL2+ cells in the peri-islet area were also F4/80+, as shown in a representative and magnified view of CCL2 and F4/80 co-staining (Figure 3C, right), indicating that CCL2 is mainly produced by peri-islet macrophages. These findings suggested that the specific anatomical accumulation of adoptively transferred CCR2+ monocytes was, at least in part, due to the gradient distribution of CCL2 in the same areas.
Figure 3. Islet Macrophages Are Not Recruited from Circulating Monocytes.
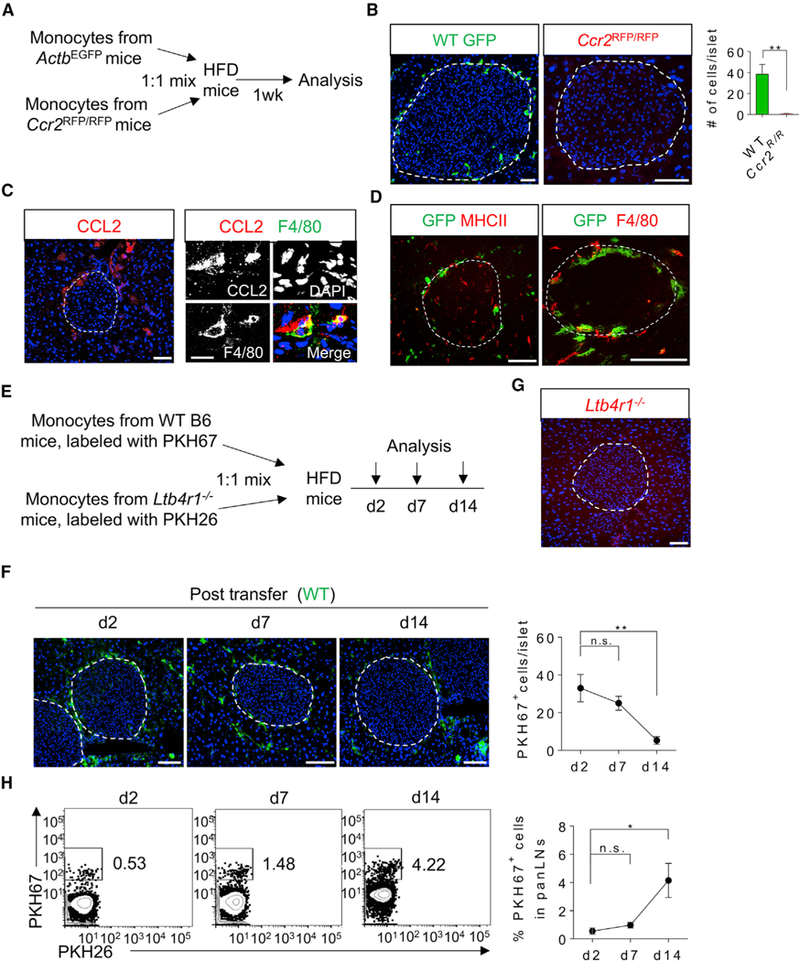
(A) Schematic diagram illustrating in vivo tracking of ACTbGFP wild-type (WT) or Ccr2RFP/RFP donor monocytes in HFD WT recipient mice.
(B) Immunofluorescence staining of pancreatic frozen sections of 24-week-old HFD mice (with HFD for 16 weeks) received either wild-type or Ccr2-deficient monocytes. Pseudo-colors: green, wild-type monocytes; red, Ccr2-deficient monocytes.
(C) (Left) Immunostaining of CCL2 in the pancreas of 24-week-old HFD mice (representative image from three mice with more than ten islets examined in each mouse). (Right) Co-staining of CCL2 and F4/80 in the peri-islet area of pancreatic sections from the same cohort of mice.
(D) Immunofluorescence staining of the same pancreatic frozen sections as in (B) for the expression of MHCII (red, left panel) or F4/80 (red, right panel). Green pseudo-color depicts transferred WT monocytes.
(E) Experimental design of adoptive transfer of monocytes isolated from WT B6 mice and Ltb4r1−/− NCD mice and labeled in vitro with PKH67 and PKH26, respectively.
(F and G) Immunofluorescence staining of pancreatic frozen sections of mice received monocytes prepared as in (E) and analyzed for PKH67-labeled WT monocytes (F) at indicated time points and PKH26-labeled Ltb4r1−/− monocytes 7 days after the transfer (G).
(H) Flow cytometric analysis of transferred monocytes that were accumulated in panLNs at various time points as indicated.
Student’s t test was used, and statistic data are expressed as mean ± SEM (A–D); n = 4 per group; (E–G) n = 3 per group. *p < 0.05; **p < 0.01. Scale bars, 50 μm (B; C, left panel; D; F; G), 10 μm (C, right panel).
Our results showed that adoptively transferred WT monocytes were almost exclusively localized to the peri-islet capsule area and did not penetrate to the intra-islet compartment. Interestingly, very few transferred monocytes gained the expression of MHCII or F4/80, suggesting that the differentiation of monocytes into macrophages was interrupted (Figure 3D). To further assess the fate of these monocytes, we analyzed the kinetics of transferred monocytes both in situ in pancreatic islets and in pancreas-draining lymph nodes (panLNs) (Figure 3E). Monocytes labeled with PKH67, a fluorescent dye, were transferred into syngeneic mice that had been fed with HFD for 20 weeks. At 2, 7, and 14 days post-transfer, both pancreases and panLNs were excised and analyzed for the presence of PKH67-positive cells. We observed a similar pattern of peri-islet accumulation of transferred monocytes (Figure 3F). LTB4 is a chemotactic eicosanoid involved in immune cell tissue migration (Li et al., 2015). We asked whether LTB4 was involved in the peri-islet accumulation of monocytes. In this regard, circulating monocytes from Ltb4r1−/− mice were isolated and labeled in vitro with PKH26 and i.v. transferred into HFD-fed mice. In contrast to WT monocytes, there were no Ltb4r1−/− monocytes detected in the pancreas of recipient mice (Figure 3G), suggesting that, in addition to CCR2, the LTB4/Ltb4r1 axis is also required for the pancreas trafficking of circulating monocytes.
The number of accumulated monocytes at the capsular area of the islets declined over a 2 week time window (Figure 3F). Since we did not observe a further differentiation of these cells into tissue macrophages (Figure 3D), we speculated that the decline of their abundance was due to cell death (Yona et al., 2013), or recirculation by exiting peripheral tissues and entering draining LNs. Indeed, we observed a simultaneous increase of transferred monocytes in panLNs over the same time period (Figure 3H).
Intra-islet Macrophages Expand Locally with Increased Proliferation in Obesity
The aforementioned observations suggest that the obesity-induced increase in CD11c+ intra-islet macrophages was due to local proliferation. To assess this possibility, both NCD- and HFD-fed mice were given bromodeoxyuridine (BrdU) in their drinking water for 2 weeks. Pancreatic sections were prepared at the end of the BrdU labeling and examined for BrdU incorporation into islet macrophages (Figure 4A). Since both intra- and peri-islet macrophages from HFD mice expressed MHCII, while β cells do not (Figure S2D), MHCII staining of tissue sections was used to mark all macrophages, distinguishing them from β cells. In NCD mice, BrdU+ macrophages were barely detected (1.16% ± 0.45%). However, BrdU+ macrophages were markedly increased in HFD-fed mice (7.5% ± 0.91%) (Figure 4B). Flow cytometric analysis of different cohorts of mice treated with BrdU confirmed the marked proliferation of intra-islet macrophages in HFD mice (1.96% ± 0.77% versus 14.85% ± 2.25%; Figure 4C). In contrast, this increased proliferation of resident macrophages was not observed in the peri-islet macrophage compartment in obese mice (Figure 4C). These data reveal local proliferation of resident macrophages as a new mechanism accounting for the accumulation of intra-islet macrophages under obese conditions.
Figure 4. Obesity Induces a Local Expansion of Intra-Islet Macrophages.

(A) Experimental design of BrdU incorporation assays.
(B) Representative immunofluorescence staining of pancreatic frozen sections (left) and statistics (right) of age-matched NCD and HFD mice (16 weeks of HFD feeding) to measure the cells labeled with BrdU and the expression of MHCII. Arrows depict proliferating macrophages. Insets depict higher magnifications of the stainings for BrdU and MHCII.
(C) Flow cytometric analysis of macrophage proliferation in mice prepared as in (B). Isolated islets were dispersed into single-cell suspension, and the incorporation of BrdU in CD11c+ intra-islet and CD11c− peri-islet macrophages was measured.
Student’s t test was used, and statistic data are expressed as mean ± SEM; n = 4 per group. **p < 0.01. ii-macs, intra-islet CD11c+ macrophages; pi-macs, peri-islet CD11c− macrophages. Scale bar, 50 μm.
Also see Figure S2.
Intra-islet CD11c+ Macrophages Impair β Cell Insulin Secretion
To examine the effects of the two islet macrophage subsets on β cell function, these cells were sorted from NCD or HFD mice and seeded onto culture plates with Min6 cells, a cell line that mimics primary β cells (Eguchi et al., 2012; Miyazaki et al., 1990). The ratio between seeded macrophage and Min6 cells was 1:5, similar to the macrophage to β cell ratio in HFD mouse islets. As seen in Figure 5A, basal insulin secretion at low-glucose conditions was not changed by addition of either intra- or peri-islet macrophages, regardless of diet. However, glucose-stimulated insulin secretion (GSIS) was decreased by addition of CD11c+ intra-islet macrophages isolated from NCD mice, and this effect was further enhanced when Min6 cells were co-cultured with intra-islet macrophages isolated from HFD mice (Figure 5A, lane 9 versus lane 6). In contrast, GSIS was not altered by CD11c− peri-islet macrophages isolated from either NCD or HFD mice (Figure 5A, lanes 8 and 10 versus lane 6). Next, to test whether cell-cell contact is required for this effect, isolated islet macrophage subsets were co-cultured with Min6 cells in Transwell plates for 24 hr. The cellular ratio between macrophages and Min6 cells was maintained at 1:5. Interestingly, in the Transwell plate settings, addition of either intra-islet or peri-islet macrophages from either NCD or HFD mice did not change insulin secretion under low- or high-glucose conditions (Figure 5B). Consistent with this, incubation of Min6 cells with macrophage-conditioned media did not alter GSIS (Figure 5C). Proliferation of Min6 cells, an insulinoma-derived, transformed β cell line, was not affected by adding CD11c+ intra-islet macrophages isolated from HFD mice (Figure S6A), indicating that the effects of macrophages on Min6 cell GSIS was not a consequence of altered cell proliferation.
Figure 5. Intra-Islet CD11c+ Macrophages Impair GSIS in Min6 and Primary β Cells.
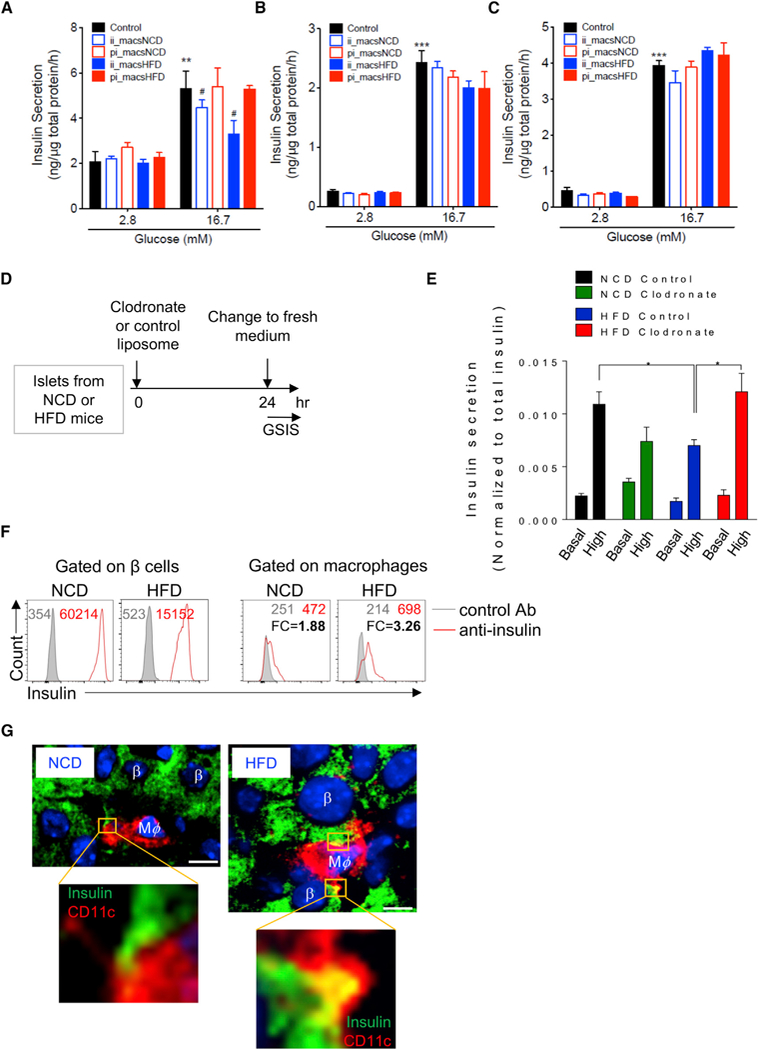
(A) Basal insulin secretion and GSIS inMin6 cells after direct cell-cell co-culture with or without intra-islet (CD11c+) or peri-islet (CD11c−) macrophages isolated from age-matched NCD and HFD mice. The cells were co-cultured ata5 (Min6 cells) to 1 (macrophages) ratio to reflect the cell ratio in HFD mouse islets. After 24 hr, insulin secretion was measured as described in the STAR Methods section. n = 4 per group.
(B) Basal insulin secretion and GSIS in Min6 cells after being co-cultured with macrophages in Transwell plates (0.4 mm polycarbonate filter). Min6 cells were plated at the bottom of the plates, and macrophages were added to the upper plates. The ratio between macrophages and Min6 cells was 1:5. n = 5 per group.
(C) Basal insulin secretion and GSIS in Min6 cells after being incubated with macrophage-conditioned media for 24 hr.n = 6 (control), n = 4 (CD11c− cells from NCD), and n = 2 (CD11c+ from NCD, CD11c− and CD11c+ cells from HFD mice). **p < 0.01 versus lane 1; ***p < 0.001 versus lane 1; #, p < 0.05 versus lane 6.
(D) Experimental design to test macrophage depletion and β cell GSIS. The islets were freshly isolated from NCD and HFD mice and cultured in vitro in the presence of clodronate liposome or control liposome (7 mg/mL, 1:100 dilution) for 24 hr.
(E) The basal insulin secretion and GSIS from primary islets isolated from NCD and HFD mice with the presence or absence of macrophages. n = 5 per group. *p < 0.05.
(F) Intra-islet macrophages from NCD or HFD mice were co-cultured with primary islets for 3 days. The expression of insulin was measured using flow cytometry with anti-insulin mAb in both β cells and macrophages. The numbers in each panel depict the MFIs of insulin expression (red) in comparison with isotype control (gray). FC, fold change.
(G) Immunostaining of NCD and HFD pancreases. β cells were identified by anti-insulin staining and macrophages by anti-CD11c. Note that the HFD macrophage filopodia contained insulin signals (yellow). Scale bar, 5 μm.
Student’s t test was used, and statistic data are expressed as mean ± SEM; ii-macs, intra-islet CD11c+ macrophages; pi-macs, peri-islet CD11c− macrophages.
Also see Figure S6.
Together, these results suggest thatobesity-stimulatedCD11c+ intra-islet macrophages may impair β cell function in a cell-cell contact-dependent manner. To more directly assess the effects of these intra-islet macrophages on primary β cells, we performed GSIS analysis on freshly isolated islets from NCD and HFD mice, respectively (Figure 5D). To directly determine whether ablation of macrophages altered β cell GSIS, we treated isolated islets ex vivo with clodronate liposomes, which preferentially deplete macrophages (Moreno, 2018). Compared to control liposome treatment, overnight treatment with clodronate liposomes efficiently depleted >95% of the islet macrophages (Figure S6B). In the absence of macrophages, we found that GSIS in HFD β cells was enhanced (Figure 5E), suggesting that intra-islet macrophages have a dampening role on islet β cell insulin secretion. As controls, clodronate treatment had no effect on GSIS in NCD islets (Figure 5E), nor did it have any direct effect on GSIS when added to Min6 cells (Figure S6C).
Next, we conducted additional studies to further understand how islet macrophages impair β cell insulin secretion in HFD/obese islets. Previous studies have reported that islet macrophages can capture intact insulin containing secretory vesicles from β cells (Vomund et al., 2015; Zinselmeyer et al., 2018). We assessed this concept in our system by measuring the intensity of the insulin signal within macrophages after they were co-cultured with islets. Using flow cytometric analysis with anti-insulin antibodies, we found that the insulin signal can be detected in macrophages from both NCD and HFD mice, but the signal intensity was much greater in the HFD islet macrophages (Figure 5F). These findings were extended by additional experiments in which immunostaining of NCD and HFD pancreatic sections showed that insulin was captured inside the macrophage filopodia-like structures (Figure 5G). In addition, an electron microscopic analysis revealed the presence of typical β cell insulin secretory granules engulfed by adjacent macrophages, and this effect was much more pronounced in HFD islets (Figure S6E). Importantly, our RNA-seq analysis showed that the intra-islet macrophages from HFD mice expressed a large number of insulin transcripts (Figure S6F). This detection of insulin mRNA in macrophages was not due to contamination of the isolated macrophages with β cells or macrophage/β cell fusion, since the expression of other classical β cell signature genes (e.g., Pdx1 and Nkx6–1) was not detected in the macrophages. Together, these findings, using a variety of different approaches, suggest that the engulfment of β cell secretory vesicles by intra-islet macrophages from HFD mice could account for, at least, one mechanism leading to reduced β cell GSIS.
Both Intra-islet and Peri-islet Macrophages Can Promote β Cell Proliferation
Increased β cell proliferation in obese islets is a well-recognized phenomenon (El Ouaamari et al., 2016; Stamateris et al., 2013). Consistent with this, we found that the percentage of BrdU+ β cells was significantly elevated in HFD mice (8.1% ± 0.67%), compared to NCD mice (1.45% ± 0.67%) (Figure 6A). In contrast, the proliferation rate of glucagon+ α cells was low in NCD (0.54% ± 0.28%) mice, and HFD did not significantly increase α cell turnover (0.83% ± 0.38%) (Figure 6B). Of note, we found that a significantly elevated proportion of cells were positive for both insulin and glucagon in HFD, but not in NCD islets (Figure 6C, arrowheads). We asked whether the occurrence of these dual-hormone-positive cells was due to increased replication under obese conditions. To answer this question, HFD mice were given BrdU in the drinking water for 2 weeks. Following this, pancreatic frozen sections were analyzed by immunostaining for insulin, glucagon, and BrdU. We found that the majority of BrdU+ cells were insulin+ glucagon− cells, and almost no insulin+ glucagon+ cells were detected by BrdU labeling (Figure 6D).
Figure 6. Obesity Increases the Proliferation and Dual Hormone Expression in β Cells.

(A) Immunostaining of pancreatic frozen sections of NCD and HFD mice showing the expression of insulin (green) and incorporation of BrdU (red). Inset image depicted one BrdU+ cell and one BrdU− cell.
(B) Immunostaining of pancreatic frozen sections of NCD and HFD mice showing the expression of glucagon (green) and incorporation of BrdU (red).
(C) Double staining for insulin and glucagon in pancreatic frozen sections of NCD and HFD mice. Insets (a and b) were shown in higher magnification. Arrowheads depict insulin/glucagon double-positive cells.
(D) Triple staining for insulin, glucagon, and BrdU in pancreatic frozen sections of HFD mice. Arrowheads depict BrdU-positive cells.
Student’s t test was used, and statistic data are expressed as mean ± SEM; n = 6 per group. **p < 0.01; ****p < 0.0001; n.s., non-significant. n.d., non-detected.
Scale bar, 50 μm.
It is unknown whether macrophages play a role in obesity-associated β cell expansion. We assessed this question by co-culturing primary islets isolated from adult B6 mice (8-week-old, NCD fed) with macrophages isolated from the islets of either HFD or age-matched NCD mice. Using 5-ethynyl-2′-deoxyuridine (EdU) incorporation to measure cell proliferation (Figure S7A) (Fu et al., 2014), we found that about 5% of β cells were labeled with EdU after 3 days of in vitro culture (Figure 7A). Inclusion of either CD11c+ intra-islet or CD11c− peri-islet macrophages isolated from NCD mice did not alter EdU+ β cell ratio. In contrast, the percentage of EdU+ β cells was markedly increased after the addition of either intra-islet or peri-islet macrophages isolated from HFD mice (Figure 7A). These data suggest that the obesity-associated islet microenvironment reprograms both macrophage subsets to gain the capacity to stimulate β cell proliferation.
Figure 7. Islet Macrophages from HFD Mice Can Promote β Cell Proliferation.

(A) (Left) Experimental design of co-culturing primary islets and isolated macrophages from NCD and HFD mice. (Right) The incorporation of EdU in insulin+ β cells after being co-cultured with ii-macs or pi-macs from NCD and HFD mice, respectively. n = 3–4 per group.
(B and C) The expression of Pdgfa in ii-macs and pi-macs from NCD and HFD mice.
(B) Representative peak tracks depicting reads per million reads aligned. Arrow indicates Pdgfa transcription start site and direction of transcription.
(C) Mean ± SEM of Pdgfa in intra- and peri-islet macrophages from NCD or HFD mice. Presented in TPMs (transcripts per kilobase million). Data are representative of three replicates.
(D) (Left) Experimental design of co-culturing primary islets and isolated macrophages from HFD mice, with PDGFR inhibitors, CP-673451. (Right) The percentages of proliferating β cells after being co-cultured with intra-islet macrophages isolated from HFD mice; in the presence of CP-673451; or DMSO control. Data are representative of two independent experiments. n = 5 per group.
Student’s t test was used, and statistic data are expressed as mean ± SEM. *p < 0.01; n.s., non-significant; ii-macs, intra-islet CD11c+ macrophages; pi-macs, peri-islet CD11c− macrophages; w/, with; w/o, without; Mϕ, macrophage; CP, CP-673451; EdU, 5-ethynyl-2′-deoxyuridine.
Also see Figure S7.
We next assessed which factors or pathways were involved in macrophage-mediated enhancement of β cell proliferation. Our RNA-seq analysis of isolated macrophage subsets from NCD or HFD mice showed that the expression of Pdgfa was increased in both intra- and peri-islet macrophages in HFD mice, compared to NCD mice (Figures 7B and 7C). The PDGF-PDGFR pathway can mediate β cell proliferation in both mice and humans (Chen et al., 2011). To determine whether the PDGF-PDGFR pathway was required for the macrophage-induced β cell proliferation, we added different concentrations of CP-673451, a small molecule inhibitor of both PDGFRα and PDGFRβ signaling (Chintalgattu et al., 2013), to the co-cultures of freshly isolated islets and intra-islet macrophages from HFD mice. β cell viability was not affected by CP-673451 (Figure S7B). The basal levels of β cell proliferation were not significantly affected by CP-673451 at either concentration (Figures 7D and S7C). In contrast, the PDGFR inhibitors suppressed macrophage-mediated β cell proliferation in a dose-dependent manner (Figure 7D). Proliferation of a cells was not affected by the addition of islet macrophages, nor by CP-673451 (Figure S7D). Thus, under obese conditions, islet macrophages promote β cell proliferation via a PDGFR signaling-dependent mechanism.
DISCUSSION
In this study, we provide an in-depth assessment of obesity-associated islet metaflammation in mice. In contrast to most other chronic tissue-inflammatory states that are composed of both innate and adaptive immune cells (Mathis, 2013; McLaughlin et al., 2017; Sell et al., 2012; Shalapour and Karin, 2015), obesity-associated islet inflammation is dominated by macrophages, with negligible involvement of adaptive immune cells. Two major subsets of islet-resident macrophages, exhibiting distinct anatomical locations (intra- versus peri-islet) and functional properties, were identified. Neither intra-islet nor peri-islet macrophages were derived from circulating monocytes. In contrast, obesity induced a significant increase in the local proliferation of intra-islet, but not peri-islet, macrophages. While intra-islet, but not peri-islet, macrophages impaired β cell function, both macrophage populations were capable of promoting β cell proliferation. Together, these findings highlight a central role of macrophages in modulating β cell adaptive responses and functional impairment.
What Is the Nature of Obesity-Associated Islet Metaflammation?
A hallmark of tissue inflammation is the accumulation and differentiation of various types of immune cells in local pathological lesions. Profiling immune cells and understanding their functional specifications provide essential clues as to how the immune system affects pathological processes. Using both diet-induced and genetically modified rodent models of obesity, we found that preexisting islet-resident macrophages predominantly (if not exclusively) occupied immuno-pathological niches in inflamed islets. We did not detect the accumulation of T cells, or B cells, excluding the involvement of the adaptive immune system in obesity-associated islet pathology. Other studies have observed adaptive immune cells and innate lymphoid cells in pancreatic islets (Dalmas et al., 2017; Diana et al., 2013). However, the extremely low frequency (less than one cell per islet [Dalmas et al., 2017]) suggests that these cells may not have a significant role in islet inflammation and β cell physiology. Although a decline of β cell mass and function is associated with both T1DM and T2DM, islet inflammation in obesity is in sharp contrast to what occurs during T1DM development, in which both lymphoid and myeloid lineage cells are readily detectable within pancreatic islets (Diana et al., 2013; Fu et al., 2012). Clinically, islet-reactive T cells in peripheral blood have been reported in both adult and pediatric T2DM patients (Brooks-Worrell et al., 1999, 2004; Goel et al., 2007). However, given that these patients were also positive for autoantibodies, it is likely more appropriate to categorize these cases as latent autoimmune disease in adults (LADA) or type 1.5 diabetes (Palmer et al., 2005). In line with this, classic autoantibody-negative T2DM patients were also negative for T cell responses to islet proteins (Palmer et al., 2005).
The accumulation of macrophages in the islets of human T2DM patients has also been reported (Butcher et al., 2014; Ehses et al., 2007; Kamata et al., 2014; Richardson et al., 2009). In these studies, increased intra-islet invasion of CD68+ macrophages was observed in pancreatic samples from T2DM patients (Ehses et al., 2007; Richardson et al., 2009), consistent with what we have found in obese mice showing an increase in intra-islet macrophages. The intensity of islet accumulation of these macrophages was reported to link to human T2DM pathogenesis, such as amyloid deposition (Kamata et al., 2014).
Obesity elicits profound effects on islet macrophages, leading to altered functions of both intra-islet and peri-islet macrophages. Of note, HFD did not induce a clear shift between M1 and M2 profiles in either macrophage subset. This is consistent with the increasingly recognized notion that the M1/M2 distinction is an oversimplified model, which does not recapitulate the more complex, mixed functional profiles of macrophages in vivo in inflamed tissues. For instance, in adipose tissues of obese mice, macrophages have been found to exhibit diverse phenotypes across a broad spectrum of M1/M2 polarization states (Kratz et al., 2014; Li et al., 2010; Lumeng et al., 2008). Interestingly, our genome-wide transcriptome analysis revealed that obesity reprograms islet macrophages to gain specific functions, such as synapse formation and cell-cell adhesion. Activation of these pathways may be required for macrophages to interact with endocrine cells, including β cells.
What Are the Sources of Islet Macrophages?
Our data reveal a new mechanism of intra-islet macrophage accumulation in obese mice. Our findings of islet-resident macrophage proliferation are consistent with a previous report showing that islet macrophages minimally exchange with blood cells and replicate at a low rate at steady state (Calderon et al., 2015). In NCD mice, we found that both intra-islet and peri-islet macrophages were maintained at a very low turnover rate (2%–5% BrdU+), lower than the rate reported in a previous study (Calderon et al., 2015). However, under obese conditions, we found that local proliferation of islet resident macrophages was significantly enhanced. Previous studies have reported that a type 2 immunity-skewing cytokine milieu, particularly IL-4, is required to elicit local macrophage proliferation (Jenkins et al., 2011, 2013). However, our gene-profiling analysis of islet macrophages suggests that an axis of IL-4 and M2 polarization seems unlikely to be involved in promoting islet macrophage proliferation. Interestingly, in obesity, local proliferation has also been demonstrated for adipose tissue macrophages (Amano et al., 2014; Braune et al., 2017; Haase et al., 2014; Tardelli et al., 2016). Multiple factors, including IL-6 (Braune et al., 2017), CCL2 (Amano et al., 2014), and osteopontin (Tardelli et al., 2016), are implicated in macrophage replication. Our data reveal a new scenario of local macrophage proliferation under inflamed conditions. We propose that intra-islet resident macrophage proliferation is an adaptive response to pathophysiological stimuli. However, the factors that mediate this effect remain to be defined.
The peri-islet macrophages are resident cells that can be detected at steady state (Geutskens et al., 2005; Thornley et al., 2016). We found that HFD altered the transcriptome, but not the abundance, of these macrophages. Using adoptive transfer assay, we found that transferred monocytes exhibited a propensity to reach the boundary between the exocrine and endocrine pancreas but failed to penetrate the islets. Furthermore, transferred monocytes did not appear to differentiate into macrophages in the pancreas. This interruption of monocyte differentiation at tissue sites has been reported in other studies (Jakubzick et al., 2013). A previous study has reported that saturated fatty acids trigger a wave of Ly6C+ inflammatory monocyte infiltration into pancreatic islets and differentiation into macrophages (Eguchi et al., 2012). These discrepancies may be due to differences in experimental settings, methods for detecting infiltrated cells, or the lack of a niche for infiltration. The latter possibility (i.e., competition for a tissue niche) was supported by a previous study showing that adoptively transferred monocytes can replace islet macrophages in mice after lethal irradiation, but not at steady state (Calderon et al., 2015). Notably, we did observe the appearance of transferred monocytes in the peri-islet capsular area. However, their presence seemed to be temporary, as our time course analysis showed increased accumulation of transferred monocytes in pancreas-draining LNs, with a simultaneous decline in peri-islet accumulation. This suggests there is a dynamic balance of monocyte trafficking and distribution between pancreatic islets to panLNs under inflamed conditions. Tissue-draining LNs are the primary site for differentiation of antigen-presentation cells (APCs) to primary naive T cells (Gagnerault et al., 2002; Hoglund et al., 1999). However, in contrast to the peri-islet macrophage, these monocytes did not differentiate into MHCII+ cells, suggesting that they did not gain the capacity of antigen presentation. Therefore, the migration of these APC-like cells to tissue-draining LNs is uncoupled from their maturation status.
Do Islet Macrophages Play a Role in Obesity-Associated β Cell Abnormalities?
Our data suggest that under obese conditions, islet macrophages (especially the intra-islet subset) play a role in β cell compensatory proliferation and functional impairment. First, we show that intraislet macrophages can directly impair β cell function. Previous studies have proposed that soluble factors such as IL-1β mediate the crosstalk between islet macrophages and β cells (Maedler et al., 2006; Nackiewicz et al., 2014). However, our co-culture and GSIS assays suggest that cell-cell contact is required for macrophages to impact β cell function in unstressed conditions. In line with this, transcriptome analysis showed that pathways involved in cell-cell communications were more activated in intraislet macrophages after HFD feeding. Our studies also reveal new mechanisms underlying the effect of macrophages to dampen β cell GSIS. First, our studies showed that the inhibition of GSIS was not present when using the Transwell system or macrophage-conditioned media and only observed in the context of direct co-culture with cell-cell contact, indicating the importance of cell contact in this phenomenon. To more directly demonstrate this, we went on to deplete macrophages ex vivo by treating isolated islets from NCD or HFD mice with clodronate. With this approach, we found that depletion of islet macrophages had a substantial effect to increase GSIS in β cells from HFD but not NCD mice. In our co-culture system, we also used flow cytometric analysis to demonstrate that the insulin content was substantially higher in macrophages from HFD islets compared to NCD islets. Importantly, our RNA-seq analysis demonstrated that the intra-islet macrophages from HFD mice exhibited a large amount of insulin transcripts. To further explore this phenomenon, we performed electron microscopy on islets from NCD and HFD mice. These results showed the presence of intact insulin secretory vesicles in macrophages adjacent to β cells in HFD mice. Together, these findings are suggestive of the concept that intra-islet macrophages in the obese state gain substantially enhanced capacity to engulf intact β cell insulin-containing secretory vesicles. Importantly, a similar phenomenon has already been elegantly demonstrated by Unanue’s group (Vomund et al., 2015; Zinselmeyer et al., 2018). While these earlier findings were in the context of T1DM, they clearly showed that islet macrophages engulfed bone fide, intact insulin secretory vesicles, comparable to what we found in the context of HFD islets. Recent studies have revealed that macrophages can form open-ended channels called tunneling nanotubes to transport cytoplasmic materials from the connected cells (Naphade et al., 2015; Nawaz and Fatima, 2017; Rocca et al., 2017). This could be one plausible mechanism explaining the transfer of insulin-containing vesicles from β cells to macrophages, and this process is significantly enhanced under obese conditions. Taken together, these data provide insights to a possible novel mechanism as to how macrophages can dampen β cell GSIS in the context of obesity. Others have shown that stress-mediated cytokine secretion can also impair β cell GSIS (Donath et al., 2008a, 2013; Eguchi et al., 2012). Thus, it is possible that inflammatory cytokine levels may be higher in the islet interstitium compared to the Transwell and macrophage condition medium settings. Our data, therefore, do not necessarily mean that macrophage-mediated secretory vesicle engulfment is the sole mechanism for decreased insulin secretion, but it is certainly an additional and new possibility.
Islet macrophages also participate in β cell compensatory proliferation. In adults, the turnover rate of β cells is extremely low. However, β cells are not permanently quiescent. Under certain conditions, such as pregnancy and obesity, these cells are able to re-enter the cell cycle. Adaptive expansion of β cell mass has been observed in the pre-diabetic stage in rodent models of obesity (Ebato et al., 2008; Hull et al., 2005; Mosser et al., 2015; Peyot et al., 2010; Stamateris et al., 2013). Multiple factors, including glucose (Alonso et al., 2007; Levitt et al., 2011; Porat et al., 2011), insulin (Assmann et al., 2009), and hepatocyte growth factor (Araújo et al., 2012; Demirci et al., 2012; Garcia-Ocana et al., 2000) can stimulate β cell replication under obese conditions. While signaling events mediated by these factors could act directly on β cells, it is also possible that islet macrophages play a direct role in β cell neogenesis. Our studies show that islet macrophages from obese mice exert an enhanced capacity to promote β cell proliferation, and both intra-islet and peri-islet macrophages exhibit a similar effect. With respect to mechanisms, we found that the expression of Pdgfa was increased in both CD11c+ intra-islet macrophages and CD11c– peri-islet macrophages. The PDGF/PDGFR pathway has been shown to play a role in mouse and human β cell proliferation (Chen et al., 2011), and since macrophages are a major source of PDGF (Jaguin et al., 2015; Onogi et al., 2017; Shimokado et al., 1985; Zhou et al., 2018), we hypothesized that HFD islet macrophages stimulate β-cell proliferation via this pathway. To test this possibility, we treated macrophage/β-cell co-cultures with PDGFR inhibitors at different doses. Our data show that basal levels of β-cell proliferation (without additional islet macrophages) were unaffected by PDGFR inhibition, while macrophage-mediated β-cell proliferation was markedly inhibited to basal values in a dose-dependent manner. Thus, the ligation of macrophage-derived PDGF to PDGFR on β-cells is at least one mechanism explaining why thesetwo islet macrophage populations from HFD mice promote β-cell proliferation. The role of macrophages in expanding β cell mass was also reported by several other studies. Xiao et al. reported that M2 macrophages were involved in β cell proliferation in a pancreatic duct ligation model (Xiao et al., 2014). Similar effects were also observed using Pdx1-DTR (Criscimanna et al., 2014) and a connective tissue growth factor-induced injury model (Riley et al., 2015).
Obesity leads to increased heterogeneity of β cells, reflected by the increased number of insulin+ glucagon+ cells in HFD mice. While this phenomenon has been implied in previous studies (Bensellam et al., 2018; Chera et al., 2014; Talchai et al., 2012; Thorel et al., 2010), it remains unclear whether the increase of these insulin+ glucagon+ cells under obese conditions was due to cell replication or transformation from pre-existing cells. Our data suggest that the increase of dual-hormone positive cells was unlikely a consequence of proliferation due to the lack of BrdU incorporation in these cells. This favors the possibility of transformation from pre-exiting cells. Different mechanisms including transdifferentiation from α cells (Chera et al., 2014; Thorel et al., 2010) or dedifferentiation from mature β cells (Bensellam et al., 2018; Talchai et al., 2012) have been proposed to explain the increase of these dual-hormone-positive cells in obese mice. Islet macrophages are a major source of these cytokines (Eguchi et al., 2012; Maedleret al., 2006; Nackiewicz et al., 2014), and thus, these cells may participate in obesity-induced β cell transdifferentiation and dedifferentiation.
In summary, we demonstrate that macrophages are the dominant immune components of obesity-associated islet inflammation. We find that mouse islets harbor two distinct resident macrophage subsets, distinguished by their anatomical locations and phenotypes. Obesity induces diverse effects on the transcriptomes of these two islet macrophage subsets. Specifically, intra-islet macrophages in obese mice expand locally without the recruitment of circulating monocytes. Moreover, our findings reveal new mechanisms of immune-β cell crosstalk in obesity, whereby intra-islet macrophages dampen β cell GSIS in a cell-cell contact-dependent manner, while both intra-islet and peri-islet macrophages can promote β cell compensatory proliferation. The phenomenon of relative insulin insufficiency in insulin-resistant states has been known and discussed for many years, and it has always been a lingering question as to why β cells from mice and humans who are insulin resistant and become hyperglycemic do not increase insulin secretion to fully compensate and keep glucose levels within the normal range. Perhaps these findings with islet macrophages provide some answers.
Limitations of the Study
So far there is no method that could lead to in vivo elimination of CD11c+ macrophages in an islet-specific manner. While CD11c-DTR mice are a useful model to deplete CD11c+ cells with diphtheria toxin (DT) treatment, this method deletes macrophages throughout the body, including adipose tissue, liver, and islets (Patsouris et al., 2008). Therefore, it is currently not possible to dissect in vivo islet-specific effects, since the systemic effects of macrophages are so robust. Moreover, we show in this study that islet macrophages exhibit a due role by dampening β cell GSIS and promoting β cell proliferation. Whether these two effects on β cells are caused by the same or different islet macrophage subsets requires further study. Single-cell techniques and targeted manipulations of different macrophage subsets may provide essential clues. Finally, the translation of these findings to human islets remains to be determined.
STAR★METHODS
CONTACT FOR REAGENT AND RESOURCE SHARING
Further information and requests for resources and reagents should be directed to and will be fulfilled by the Lead Contact, Wenxian Fu (w3fu@ucsd.edu).
EXPERIMENTAL MODEL AND SUBJECT DETAILS
Mice
C57BL/6 (B6) mice were fed a high-fat diet (60% fat calories, 20% protein calories, and 20% carbohydrate calories; Research Diets) or a normal chow diet ad libitum for various durations (ranged from 1 week to 30 weeks). In most assays, the mice were fed with HFD for 16 weeks. Ob/ob, ACTbEGFP, Ccr2RFP/RFP and Ltb4r1–/– mice (all were on a B6 background) were purchased from the Jackson Laboratory. The data presented in this study were derived from male mice. In most experiments, 8-week-old mice were fed with HFD for more than 16 weeks. Other experiments using mice with different ages were described in the text and figure legends. All mice were maintained on a 12/12-hr light-dark cycle at the room temperature of 20–22°C.
Study Approval
All animal procedures were done in accordance with University of California, San Diego Research Guidelines for the Care and Use of Laboratory Animals and all animals were randomly assigned to cohorts when used.
METHOD DETAILS
Isolation of Islet Macrophages
NCD and HFD mice were euthanized, and freshly prepared collagenase P (Roche, Indianapolis, IN) solution (0.5 mg/mL) was injected into the pancreas via the common bile duct. The perfused pancreas was digested at 37°Cfor20 min, and the islets were handpicked under a stereoscopic microscope, and then dispersed into single cell suspensions. Macrophages were labeled with mAbs against CD11b, CD11c, F4/80 and sorted using FACSAria II (BD, San Jose, CA).
Antibodies and Flow Cytometry
All staining began with incubation with a monoclonal antibody (mAb) for FcγR (2.4G2; BD Biosciences). mAbs used for flow cytometry were listed in Key Resources Table. Samples were acquired with a BD LSRFortessa (BD) and analyzed with FlowJo software (FlowJo, LLC, Ashland, OR).
KEY RESOURCES TABLE.
| REAGENT or RESOURCE | SOURCE | IDENTIFIER |
|---|---|---|
| Antibodies | ||
| Anti-mouse F4/80 | Thermo Fisher | Cat# MA516626; RRID: AB_2538122 |
| Anti-mouse F4/80 | BioLegend | Cat# 123116; RRID: AB_893481 |
| Anti-mouse CD11b | BioLegend | Cat# 101208; RRID: AB_312791 |
| Anti-mouse CD11c | TONBO | Cat# 50–0114-U100 |
| Anti-mouse CD206 | BioLegend | Cat# 141706; RRID: AB_10895754 |
| Anti-mouse CD103 | BioLegend | Cat# 121408; RRID: AB_535950 |
| Anti-mouse CD45 | eBioscience | Cat# 25–0451-82; RRID: AB_2734986 |
| Anti-human insulin | Abcam | Cat# ab7842; RRID: AB_306130 |
| Anti-glucagon | Sigma | Cat# G2654; RRID: AB_259852 |
| Anti-mouse MHCII | BioLegend | Cat# 107614; RRID: AB_313329 |
| Anti-mouse CD19 | BioLegend | Cat# 115508; RRID: AB_313643 |
| Anti-mouse Ly6c | BioLegend | Cat# 128006; RRID: AB_1186135 |
| Anti-mouse CD4 | BioLegend | Cat# 100516; RRID: AB_312719 |
| Anti-mouse CD8 | TONBO | Cat# 50–0081-U500 |
| Anti-mouse CD45 | BioLegend | Cat# 103112; RRID: AB_312977 |
| Chemicals, Peptides, and Recombinant Proteins | ||
| PKH26 | Sigma-Aldrich | Cat# PKH26GL-1KT |
| PKH67 | Sigma-Aldrich | Cat# MINI67 |
| 60% high-fat diet | Research Diets | Cat# D12492 |
| Collagenase P | Roche | Cat# 11249002001 |
| TRIzol RNA isolation reagent | Thermo Fisher Scientific | Cat# 15596026 |
| Bromodeoxyuridine (Brdu) | BD Biosciences | Cat# 550891 |
| EdU staining kit | Life Technologies | Cat# C10424 |
| EasySep mouse monocyte enrichment kit | STEMCELL Technologies | Cat# 19861 |
| RBC lysis buffer | eBioscience | Cat# 00–4333-57 |
| High-capacity cDNA reverse transcription kit | Thermo Fisher Scientific | Cat# 4368813 |
| iTaq SYBR Green supermix | Bio-Rad | Cat# 172–5125 |
| SMARTScribe Reverse Transcriptase | Clontech | Cat# 639537 |
| Betaine solution | Sigma | Cat# B0300–1VL |
| NEBNext High-Fidelity 2x PCR Master Mix | New England Biolabs | Cat# M0541S |
| CP-673451 | Selleckchem | Cat# S1536 |
| Clodronate liposome | FormuMax | Cat# F70101C-N |
| Control liposome | FormuMax | Cat# F70101-N |
| Critical Commercial Assays | ||
| Direct-zol microprep kit | Zymo research | Cat# R2060 |
| Insulin ELISA kit | ALPCO | Cat# 80-INSHU-E01.1 |
| Qubit dsDNA HS assay kit | Thermo Fisher Scientific | Cat# Q32851 |
| Nextera DNA library prep kit | illumina | Cat# FC-121–1030 |
| Deposited Data | ||
| Raw and analyzed data | This paper | GSE112002 |
| Experimental Models: Cell Lines | ||
| Min6 cell line | ATCC | CRL-11506 |
| Experimental Models: Organisms/Strains | ||
| Mouse: ob/ob (Lepob) mice | Jackson Laboratories | JAX: 000632 |
| Mouse: WT C57BL6/J | Jackson Laboratories | JAX: 000664 |
| Mouse: ACTbEGFP | Jackson Laboratories | JAX: 003291 |
| Mouse: Ccr2RFP/RFP | Jackson Laboratories | JAX: 017586 |
| Mouse: Ltb4r−/− | Jackson Laboratories | JAX: 008102 |
| Oligonucleotides | ||
| Mertk forward | Integrated DNA Technologies | CAGGGCCTTTACCAGGGAGA |
| Mertk reverse | Integrated DNA Technologies | TGTGTGCTGGATGTGATCTTC |
| Zbtb46 forward | Integrated DNA Technologies | GACACATGCGCTCACATACTG |
| Zbtb46 reverse | Integrated DNA Technologies | TGCACACGTACTTCTTGTCCT |
| Actb forward | Integrated DNA Technologies | GGCTGTATTCCCCTCCATCG |
| Actb reverse | Integrated DNA Technologies | CCAGTTGGTAACAATGCCATGT |
| Software and Algorithms | ||
| Prism6 | Graphpad | https://www.graphpad.com/scientific-software/prism/ |
| FlowJo | FlowJo | N/A |
| ImageJ | NIH | https://imagej.nih.gov/ij/ |
| Metascope | Tripathi et al. (2015) | http://metascape.org |
| STAR | Dobin et al. (2013) | https://code.google.com/archive/p/rna-star/ |
In Vitro Mouse Islet Culture
For in vitro culture of mouse islets, mice (8-week-old, males) were euthanized, and freshly prepared collagenase P (Roche) solution (0.5 mg/mL) was injected into the pancreas via the common bile duct. The perfused pancreas was digested at 37°C for 20 min, islets were handpicked under a stereoscopic microscope, and then were cultured in complete RPMI1640 medium for 3 days alone, or with the addition of isolated macrophages from NID or HFD mice. In some experiments, CP-673451 was added to the cultures of islets alone or islets plus macrophages at the concentrations indicated in the figures. EdU (1 μM) was added during the last 24 hr of culture. After culture, islets were dissociated into a single-cell suspension, and were analyzed for intracellular EdU incorporation detection and insulin staining.
β Cell Proliferation Assay
For EdU incorporation assay, single-cell suspensions were prepared, fixed and permeabilized using eBioscience Fixation/Permeabilization set (Cat# 00–5123, 00–5223). They were then stained using the EdU staining kit (Click-iT EdU Flow Cytometry Assay Kits; Invitrogen) following the user’s manual. Samples were acquired with a LSRFortessa (BD Bioscience) and analyzed with FlowJo software (FlowJo, LLC).
Monocyte Preparation
After red blood cell lysis, circulating monocytes from C57/BL6 WT, Ltb4r–/–, ACTbEGFP, or Ccr2RFP/RFP mice were enriched with EasySep mouse monocyte enrichment kit (STEMCELL Technologies) following the manufacturer’s instructions.
In Vitro Labeling
Isolated monocytes from C57/BL6 or Ltb4r–/– mice were washed in serum-free RPMI-1640 and then suspended in PKH26 or PKH67 labeling buffer (containing 2×10⁻³ M PKH26 or PKH67; Sigma-Aldrich). After 10 min incubation in the dark, the PKH26 or PKH67 labeling assay was stopped by adding an equal volume of medium supplemented with 10% FBS. The mixture was centrifuged, and the cells were washed once and resuspended in PBS.
In Vivo Monocyte Tracking
A mixture of PKH26-labled Ltb4r–/– monocytes (0.5×10⁶) and PKH67-labeled WT monocytes (0.5×10⁶), or a combination of WT (from ACTbGFP) (0.5×10⁶) and CCR2-deficent (from Ccr2RFP/RFP mice) (0.5×10⁶) monocytes was adoptively transferred into each 16-week HFD-fed WT recipient mouse via intravenous injection. The presence of reporter-expressing cells or PKH-labeled cells in the islet of recipient mice were examined by flow cytometry.
In Vivo BrdU Labeling
The drinking water containing BrdU (0.5 mg/mL; BD Biosciences) was fed to NCD or HFD mice. After 2 weeks, pancreas was isolated and embedded in OCT reagent for further immunofluorescent staining analysis.
Immunofluorescence Staining
Pancreases were cut and snap frozen in optimum cutting temperature (O.C.T., Fisher Healthcare). Six mm cryo-sections of tissue sections were cut and fixed with pre-cold acetone for 20 min. Immunostaining was performed as previously described. Before adding primary mAbs, sections were blocked with 5% normal donkey serum (Jackson ImmunoResearch). mAbs used for immunofluorescence staining in this study were listed in Key Resource Table. Forco-staining of BrdU andcell-surface proteins, acetone fixed frozen tissue sections were blocked using 5% donkey serum (Jackson ImmunoResearch) for two hr at room temperature. Then, sections were first stained with anti-MHCII antibody at 1:200 dilution in PBST (0.1% Tween-20 with 0.5% BSA) for 1 hr at room temperature. After washing, slides were fixed with 4% PFAfor 15 min at room temperature. Then, slides were subsequently incubated in hydrogen chloride (HCl, 1M)for 10 min on ice, HCl (2M)for20 min at 37°C, and Borate Buffer (0.1M pH 9.0) for 10 min at room temperature. After DNA hydrolysis, standard immunocytochemistry protocol was followed with primary anti-BrdU antibody, followed by secondary antibody. Nuclei were stained with DAPI (4’,6-Diamidino-2–28 phenylindole dihydrochloride). Images were acquired on an AxioImager microscope (Zeiss, Thornwood, NY), and were processed with ImageJ (NIH, Bethesda, MD). The immunofluorescence staining results were scored by two independent observers in an unblinded manner.
Quantitative Reverse Transcriptase-polymerase Chain Reaction (RT-PCR) Analysis
Total RNA was extracted from islet macrophages using the Trizol extraction protocol according to the manufacturer’s instructions (Zymo Research). cDNA was synthesized using SuperScript III and random hexamers. qPCR was carried out in 10 μL reactions using iTaq SYBR Green supermix on a StepOnePlus Real-Time PCR Systems (ThermoFisher Scientific). The data presented correspond to the mean of 2–ΔΔCt from at least three independent experiments after being normalized to β-actin.
Glucose-Stimulated Insulin Secretion (GSIS) Assays
Min6 cells were grown in DMEM containing 5 g/L glucose, 10% v/v FBS, 0.1% v/v Penicillin/Streptomycin. For co-culture experiments, Min6 cells were grown in down plates of Transwell plates and isolated islet macrophages were directly added to the down plates where Min6 cells were growing or into upper plates at 1 (macrophage) to 6 (Min6) ratio. Macrophage conditioned media was harvested after incubating islet macrophages in serum free DMEM for 24h and was diluted into fresh serum free DMEM to match 1:6 cell ratio for later GSIS experiments. After 24h incubation with macrophages or in conditioned media, Min6 cells were subjected to GSIS. Static GSIS experiments were done as described previously (Lee et al., 2013). Briefly, after washing twice with 2.8 mM glucose DMEM, cells were incubated overnight in 2.8 mM glucose DMEM supplemented by 0.1% BSA, at 37°C, 5% CO2. Next day, the cells were washed with fresh 2.8 mM glucose Krebs Ringer Bicarbonate buffer (KRB buffer; 2.6 mM CaCl2/ 2H2O, 1.2 mM MgSO4/7H2O, 1.2 mM KH2PO4, 4.9 mM KCl, 98.5 mM NaCl, and 25.9 mM NaHCO3, supplemented with 20 mM HEPES and 0.1% BSA (Serological, Norcross, GA), and then incubated for 60 min in 2.8 mM or 16.7 mM glucose KRB buffer. Insulin concentrations in the supernatant were determined using Ultrasensitive mouse or human insulin ELISA kits (Alpco, Salem, NH).
Primary mouse islets isolated from both NCD and obese (fed HFD for 18–20 weeks) WT mice were also used to evaluate the effects of macrophage on GSIS. To deplete islet macrophages, primary islets were handpicked (30 islets for each replication) and incubated in DMEM medium with10 μl of clodronate liposome (7 mg/mL, FormuMax, Sunnyvale, CA). In the control groups, mouse islets were treated with empty liposomes (FormuMax, Sunnyvale, CA). After 24 hr, islets were washed and incubated in Krebs-Ringer buffer with 2.8 or 16.7 mmol/L glucose for 1 hr. Insulin concentration in the supernatant were determined by Ultrasensitive insulin ELISA kits (Alpco, Salem, NH).
RNA-Sequencing
Sequencing libraries were prepared according to the Smart-seq2 method (Picelli et al., 2013) with some modifications. 3000–5000 FACS isolated islet macrophages in Trizol (Thermo Fisher) were used as starting material. RNA was extracted with the Direct-zol MicroPrep kit (Zymo Research) with on-column DNaseI treatment. 10 μL of purified RNA was mixed with 5.5 μL of SMARTScribe 5X First-Strand Buffer (Clontech), 1 μL polyT-RT primer (2.5 μM, 5′-AAGCAGTGGTATCAACGCA GAGTAC(T30)VN-3′), 0.5 μL SUPERase-IN (Ambion), 4 μL dNTP mix (10 mM, Invitrogen), 0.5 μL DTT (20 mM, Clontech) and 2 μL Betaine solution (5 M, Sigma), incubated 50°C 3 min. 3.9 μL of first strand mix, containing 0.2 μL 1% Tween-20, 0.32 μL MgCl2 (500 mM), 0.88 μL Betaine solution (5 M, Sigma), 0.5 μL SUPERase-IN (Ambion) and 2 μL SMARTScribe Reverse Transcriptase (100 U/μL, Clontech) was added and incubated one cycle 25°C 3 min., 42°C 60 min. 1.62 mL template switch (TS) reaction mix containing 0.8 μL biotin-TS oligo (10 μM, Biotin-5′-AAGCAGTGGTATCAACGCAGAGTACATrGrG+G-3′), 0.5 μL SMARTScribe Reverse Transcriptase (100 U/μL Clontech) and 0.32 μL SMARTScribe 5X First-Strand Buffer (Clontech) was added, then incubated at 50°C 2 min., 42°C 80 min., 70°C 10 min. 14.8 μL second strand synthesis, pre-amplification mix containing 1 mL pre-amp oligo (10 mM, 5′AAGCAGTGGTATCAACGCAGAGT-3′), 8.8 μL KAPA HiFi Fidelity Buffer (5X, KAPA Biosystems), 3.5 μL dNTP mix (10 μM, Invitrogen) and 1.5 μL KAPA HiFi HotStart DNA Polymerase (1U/μL, KAPA Biosystems), was added, then amplified by PCR: 95°C 3 min., 8 cycles 98°C 20 s, 67°C 15 s and 72°C 6 min, final extension 72°C 5 min. The synthesized dsDNA was purified using Sera-Mag Speedbeads (Thermo Fisher Scientific) with final 8.4% PEG8000, 1.1M NaCl, then eluted with 13 μL UltraPure water (Invitrogen). The product was quantified by Qubit dsDNA High Sensitivity Assay Kit (Invitrogen) and libraries were prepared using the Nextera DNA Sample Preparation kit (Illumina). Tagmentation mix containing 11 μL 2X Tagment DNA Buffer and 1 μL Tagment DNA Enzyme was added to 10 μL purified DNA, then incubated at 55°C 15 min. 6 μL Nextera Resuspension Buffer (Illumina) was added and incubated at room temperature for 5 min. Tagmented DNA was purified using Sera-Mag Speedbeads (Thermo Fisher Scientific) with final 7.8% PEG8000, 0.98M NaCl, then eluted with 25 μL UltraPure water (Invitrogen). Final enrichment amplification was performed with Nextera primers, adding 1 mL Index 1 primers (100 μM, N7xx), 1 μL Index 2 primers (100 μM, N5xx) and 27 μL NEBNext High-Fidelity 2X PCR Master Mix (New England BioLabs), then amplified by PCR: 72°C 5 min., 98°C 30 s., 8–13 cycles 98°C 10 s, 63°C 30 s., and 72°C 1 min. Libraries were size selected, quantified Qubit dsDNA HS Assay Kit (Thermo Fisher Scientific), pooled and sequenced on a NextSeq 500 (Illumina) for 76 cycles at a depth of 25 tow 40 million single end reads per sample.
Fastq files from sequencing experiments were mapped to the mouse mm10 genome using default parameters for STAR (Dobin et al., 2013). Mapped data were analyzed with HOMER (Heinz et al., 2010) and custom R scripts. Normalized RNA-seq datasets were analyzed using Metascape (metascape.org) (Tripathi et al., 2015).
QUANTIFICATION AND STATISTICAL ANALYSIS
Statistical Analysis
The results are presented as mean ± standard error of mean (SEM) with the numbers of experiments or mice indicted in the figure legends. To assess whether the means of two groups are statistically different from each other, unpaired two-tailed Student’s t test was used for statistical analyses using Prism6 software (GraphPad software 6.0; Prism, La Jolla, CA). P values of 0.05 or less were considered to be statistically significant. Degrees of significance were indicated in the figure legends. No methods were used to determine whether the data met assumptions of the statistical approach.
DATA AVAILABILITY
RNA-seq Data
Transcriptome sequencing data of islet macrophages have been deposited in the Gene Expression Omnibus (GEO), with the accession number GSE112002. RNA-seq datasets of subcutaneous fat macrophages were from GSE103847 (Pirzgalska et al., 2017); RNA-seq datasets of CD4+ DC, CD8+ DC, plasmacytoid dendritic cells (pDC), peritoneal and alveolar macrophages were from GSE109125 (Heng and Painter, 2008); RNA-seq datasets of microglia, kidney, liver and skin were from GSE81774 (Mass et al., 2016).
Supplementary Material
Highlights.
Macrophages are the dominant immune cells in obesity-associated islet inflammation
Obesity provokes local proliferation of resident intra-islet macrophages
Intra-islet macrophages impair β cell function in a cell contact-dependent manner
Islet macrophages in obese mice promote β cell replication through PDGFR signaling
ACKNOWLEDGMENTS
We thank J. Olvera, C. Fine, and D. Hinz for help with cell sorting; G. Garcia for preparation of cryosections; and Y. Jones for electron microscope. This study was funded by the U.S. National Institute of Diabetes and Digestive and Kidney Diseases (DK074868 to C.K.G., DK063491 and DK101395 to J.M.O., and DK114427 to W.F.), the U.S. National Institute of Diabetes and Digestive and Kidney Diseases K99/R00 award (1K99DK115998 to W.Y.), the UCSD/UCLA Diabetes Research Center Pilot and Feasibility grants (W.Y., Y.S.L., and W.F.), UCSD CTRI UL1 TR000100 (W.F.) and JDRF 2-SRA-2016–306-S-B (W.F.), the American Heart Association 16POST29990015 (M.R.) and 16POST31350039 (W.Y.), and 111 Project B16021 (M.Y.).
Footnotes
SUPPLEMENTAL INFORMATION
Supplemental Information includes seven figures and four tables and can be found with this article online at https://doi.org/10.1016/j-cmet.2018.12.003.
DECLARATION OF INTERESTS
The authors declare no competing interests.
REFERENCES
- Aamodt KI, and Powers AC (2017). Signals in the pancreatic islet microenvironment influence β-cell proliferation. Diabetes Obes. Metab. 19 (Suppl 1), 124–136. [DOI] [PMC free article] [PubMed] [Google Scholar]
- Alonso LC, Yokoe T, Zhang P, Scott DK, Kim SK, O’Donnell CP, and Garcia-Ocaña A (2007). Glucose infusion in mice: a new model to induce beta-cell replication. Diabetes 56, 1792–1801. [DOI] [PMC free article] [PubMed] [Google Scholar]
- Amano SU, Cohen JL, Vangala P, Tencerova M, Nicoloro SM, Yawe JC, Shen Y, Czech MP, and Aouadi M (2014). Local proliferation of macrophages contributes to obesity-associated adipose tissue inflammation. Cell Metab. 19, 162–171. [DOI] [PMC free article] [PubMed] [Google Scholar]
- Araújo TG, Oliveira AG, Carvalho BM, Guadagnini D, Protzek AO, Carvalheira JB, Boschero AC, and Saad MJ (2012). Hepatocyte growth factor plays a key role in insulin resistance-associated compensatory mechanisms. Endocrinology 153, 5760–5769. [DOI] [PubMed] [Google Scholar]
- Assmann A, Ueki K, Winnay JN, Kadowaki T, and Kulkarni RN (2009). Glucose effects on beta-cell growth and survival require activation of insulin receptors and insulin receptor substrate 2. Mol. Cell. Biol. 29, 3219–3228. [DOI] [PMC free article] [PubMed] [Google Scholar]
- Banaei-Bouchareb L, Gouon-Evans V, Samara-Boustani D, Castellotti MC, Czernichow P, Pollard JW, and Polak M (2004). Insulin cell mass is altered in Csf1op/Csf1op macrophage-deficient mice. J. Leukoc. Biol. 76, 359–367. [DOI] [PubMed] [Google Scholar]
- Bensellam M, Jonas JC, and Laybutt DR (2018). Mechanisms of β-cell dedifferentiation in diabetes: recent findings and future research directions. J. Endocrinol. 236, R109–R143. [DOI] [PubMed] [Google Scholar]
- Braune J, Weyer U, Hobusch C, Mauer J, Brüning JC, Bechmann I, and Gericke M (2017). IL-6 regulates M2 polarization and local proliferation of adipose tissue macrophages in obesity. J. Immunol. 198, 2927–2934. [DOI] [PubMed] [Google Scholar]
- Brooks-Worrell BM, Juneja R, Minokadeh A, Greenbaum CJ, and Palmer JP (1999). Cellular immune responses to human islet proteins in antibody-positive type 2 diabetic patients. Diabetes 48, 983–988. [DOI] [PubMed] [Google Scholar]
- Brooks-Worrell BM, Greenbaum CJ, Palmer JP, and Pihoker C (2004). Autoimmunity to islet proteins in children diagnosed with new-onset diabetes. J. Clin. Endocrinol. Metab. 89, 2222–2227. [DOI] [PubMed] [Google Scholar]
- Butcher MJ, Hallinger D, Garcia E, Machida Y, Chakrabarti S, Nadler J, Galkina EV, and Imai Y (2014). Association of proinflammatory cytokines and islet resident leucocytes with islet dysfunction in type 2 diabetes. Diabetologia 57, 491–501. [DOI] [PMC free article] [PubMed] [Google Scholar]
- Calderon B, Carrero JA, Ferris ST, Sojka DK, Moore L, Epelman S, Murphy KM, Yokoyama WM, Randolph GJ, and Unanue ER (2015). The pancreas anatomy conditions the origin and properties of resident macrophages. J. Exp. Med. 212, 1497–1512. [DOI] [PMC free article] [PubMed] [Google Scholar]
- Chen H, Gu X, Liu Y, Wang J, Wirt SE, Bottino R, Schorle H, Sage J, and Kim SK (2011). PDGF signalling controls age-dependent proliferation in pancreatic β-cells. Nature 478, 349–355. [DOI] [PMC free article] [PubMed] [Google Scholar]
- Chera S, Baronnier D, Ghila L, Cigliola V, Jensen JN, Gu G, Furuyama K, Thorel F, Gribble FM, Reimann F, and Herrera PL (2014). Diabetes recovery by age-dependent conversion of pancreatic δ-cells into insulin producers. Nature 514, 503–507. [DOI] [PMC free article] [PubMed] [Google Scholar]
- Chintalgattu V, Rees ML, Culver JC, Goel A, Jiffar T, Zhang J, Dunner K Jr., Pati S, Bankson JA, Pasqualini R, et al. (2013). Coronary microvascular pericytes are the cellular target of sunitinib malate-induced cardiotoxicity. Sci. Transl. Med. 5, 187ra69. [DOI] [PMC free article] [PubMed] [Google Scholar]
- Criscimanna A, Coudriet GM, Gittes GK, Piganelli JD, and Esni F (2014). Activated macrophages create lineage-specific microenvironments for pancreatic acinar-and beta-cell regeneration in mice. Gastroenterology 147, 1106–1118. [DOI] [PubMed] [Google Scholar]
- Cucak H, Grunnet LG, and Rosendahl A (2014). Accumulation of M1-like macrophages in type 2 diabetic islets is followed by a systemic shift in macrophage polarization. J. Leukoc. Biol. 95, 149–160. [DOI] [PubMed] [Google Scholar]
- Dalmas E, Lehmann FM, Dror E, Wueest S, Thienel C, Borsigova M, Stawiski M, Traunecker E, Lucchini FC, Dapito DH, et al. (2017). Interleukin-33-activated islet-resident innate lymphoid cells promote insulin secretionthrough myeloid cell retinoicacid production. Immunity 47,928–942. [DOI] [PubMed] [Google Scholar]
- Demirci C, Ernst S, Alvarez-Perez JC, Rosa T, Valle S, Shridhar V, Casinelli GP, Alonso LC, Vasavada RC, and Garcia-Ocana A (2012). Loss of HGF/c-Met signaling in pancreatic β-cells leads to incomplete maternal β-cell adaptation and gestational diabetes mellitus. Diabetes 61, 1143–1152. [DOI] [PMC free article] [PubMed] [Google Scholar]
- Diana J, Simoni Y, Furio L, Beaudoin L, Agerberth B, Barrat F, and Lehuen A (2013). Crosstalk between neutrophils, B-1a cells and plasmacy- toid dendritic cells initiates autoimmune diabetes. Nat. Med. 19, 65–73. [DOI] [PubMed] [Google Scholar]
- Dobin A, Davis CA, Schlesinger F, Drenkow J, Zaleski C, Jha S, Batut P, Chaisson M, and Gingeras TR (2013). STAR: ultrafast universal RNA-seq aligner. Bioinformatics 29, 15–21. [DOI] [PMC free article] [PubMed] [Google Scholar]
- Donath MY (2013). Targeting inflammation in the treatment of type 2 diabetes. Diabetes Obes. Metab. 15 (Suppl 3), 193–196. [DOI] [PubMed] [Google Scholar]
- Donath MY, and Shoelson SE (2011). Type 2 diabetes as an inflammatory disease. Nat. Rev. Immunol. 11, 98–107. [DOI] [PubMed] [Google Scholar]
- Donath MY, Schumann DM, Faulenbach M, Ellingsgaard H, Perren A, and Ehses JA (2008a). Islet inflammation in type 2 diabetes: from metabolic stress to therapy. Diabetes Care 31 (Suppl 2), S161–S164. [DOI] [PubMed] [Google Scholar]
- Donath MY, Størling J, Berchtold LA, Billestrup N, and Mandrup-Poulsen T (2008b). Cytokines and beta-cell biology: from concept to clinical translation. Endocr. Rev. 29, 334–350. [DOI] [PubMed] [Google Scholar]
- Donath MY, Dalmas É, Sauter NS, and Böni-Schnetzler M (2013). Inflammation in obesity and diabetes: islet dysfunction and therapeutic opportunity. Cell Metab. 17, 860–872. [DOI] [PubMed] [Google Scholar]
- Ebato C, Uchida T, Arakawa M, Komatsu M, Ueno T, Komiya K, Azuma K, Hirose T, Tanaka K, Kominami E, et al. (2008). Autophagy is important in islet homeostasis and compensatory increase of beta cell mass in response to high-fat diet. Cell Metab. 8, 325–332. [DOI] [PubMed] [Google Scholar]
- Eguchi K, and Nagai R (2017). Islet inflammation in type 2 diabetes and physiology. J. Clin. Invest. 127, 14–23. [DOI] [PMC free article] [PubMed] [Google Scholar]
- Eguchi K, Manabe I, Oishi-Tanaka Y, Ohsugi M, Kono N, Ogata F, Yagi N, Ohto U, Kimoto M, Miyake K, et al. (2012). Saturated fatty acid and TLR signaling link β cell dysfunction and islet inflammation. Cell Metab. 15, 518–533. [DOI] [PubMed] [Google Scholar]
- Ehses JA, Perren A, Eppler E, Ribaux P, Pospisilik JA, Maor-Cahn R, Gueripel X, Ellingsgaard H, Schneider MK, Biollaz G, et al. (2007). Increased number of islet-associated macrophages in type 2 diabetes. Diabetes 56, 2356–2370. [DOI] [PubMed] [Google Scholar]
- El Ouaamari A, Dirice E, Gedeon N, Hu J, Zhou JY, Shirakawa J, Hou L, Goodman J, Karampelias C, Qiang G, et al. (2016). SerpinB1 promotes pancreatic β cell proliferation. Cell Metab. 23, 194–205. [DOI] [PMC free article] [PubMed] [Google Scholar]
- Fu W, Wojtkiewicz G, Weissleder R, Benoist C, and Mathis D (2012). Early window of diabetes determinism in NOD mice, dependent on the complement receptor CRIg, identified by noninvasive imaging. Nat. Immunol. 13, 361–368. [DOI] [PMC free article] [PubMed] [Google Scholar]
- Fu W, Farache J, Clardy SM, Hattori K, Mander P, Lee K, Rioja I, Weissleder R, Prinjha RK, Benoist C, and Mathis D (2014). Epigenetic modulation of type-1 diabetes via a dual effect on pancreatic macrophages and β cells. eLife 3, e04631. [DOI] [PMC free article] [PubMed] [Google Scholar]
- Gagnerault MC, Luan JJ, Lotton C, and Lepault F (2002). Pancreatic lymph nodes are required for priming of beta cell reactive T cells in NOD mice. J. Exp. Med. 196, 369–377. [DOI] [PMC free article] [PubMed] [Google Scholar]
- Garcia-Ocaña A, Takane KK, Syed MA, Philbrick WM, Vasavada RC, and Stewart AF (2000). Hepatocyte growth factor overexpression in the islet of transgenic mice increases beta cell proliferation, enhances islet mass, and induces mild hypoglycemia. J. Biol. Chem. 275, 1226–1232. [DOI] [PubMed] [Google Scholar]
- Gautier EL, Shay T, Miller J, Greter M, Jakubzick C, Ivanov S, Helft J, Chow A, Elpek KG, Gordonov S, et al. ; Immunological Genome Consortium (2012). Gene-expression profiles and transcriptional regulatory pathways that underlie the identity and diversity of mouse tissue macrophages. Nat. Immunol. 13, 1118–1128. [DOI] [PMC free article] [PubMed] [Google Scholar]
- Geutskens SB, Otonkoski T, Pulkkinen MA, Drexhage HA, and Leenen PJ (2005). Macrophages in the murine pancreas and their involvement in fetal endocrine development in vitro. J. Leukoc. Biol. 78, 845–852. [DOI] [PubMed] [Google Scholar]
- Goel A, Chiu H, Felton J, Palmer JP, and Brooks-Worrell B (2007). T-cell responses to islet antigens improves detection of autoimmune diabetes and identifies patients with more severe beta-cell lesions in phenotypic type 2 diabetes. Diabetes 56, 2110–2115. [DOI] [PubMed] [Google Scholar]
- Gordon S, and Plüddemann A (2017). Tissue macrophages: heterogeneity and functions. BMC Biol. 15, 53. [DOI] [PMC free article] [PubMed] [Google Scholar]
- Gosselin D, Link VM, Romanoski CE, Fonseca GJ, Eichenfield DZ, Spann NJ, Stender JD, Chun HB, Garner H, Geissmann F, and Glass CK (2014). Environment drives selection and function of enhancers controlling tissue-specific macrophage identities. Cell 759, 1327–1340. [DOI] [PMC free article] [PubMed] [Google Scholar]
- Gregor MF, and Hotamisligil GS (2011). Inflammatory mechanisms in obesity. Annu. Rev. Immunol. 29, 415–445. [DOI] [PubMed] [Google Scholar]
- Haase J, Weyer U, Immig K, Klöting N, Blüher M, Eilers J, Bechmann I, and Gericke M (2014). Local proliferation of macrophages in adipose tissue during obesity-induced inflammation. Diabetologia 57, 562–571. [DOI] [PubMed] [Google Scholar]
- Haataja L, Gurlo T, Huang CJ, and Butler PC (2008). Islet amyloid in type 2 diabetes, and the toxic oligomer hypothesis. Endocr. Rev. 29,303–316. [DOI] [PMC free article] [PubMed] [Google Scholar]
- Hasnain SZ, Borg DJ, Harcourt BE, Tong H, Sheng YH, Ng CP, Das I, Wang R, Chen AC, Loudovaris T, et al. (2014). Glycemic control in diabetes is restored by therapeutic manipulation of cytokines that regulate beta cell stress. Nat. Med. 20, 1417–1426. [DOI] [PubMed] [Google Scholar]
- Heinz S, Benner C, Spann N, Bertolino E, Lin YC, Laslo P, Cheng JX, Murre C, Singh H, and Glass CK (2010). Simple combinations of lineage-determining transcription factors prime cis-regulatory elements required for macrophage and B cell identities. Mol. Cell 38, 576–589. [DOI] [PMC free article] [PubMed] [Google Scholar]
- Heng TS, and Painter MW; Immunological Genome Project Consortium (2008). The Immunological Genome Project: networks of gene expression in immune cells. Nat. Immunol. 9, 1091–1094. [DOI] [PubMed] [Google Scholar]
- Höglund P, Mintern J, Waltzinger C, Heath W, Benoist C, and Mathis D (1999). Initiation of autoimmune diabetes by developmentally regulated presentation of islet cell antigens in the pancreatic lymph nodes. J. Exp. Med. 789, 331–339. [DOI] [PMC free article] [PubMed] [Google Scholar]
- Hotamisligil GS (2010). Endoplasmic reticulum stress and the inflammatory basis of metabolic disease. Cell 740, 900–917. [DOI] [PMC free article] [PubMed] [Google Scholar]
- Hotamisligil GS (2017). Inflammation, metaflammation and immunometabolic disorders. Nature 542, 177–185. [DOI] [PubMed] [Google Scholar]
- Hull RL, Kodama K, Utzschneider KM, Carr DB, Prigeon RL, and Kahn SE (2005). Dietary-fat-induced obesity in mice results in beta cell hyperplasia but not increased insulin release: evidence for specificity of impaired beta cell adaptation. Diabetologia 48, 1350–1358. [DOI] [PubMed] [Google Scholar]
- Jablonski KA, Amici SA, Webb LM, Ruiz-Rosado Jde.D, Popovich PG, Partida-Sanchez S., and Guerau-de-Arellano M (2015). Novel markers to delineate murine M1 and M2 macrophages. PLoS One 70, e0145342. [DOI] [PMC free article] [PubMed] [Google Scholar]
- Jaguin M, Fardel O, and Lecureur V (2015). AhR-dependent secretion of PDGF-BB by human classically activated macrophages exposed to DEP extracts stimulates lung fibroblast proliferation. Toxicol. Appl. Pharmacol. 285, 170–178. [DOI] [PubMed] [Google Scholar]
- Jakubzick C, Gautier EL, Gibbings SL, Sojka DK, Schlitzer A, Johnson TE, Ivanov S, Duan Q, Bala S, Condon T, et al. (2013). Minimal differentiation of classical monocytes as they survey steady-state tissues and transport antigen to lymph nodes. Immunity 39, 599–610. [DOI] [PMC free article] [PubMed] [Google Scholar]
- Jenkins SJ, Ruckerl D, Cook PC, Jones LH, Finkelman FD, van Rooijen N, MacDonald AS, and Allen JE (2011). Local macrophage proliferation, ratherthan recruitment from the blood, is a signature of TH2 inflammation. Science 332, 1284–1288. [DOI] [PMC free article] [PubMed] [Google Scholar]
- Jenkins SJ, Ruckerl D, Thomas GD, Hewitson JP, Duncan S, Brombacher F, Maizels RM, Hume DA, and Allen JE (2013). IL-4 directly signals tissueresident macrophages to proliferate beyond homeostatic levels controlled by CSF-1. J. Exp. Med. 270, 2477–2491. [DOI] [PMC free article] [PubMed] [Google Scholar]
- Kamata K, Mizukami H, Inaba W, Tsuboi K, Tateishi Y, Yoshida T, and Yagihashi S (2014). Islet amyloid with macrophage migration correlates with augmented β-cell deficits in type 2 diabetic patients. Amyloid 21, 191–201. [DOI] [PMC free article] [PubMed] [Google Scholar]
- Kratz M, Coats BR, Hisert KB, Hagman D, Mutskov V, Peris E, Schoenfelt KQ, Kuzma JN, Larson I, Billing PS, et al. (2014). Metabolic dysfunction drives a mechanistically distinct proinflammatory phenotype in adipose tissue macrophages. Cell Metab. 20, 614–625. [DOI] [PMC free article] [PubMed] [Google Scholar]
- Lackey DE, and Olefsky JM (2016). Regulation ofmetabolism bythe innate immune system. Nat. Rev. Endocrinol. 12, 15–28. [DOI] [PubMed] [Google Scholar]
- Lavin Y, Winter D, Blecher-Gonen R, David E, Keren-Shaul H, Merad M, Jung S, and Amit I (2014). Tissue-resident macrophage enhancer landscapes are shaped by the local microenvironment. Cell 159, 1312–1326. [DOI] [PMC free article] [PubMed] [Google Scholar]
- Lee YS, Morinaga H, Kim JJ, Lagakos W, Taylor S, Keshwani M, Perkins G, Dong H, Kayali AG, Sweet IR, and Olefsky J (2013). The fractalkine/CX3CR1 system regulates β cell function and insulin secretion. Cell 153,413–425. [DOI] [PMC free article] [PubMed] [Google Scholar]
- Lee YS, Wollam J, and Olefsky JM (2018). An integrated view of immuno-metabolism. Cell 172, 22–40. [DOI] [PMC free article] [PubMed] [Google Scholar]
- Levitt HE, Cyphert TJ, Pascoe JL, Hollern DA, Abraham N, Lundell RJ, Rosa T, Romano LC, Zou B, O’Donnell CP, et al. (2011). Glucose stimulates human beta cell replication in vivo in islets transplanted into NOD-severe combined immunodeficiency (SCID) mice. Diabetologia 54, 572–582. [DOI] [PMC free article] [PubMed] [Google Scholar]
- Li P, Lu M, Nguyen MT, Bae EJ, Chapman J, Feng D, Hawkins M, Pessin JE, Sears DD, Nguyen AK, et al. (2010). Functional heterogeneity of CD11c-positive adipose tissue macrophages in diet-induced obese mice. J. Biol. Chem. 285, 15333–15345. [DOI] [PMC free article] [PubMed] [Google Scholar]
- Li P, Oh DY, Bandyopadhyay G, Lagakos WS, Talukdar S, Osborn O, Johnson A, Chung H, Maris M, Ofrecio JM, et al. (2015). LTB4 promotes insulin resistance in obese mice by acting on macrophages, hepatocytes and myocytes. Nat. Med. 21, 239–247. [DOI] [PMC free article] [PubMed] [Google Scholar]
- Lumeng CN, DelProposto JB, Westcott DJ, and Saltiel AR (2008). Phenotypic switching of adipose tissue macrophages with obesity is generated by spatiotemporal differences in macrophage subtypes. Diabetes 57, 3239–3246. [DOI] [PMC free article] [PubMed] [Google Scholar]
- Maedler K, Schumann DM, Sauter N, Ellingsgaard H, Bosco D, Baertschiger R, Iwakura Y, Oberholzer J, Wollheim CB, Gauthier BR, and Donath MY (2006). Low concentration of interleukin-1beta induces FLICE-inhibitory protein-mediated beta-cell proliferation in human pancreatic islets. Diabetes 55, 2713–2722. [DOI] [PubMed] [Google Scholar]
- Mass E, Ballesteros I, Farlik M, Halbritter F, Günther P, Crozet L, Jacome-Galarza CE, Händler K, Klughammer J, Kobayashi Y, et al. (2016). Specification of tissue-resident macrophages during organogenesis. Science 353, aaf4238. [DOI] [PMC free article] [PubMed] [Google Scholar]
- Masters SL, Dunne A, Subramanian SL, Hull RL, Tannahill GM, Sharp FA, Becker C, Franchi L, Yoshihara E, Chen Z, et al. (2010). Activation of the NLRP3 inflammasome by islet amyloid polypeptide provides a mechanism for enhanced IL-1 β in type 2 diabetes. Nat. Immunol. 11, 897–904. [DOI] [PMC free article] [PubMed] [Google Scholar]
- Mathis D (2013). Immunological goings-on in visceral adipose tissue. Cell Metab. 17, 851–859. [DOI] [PMC free article] [PubMed] [Google Scholar]
- McLaughlin T, Ackerman SE, Shen L, and Engleman E (2017). Role of innate and adaptive immunity in obesity-associated metabolic disease. J. Clin. Invest. 127, 5–13. [DOI] [PMC free article] [PubMed] [Google Scholar]
- Medzhitov R (2008). Origin and physiological roles of inflammation. Nature 454, 428–435. [DOI] [PubMed] [Google Scholar]
- Meier DT, Morcos M, Samarasekera T, Zraika S, Hull RL, and Kahn SE (2014). Islet amyloid formation is an important determinant for inducing islet inflammation in high-fat-fed human IAPP transgenic mice. Diabetologia 57, 1884–1888. [DOI] [PMC free article] [PubMed] [Google Scholar]
- Meredith MM, Liu K, Kamphorst AO, Idoyaga J, Yamane A, Guermonprez P, Rihn S, Yao KH, Silva IT, Oliveira TY, et al. (2012). Zincfingertranscription factor zDC is a negative regulator required to prevent activation of classical dendritic cells in the steady state. J. Exp. Med. 209, 1583–1593. [DOI] [PMC free article] [PubMed] [Google Scholar]
- Miller JC, Brown BD, Shay T, Gautier EL, Jojic V, Cohain A, Pandey G, Leboeuf M, Elpek KG, Helft J, et al. ; Immunological Genome Consortium (2012). Deciphering the transcriptional network of the dendritic cell lineage. Nat. Immunol. 13, 888–899. [DOI] [PMC free article] [PubMed] [Google Scholar]
- Miyazaki J, Araki K, Yamato E, Ikegami H, Asano T, Shibasaki Y, Oka Y, and Yamamura K (1990). Establishment of a pancreatic beta cell line that retains glucose-inducible insulin secretion: special reference to expression of glucose transporter isoforms. Endocrinology 127, 126–132. [DOI] [PubMed] [Google Scholar]
- Moreno SG (2018). Depleting macrophages in vivo with clodronate-liposomes. Methods Mol. Biol. 1784, 259–262. [DOI] [PubMed] [Google Scholar]
- Mosser RE, Maulis MF, Moullé VS, Dunn JC, Carboneau BA, Arasi K, Pappan K, Poitout V, and Gannon M (2015). High-fat diet-induced β-cell proliferation occurs prior to insulin resistance in C57Bl/6J male mice. Am. J. Physiol. Endocrinol. Metab. 308, E573–E582. [DOI] [PMC free article] [PubMed] [Google Scholar]
- Murray PJ (2017). Macrophage polarization. Annu. Rev. Physiol. 79, 541–566. [DOI] [PubMed] [Google Scholar]
- Murray PJ, and Wynn TA (2011). Protective and pathogenic functions of macrophage subsets. Nat. Rev. Immunol. 11, 723–737. [DOI] [PMC free article] [PubMed] [Google Scholar]
- Nackiewicz D, Dan M, He W, Kim R, Salmi A, Rütti S, Westwell-Roper C, Cunningham A, Speck M, Schuster-Klein C, et al. (2014). TLR2/6 and TLR4-activated macrophages contribute to islet inflammation and impair beta cell insulin gene expression via IL-1 and IL-6. Diabetologia 57, 1645–1654. [DOI] [PubMed] [Google Scholar]
- Naphade S, Sharma J, Gaide Chevronnay HP, Shook MA, Yeagy BA, Rocca CJ, Ur SN, Lau AJ, Courtoy PJ, and Cherqui S (2015). Brief reports: Lysosomal cross-correction by hematopoietic stem cell-derived macrophages via tunneling nanotubes. Stem Cells 33, 301–309. [DOI] [PMC free article] [PubMed] [Google Scholar]
- Nawaz M, and Fatima F (2017). Extracellular vesicles, tunneling nanotubes, and cellular interplay: synergies and missing links. Front. Mol. Biosci. 4, 50. [DOI] [PMC free article] [PubMed] [Google Scholar]
- Okabe M, Ikawa M, Kominami K, Nakanishi T, and Nishimune Y (1997). ‘Green mice’ as a source of ubiquitous green cells. FEBS Lett. 407, 313–319. [DOI] [PubMed] [Google Scholar]
- Onogi Y, Wada T, Kamiya C, Inata K, Matsuzawa T, Inaba Y, Kimura K, Inoue H, Yamamoto S, Ishii Y, et al. (2017). PDGFRβ regulates adipose tissue expansion and glucose metabolism via vascular remodeling in diet- induced obesity. Diabetes 66, 1008–1021. [DOI] [PubMed] [Google Scholar]
- Palmer JP, Hampe CS, Chiu H, Goel A, and Brooks-Worrell BM (2005). Is latent autoimmune diabetes in adults distinct from type 1 diabetes or just type 1 diabetes at an older age? Diabetes 54 (Suppl 2), S62–S67. [DOI] [PubMed] [Google Scholar]
- Patsouris D, Li PP, Thapar D, Chapman J, Olefsky JM, and Neels JG (2008). Ablation of CD11c-positive cells normalizes insulin sensitivity in obese insulin resistant animals. Cell Metab. 8, 301–309. [DOI] [PMC free article] [PubMed] [Google Scholar]
- Peyot ML, Pepin E, Lamontagne J, Latour MG, Zarrouki B, Lussier R, Pineda M, Jetton TL, Madiraju SR, Joly E, and Prentki M (2010). Beta-cell failure in diet-induced obese mice stratified according to body weight gain: secretory dysfunction and altered islet lipid metabolism without steatosis or reduced beta-cell mass. Diabetes 59, 2178–2187. [DOI] [PMC free article] [PubMed] [Google Scholar]
- Picelli S, Björklund AK, Faridani OR, Sagasser S, Winberg G, and Sandberg R (2013). Smart-seq2 for sensitive full-length transcriptome profiling in single cells. Nat. Methods 10, 1096–1098. [DOI] [PubMed] [Google Scholar]
- Pirzgalska RM, Seixas E, Seidman JS, Link VM, Sanchez NM, Mahu I, Mendes R, Gres V, Kubasova N, Morris I, et al. (2017). Sympathetic neuron-associated macrophages contribute to obesity by importing and metabolizing norepinephrine. Nat. Med. 23, 1309–1318. [DOI] [PMC free article] [PubMed] [Google Scholar]
- Porat S, Weinberg-Corem N, Tornovsky-Babaey S, Schyr-Ben-Haroush R, Hija A, Stolovich-Rain M, Dadon D, Granot Z, Ben-Hur V, White P, et al. (2011). Control of pancreatic b cell regeneration by glucose meta-bolism. Cell Metab. 13, 440–449. [DOI] [PMC free article] [PubMed] [Google Scholar]
- Richardson SJ, Willcox A, Bone AJ, Foulis AK, and Morgan NG (2009). Islet-associated macrophages in type 2 diabetes. Diabetologia 52, 1686–1688. [DOI] [PubMed] [Google Scholar]
- Riley KG, Pasek RC, Maulis MF, Dunn JC, Bolus WR, Kendall PL, Hasty AH, and Gannon M (2015). Macrophages are essential for CTGF- mediated adult β-cell proliferation after injury. Mol. Metab. 4, 584–591. [DOI] [PMC free article] [PubMed] [Google Scholar]
- Robertson RP (2009). Beta-cell deterioration during diabetes: what’s in the gun? Trends Endocrinol. Metab. 20, 388–393. [DOI] [PMC free article] [PubMed] [Google Scholar]
- Rocca CJ, Goodman SM, Dulin JN, Haquang JH, Gertsman I, Blondelle J, Smith JLM, Heyser CJ, and Cherqui S (2017). Transplantation of wild-type mouse hematopoietic stem and progenitor cells ameliorates deficits in a mouse model of Friedreich’s ataxia. Sci. Transl. Med. 9, eaaj2347. [DOI] [PMC free article] [PubMed] [Google Scholar]
- Saederup N, Cardona AE, Croft K, Mizutani M, Cotleur AC, Tsou CL, Ransohoff RM, and Charo IF (2010). Selective chemokine receptor usage by central nervous system myeloid cells in CCR2-red fluorescent protein knock-in mice. PLoS ONE 5, e13693. [DOI] [PMC free article] [PubMed] [Google Scholar]
- Satpathy AT, Kc W, Albring JC, Edelson BT, Kretzer NM, Bhattacharya D, Murphy TL, and Murphy KM (2012). Zbtb46 expression distinguishes classical dendritic cells and their committed progenitors from other immune lineages. J. Exp. Med. 209, 1135–1152. [DOI] [PMC free article] [PubMed] [Google Scholar]
- Sell H, Habich C, and Eckel J (2012). Adaptive immunity in obesity and insulin resistance. Nat. Rev. Endocrinol. 8, 709–716. [DOI] [PubMed] [Google Scholar]
- Shalapour S, and Karin M (2015). Immunity, inflammation, and cancer: an eternal fight between good and evil. J. Clin. Invest. 125, 3347–3355. [DOI] [PMC free article] [PubMed] [Google Scholar]
- Shimokado K, Raines EW, Madtes DK, Barrett TB, Benditt EP, and Ross R (1985). A significant part of macrophage-derived growth factor consists of at least two forms of PDGF. Cell 43, 277–286. [DOI] [PubMed] [Google Scholar]
- Stamateris RE, Sharma RB, Hollern DA, and Alonso LC (2013). Adaptive β-cell proliferation increases early in high-fatfeeding in mice, concurrent with metabolic changes, with induction of islet cyclin D2 expression. Am. J. Physiol. Endocrinol. Metab. 305, E149–E159. [DOI] [PMC free article] [PubMed] [Google Scholar]
- Talchai C, Lin HV, Kitamura T, and Accili D (2009). Genetic and biochemical pathways of beta-cell failure in type 2 diabetes. Diabetes Obes. Metab. 11 (Suppl 4), 38–45. [DOI] [PubMed] [Google Scholar]
- Talchai C, Xuan S, Lin HV, Sussel L, and Accili D (2012). Pancreatic β cell dedifferentiation as a mechanism of diabetic β cell failure. Cell 150, 1223–1234. [DOI] [PMC free article] [PubMed] [Google Scholar]
- Tardelli M, Zeyda K, Moreno-Viedma V, Wanko B, Grün NG, Staffler G, Zeyda M, and Stulnig TM (2016). Osteopontin is a key player for local adipose tissue macrophage proliferation in obesity. Mol. Metab. 5, 1131–1137. [DOI] [PMC free article] [PubMed] [Google Scholar]
- Thorel F, Népote V, Avril I, Kohno K, Desgraz R, Chera S, and Herrera PL (2010). Conversion of adult pancreatic alpha-cells to beta-cells after extreme beta-cell loss. Nature 464, 1149–1154. [DOI] [PMC free article] [PubMed] [Google Scholar]
- Thornley TB, Agarwal KA, Kyriazis P, Ma L, Chipashvili V, Aker JE, Korniotis S, Csizmadia E, Strom TB, and Koulmanda M (2016). Contrasting roles of islet resident immunoregulatory macrophages and dendritic cells in experimental autoimmune Type 1 Diabetes. PLoS One 11, e0150792. [DOI] [PMC free article] [PubMed] [Google Scholar]
- Tripathi S, Pohl MO, Zhou Y, Rodriguez-Frandsen A, Wang G, Stein DA, Moulton HM, DeJesus P, Che J, Mulder LC, et al. (2015). Meta-and orthogonal integration of influenza “OMICs” data defines a role for UBR4 in virus budding. Cell Host Microbe 18, 723–735. [DOI] [PMC free article] [PubMed] [Google Scholar]
- Vomund AN, Zinselmeyer BH, Hughes J, Calderon B, Valderrama C, Ferris ST, Wan X, Kanekura K, Carrero JA, Urano F, and Unanue ER (2015). Beta cells transfer vesicles containing insulin to phagocytes for presentation to T cells. Proc. Natl. Acad. Sci. USA 112, E5496–E5502. [DOI] [PMC free article] [PubMed] [Google Scholar]
- Weisberg SP, Hunter D, Huber R, Lemieux J, Slaymaker S, Vaddi K, Charo I, Leibel RL, and Ferrante AW Jr. (2006). CCR2 modulates inflammatory and metabolic effects of high-fatfeeding. J. Clin. Invest. 116,115–124. [DOI] [PMC free article] [PubMed] [Google Scholar]
- Westwell-Roper CY, Ehses JA, and Verchere CB (2014). Resident macrophages mediate islet amyloid polypeptide-induced islet IL-1 β production and β-cell dysfunction. Diabetes 63, 1698–1711. [DOI] [PubMed] [Google Scholar]
- Xiao X, Gaffar I, Guo P, Wiersch J, Fischbach S, Peirish L, Song Z, El-Gohary Y, Prasadan K, Shiota C, and Gittes GK (2014). M2 macrophages promote beta-cell proliferation by up-regulation of SMAD7. Proc. Natl. Acad. Sci. USA 111, E1211–E1220. [DOI] [PMC free article] [PubMed] [Google Scholar]
- Yona S, Kim KW, Wolf Y, Mildner A, Varol D, Breker M, Strauss-Ayali D, Viukov S, Guilliams M, Misharin A, et al. (2013). Fate mapping reveals origins and dynamics of monocytes and tissue macrophages under homeostasis. Immunity 38, 79–91. [DOI] [PMC free article] [PubMed] [Google Scholar]
- Zhou X, Franklin RA, Adler M, Jacox JB, Bailis W, Shyer JA, Flavell RA, Mayo A, Alon U, and Medzhitov R (2018). Circuit design features of a stable two-cell system. Cell 172, 744–757. [DOI] [PMC free article] [PubMed] [Google Scholar]
- Zinselmeyer BH, Vomund AN, Saunders BT, Johnson MW, Carrero JA, and Unanue ER (2018). The resident macrophages in murine pancreatic islets are constantly probing their local environment, capturing beta cell granules and blood particles. Diabetologia 61, 1374–1383. [DOI] [PMC free article] [PubMed] [Google Scholar]
Associated Data
This section collects any data citations, data availability statements, or supplementary materials included in this article.
Supplementary Materials
Data Availability Statement
RNA-seq Data
Transcriptome sequencing data of islet macrophages have been deposited in the Gene Expression Omnibus (GEO), with the accession number GSE112002. RNA-seq datasets of subcutaneous fat macrophages were from GSE103847 (Pirzgalska et al., 2017); RNA-seq datasets of CD4+ DC, CD8+ DC, plasmacytoid dendritic cells (pDC), peritoneal and alveolar macrophages were from GSE109125 (Heng and Painter, 2008); RNA-seq datasets of microglia, kidney, liver and skin were from GSE81774 (Mass et al., 2016).