

Abstract
Introduction:
Direct-acting antivirals (DAAs) have transformed hepatitis C virus (HCV) management post-liver transplant. As HCV clears during DAA treatment, hepatic metabolism improves, resulting in decreased tacrolimus concentrations that may require dose adjustment. The purpose of this study was to determine appropriate management of immunosuppression in liver transplant recipients during and following treatment of HCV.
Methods:
This study was a single-center retrospective analysis of 71 liver transplant recipients who were treated for HCV with DAAs. The primary outcome was change in dose-normalized tacrolimus concentrations from the start of DAA treatment to 12 weeks following therapy.
Results:
The mean change in log-transformed dose-normalized tacrolimus concentrations was a reduction of 0.43 ng/mL/mg (95% CI; 0.26-0.60, P < 0.0001). The greatest decrease occurred in the first 4 weeks of treatment, after which levels stabilized. The overall mean tacrolimus concentration was 4.8 ng/mL (±2.5). Two patients (3%) developed acute cellular rejection and two patients (3%) had graft loss and died.
Conclusion:
From the start of treatment to 12 weeks post-DAA therapy, liver transplant recipients experienced a significant decrease in dose-normalized tacrolimus concentrations. In conclusion, close monitoring of tacrolimus concentrations is warranted during and following treatment with DAAs, as dose increases may be indicated in order to maintain therapeutic concentrations to prevent graft rejection.
Keywords: direct-acting antiviral, hepatitis C virus, liver transplantation, tacrolimus
1 ∣. INTRODUCTION
Hepatitis C virus (HCV) cirrhosis is the most common indication for liver transplantation (LT).1,2 If HCV is not treated before LT, then recurrent infection of the graft is inevitable and associated with accelerated liver damage.2 In patients with untreated HCV, graft dysfunction and progression to cirrhosis occur in 20%-30% of patients after LT.2 Graft failure from HCV recurrence occurs in 10% of HCV-infected individuals within 5-10 years of transplant.1
Interferon (IFN)-free direct-acting antiviral (DAA) therapy has transformed the management of HCV with significant improvement in sustained virologic response (SVR) ranging from 20% to 40% in the peg-IFN-based regimen era to 59%-95% in the DAA era. Furthermore, DAAs are better tolerated and do not carry the risk of rejection which was commonly seen with peg-IFN-based regimens.2-7 DAAs also carry a lower risk of treatment-associated immunologic graft dysfunction compared to IFN-based regimens.7-9 Owing to the lack of significant drug interactions with calcineurin inhibitors (tacrolimus [TAC] and cyclosporine), the following regimens are commonly used for recurrent HCV post-LT: sofosbuvir (SOF)/velpatasvir (VEL) and RBV, SOF/daclatasvir (DCV) with or without RBV, SOF/ledipasvir (LDV) and ribavirin (RBV), SOF/simeprevir (SIM) with or without RBV, or glecaprevir (GLE)/pibrentasvir (PIB).10
Cytochrome P450 (CYP) expression is affected by liver disease. Frye et al11 showed that liver disease severity had variable effects on the activity of specific CYP isoenzymes. Additionally, reduced CYP3A4 activity has been observed in patients with HCV when compared to healthy volunteers.12 In liver disease and hepatic inflammation, CYP expression decreases which may reduce the metabolism of many medications. During HCV treatment, viral load declines and hepatic inflammation improves, leading to normalization of CYP expression.12,13
Tacrolimus (TAC), the backbone of immunosuppression in LT, is a substrate of CYP3A4/5. In the transplant population, normalization of CYP expression that occurs following HCV treatment may lead to an increase in TAC metabolism and sequential subtherapeutic concentrations, and increase the risk of graft rejection.12,13 The majority of large randomized controlled trials evaluating HCV DAA therapy post-LT do not specifically report on immunosuppression management during and following HCV DAA therapy.14-18 However, there are a small number of retrospective reports that observed a decline in TAC whole blood concentrations in LT recipients during treatment with DAAs.19-22
The hypothesis for this decline in whole blood trough concentrations is that there is repression of drug-metabolizing enzymes from inflammatory and infectious stimuli while patients are actively infected with HCV.19 As the HCV virus is cleared and there is an increase in liver cell function, CYP3A4/5 activity normalizes and larger TAC doses are necessary to achieve adequate troughs. Frequent monitoring of TAC trough concentrations may be warranted to prevent subtherapeutic TAC concentrations and subsequent allograft rejection. The purpose of this study was to evaluate the change in TAC concentrations and dosing requirements in LT recipients during and shortly following treatment with DAAs.
2 ∣. PATIENTS AND METHODS
This study was conducted as a single-center retrospective review that included adult LT recipients from University of Michigan Transplant Center. This study was approved by the University of Michigan Medical School Investigational Review Board. We included patients treated with DAAs for HCV between July 2014 and March 2017. Patients were excluded if they were less than 18 years of age, did not complete DAA therapy, were prescribed ritonavir, IFN, or cyclosporine during the study period, or had a diagnosis of human immunodeficiency virus (HIV).
The primary outcome of this study was the change in dose-normalized TAC concentration from DAA initiation to 12 weeks post treatment. Secondary outcomes included incidence of TAC dose adjustments from baseline to 12 weeks post treatment, incidence of biopsy-proven acute cellular rejection (ACR) 1 year from the start of therapy, incidence of graft loss, and all-cause mortality 1 year from the start of DAA therapy, incidence of SVR, and incidence of TAC concentrations less than 6 ng/mL.
Aspartate aminotransferase (AST) and alanine aminotransferase (ALT), TAC concentration, and TAC dose were collected at baseline, during treatment weeks 1, 2, 4, 6, 8, 12, 16, 24, and postweeks 4, 8, 12. For baseline, labs were used if they were drawn within 24 hours of DAA therapy initiation or the closest lab prior to initiation of DAA was used. For the result to be included for the pre-specified time point, labs were required to be drawn within 3 days during bimonthly laboratory monitoring and within 7 days for monthly laboratory monitoring. Values for post-week 12 were required to be within 7 days of the actual day or the next lab value after post-week 12 was utilized. The quantitative HCV RNA was collected at baseline and at weeks 4, 12, 24, and post-week 12. Information about the date of transplant, history of HCV treatment, HCV genotype, fibrosing cholestatic hepatitis, multi-organ transplant, retransplant, and donor HCV status were also collected. Clinically significant drug-drug interactions were collected at baseline and during the study period, including: amiodarone, carbamazepine, clarithromycin, diltiazem, dronaderone, erythromycin, fluconazole, isavuconazole, ketoconazole, phenobarbital, phenytoin, posaconazole, rifampin, rifabutin, verapamil, and voriconazole.
2.1 ∣. Statistical analysis
Categorical variables were reported as the number (percentage) and continuous variables as the mean and standard deviation (SD) or median and interquartile range. Baseline dose-normalized TAC concentration was defined as the closest trough measured prior to DAA initiation divided by the total daily TAC dose that the patient was taking prior to that concentration being drawn. All TAC concentrations were corrected for daily TAC dose using the dose prescribed the day prior to the measurement. Because the observed changes in dose-normalized TAC concentrations were calculated in ratios, we transformed the dose-normalized TAC concentrations to the logarithmic scale by calculating the natural log of the data. Tacrolimus concentration divided by dose (C/D) is a method used in solid organ transplant literature to determine the rate of tacrolimus metabolism.21,23-26 As the primary outcome was a continuous variable comparing two non-paired groups, a t test was performed. All other statistical analyses were performed using descriptive statistics.
3 ∣. RESULTS
3.1 ∣. Patient characteristics
Ninety-four LT recipients with HCV who were treated with DAA between July 2014 and March 2017 were screened and 71 met the inclusion criteria. Twenty-three patients were excluded; 17 for cyclosporine use, one for IFN use, and five who did not complete DAA therapy. Characteristics of the baseline demographics are summarized in Table 1. The majority of patients included in this analysis were Caucasian males with a mean age of 61 ± 5 years. The mean time from transplant to DAA treatment was 6 ± 5 years and 80% of patients were treated with SOF/LDV, with or without RBV. The mean total daily TAC dose at baseline was 3.2 ± 2.5 mg/d and the mean TAC concentration was 6 ± 2.4 ng/mL, corresponding to a mean dose-normalized TAC concentration of 3.3 ± 5.1 ng/ mL/ng.
TABLE 1.
Baseline demographics
| Age, ya | 61 ± 5 |
| Sex | 73% Male |
| Race | 79% Caucasian |
| Time from transplant, yearsa | 6 ± 5 |
| Regimen | 80% SOF/LDV ± RBV 10% SOF + RBV 6% SOF + SIM ± RBV 4%SOF + DCV ± RBV |
| Duration of DAA treatment | 56% 12 wk 1.4% 16 wk 42% 24 wk |
| HCV RNA, International units/mLa | 6 134 582 ± 11 344 538 |
| HCV Genotype | 87% Genotype 1 4% Genotype 2 8% Genotype 3 |
| AST, International units/La | 75 ± 78 |
| ALT, International units/La | 76 ± 85 |
| Albumin, g/dLa | 4.36 ± 4.7 |
| Total bilirubin, mg/dLa | 1.1 ± 1.2 |
| CrCl, mL/mina | 82 ± 29 |
| Fibrosing cholestatic hepatitis | 4 (5%) |
| ISHAKb | 2.5 (1, 3.8) |
| History of treatment | 34 (48%) |
| Retransplant | 6 (8%) |
| TAC daily dose, mga | 3.5 ± 2.5 |
| TAC concentration, ng/mLa | 6 ± 2.4 |
| Dose-normalized concentration, ng/mL/mga | 3.3 ± 5.1 |
ALT, alanine aminotransferase; AST, aspartate aminotransferase; CrCl, creatinine clearance (Crockcroft-Gault); DAAs, direct-acting antivirals; DCV, daclatasvir; HCV, hepatitis C virus; LDV, ledipasvir; RBV, ribavirin; RNA, ribonucleic acid; SIM, simeprevir; SOF, sofosbuvir; TAC, tacrolimus.
Represented as mean ± Standard deviation.
Reported in 34 patients as median (interquartile range).
3.2 ∣. Effect of direct-acting antiviral treatment on tacrolimus concentrations
Figure 1 illustrates the mean dose-normalized TAC concentrations for each of the data collection points during the study period. From start of DAA therapy to 12 weeks post treatment, the mean decline in log-transformed dose-normalized TAC concentration was 0.43 ng/ mL/mg (95% confidence interval [CI]; 0.26-0.60, P < 0.0001). The greatest decrease in dose-normalized TAC concentration occurred in the first 4 weeks of treatment, after which levels stabilized. Table 2 shows the primary and secondary outcomes. The overall mean TAC concentration was 4.8 ± 2.5 ng/mL with a mean of one dose change per patient. A total of 649 TAC concentrations were collected throughout this study and 469 (72.3%) TAC concentrations were considered subtherapeutic (less than 6 ng/mL) per institutional protocol. The highest incidence of subtherapeutic TAC concentrations occurred at week 4 and post-week 12 at 82.3% and 83.6%, respectively. Only three patients had drug-drug interactions present: one patient who was started on diltiazem after DAA therapy was complete, one patient on prophylactic fluconazole 100 mg daily, and one patient who received fluconazole 200 mg daily for the treatment of thrush. Despite the presence of CYP3A4 inhibiting medications, all three patients had a decline in dose-normalized TAC concentrations from baseline to post-week 12.
FIGURE 1.
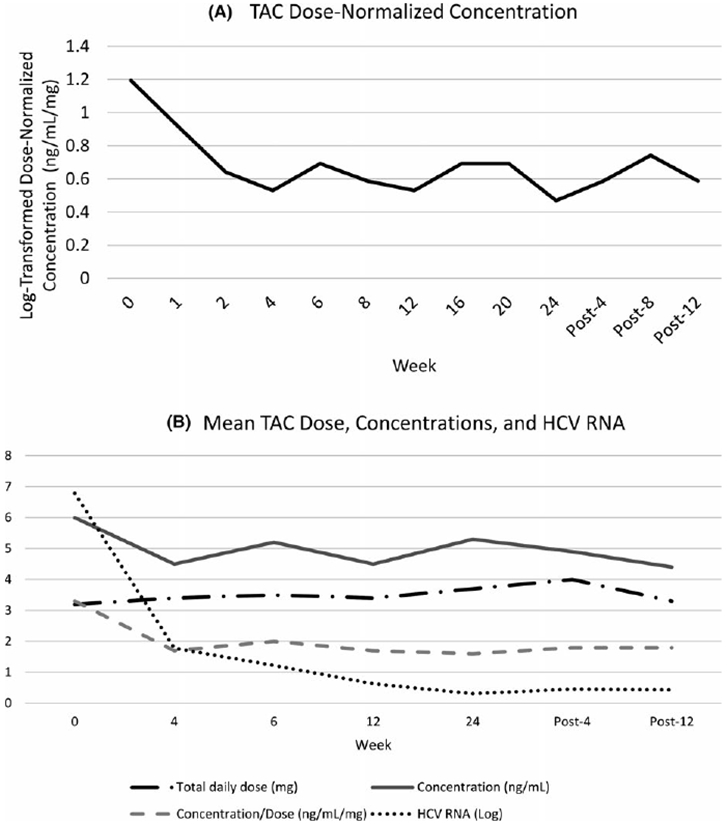
A, Tacrolimus Dose-Normalized Concentration by week of therapy. B, Mean Tacrolimus Dose, Concentrations, and HCV RNA by week of therapy
TABLE 2.
Outcomes
| Incidence of TAC dose changes per patient | 1 |
| TAC concentration (initiation to post-week 12)a | 4.8 ± 2.5 |
| SVR12 | 70 (99%) |
| ACR | 2 (3%) |
| Graft loss | 2 (3%) |
| Mortality | 2 (3%) |
| Subtherapeutic TAC concentrations | 469 (72.3%) |
ACR, acute cellular rejection; SVR, sustained virologic response; TAC, tacrolimus.
Represented as mean ± Standard deviation.
3.3 ∣. SVR, rejection, graft loss, and mortality
After 4 weeks, 42 of 71 patients (59%) had an undetectable HCV RNA (<15 international units/mL). At post-week 12 (SVR12) 70 of 71 patients (99%) had an undetectable HCV RNA. Virologic response is consistent with prior studies examining SVR rates for DAA in LT recipients with an SVR12 of 91%-97%.3
In this study, there were two cases of ACR (3%) and one case of ductopenic rejection (1.4%). Patients who experienced ACR started DAAs 1.2 and 1.3 years following transplant. Acute cellular rejection occurred 220 and 192 days after DAA initiation. The two patients with ACR had average TAC concentrations of 2.8 ng/mL and 5.68 ng/ mL, respectively, prior to rejection with one dose adjustment each. From the initiation of DAAs to ACR, change of TAC dose-normalized concentration was −2.5 and + 0.65 ng/mL/mg, respectively. In addition to TAC for immunosuppression, one patient who experienced ACR was on prednisone, and mycophenolate mofetil and the other was on prednisone. The patient who experienced ductopenic rejection was 264 days from transplant when DAAs were initiated. The change in TAC dose-normalized concentration was −0.07 ng/mL/ mg. This patient developed liver failure, was relisted on the transplant list, and passed away within 1 year of DAA initiation.
Two patients died within 1 year of initiation of DAA. The first patient with ductopenic rejection, mentioned above, died from bacterial peritonitis. The second patient died because of complications following a trauma unrelated to the LT.
4 ∣. DISCUSSION
Treatment with DAAs is the standard of care for recurrent post-LT HCV. However, there is limited guidance on TAC management during treatment with DAAs. Our study showed an excellent SVR rate and patient and graft survival. We found that HCV treatment with DAAs lead to a significant decrease in log-transformed dose-normalized TAC concentrations. The mean TAC concentration decreased from baseline to 12 weeks post-DAA, while the dose remained the same (Figure 1). This indicates that LT recipients have a higher TAC dosage requirement during and after DAA treatment compared to before treatment.
The results of our study were similar to previous studies that observed a decrease in TAC concentrations during HCV treatment.19,20 A retrospective cohort study in 52 LT patients treated with DAAs found significant decreases in serum TAC concentrations after achieving SVR.20 In a study examining the impact of DAAs on the enzymatic liver function of 21 LT recipients, TAC concentration-to-dose ratio significantly decreased stepwise from the start of treatment until week 12 of therapy, indicating increased TAC metabolism during and after treatment.21 Similarly, in a retrospective review of 34 simultaneous liver/kidney transplant recipients with HCV, immunosuppression dosage increases were required in seven patients during DAA treatment and five patients following treatment.22 A recent retrospective study examining DAA use in all types of organ transplants (n = 108), found no difference in TAC doses (3.1 vs 3.2 mg/d, P = 0.06) or concentrations (6.0 vs 6.9 ng/mL, P = 0.46) from baseline to week 4 of DAA treatment, but 45% of patients had a change in their immunosuppression regimen during this time.27 Although we found a substantial decline in TAC concentrations from baseline to week 4, changes occurred 12 weeks post-DAA and it is possible that Mansour et al27 did not follow patients long enough to detect a difference in TAC concentrations. Our study validated the results of previous studies in a larger cohort of LT recipients who had more frequent and consistent laboratory monitoring to assess the incidence of decreased TAC concentrations. The plausible explanation for our findings is that as HCV clears, hepatic metabolism improves, leading to lower TAC concentrations. However, this did not translate into high rejection rates after the completion of DAA therapy.
This study examined the incidence of subtherapeutic TAC concentrations and frequency of dosage adjustments. The institutional protocol recommended a TAC trough goal of 6 to 10 ng/mL for LT recipients during and immediately following treatment with DAAs owing to the hypothesis that TAC concentrations decline during DAA treatment. Our results showed a high incidence of subtherapeutic TAC concentrations based on institutional goals without subsequent dosage increases. This brings into question whether higher goals are indicated during DAA treatment. Given the low incidence of rejection and variability in TAC concentrations and change in TAC dose-normalized concentration in the three cases of rejection, it is difficult to conclude that higher TAC trough targets are warranted during DAA treatment. Increasing TAC trough goals may come with unwanted increased adverse effects including kidney toxicity. The incidence of rejection seen in this study was comparable to the incidence observed by Chan et al9 (ACR 1.2% and chronic rejection 0.2%) and time to rejection episode was also similar. All episodes of rejection in both studies occurred post-DAA treatment [median 76 days (interquartile range 47-176) in Chan et al vs mean 91 days (range 49-119 days) in the present study].9 Given that the episodes of rejection occurred following DAA therapy, it warrants consideration for continued close monitoring of TAC concentration and liver function tests for 1 year following initiation of DAA therapy.
Based on the results of this study, decline in TAC concentration and increased dosing requirement occurs primarily in the first 4 weeks of DAA therapy. After week 4, the TAC dose-normalized concentration stabilized. These results conflict with those of Raschzok et al21 who found the decrease most notably between week 12 of DAA and post-week 12. Kugelmas et al3 saw the greatest decrease in immunosuppression at months 2 and 6 of therapy in patients treated with IFN-based regimens. More studies are needed to truly evaluate when the decrease in TAC concentrations is most substantial. Since the most significant reduction of TAC concentrations was seen at week 4, weekly monitoring of TAC concentrations and appropriate TAC dose adjustments for the first 6 weeks of DAA therapy may be warranted.
Several limitations must be noted in this study including study design and inability to capture newly approved DAA regimens. First, this study was limited by its retrospective nature. Although the institutional protocol specified that patients should have laboratory monitoring at the time periods collected, many data points were missing. However, dose-normalized TAC concentration at baseline and post-week 12 were calculated for every patient. This represents a realistic patient population since laboratory monitoring is sometimes missed. Another limitation of this study was the DAA regimens included. Based on the period analyzed, all patients were treated with a SOF-based regimen. Recently, GLE/PIB was released onto the market and has proven to be safe and efficacious for 12-week HCV treatment in LT recipients.28 Since increased TAC dosing requirement is because of a theoretical increase in hepatic metabolism from viral clearance, it is likely that GLE/PIB would provide similar results.
There are many factors that could affect TAC concentrations such as CYP3A4 drug interactions and inter- and intra-patient variability. None of the DAAs used in this study were expected to impact TAC concentrations and clinically relevant drug-drug interactions during the study time period were infrequent. Since patients may have TAC goals that deviate from institutional protocol, we analyzed change in TAC dose-normalized concentration to account for variable goals and lack of dose adjustments.
With increasing transplantation of HCV positive organs, understanding immunosuppression changes during HCV treatment is vital to the management of transplant patients. A large prospective study performing weekly TAC troughs in LT recipients treated with DAAs would aid in determining the specific time hepatic metabolism is increased, and the impact of decreased TAC concentrations on the risk of rejection.
5 ∣. CONCLUSION
In conclusion, from the start of treatment to 12 weeks post-DAA, LT recipients on DAAs experienced a decrease in log-transformed dose-normalized TAC concentrations. TAC concentrations were significantly lower from baseline to post-week 12, while there was no significant difference in TAC dose. More studies are necessary to determine the impact of DAA on the incidence of rejection. However, close monitoring of TAC concentrations is warranted during and following DAA treatment and TAC dose increases may be indicated.
REFERENCES
- 1.Martin P, DiMartini A, Feng S, Brown R, Fallon M. Evaluation for liver transplantation in adults: 2013 practice guideline by the American Associated for the Study of Liver Diseases and the American Society of Transplantation. Hepatology. 2014;59(3):1144–1165. [DOI] [PubMed] [Google Scholar]
- 2.Mutimer D. Pre- and post-transplant treatment of viral hepatitis C. Dig Dis. 2017;35:347–350. [DOI] [PubMed] [Google Scholar]
- 3.Kugelmas M, Osgood MJ, Trotter JF, et al. Hepatitis C virus therapy, hepatocyte drug metabolism, and risk for acute cellular rejection. Liver Transpl. 2003;9(11):1159–1165. [DOI] [PubMed] [Google Scholar]
- 4.Walter T, Dumortier J, Guillaud O, et al. Am J Transplant. 2007;7:177–184. [DOI] [PubMed] [Google Scholar]
- 5.Razaee-Zacareh MS, Hesmizadeh K, Sharafi H, Alavian SM. Treatment of hepatitis C infection with direct-acting antiviral agents in liver-transplant patients: a systematic review and meta-analysis. Hepat Mon. 2017;17(6):e12324. [Google Scholar]
- 6.Sharma P, Marrero JA, Fontana RJ, et al. Sustained virologic response to therapy of recurrent hepatitis C after liver transplantation is related to early virologic response and dose adherence. Liver Transpl. 2007;13(8):1100–1108. [DOI] [PubMed] [Google Scholar]
- 7.Sharma P, Hosmer A, Appelman H, et al. Immunological dysfunction during or after antiviral therapy for recurrent hepatitis C reduces graft survival. Hepatol Int. 2013;7(4):990–999. [DOI] [PMC free article] [PubMed] [Google Scholar]
- 8.Levitsky J, Fiel MI, Norvell JP, et al. Risk of immune-mediated graft dysfunction in liver transplant recipients with recurrent HCV infection treated with pegylated interferon. Gastroenterology. 2012;142(5):1132–1139.e1. [DOI] [PubMed] [Google Scholar]
- 9.Chan C, Schiano T, Agudelo E, et al. Immune-mediated graft dysfunction in liver transplant recipients with hepatitis C virus treated with direct-acting antiviral therapy. Am J Transplant. 2018;18(10):2506–2512. [DOI] [PubMed] [Google Scholar]
- 10.AASLD-IDSA.Recommendations for testing, managing, and treating hepatitis C. http://www.hcvguidelines.org. Accessed April 6, 2018. [DOI] [PMC free article] [PubMed]
- 11.Frye R, Zgheib N, Matzke G, et al. Liver disease selectively modulates cytochrome P450-mediated metabolism. Clin Pharmacol Ther. 2006;80(3):235–245. [DOI] [PubMed] [Google Scholar]
- 12.Morcos PN, Moreira SA, Brennan BJ, Blotner S, Shulman NS, Smith PF. Influence of chronic hepatitis C infection on cytochrome P450 3a4 activity using midazolam as an in vivo probe substrate. Eur J Clin Pharmacol. 2013;69:1777–1784. [DOI] [PubMed] [Google Scholar]
- 13.Latorre A, Morales E, Gonzalez E, et al. Clinical management of renal transplant patients the hepatitis C virus infection treated with cyclosporine or tacrolimus. Transplant Proc. 2002;34:63–64. [DOI] [PubMed] [Google Scholar]
- 14.Udea Y, Ikegami T, Askamatsu N. Treatment with sofosbuvir and ledipasvir without ribavirin for 12 weeks is highly effective for recurrent hepatitis C virus genotype 1b infection after living donor transplantation” a Japanese multicenter experience. J Gastroenterol. 2017;52:986–991. [DOI] [PubMed] [Google Scholar]
- 15.Castedal M, Segenmark M, Caderberg S, Skoglund C, Weiland O. INF-free sofosbuvir-based treatment of post-transplant hepatitis C relapse- a Swedish real life experience. Scand J Gastroenterol. 2017;52(5):585–588. [DOI] [PubMed] [Google Scholar]
- 16.Oya Y, Sugawara Y, Watanabe T, et al. Ledipasvir and sofosbuvir for recurrent hepatitis C after liver transplantation. BioScience Trends. 2016;10(6):496–499. [DOI] [PubMed] [Google Scholar]
- 17.Nair S, Satapathy SK, Gonzalez HC. Sofosbuvir and simeprevir for treatment of recurrent hepatitis C infection after liver transplant. Exp Clin Transpl. 2017;15(3):314–319. [DOI] [PubMed] [Google Scholar]
- 18.Poordad F, Schiff ER, Vierling JM, et al. Daclatasvir with sofosbuvir and ribavirin for hepatitis C virus infection with advanced cirrhosis or post-liver transplantation recurrence. Hepatology. 2016;63:1493–1505. [DOI] [PMC free article] [PubMed] [Google Scholar]
- 19.Smolders EJ, Pape S, De Kanter C, Van den Berg AP, Drenth J. Decreased tacrolimus plasma concentration during HCV therapy: a drug-drug interaction or is there an alternative explanation? Int J Antimicrob Agents. 2017;49:379–382. [DOI] [PubMed] [Google Scholar]
- 20.Saab S, Theem J, Jimenez M, et al. Curing hepatitis C liver transplant recipients is associated with changes in immunosuppressant use. J Clin Transl Hepatol. 2016;4:32–38. [DOI] [PMC free article] [PubMed] [Google Scholar]
- 21.Raschzok N, Schott E, Reutzel-Selke A, et al. The impact of directly acting antivirals on the enzymatic liver function of liver transplant recipients with recurrent hepatitis C. Transpl Infect Dis. 2016;18:896–903. [DOI] [PubMed] [Google Scholar]
- 22.Nookala AU, Crismale J, Schiano T, et al. Direct-acting antiviral regimens are safe and effective in the treatment of hepatitis C in simultaneous liver-kidney transplant recipients. Clin Transplant. 2018;32:e13198. [DOI] [PubMed] [Google Scholar]
- 23.Goto M, Masuda S, Kiuchi T, et al. CYP3A5*1-carrying graft liver reduces the concentration/oral dose ratio of tacrolimus in recipients of living-donor liver transplantation. Pharmacogenetics. 2004;14:471–478. [DOI] [PubMed] [Google Scholar]
- 24.Thervet E, Anglicheau D, King B, et al. Impact of cytochrome P450 3A5 genetic polymorphism on tacrolimus doses and concentration-to-dose ratio in renal transplant recipients. Transplantation. 2003;76(8):1233–1235. [DOI] [PubMed] [Google Scholar]
- 25.Early CR, Park JM, Dorsch MP, Pogue KT, Hanigan SM. Effect of metronidazole use on tacrolimus concentrations in transplant patients treated for Clostridium difficile. Transpl Infect Dis. 2016;18:714–720. [DOI] [PubMed] [Google Scholar]
- 26.Vanhove T, Bouwsma H, Hilbrands L, et al. Determinants of the magnitude of interaction between tacrolimus and voriconazole/posaconazole in solid organ transplant recipients. Am J Transplant. 2016;17:2372–2380. [DOI] [PubMed] [Google Scholar]
- 27.Mansour M, Hill L, Kerr J. Safety and efficacy of direct acting antivirals for treatment of hepatitis C virus in patients with solid organ transplantation. Transpl Infect Dis. 2018;20(6):e12972. [DOI] [PubMed] [Google Scholar]
- 28.Reau N, Kwo PY, Rhee S, et al. MAGELLAN-2: Safety and efficacy of gleceprevir/pibrentasvir in liver or renal transplant adults with hepatitis C genotype 1-6 infection. J Hepatol. 2017;66(1):S90–S91. [Google Scholar]