

Abstract
The nuclear pore complex (NPC) solely mediates molecular transport between the nucleus and cytoplasm of a eukaryotic cell to play important biological and biomedical roles. It, however, is not well understood chemically how this biological nanopore selectively and efficiently transports various substances including small molecules, proteins, and RNAs by using transport barriers that are rich in highly disordered repeats of hydrophobic phenylalanine and glycine intermingled with charged amino acids. Herein, we employ scanning electrochemical microscopy to image and measure the high permeability of NPCs to small redox molecules. The effective medium theory demonstrates that the measured permeability is controlled by diffusional translocation of probe molecules through water-filled nanopores without steric or electrostatic hindrance from hydrophobic or charged regions of transport barriers, respectively. The permeability of NPCs, however, is lowered by a low millimolar concentration of Ca2+, which can interact with anionic regions of transport barriers to alter their spatial distributions within the nanopore. We employ atomic force microscopy to confirm that transport barriers of NPCs are dominantly recessed (~80%) or entangled (~20%) at the high Ca2+ level in contrast to authentic populations of entangled (~50%), recessed (~25%), and “plugged” (~25%) conformations at a physiological Ca2+ level of sub-micromolar. We propose a model for synchronized Ca2+ effects on the conformation and permeability of NPCs, where transport barriers are viscosified to lower permeability. Significantly, this result supports a hypothesis that the functional structure of transport barriers is maintained not only by their hydrophobic regions, but also by charged regions.
Graphical Abstract

Understanding the chemical mechanism of molecular transport through the nuclear pore complex (NPC) has been a fascinating theme with great biological and biomedical importance.1 The NPC perforates the nuclear envelope (NE) between the nucleus and cytoplasm of a eukaryotic cell to solely mediate nucleocytoplasmic transport of various substances including electrolytes, small molecules, proteins, and RNAs. The NPC is crucial to gene expression regulation2 and gene delivery3 and is linked to many human diseases and therapeutics, e.g., cancers,4 genetic disorders,5 and aging.6 However, the chemical mechanism of NPC-mediated multimodal transport has not been well understood beyond a consensus that transport barriers are constituted by nucleoporins (nups) that are rich in repeats of phenylalanine and glycine (FG).7 Problematically, FG repeats are intrinsically disordered and heterogeneously dispersed to remain elusive to modern structure determination technologies8 and addressable only theoretically.9 Moreover, hydrophilic, charged amino acids are also abundant between hydrophobic FG repeats to potentially play important structural and functional roles, which have been suggested theoretically10 and assessed experimentally only by using isolated FG nups as simple models.11,12
There has been renewed interest in passive transport of small electrolytes through NPCs,13 which is required to enable the stochastic detection of single macromolecular transport events14 as demonstrated recently by using biomimetic NPCs.15 Specifically, a solid-state nanopore was modified with FG-rich nups to detect the translocation of single protein molecules through the single pore as real-time conductance blockage.15 Biomimetic NPCs were impermeable to large proteins (> 40 kDa), which were transported only as complexes with transport receptors, i.e., importins,15 as also demonstrated by authentic NPCs1,16 as well as hydrogels of isolated FG nups.17,18 Moreover, the conductance of solid-state nanopore was largely reduced by modification with isolated FG nups and was quantitatively analyzed to conclude that ion transport is completely blocked when the density of FG units exceeded 85 mg/mL.15 The lowered conductance of single NPC mimetic was consistent with that of single authentic NPCs,14 which were much lower than expected for non-blocking pores with ~40 nm diameters.14 The threshold density, however, exceeded actual concentrations of FG repeats estimated for yeast NPCs experimentally (25–150 mM19 ≈ 2–25 mg/mL) and theoretically (<~20 mg/mL9).
Herein, we employ scanning electrochemical microscopy20,21 (SECM) to demonstrate that the permeability of NPCs to small redox probe molecules is high and controlled by their diffusional translocation through the pores without a blocking effect from transport barriers. This result implies that the blockage of small electrolytes through NPC mimetic by surface-attached FG nups15 is attributed to their non-physiologically high concentrations, thereby exemplifying the great significance of a transport study with authentic NPCs. Experimentally, we study the nucleoplasm-free NE supported by a microporous membrane (Figure 1A) in contrast to our previous SECM studies of isolated intact nuclei,22-24 where small proteins were leached from the nucleoplasm to foul a Pt tip. In this study, the high permeability of multiple NPCs (~25) is imaged and measured under a 1 μm-diameter Pt tip without significant fouling not only for neutral and monocationic ferrocene derivatives, but also for redox probes with three positive charges (Figure 1B) to detect no electrostatic effect from positively charged residues of amino acids that are intermingled with FG repeats.10 Moreover, the effective medium theory25-27 ensures that the measured permeability of NPCs is consistent with their sizes28 and density.29
Figure 1.

(A) Scheme of tip-induced transfer of a redox probe molecule (red dots) across the NE supported by a micropore. The tip is positioned over the nucleoplasmic side of the NE. Blue dots represent the product of electrolysis at the tip. The tip–NE distance is given by d. (B) Redox probes used in this study; (ferrocenylmethyl)trimethylammonium, 1,1´-ferrocenedimethanol, hexaammineruthenium(III), and tris(1,10- phenanthroline)cobalt(III).
Significantly, this study reveals synchronized Ca2+ effects on the permeability and conformation of NPCs as determined by SECM and atomic force microscopy (AFM), respectively. A low millimolar concentration of Ca2+ interacts with negatively charged residues of amino acids between FG repeats to alter spatial distributions of transport barriers as demonstrated by immune-electron microscopy.30 We employ SECM to find that the permeability of NPCs to small redox probes is lowered by a low millimolar concentration of Ca2+, which is attributed to viscosified transport barriers. Complementarily, AFM of individual NPCs demonstrates that the recessed conformation of transport barriers becomes dominant with a low millimolar concentration of Ca2+31,32 in comparison with entangled and plugged conformations33 to represent lower permeability. Our finding of Ca2+-induced changes in the permeability and conformation of NPCs indicates that barrier properties of FG nups are maintained not only by their hydrophobic or positive regions,10 but also by negative ones. Interestingly, nucleocytoplasmic protein transport is also inhibited at high intracellular Ca2+ concentrations,34 thereby exemplifying the importance of nuclear calcium signaling.35,36
EXPERIMENTAL SECTION
Chemicals and Materials.
The hexafluorophosphate salt of FcTMA+ was prepared by the metathesis of its iodide salt (Strem Chemicals, Newburyport, MA) and ammonium hexafluorophosphate (Strem Chemicals). Ru(NH3)6Cl3 was obtained also from Strem Chemicals. Fc(CH2OH)2 was purchased from Acros Organics (Thermo Fisher Scientific, NJ). Co(phen)3Cl3 was obtained from Dyenamo (Stockholm, Sweden). Microporous silicon nitride (Si3N4) membranes with 3 μm in pore diameter and 200 nm in membrane thickness (NX5100D-H3) were obtained from Norcada (Edmonton, Canada). Milli-Q Advantage A10 water purification system (EMD Millipore, Billerica, MA) was used to produce UV-treated ultrapure water (18.2 MΩ·cm) with a TOC value of 2–3 ppb as measured by using an internal online TOC monitor. The Milli-Q system was fed with the water (15.0 MΩ·cm) purified from tap water by using Elix 3 Advantage (EMD Millipore).
Preparation of Micropore-Supported NEs.
We employed a microporous Si3N4 membrane to support the nucleoplasm-free NE of a large nucleus (~0.4 mm in diameter) isolated from the stage VI oocyte of a Xenopus laevis frog.24 Oocytes were extracted from the ovary cluster of an adult female frog37 (NASCO, Fort Atkinson, WI) and stored at 18 ºC for less than three days prior to use. The nucleus was isolated from the oocyte in the isotonic 1.5% poly(vinyl pyrrolidone) (PVP) solution of mock intracellular buffer (MIB) at pH 7.4 containing 90 mM KCl, 10 mM NaCl, 2 mM MgCl2, 1.1 mM EGTA, 0.15 mM CaCl2, and 10 mM HEPES.29 EGTA was used to mimic a physiological concentration of free Ca2+ (~200 nM) in oocytes. The isolated nucleus was transferred on a microporous membrane that was treated with Cell Tak (BD Biosciences, Bedford, MA) as a biological adhesive (see Supporting Information) and placed in an SECM cell filled with a hypotonic MIB solution containing 0.55% PVP (Figure 2A). The NE was detached from the nucleoplasm of the swollen nucleus and spread over the 200 nm-thick microporous membrane under a stereo microscope (SZX-ZB7, Olympus, Center Valley, PA) by using minute pins13 without breaking the underlying thin membrane (Figure 2B). For SECM studies, the hypotonic MIB solution was replaced with PVP-free MIB as low Ca2+ media or a nuclear isolation media (NIM) as high Ca2+ media containing 87 mM NaCl, 3 mM KCl, 1.5 mM CaCl2, 1 mM MgCl2, 10 mM HEPES at pH 7.4.31,32 For AFM studies, the high or low Ca2+ media was exchanged with the same media containing 2.5% glutaraldehyde33 to fix micropore-supported NEs. The fixed samples were washed with water and dried overnight in ambient air.
Figure 2.

Photographs of (A) the swollen nucleus with the NE detached from the nucleoplasm and (B) the nucleoplasmic side of the NE spread on the microporous region of a Si3N4 membrane.
AFM.
The tapping mode of AFM (MFP3D AFM, Asylum Research, Santa Barbara, CA) was employed to image the topography of fixed NEs supported by microporous membranes. A cantilever (HQ:NSC19/Al) was obtained from Mikromasch (Watsonville, CA). The NE patches suspended over micropores of a Si3N4 membrane were robust enough for AFM imaging, which was performed under dry nitrogen to maintain a humidity of ~25%. The cytoplasmic side of the NE was adhered to a microporous membrane and imaged through a micropore to observe NPCs without damage of the NE patch (Figure 3A). Higher resolution images of the cytoplasmic side were obtained to assess conformation of NPCs (see below). The nucleus side of the NE was also imaged to find NPCs on the entire surface including the surrounding Si3N4 membrane (Figure 3B). The NE patch over the micropore was recessed from the surrounding by ~100 nm. A higher resolution image of the nucleoplasmic side (Figure 3C) showed nuclear baskets based on nuclear filaments assembled into the so-called distal ring as an indication of good sample preparation.33
Figure 3.

AFM images of (A) cytoplasmic and (B) nucleoplasmic sides of the NE supported by a micropore. (C) AFM image of nuclear baskets as obtained from the nucleoplasmic side of a micropore-supported NE patch.
SECM.
An SECM instrument was home-built using three-axis piezoelectric positioners with capacitive sensors (P-620.2CD and P-620.ZCD, Physik Instrumente, Auburn, MA), piezo servo controllers (E-625, Physik Instrumente) and a potentiostat (CHI 802D, CH Instruments, Austin TX).38 The positioning system was controlled by using a custom Labview program39 (National Instruments, Austin, TX). A micropore-supported NE was set up under a tip in the SECM cell as shown in Figure S-1A. A glass-sealed Pt tip was fabricated by laser-assisted pulling, heat annealing, and focused-ion-beam milling22,40 and characterized by scanning electron microscopy and cyclic voltammetry to determine inner and outer diameter of ~1 and ~2 μm, respectively. A tip was protected from electrostatic discharge by grounding the tip and nearby objects41,42 and maintaining sufficiently high humidity (>30%).38,43,44 Pt wires were used as a counter and quasi-reference electrode of two-electrode cell. The tip current was measured with the cell-on-between-run function41 of the potentiostat without relay switches38,45 to prevent tip etching. An SECM stage was accommodated in a faraday cage equipped with metallic heat sinks and surrounded polystyrene foams (Figure S-1B) to maintain stable temperature and, subsequently, minimize thermal drift.46
RESULTS AND DISCUSSION
SECM Imaging of NE Permeability.
We employed SECM imaging to investigate the NPC-mediated transport of small redox probes across the NE spread over a microporous Si3N4 membrane (Figure 1). The nucleoplasm-free NE was prepared (Figure 2) as established for fluorescence transport studies,47 which ensured the physiological function of NPCs on the NE patches in MIB, i.e., to mediate signal-dependent transport of passively impermeable large proteins by nuclear transport receptors when the proteins are labeled with nuclear localization or export signal peptides.1,16 In this study, we employed 3 μm-diameter pores to support small patches of the NE (Figure 2B), which were robust enough for AFM imaging of individual NPCs48 (Figure 3). Moreover, 3 μm-diameter pores were large enough in comparison with a 1 μm-diameter Pt tip to allow the transport of redox probes under the tip without hindrance from the pore wall (see below). Advantageously, the nucleoplasm-free NE caused minimal tip fouling during SECM-based imaging and permeability measurement of multiple NE patches. Previously, we were not able to image an intact nucleus using a 1 μm-diameter Pt tip,22-24 which was fouled by the adsorption of small proteins leaching from the nucleoplasm, thereby enabling only a quick approach curve measurement with FcTMA+.
Specifically, SECM images were obtained in the constant-height mode, where a Pt tip was scanned at a fixed vertical position over the nucleoplasmic side of a micropore-supported NE. The vertical position was initially selected by bringing the tip to the substrate until the amperometric tip current, iT, based on steady-state diffusion-limited electrolysis of a redox probe decreased to 70 % of the corresponding tip current in the bulk solution, iT,∞, as given by
| (1) |
where x is a function of RG49 (= rg/a; a and rg are the tip radii of Pt and glass sheath; see Figure 1A), n is the number of electrons transferred in the tip reaction (= 1 in this study), and Dw and c0 (= 0.3 mM with the exception of Ru(NH3)63+) are the diffusion coefficient and concentration of a redox probe in solution. The normalized tip current, iT/iT,∞, of 0.70 corresponded to the normalized tip–substrate distance, d/a, of 0.95, e.g., d = 475 nm with a = 500 nm, when the tip approached a part of the NE blocked by the underlying Si3N4 surface of a microporous membrane to observe a purely negative feedback effect.
Figure 4A shows a constant-height SECM image of a micropore-supported NE as obtained using FcTMA+ in MIB. Higher tip currents were observed over eight pores, 1–8, aligned with the periodicity expected for the microporous membrane (Figure S-2). A higher tip current over each NE patch is attributed to the NPC-mediated transport of FcTMA+ from the bottom solution to the tip, which depleted FcTMA+ to create its local concentration gradient across the NE (Figure 1A). The resultant flux of FcTMA+ under a 1 μm-diameter tip is mediated by ~25 NPCs with a density of ~40 NPCs/μm2 as determined by AFM (see below). Pores 1–8 were fully covered with the NPC-perforated NE, which only partially blocked the transport of FcTMA+ to yield high normalized tip currents of ~0.80 over the center of each pore in comparison with the surrounding. Well-defined disked-shaped images were obtained at pores 3, 4, 5, and 7. Only pores that gave such ideal images were further studied to obtain reproducible and reliable approach curves as measures of NE permeability (see below). Noticeably, tip currents were slightly higher over pores 3 and 5 than other pores. This result indicates that the NE was recessed deeper into pores 3 and 5 to increase the tip–NE distance and, subsequently, the tip current. In fact, the ~100 nm-deep recession of the NE into a micropore was observed by AFM (Figure 3B). By contrast, the image of pore 1 yielded lower tip currents at the left-hand side of the NE patch, which was perhaps blocked by residues of the nucleoplasm. We did not measure an approach curve when the image of a pore was not a well-defined disk shape, because an approach curve at such a pore was not reproducible or reliable.
Figure 4.
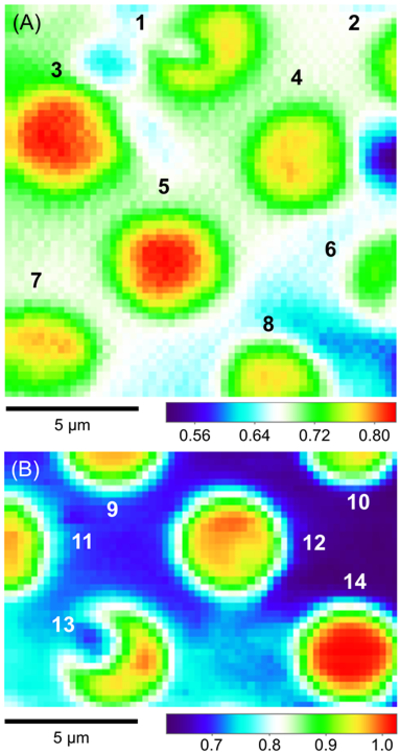
Constant-height SECM images of NEs spread over microporous Si3N4 membranes in MIB as obtained by using (A) FcTMA+ and (B) Ru(NH3)63+. Sizes of the respective images are 15 μm × 15 μm and 10 μm × 15 μm. Colored scale bars indicate the normalized tip current. The tip was brought to the left top corner, where the normalized tip current was ~0.70. The tip was scanned laterally at a rate of 1 μm/s with a tip step size of 0.25 μm for both directions.
Figure 4B shows a constant-height image obtained by using 3 mM Ru(NH3)63+ in MIB, where a higher concentration was used to minimize the relative contribution of the oxygen reduction reaction to the tip current. The SECM image shows an array of six pores, 9–14, which are aligned as expected from the periodicity of the microporous membrane. Pore 12 yielded a well-defined disk-shaped image with a tip current lower than the tip current in the bulk solution, which indicates that pore 12 was uniformly covered with the NE. By contrast, the tip current over the entire region of pore 14 was as high as the tip current in the bulk solution. This result indicates that pore 14 was open and was not covered with the NE. By contrast, low tip currents at the left-hand side of pore 13 indicate that this region of the NE patch was less permeable (see also pore 1 in Figure 4A).
Approach Curve Measurement of NE Permeability.
The permeability of micropore-supported NE patches to redox probes was determined from SECM approach curves, i.e., a plot of the tip current, iT, versus the tip–NE distance, d. Specifically, a tip was positioned over the center of a micropore that were uniformly covered with the NE as ensured by SECM imaging, e.g., pores 3, 5, and 12 (Figure 4). An approach curve was measured by vertically bringing the tip to the center of the NE patch at a scan rate of 0.20 μm/s to obtain the steady-state tip current. An experimental approach curve was analyzed by solving a SECM diffusion problem using the finite element method22-24,26,27,50 as detailed in Supporting Information. In this simulation, a boundary condition at the NE was defined by assuming that the NE was uniformly permeable to a redox probe, although the probe molecule can be transported through NPCs, but not through the surrounding double-membrane regions of the NE. With this assumption, a redox probe was transferred across the NE at a rate, vNE, from the bottom solution (the cytoplasmic side) to the top solution (the nucleoplasmic side) as given by
| (2) |
where k is the uniform permeability of the NE and cN and cC are the concentrations of the redox probe at nucleoplasmic and cytoplasmic sides of the NE, respectively. The apparent permeability of the NE is related to the actual permeability of NPCs by the effective medium theory25-27 (see below).
Figure 5A exemplifies approach curves with FcTMA+ in MIB (red solid line) and NIM (blue solid line) as low and high Ca2+ media, respectively. Permeability study of NIM-incubated NEs is significant, because NIM has been used to prepare NE samples for AFM without characterization of their permeability.31,32 Approach curves were normalized and fitted well with those simulated by the finite element method to determine the permeability of the NE as well as the tip–NE distance. As the tip approached to the NE, the tip current decreased, because the NE partially hindered the diffusional access of a redox probe to the tip. The tip current, however, was still higher over the NE patch than expected over an insulating substrate (dotted line), because the NE was perforated by NPCs to transport redox probes. Best fits between experimental and simulated approach curves of FcTMA+ were obtained by adjusting permeability to yield higher k values in MIB (0.068 ± 0.006 cm/s; N = 9) than in NIM (0.039 ± 0.001 cm/s; N = 3). This difference in permeability was seen also in the approach curves, where the tip current at the NE in MIB was always higher than at the NE in NIM. The permeability of MIB-incubated NE patches to FcTMA+ was closer to the permeability of MIB-incubated intact NEs to this redox probe, i.e., 0.059 cm/s.22 Lower permeability of the NIM-incubated NE is attributed to a change in the conformation of transport barriers caused by a high concentration of Ca2+ as observed by AFM (see below).
Figure 5.

(A) SECM approach curves of FcTMA+ at micropore-supported NEs prepared in MIB and NIM. Simulated curves at the NE used (a, k) = (0.59 μm, 0.061 cm/s) and (0.45 μm, 0.040 cm/s) for MIB and NIM, respectively, with RG = 2. (B) The corresponding concentration profile of FcTMA+ simulated around a nanometer-wide gap between the tip and the NE prepared in MIB. The scale bar indicates the concentration of FcTMA+.
The finite element simulation also yielded a concentration gradient of FcTMA+ (Figure 5B), which is locally depleted under the tip to drive a flux of FcTMA+ across the NE. The concentration gradient is not continuous across the NE, which ensures that the resultant tip current at the short tip–NE distances was controlled by the kinetics of FcTMA+ transport across the NE, not by the diffusion of FcTMA+ from the bottom solution to the NE or from the NE to the tip.24 It should be noted that a small 1 μm-diameter Pt tip with a very thin glass sheath was nanofabricated22,40 to penetrate the micropore with a negligible feedback effect from the pore wall when the tip approached the NE slightly recessed into a micropore as shown by AFM (Figure 3A). In fact, the simulated gradient of FcTMA+ concentration was laterally confined under the tip (Figure 5B) and, subsequently, was not affected by the surrounding Si3N4 membrane including adjacent pores. Accordingly, the simulated tip current was nearly unaffected when a tip moved through the center of a micropore without the NE (dashed line in Figure 5A).
Ca2+ Effect on Barrier Permeability.
We measured and analyzed approach curves with Fc(CH2OH)2, Ru(NH3)63+, and Co(phen)33+ in addition to FcTMA+ to systematically find the higher permeability of NEs incubated in MIB containing a sub-micromolar concentration of Ca2+ (~200 nM) than in NIM containing a low millimolar concentration of Ca2+ (1.5 mM). This finding was quantitatively represented by linear relationships between the NE permeability and diffusion coefficients of redox probes in solution, which yielded a larger slope for more permeable NEs incubated in MIB (Figure 6). These linear relationships are expected from the effective medium theory25-27 based on the assumption that the NE is perforated by NPCs as cylindrical nanopores, thereby yielding22
| (3) |
with
| (4) |
where N is the pore density, r is the pore diameter, l is the pore length, γ is the ratio of a diffusion coefficient in the nanopore, DNPC, against Dw, and σ (= πNr2) is the membrane porosity. A slope of 1.2 × 104 cm–1 for MIB-incubated NEs corresponds to eq 3 with geometrical parameters of r = 25 nm, l = 35 nm, and N = 40 NPCs/μm2 as determined for the Xenopus oocyte nucleus by cryo-electron tomography.28,29 In this analysis, γ = 1 was used to indicate that redox probes are unaffected by transport barriers to diffuse across the nanopore as freely as in solution. This result is consistent with low concentrations of FG repeats in the nanopore,9,19 which is mainly filled with the electrolyte solution. In fact, the size of water-filled spaces (5.2 nm) among the gel-like network of FG repeats51 is much larger than an effective diameter of 1.3 nm52 for Co(phen)33+, which is the largest among the redox probes examined in this study. By contrast, the lower permeability of NIM-incubated NEs is represented by a slope of 7.2 × 103 cm–1, which is 1.7 times lower than the slope determined for MIB-incubated NEs. The lower slope corresponds to γ = 0.45 in eq 3 with the same radius, length, and density as employed for the analysis of MIB-incubated NEs. The lower γ value indicates that a millimolar concentration of Ca2+ viscosifies transport barriers, which is consistent with a change in barrier conformation shown by AFM (see below). More quantitatively, the Stokes–Einstein equation with the lower γ value indicates that the high Ca2+ concentration increases viscosity in the nanopore by a factor of 2.2 (= 1/γ).
Figure 6.

Permeability of micropore-supported NEs plotted against diffusion coefficient for redox probes in MIB and NIM (red and blue symbols, respectively). Permeability values are average values determined from 3–9 approach curves. Solid lines represent the best linear fits.
It should be noted that linear relationships between k and Dw values for redox probes with zero, one, and three positive charges (Figure 6) indicate no electrostatic effect from positively charged residues of amino acids that are abundant between FG repeats to facilitate the transport of negatively charged transport receptors.10 In addition, this study was limited to neutral and positively charged redox probes, because a nucleoplasm-free NE fouls a Pt tip more seriously for anionic redox probes, i.e., Fe(CN)64–, FcCO2–, FcCH2CO2–, and FcSO3–. The tip fouling is attributed to leaching of proteins from residual nucleoplasm or Cell Tak, which was used to adhere the NE to a microporous membrane. Moreover, a stable or reasonable tip current was not obtained even without the NE when Fc(CO2–)2, Ru(CN)64–, IrCl62–, Fe(EDTA)–/2–, Fc(SO3–)2, and various isomers of anthraquinone sulfonate were tested.
Ca2+ Effect on Barrier Conformation.
We employed AFM to find that conformations of transport barriers are different between NPCs incubated in MIB and NIM with high and low Ca2+ concentrations, respectively. As reported previously for both fixed and non-fixed NE samples,33 three conformations, i.e., recessed, entangled, and plugged states, were observed at the central region of NPCs by AFM when we imaged the cytoplasmic side of micropore-supported NEs prepared and fixed in MIB containing a physiological concentration of Ca2+ (~200 nM; Figure 7A). Cross sections of NPCs at the corresponding states (Figure 7B) demonstrate remarkable differences in topography. A large “plug-like” feature (red line) is considered as a macromolecule caught in transit during translocation through the nanopore.53 A plug can be as high as 10 nm in comparison with a recessed NPC (blue line). By contrast, a small protrusion at the center of an entangled NPC (purple line) is attributed to the transient intermingling of FG nups.33 Specifically, Lim and co-workers imaged NPCs of Xenopus oocyte nuclei by high-speed AFM to demonstrate that FG nups are intermingled transiently to yield a protrusion of ~1.7 nm33 as observed in our AFM images. Overall, we analyzed AFM images of 100 NPCs on three micropore-supported NEs prepared and incubated in MIB to find that ~50% of NPCs were entangled (see Figure S-4A). The population of plugged NPCs (~25%) was similar to that of recessed NPCs.
Figure 7.

(A) AFM image of the cytoplasmic side of a micropore-supported NE prepared in low Ca2+ media, MIB. Red, purple, and blue arrows indicate examples of plugged, entangled, and recessed NPCs. (B) Cross sections of the respective NPCs. (C) AFM image of the cytoplasmic side of a micropore-supported NE prepared in high Ca2+ media, NIM, where only recessed and entangled NPCs were observed as represented by blue and purple arrows, respectively.
AFM images of NEs incubated with a low millimolar concentration of Ca2+ in NIM (Figure 7C) revealed that NPCs were dominantly recessed (~80%; see Figure S-4B) when the topography of 93 NPCs on two micropore-supported NEs was analyzed. This result is consistent with that of previous AFM studies of Xenopus oocyte nuclei in NIM,31,32 where recessed NPCs were dominant. In addition, we found that populations of plugged and entangled NPCs were ~0% and ~20%, respectively, when the NE was incubated in NIM. It should be noted that the large population of recessed NPCs was formed irreversibly in NIM owing to its high Ca2+ concentration. The population of each conformation was not changed when the NIM-incubated NE was exposed to MIB for three hours. Moreover, the micropore-supported NE was incubated in MIB with a high concentration of Ca2+ (1.5 mM) as contained in NIM to find a high population of recessed NPCs (~80%) and the absence of plugged NPCs as observed in NIM. This result ensures that a high concentration of Ca2+ causes conformational changes of transport barriers.
It should be noted that the recession of NPCs imaged by AFM (Figure 7B) is shallower (~10 nm in depth) and narrower (~25 nm in diameter) than the actual pore of NPCs, because our AFM cantilever tips do not have a high aspect ratio to deeply penetrate into the pore.54 In fact, actual pores are deeper and wider as determined by cryo-electron tomography28,29 and considered in eq 3 (see above).
Ca2+-Dependent Permeability–Conformation Relationships.
We propose a model to explain why the NE is less permeable to redox probes in NIM where NPCs are unplugged. Specifically, we attribute the lower permeability of NIM-incubated NE to less permeable transport barriers that are unplugged and viscosified by a high concentration of Ca2+ to yield recessed NPCs. Accordingly, our model is based on two types of recessed NPCs, which can be as authentic as observed in MIB or affected by a low millimolar concentration of Ca2+ to yield lower permeability. The authentically recessed state must be present even in NIM, because it is dynamically equilibrated with the entangled state as demonstrated in a recent high-speed AFM study of NPCs.33 Quantitatively, we performed AFM imaging of MIB-incubated NE to find a 2:1 ratio of entangled and recessed NPCs (50% and 25% of 100 NPCs, respectively, as mentioned earlier) as discussed above. By contrast, NIM-incubated NEs had entangled and recessed NPCs with populations of 20 % and 80 %, respectively. When the same dynamic equilibrium between entangled and recessed states (2:1) is assumed for MIB and NIM in our model (Scheme 1), only 10% of NPCs are expected to be recessed in NIM, where 70% of NPCs are irreversibly converted to the recessed state with low permeability and are not equilibrated with authentic states. Our model also accounts for a loss of plugged NPCs in NIM, which facilitates the irreversible conversion of the plugged state to the less permeable recessed state through the authentic recessed state. The Ca2+-induced loss of plugging macromolecules is remarkable because the plugged state was maintained during the hour-long preparation of AFM samples in various solutions containing no macromolecule,33 thereby indicating the intrinsically slow conversion of the plugged state to the authentic recessed state (Scheme 1).
Scheme 1.

Ca2+ Effect on Conformational Equilibrium of Transport Barriers of NPCs.
Overall, we employed AFM and SECM to correlate the effects of a high Ca2+ concentration on the conformation and permeability of NPCs in contrast to previous studies, where either conformation or permeability was investigated. Structurally, immune-electron microscopy demonstrated that spatial distributions of transport barriers are altered by interactions of a low millimolar concentration of Ca2+ with negatively charged residues of amino acids between FG repeats.30 Our model hypothesizes that transport barriers are irreversibly recessed and viscosified by a high concentration of Ca2+ to yield lower permeability (Scheme 1). By contrast, importin-assisted nuclear protein import was inhibited at a high intracellular Ca2+ level34 to exemplify the importance of nuclear calcium signaling, e.g., in the regulation of gene transcription35 and brain function.36 Interestingly, the electrostatic Ca2+ effect not only reveals the significance of negative sites on transport barriers,30 but also contrasts to the effect of hydrophobic ions on the permeabilization of NPCs to passively impermeable proteins through hydrophobic interactions with FG barriers.23
It should be noted that this study revealed the need for nanoscale SECM55,56 to test our model further. Specifically, the recessed state formed in NIM must be less permeable than at least one of the authentic states to account for the lower permeability of NIM-incubated NEs. This requirement is satisfied in our model, which assumes that the authentic recessed state is more permeable than the recessed state formed in NIM. The permeability of each state, however, is not resolvable in this study of multiple NPCs, thereby preventing a comparison of permeability among different states to experimentally test our model. Such a comparison will require nanoscale SECM measurements of single NPC permeability as demonstrated for solid-state nanopores.57,58 Moreover, SECM can monitor the capture and release of an individual nanoparticle at a single nanopore by monitoring a change in the tip current controlled by the translocation of a redox active molecule through the pore.59,60 The non-contact operation of nanoscale SECM is required to stochastically detect the translocation of individual macromolecules at single NPCs, which was unsuccessful by destructive electrophysiological methods.14 Significantly, nanoscale SECM will also complement single-molecule fluorescence microscopy,61 where fluorescence tags, e.g., GFP and quantum dots, are attached to transported macromolecules to potentially alter their interactions with transport barriers.
CONCLUSIONS
In this work, we employed SECM to successfully image and measure the high permeability of NPCs based on the diffusion-controlled translocation of small redox probes without any hindrance from transport barriers. We conclude that highly disordered FG-based barriers are spatially too disperse to block the diffusion of the small probes. Our result was obtained from authentic NPCs to argue that the concentrations of FG-rich nups attached to artificial NPCs were non-physiologically high to block the transport of small ions significantly.15 Moreover, we demonstrated that the NPC-mediated transport of redox probes with up to three positive charges was not affected by positive residues of amino acids that are abundant between FG repeats.12 By contrast, we attribute Ca2+-dependent permeability and conformation of NPCs to interactions of Ca2+ with negative residues of amino acids between FG repeats. It is interesting to point out that nucleocytoplasmic protein transport is also Ca2+-dependent in cultured cells34 to exemplify the importance of nuclear calcium signaling.35,36 More work, however, is needed to connect the intracellular Ca2+ effects to the Ca2+ effects on the isolated nuclei found in this study.
Technologically, this study manifested future opportunities for nanoscale SECM55,56 to investigate the mechanism of NPC-mediated molecular transport at the single nanopore level. Specifically, nanoscale SECM is required to resolve the permeability of individual NPCs at different conformations as revealed by AFM.33 The fast transport of small redox probes through NPCs is advantageous for the study of single NPCs by nanoscale SECM, which was applied to successfully image solid-state nanopores with similar diameters of down to ~40 nm.57,58 Both permeability and topography of single nanopores were determinable by the finite element analysis of nanoscale SECM images,57,58 thereby eliminating the need of AFM. Moreover, the nucleoplasm-free NE supported by a microporous membrane will facilitate nanoscale SECM measurements, which were unsuccessful with intact nuclei owing to tip fouling.23 Ultimately, nanoscale SECM is attractive as a non-contact and non-destructive approach59,60 to stochastically detect the NPC-mediated translocation of single macromolecules without chemical modification in contrast to electrophysiological14 and fluorescence61 approaches.
Supplementary Material
ACKNOWLEDGMENT
This work was supported by the National Institutes of Health (R01 GM112656). D.T.J. and K.C.L also acknowledge funding through the Army Research Office Young Investigator Grant No. 66446-CH-YIP (Award Number W911NF-17–1-0098).
Footnotes
Supporting Information
The Supporting Information is available free of charge on the ACS Publications website.
SECM setup, SECM image of a microporous membrane, model for finite element simulation of SECM approach curves, and analysis of AFM images of individual NPCs (PDF)
REFERENCES
- (1).Beck M; Hurt E The nuclear pore complex: Understanding its function through structural insight. Nat. Rev. Mol. Cell Biol. 2017, 18, 73–89. [DOI] [PubMed] [Google Scholar]
- (2).Strambio-De-Castillia C; Niepel M; Rout MP The nuclear pore complex: Bridging nuclear transport and gene regulation. Nat. Rev. Mol. Cell Biol. 2010, 11, 490–501. [DOI] [PubMed] [Google Scholar]
- (3).Pack DW; Hoffman AS; Pun S; Stayton PS Design and development of polymers for gene delivery. Nat. Rev. Drug Discovery 2005, 4, 581–593. [DOI] [PubMed] [Google Scholar]
- (4).Simon DN; Rout MP Cancer and the nuclear pore complex In Cancer biology and the nuclear envelope: Recent advances may elucidate past paradoxes, Schirmer EC; DeLasHeras JI, Eds. 2014; Vol. 773, pp 285–307. [DOI] [PubMed] [Google Scholar]
- (5).Raices M; D’Angelo MA Nuclear pore complex composition: A new regulator of tissue-specific and developmental functions. Nat. Rev. Mol. Cell Biol. 2012, 13, 687–699. [DOI] [PubMed] [Google Scholar]
- (6).Robijns J; Houthaeve G; Braeckmans K; De Vos WH Loss of nuclear envelope integrity in aging and disease In International review of cell and molecular biology, Galluzzi L, Ed. 2018; Vol. 336, pp 205–222. [DOI] [PubMed] [Google Scholar]
- (7).Schmidt HB; Gorlich D Transport selectivity of nuclear pores, phase separation, and membraneless organelles. Trends Biochem. Sci. 2016, 41, 46–61. [DOI] [PubMed] [Google Scholar]
- (8).Hoelz A; Glavy JS; Beck M Toward the atomic structure of the nuclear pore complex: When top down meets bottom up. Nat. Struct. Mol. Biol. 2016, 23, 624–630. [DOI] [PMC free article] [PubMed] [Google Scholar]
- (9).Tagliazucchi M; Peleg O; Kroger M; Rabin Y; Szleifer I Effect of charge, hydrophobicity, and sequence of nucleoporins on the translocation of model particles through the nuclear pore complex. Proc. Natl. Acad. Sci. U. S. A. 2013, 110, 3363–3368. [DOI] [PMC free article] [PubMed] [Google Scholar]
- (10).Colwell LJ; Brenner MP; Ribbeck K Charge as a selection criterion for translocation through the nuclear pore complex. PLoS Comput. Biol. 2010, 6. [DOI] [PMC free article] [PubMed] [Google Scholar]
- (11).Friedman AK; Baker LA Synthetic hydrogel mimics of the nuclear pore complex display selectivity dependent on FG-repeat concentration and electrostatics. Soft Matter 2016, 12, 9477–9484. [DOI] [PubMed] [Google Scholar]
- (12).Chen WG; Witten J; Grindy SC; Holten-Andersen N; Ribbeck K Charge influences substrate recognition and self-assembly of hydrophobic FG sequences. Biophys. J. 2017, 113, 2088–2099. [DOI] [PMC free article] [PubMed] [Google Scholar]
- (13).Shahin V; Ludwig Y; Oberleithner H Investigation of nuclear envelope structure and passive permeability In The nucleus: Volume 2: Chromatin, transcription, envelope, proteins, dynamics, and imaging, Hancock R, Ed. Humana Press: 2008. pp 161–180. [Google Scholar]
- (14).Mazzanti M; Bustamante JO; Oberleithner H Electrical dimension of the nuclear envelope. Physiol. Rev. 2001, 81, 1–19. [DOI] [PubMed] [Google Scholar]
- (15).Ananth AN; Mishra A; Frey S; Dwarkasing A; Versloot R; van der Giessen E; Gorlich D; Onck P; Dekker C Spatial structure of disordered proteins dictates conductance and selectivity in nuclear pore complex mimics. eLife 2018, 7, e31510. [DOI] [PMC free article] [PubMed] [Google Scholar]
- (16).Knockenhauer KE; Schwartz TU The nuclear pore complex as a flexible and dynamic gate. Cell 2016, 164, 1162–1171. [DOI] [PMC free article] [PubMed] [Google Scholar]
- (17).Frey S; Richter RP; Gorlich D FG-rich repeats of nuclear pore proteins form a three-dimensional meshwork with hydrogel-like properties. Science 2006, 314, 815–817. [DOI] [PubMed] [Google Scholar]
- (18).Bird SP; Baker LA An abiotic analogue of the nuclear pore complex hydrogel. Biomacromolecules 2011, 12, 3119–3123. [DOI] [PubMed] [Google Scholar]
- (19).Kim SJ; Fernandez-Martinez J; Nudelman I; Shi Y; Zhang WZ; Raveh B; Herricks T; Slaughter BD; Hogan JA; Upla P; Chemmama IE; Pellarin R; Echeverria I; Shivaraju M; Chaudhury AS; Wang JJ; Williams R; Unruh JR; Greenberg CH; Jacobs EY; Yu ZH; de la Cruz MJ; Mironska R; Stokes DL; Aitchison JD; Jarrold MF; Gerton JL; Ludtke SJ; Akey CW; Chait BT; Sali A; Rout MP Integrative structure and functional anatomy of a nuclear pore complex. Nature 2018, 555, 475–482. [DOI] [PMC free article] [PubMed] [Google Scholar]
- (20).Amemiya S; Bard AJ; Fan F-RF; Mirkin MV; Unwin PR Scanning electrochemical microscopy. Annu. Rev. Anal. Chem. 2008, 1, 95–131. [DOI] [PubMed] [Google Scholar]
- (21).Amemiya S Scanning electrochemical microscopy of nanopores, nanocarbons, and nanoparticles In Nanoelectrochemistry, Mirkin MV; Amemiya S, Eds. Taylor and Francis: Boca Raton, FL, 2015; pp 621–653. [Google Scholar]
- (22).Kim J; Izadyar A; Nioradze N; Amemiya S Nanoscale mechanism of molecular transport through the nuclear pore complex as studied by scanning electrochemical microscopy. J. Am. Chem. Soc. 2013, 135, 2321–2329. [DOI] [PMC free article] [PubMed] [Google Scholar]
- (23).Kim J; Izadyar A; Shen M; Ishimatsu R; Amemiya S Ion permeability of the nuclear pore complex and ion-induced macromolecular permeation as studied by scanning electrochemical and fluorescence microsocpy. Anal. Chem. 2014, 86, 2090–2098. [DOI] [PMC free article] [PubMed] [Google Scholar]
- (24).Guo J; Amemiya S Permeability of the nuclear envelope at isolated xenopus oocyte nuclei studied by scanning electrochemical microscopy. Anal. Chem. 2005, 77, 2147–2156. [DOI] [PubMed] [Google Scholar]
- (25).Makhnovskii YA; Berezhkovskii AM; Zitserman VY Homogenization of boundary conditions on surfaces randomly covered by patches of different sizes and shapes. J. Chem. Phys. 2005, 122, 236102. [DOI] [PubMed] [Google Scholar]
- (26).Kim E; Xiong H; Striemer CC; Fang DZ; Fauchet PM; McGrath JL; Amemiya S A structure-permeability relationship of ultrathin nanoporous silicon membrane: A comparison with the nuclear envelope. J. Am. Chem. Soc. 2008, 130, 4230–4231. [DOI] [PMC free article] [PubMed] [Google Scholar]
- (27).Ishimatsu R; Kim J; Jing P; Striemer CC; Fang DZ; Fauchet PM; McGrath JL; Amemiya S Ion-selective permeability of a ultrathn nanopore silicon membrane as probed by scanning electrochemical microscopy using micropipet-supported ITIES tips. Anal. Chem. 2010, 82, 7127–7134. [DOI] [PMC free article] [PubMed] [Google Scholar]
- (28).Eibauer M; Pellanda M; Turgay Y; Dubrovsky A; Wild A; Medalia O Structure and gating of the nuclear pore complex. Nat. Commun. 2015, 6, 7532. [DOI] [PMC free article] [PubMed] [Google Scholar]
- (29).Jaggi RD; Franco-Obregon A; Muhlhausser P; Thomas F; Kutay U; Ensslin K Modulation of nuclear pore topology by transport modifiers. Biophys. J. 2003, 84, 665–670. [DOI] [PMC free article] [PubMed] [Google Scholar]
- (30).Paulillo SM; Powers MA; Ullman KS; Fahrenkrog B Changes in nucleoporin domain topology in response to chemical effectors. J. Mol. Biol. 2006, 363, 39–50. [DOI] [PubMed] [Google Scholar]
- (31).Liashkovich I; Meyring A; Oberleithner H; Shahin V Structural organization of the nuclear pore permeability barrier. J. Controlled Release 2012, 160, 601–608. [DOI] [PubMed] [Google Scholar]
- (32).Andersen H; Parhamifar L; Hunter AC; Shahin V; Moghimi SM AFM visualization of sub-50 nm polyplex disposition to the nuclear pore complex without compromising the integrity of the nuclear envelope. J. Controlled Release 2016, 244, 24–29. [DOI] [PubMed] [Google Scholar]
- (33).Sakiyama Y; Mazur A; Kapinos LE; Lim RYH Spatiotemporal dynamics of the nuclear pore complex transport barrier resolved by high-speed atomic force microscopy. Nat. Nanotechnol. 2016, 11, 719. [DOI] [PubMed] [Google Scholar]
- (34).Kaur G; Ly-Huynh JD; Jans DA Intracellular calcium levels can regulate importin-dependent nuclear import. Biochem. Biophys. Res. Commun. 2014, 450, 812–817. [DOI] [PubMed] [Google Scholar]
- (35).Bootman MD; Fearnley C; Smyrnias I; MacDonald F; Roderick HL An update on nuclear calcium signalling. J. Cell Sci. 2009, 122, 2337–2350. [DOI] [PubMed] [Google Scholar]
- (36).Bading H Nuclear calcium signalling in the regulation of brain function. Nat. Rev. Neurosci. 2013, 14, 593–608. [DOI] [PubMed] [Google Scholar]
- (37).Liu XS; Liu XJ Oocyte isolation and enucleation In Xenopus protocols: Cell biology and signal transduction (methods in molecular biology), Liu XJ, Ed. Humana Press: Totowa, NJ, 2005; Vol. 322, pp 31–42. [DOI] [PubMed] [Google Scholar]
- (38).Kim J; Renault C; Nioradze N; Arroyo-Currás N; Leonard KC; Bard AJ Nanometer scale scanning electrochemical microscopy instrumentation. Anal. Chem. 2016, 88, 10284–10289. [DOI] [PubMed] [Google Scholar]
- (39).Barforoush JM; McDonald TD; Desai TA; Widrig D; Bayer C; Brown MK; Cummings LC; Leonard KC Intelligent scanning electrochemical microscopy tip and substrate control utilizing fuzzy logic. Electrochim. Acta 2016, 190, 713–719. [Google Scholar]
- (40).Nioradze N; Kim J; Amemiya S Quasi-steady-state voltammetry of rapid electron transfer reactions at the macroscopic substrate of the scanning electrochemical microscope. Anal. Chem. 2011, 83, 828–835. [DOI] [PMC free article] [PubMed] [Google Scholar]
- (41).Nioradze N; Chen R; Kim J; Shen M; Santhosh P; Amemiya S Origins of nanoscale damage to glass-sealed platinum electrodes with submicrometer and nanometer size. Anal. Chem. 2013, 85, 6198–6202. [DOI] [PMC free article] [PubMed] [Google Scholar]
- (42).Chen R; Hu K; Yu Y; Mirkin MV; Amemiya S Focused-ion-beam-milled carbon nanoelectrodes for scanning electrochemical microscopy. J. Electrochem. Soc. 2016, 163, H3032–H3037. [DOI] [PMC free article] [PubMed] [Google Scholar]
- (43).Kim J; Kim B-K; Cho SK; Bard AJ Tunneling ultramicroelectrode: Nanoelectrodes and nanoparticle collisions. J. Am. Chem. Soc. 2014, 136, 8173–8176. [DOI] [PubMed] [Google Scholar]
- (44).Kim J; Renault C; Nioradze N; Arroyo-Currás N; Leonard KC; Bard AJ Electrocatalytic activity of individual pt nanoparticles studied by nanoscale scanning electrochemical microscopy. J. Am. Chem. Soc. 2016, 138, 8560–8568. [DOI] [PubMed] [Google Scholar]
- (45).Chen R; Balla RJ; Li ZT; Liu HT; Amemiya S Origin of asymmetry of paired nanogap voltammograms based on scanning electrochemical microscopy: Contamination not adsorption. Anal. Chem. 2016, 88, 8323–8331. [DOI] [PubMed] [Google Scholar]
- (46).Kim J; Shen M; Nioradze N; Amemiya S Stabilizing nanometer scale tip-to-substrate gaps in scanning electrochemical microscopy using an isothermal chamber for thermal drift suppression. Anal. Chem. 2012, 84, 3489–3492. [DOI] [PMC free article] [PubMed] [Google Scholar]
- (47).Peters R Optical single transporter recording: Transport kinetics in microarrays of membrane patches. Annu. Rev. Biophys. Biomol. Struct. 2003, 32, 47–67. [DOI] [PubMed] [Google Scholar]
- (48).Rangl M; Nevo R; Liashkovich I; Shahin V; Reich Z; Ebner A; Hinterdorfer P Stable, non-destructive immobilization of native nuclear membranes to micro-structured pdms for single-molecule force spectroscopy. ChemPhysChem 2009, 10, 1553–1558. [DOI] [PMC free article] [PubMed] [Google Scholar]
- (49).Lefrou C A unified new analytical approximation for positive feedback currents with a microdisk secm tip. J. Electroanal. Chem. 2006, 592, 103–112. [Google Scholar]
- (50).Yao L; Filice FP; Yang Q; Ding Z; Su B Quantitative assessment of molecular transport through sub-3 nm silica nanochannels by scanning electrochemical microscopy. Anal. Chem. 2019, 91, 1548–1556. [DOI] [PubMed] [Google Scholar]
- (51).Mohr D; Frey S; Fischer T; Guttler T; Gorlich D Characterisation of the passive permeability barrier of nuclear pore complexes. Embo J. 2009, 28, 2541–2553. [DOI] [PMC free article] [PubMed] [Google Scholar]
- (52).Williams ME; Benkstein KD; Abel C; Dinolfo PH; Hupp JT Shape-selective transport through rectangle-based molecular materials: Thin-film scanning electrochemical microscopy studies. Proc. Natl. Acad. Sci. U. S. A. 2002, 99, 5171–5177. [DOI] [PMC free article] [PubMed] [Google Scholar]
- (53).Stoffler D; Goldie KN; Feja B; Aebi U Calcium-mediated structural changes of native nuclear pore complexes monitored by time-lapse atomic force microscopy. J. Mol. Biol. 1999, 287, 741–752. [DOI] [PubMed] [Google Scholar]
- (54).Bestembayeva A; Kramer A; Labokha AA; Osmanović D; Liashkovich I; Orlova EV; Ford IJ; Charras G; Fassati A; Hoogenboom BW Nanoscale stiffness topography reveals structure and mechanics of the transport barrier in intact nuclear pore complexes. Nat. Nanotechnol. 2014, 10, 60–64. [DOI] [PMC free article] [PubMed] [Google Scholar]
- (55).Amemiya S Nanoscale scanning electrochemical microscopy In Electroanalytical chemistry, Bard AJ; Zoski CG, Eds. CRC Press: 2015; pp 1–72. [Google Scholar]
- (56).Kai T; Zoski CG; Bard AJ Scanning electrochemical microscopy at the nanometer level. Chem. Commun. 2018, 54, 1934–1947. [DOI] [PubMed] [Google Scholar]
- (57).Shen M; Ishimatsu R; Kim J; Amemiya S Quantitative imaging of ion transport through single nanopores by high-resolution scanning electrochemical microscopy. J. Am. Chem. Soc. 2012, 134, 9856–9859. [DOI] [PMC free article] [PubMed] [Google Scholar]
- (58).Chen R; Balla RJ; Lima A; Amemiya S Characterization of nanopipet-supported ities tips for scanning electrochemical microscopy of single solid-state nanopores. Anal. Chem. 2017, 89, 9946–9952. [DOI] [PMC free article] [PubMed] [Google Scholar]
- (59).Lee S; Zhang Y; White HS; Harrell CC; Martin CR Electrophoretic capture and detection of nanoparticles at the opening of a membrane pore using scanning electrochemical microscopy. Anal. Chem. 2004, 76, 6108–6115. [DOI] [PubMed] [Google Scholar]
- (60).White RJ; White HS Influence of electrophoresis waveforms in determining stochastic nanoparticle capture rates and detection sensitivity. Anal. Chem. 2007, 79, 6334–6340. [DOI] [PubMed] [Google Scholar]
- (61).Musser SM; Grunwald D Deciphering the structure and function of nuclear pores using single-molecule fluorescence approaches. J. Mol. Biol. 2016, 428, 2091–2119. [DOI] [PMC free article] [PubMed] [Google Scholar]
Associated Data
This section collects any data citations, data availability statements, or supplementary materials included in this article.