

Abstract
Aims:
To determine whether transdiagnostic risk, represented as elevations in one high-risk personality trait, interacts with behavior-specific risk, represented as elevated expectancies for reinforcement from either drinking or smoking, to account partly for early adolescent drinking and smoking behavior.
Design:
Multiple regression analysis.
Setting:
Twenty-three public schools in two school systems in the USA.
Participants:
A sample of 1,897 adolescents tested in the spring of 5th, 6th, 7th, 8th, and 9th grades.
Measurements:
Transdiagnostic risk was measured as negative urgency, the tendency to act rashly when distressed, using the UPPS-P Child Version. Drinking-specific and smoking-specific risk were measured as expectancies for reinforcement from drinking and smoking, using the Memory Model-Based Expectancy Questionnaire (alcohol) and the Adolescent Smoking Consequences Questionnaire (smoking).
Findings:
There was consistent concurrent prediction from the interactions of (a) negative urgency and alcohol reinforcement expectancies to early adolescent drinking and (b) negative urgency and smoking reinforcement expectancies to early adolescent smoking, above and beyond prediction from the main effects of those variables. In each case, expectancies were more predictive at higher levels of negative urgency. Incremental R2 values for main effects ranged from .07 to .26, and for interactions ranged from .01 to .03. Prospectively, the main effects predicted subsequent behavior but the interaction effects did not, except in one case.
Conclusions:
Among elementary and high school students in the USA, the joint effects of negative urgency and behavior-specific expectancies help to explain drinking and smoking behavior. Joint elevations on the trait and the learning variable account for drinking and smoking behavior beyond the main effects of each predictor. However, there is reason to doubt whether the joint effects predict subsequent increases in drinking and smoking beyond the main effects of those variables.
Keywords: urgency, expectancies, smoking, drinking, adolescence
Risk for early onset drinking and tobacco smoking appears to be conferred by both transdiagnostic and behavior-specific risk factors [1–2]. It is thus important to understand whether and how the two types of risk factors transact to increase risk. We offer one such integration based on (a) the transdiagnostic risk factor of negative urgency, a personality trait reflecting the tendency to act rashly when distressed [3–4], and (b) psychosocial learning in the form of expectancies for reinforcement from drinking and from smoking. The model tested here holds that the two types of factors interact to increase risk. Thus, persons high in negative urgency who also have learned to expect drinking to provide reinforcement are at increased risk for problem drinking, and those high in negative urgency who have learned to expect smoking to provide reinforcement are at increased risk to smoke.
The Problems of Adolescent Drinking and Tobacco Smoking
Across early adolescence, alcohol consumption increases dramatically, from rate estimates of 7–10% in late elementary school [5–7] to 40–50% by the end of the first year of high school [5]. Youth engagement in drinking during these years is of considerable clinical importance. At age 12, reports of having consumed alcohol just one day (or more) during the preceding year have sensitivity of 1.0 and specificity of .94 (boys) and .95 (girls) in the concurrent prediction of any DSM IV alcohol use disorder symptom over that year [5]. At age 15, having consumed alcohol three days or more during the preceding year has sensitivity of 1.0 and specificity of .80 (boys) and .77 (girls) for the same prediction. An NIAAA panel compared measures of drinking behavior and found that a single item measure of drinking frequency covaried with symptoms more strongly than other measures [5].
Alcohol consumption during these years is both a marker of current dysfunction and an indicator of risk for future dysfunction. It concurrently relates to several other problem behaviors, including early onset marijuana use, early sexual intercourse, and low value on academic achievement [8]. Prospectively, early consumption predicts diagnostic status and alcohol problems in later adolescence and adulthood [9–11].
The rates of tobacco smoking also increase during these years [12]. Early tobacco use is clinically important because it means longer exposure to the health damaging effects of nicotine [13], and it predicts (a) an increase in the quantity of cigarettes smoked per day during adolescence [14], (b) increased likelihood of tobacco addiction during adolescence and adulthood [15], and, (c) for girls, stunted physical growth [16]. We chose to examine both drinking and smoking behavior for these reasons, as well as their relative prevalence in early adolescence when compared to other substances.
Personality and Learning Risk for Drinking and Smoking
Negative urgency has emerged as an important predictor of multiple forms of addictive behavior. Multiple meta-analyses document the high association between negative urgency and addictive behavior, even in relation to other impulsigenic traits [17–20]. Prospectively, negative urgency predicts both the onset of alcohol consumption and tobacco smoking among adolescents [21–23] and heavy drinking and smoking among emerging adults [24,25]. It is thought to operate through negative reinforcement: Those elevated in the trait act in rash or impulsive ways to reduce or distract from distress [26]. Negative urgency confers transdiagnostic risk because, in addition to drinking and smoking, it predicts the onset of, or increases in, binge eating, purging, and non-suicidal self-injury; each of these behaviors is thought to provide negative reinforcement in the form of relief from distress [26].
Negative urgency is a broad trait reflecting the tendency to act rashly when distressed; nothing about elevations in the trait necessarily result specifically in drinking or smoking. The core hypothesis of this paper is that negative urgency relates most strongly to those specific behaviors among people who have learned to expect reinforcement from the behaviors.
One way to measure expected reinforcement is to assess alcohol-related and smoking-related expectancies. Expectancies are thought to represent summaries of one’s learning history about the outcomes of one’s behavioral choices [27,28]. There are different expectancy models. In the one we employ, reports of explicit expectancies are understood to provide markers of memory-based associative learning [29,30]. High scores on a scale reflecting the expectancy that alcohol facilitates positive social interactions are thought to reflect a strong learned association between drinking and positive social experiences. Alternative expectancy models emphasize planned or deliberative behavior [31]: one may choose to drink because one has the belief that drinking facilitates social experiences. Our model assigns less weight to deliberative action and more to learned associations between a behavior and a reward. The association influences the behavior [27,28], and one may or may not experience oneself as choosing the behavior explicitly to obtain the expected outcome. Considerable support for this model, and for the explicit measurement of alcohol expectancies as markers of learned associations, has accrued over several decades [27,28,29,32].
Measures of expectancies for reinforcement from drinking predict subsequent drinking onset and problem drinking among youth and emerging adults [33,22,25,34]. Experimental manipulation of expectancies reduces drinking behavior, at least in the short-term [35,36]. With respect to smoking, reinforcement expectancies also predict the onset of smoking in youth [37] and smoking among emerging adults [24]. Among alcohol and smoking-related expectancies, we chose to study expectancies that drinking or smoking enhance social experience. We did so for two reasons. Developmentally, social experiences are of central importance to early adolescents. Empirically, these two expectancies consistently predict adolescent drinking and smoking behavior [37,34].
We tested whether expectancies for reinforcement from drinking (or smoking) relate more strongly to early adolescent drinking (or smoking) at higher levels of negative urgency. That is, the joint effect of elevation in the broad, transdiagnostic risk factor of negative urgency and elevation in behavior-specific expectancies adds to prediction of early adolescent drinking (or smoking) beyond either risk factor alone. In light of mounting evidence that many behaviors, including early onset drinking and smoking, appear to be potentiated by both transdiagnostic and behavior-specific risk factors, an important question is whether the two types of risk factors interact, or just operate additively. Other work has examined interactions between traits (e.g. extraversion) and expectancies to predict drinking and smoking [38]. However, none examined joint effects of negative urgency and expectancies in adolescents.
We note that this interaction model is different from another, well-established risk model specifying a different form of transaction between personality factors, such as negative urgency, and psychosocial learning. The Acquired Preparedness model of risk holds that high-risk personality traits bias individuals to form high-risk expectancies. In this way, expectancies for reinforcement from drinking or smoking mediate the predictive influence of personality traits, such as negative urgency, on subsequent drinking or smoking [2]. This model has received empirical support through multiple longitudinal studies [39,24,22,25,40]. The two types of personality-learning transactions are not mutually exclusive: traits and learning can interact along with a process in which trait elevations shape learning.
The Current Study
We sought to test whether negative urgency x expectancy interactions related to early onset drinking and smoking behavior. We studied a longitudinal sample of 1,897 youth on five occasions: the spring of grades 5, 6, 7, 8, and 9. We tested two main hypotheses at each wave. First, above and beyond main effects, does the interaction of negative urgency and the expectancy for social reinforcement from drinking predict drinking behavior? Second, above and beyond main effects, does the interaction of negative urgency and the expectancy for social reinforcement from smoking predict smoking behavior? Specifically, we anticipated that the association of negative urgency with each behavior would be stronger among those who expect reinforcement from that behavior. We hypothesized that these effects would be present cross-sectionally at each wave. We also tested the effects prospectively: do the interactions predict drinking or smoking behavior 12 months later? We did not form confident hypotheses about prospective interactive effects. On one hand, because negative urgency and the behavior-specific expectancies both predict the subsequent onset of drinking or smoking, it seemed likely that their interaction would as well. On the other hand, there may be little incremental prospective prediction of interactions beyond prediction by main effects.
Method
Sample
Participants were 1897 youth in 5th grade at wave 1; they were drawn from urban, rural, and suburban backgrounds and represented 23 public schools in two school systems. The sample was equally divided between girls (49.9%) and boys. At wave 1, most participants were 11 years old (66.8%), 22.8 % were 10 years old; 10 % were 12 years old; and .2 % were either 9 or 13 years old. The ethnic breakdown of the sample was as follows: 60.9%, European American, 18.7% African American, 8.2 % Hispanic, 3% Asian American, and 8.8% other racial/ethnic groups.
Measures
Demographic and background questionnaire.
Participants were asked to circle their gender, write in their current age (in years), and indicate which label(s) best described their ethnic background.
The UPPS-P Child Version
[41] was used to measure negative urgency. Item responses are on a four-point Likert-type scale, ranging from “not at all like me” to “very much like me.” An example item is “When I am upset I often act without thinking.” Scale scores were calculated as the mean item response across the eight items. At wave 1, negative urgency was highly internally consistent (α = .89), and internal consistency estimates were slightly higher at subsequent waves.
The Memory Model-Based Expectancy Questionnaire
(MMBEQ: [42]) provides an assessment of alcohol expectancies in children. We chose to study the expectancy that alcohol facilitates positive, social experience. The 18 items begin with the stem, “Drinking alcohol makes people ____.” Children then read items that complete the stem (e.g., “friendly,” “fun”) and then circle one of four responses: “never,” “sometimes,” “usually,” or “always.” Items are scored on a Likert-type scale. The scale is highly correlated with drinking levels [42–45]. The scale was estimated to be internally consistent (wave 1 α = .84), with slightly higher estimates at subsequent waves.
The Adolescent Smoking Consequences Questionnaire
(ASCQ: [46]) measures the expectancy for social facilitation from smoking (eight items, five point Likert scale). Internal consistency at wave 1 was good (α = .79) and slightly higher at subsequent waves. It has proven predictive of smoking behavior in past research [37]. A sample item is “Smoking makes a person feel more uncomfortable around others.”
The Drinking Styles Questionnaire
(DSQ: [47]) was used to measure self-reported drinking frequency because it is the best marker of concurrent alcohol-related problems, as noted above [5]. Drinking behavior was measured dichotomously as present or absent at waves 1 and 2 because base rates of drinking were low. For waves 3–5, drinking frequency was measured using a single item asking how often one drinks alcohol. A drink was defined as: “… more than just a sip or a taste. (A sip or a taste is just a small amount or part of someone else’s drink or only a swallow or two. A drink would be more than that.)” Response choices are: “I have never had a drink of alcohol,” “I have only had 1, 2, 3, or 4 drinks of alcohol in my life,” “I only drink alcohol 3 or 4 times a year,” “I drink alcohol about once a month,” “I drink alcohol once or twice a week,” and “I drink alcohol almost daily.” This single item assessment has proven stable over time and there is good evidence for its construct validity [37,7,22,43].
Smoking Behavior.
We measured smoking frequency with a single item: Which of these best describes how often you smoke cigarettes: (Choose only one, based on the past six months). At waves 1 and 2, smoking was measured dichotomously as present or absent, due to low base rates. At waves 3–5, item response choices were analogous to those for drinking, ranging from “I have never smoked” to “I smoke almost daily or every day.” Good evidence for the construct validity of this assessment method has been reported [21].
Procedure
Data were drawn from a larger longitudinal study that involves assessment of children every six months from the spring of 5th grade (elementary school) through the spring of 8th grade, then again in the spring of 9th grade (the first year of high school). We report on interaction tests conducted annually for five total assessments from spring of 5th through spring of 9th grade. The questionnaires were administered in 23 public elementary schools at wave 1, 15 middle schools at waves 2–4, and 7 high schools at wave 5. A passive-consent procedure was used. Each family was sent a letter, through the U.S. Mail, introducing the study. Families were asked to return an enclosed, stamped letter or call a phone number if they did not want their child to participate. Out of 1,988 5th graders in participating schools, 1,897 participated in the study (95.4%). Reasons for non-participation included declination of consent from parents, declination of assent from children, and language or cognitive difficulties.
Questionnaires were administered by study staff in the children’s classrooms or in a central location, such as the school cafeteria, during school hours. It was made clear to the students that their responses were to be kept confidential and no one outside of the research team would see them. The research team introduced the federal certificate of confidentiality for the project and emphasized that they were legally bound to keep all responses confidential. After each participant signed the assent form, the researchers passed out the questionnaires. The questionnaires took 60 minutes or less to complete; participants were not compensated. This procedure was approved by the University’s IRB and by the participating school systems. Children who left the school system were asked to continue to participate. Those who consented did so either by completing hard copies of questionnaires delivered through the mail or by completing the measures on a secure web site. They were paid $30 for doing so.
Data Analysis
We first evaluated retention rates and investigated missingness, as described below. We then calculated descriptive statistics and correlated key study variables. For drinking and smoking behaviors waves 3–5 (when not measured dichotomously), we examined skew and conducted all analyses on both original data and following square root transformations. Results did not differ between the two methods, so we report results from original, non-transformed scores.
In order to determine whether there was significant covariance among the study variables due to participants attending the same school, we calculated intraclass coefficients for each variable (using elementary school membership, n = 23, as the nesting variable). Intraclass coefficients were all .00. We therefore concluded that school membership was unrelated to study variables. School membership was not modeled further.
Analyses were conducted using least squares multiple regression. To test the interaction hypotheses, at each wave we first centered negative urgency, drinking expectancy, and smoking expectancy. We then calculated the product terms of negative urgency x drinking expectancy and negative urgency x smoking expectancy to represent interaction effects. At each wave, we conducted multiple regression analyses as follows: step 1: gender; step 2: main effects for negative urgency and the relevant expectancy (e.g., drinking expectancy to predict drinking behavior); step 3: the interaction between negative urgency and the relevant expectancy.
We conducted four sets of follow-up analyses. First, we conducted each test separately for boys and girls. Second, we tested whether a given interaction effect (e.g., negative urgency x drinking expectancy) remained concurrently predictive when the expectancy and interaction for the other behavior was included in the model. For example, does negative urgency x drinking expectancy account for significant variance in drinking, beyond prediction by smoking expectancy and the negative urgency x smoking expectancy interaction? Because drinking and smoking can co-occur, it was important to show that, for example, the negative urgency x drinking expectancy interaction did concurrently predict drinking, above and beyond the effects of smoking risk factors. Third, we tested whether the interaction effects predicted longitudinally. Specifically, we tested whether the interaction at one wave predicted the relevant behavior at the following wave, 12 months later.
Fourth, we included race as a covariate in two ways: we compared European American youth (n=1091) to both African American (n=416) and Hispanic American (n=146) youth. As described below, because analyses including race resulted in no change in main effects or interactions, and involved use of a subset of participants, we report those results separately. We used α=.01 as our threshold. Pre-registration is available at https://osf.io/4n9xu/ [48].
Results
Participant Retention
Table S1 of the on-line supplement presents retention data for each wave of the larger longitudinal study. As the table shows, in the larger study, retention at each wave ranged between 92.4% and 98.3% of prior wave participants. Youth who participated in the five waves of the current study did not differ from those who participated in only one or two waves on any demographic, criterion, or trait variable. Therefore, we inferred that data were missing at random. Missing data were imputed using the expectation maximization (EM) procedure, which has been shown to produce more accurate estimates of population parameters than do other methods, such as deletion of missing cases or mean substitution [49].
Descriptive Statistics
Table 1 provides descriptive statistics for key study variables at each wave. For waves 1 and 2, drinking and smoking behavior results are presented dichotomously. For waves 3–5, frequency of endorsement of each behavior is presented. Drinking and smoking frequencies from waves 3–5 were positively skewed (skew values ranged from 1.83/2.51 for drinking/smoking wave 5 to 3.35/3.96 for drinking/smoking wave 3). We conducted square root transformations of these variables, which reduced skew to well below 2.0 in each case. Analyses did not produce different results for the transformed or original variables, so we present results based on original variables.
Table 1.
Descriptive statistics of key variables measured at all waves, all participants (N = 1897)
| W1 | W2 | W3 | W4 | W5 | |
|---|---|---|---|---|---|
| Mean (SD) | |||||
| Negative Urgency | 2.21 (.70) | 2.15 (.72) | 2.18 (.72) | 2.21 (.69) | 2.25 (.66) |
| Drinking Expectancy | 1.52 (.37) | 1.66 (.42) | 1.73 (.45) | 1.84 (.50) | 1.89 (.48) |
| Smoking Expectancy | 1.49 (.58) | 1.50 (.69) | 1.61 (.78) | 1.70 (.78) | 1.81 (.81) |
| Frequencies | |||||
| Drinking = 0 | 87.9% | 85.6% | 78.3% | 68.5% | 53.3% |
| Drinking = 1 | 12.1% | 14.4% | 16.2% | 21.7% | 30.4% |
| Drinking = 2 | - | - | 3.3% | 5.6% | 8.8% |
| Drinking = 3 | - | - | 0.9% | 2.1% | 4.1% |
| Drinking = 4 | - | - | 0.6% | 0.9% | 2.0% |
| Drinking = 5 | - | - | 0.6% | 1.2% | 1.5% |
| Smoking = 0 | 94.6% | 91.8% | 85.2% | 78.8% | 70.3% |
| Smoking = 1 | 5.4% | 8.2% | 9.7% | 13.9% | 18.5% |
| Smoking = 2 | - | - | 1.4% | 2.2% | 3.7% |
| Smoking = 3 | - | - | 1.2% | 1.6% | 2.0% |
| Smoking = 4 | - | - | 0.9% | 1.3% | 1.8% |
| Smoking = 5 | - | - | 1.6% | 2.3% | 3.7% |
Note. For W1 and W2, frequencies reported for drinking and smoking are shown dichotomously, with 0 indicating absence of the behavior and 1 indicating presence of the behavior. For W3-W5, levels of drinking and smoking behavior engagement are represented by percentages of individuals who engaged in drinking behavior or smoking behavior at different levels of the count variable. Drinking frequencies; 0 = I have never had a drink of alcohol, 1 = I have only had 1,2,3, or 4 drinks of alcohol in my life, 2= I only drink alcohol 3 or 4 times a year, 3 = I drink alcohol about once a month, 4 = I drink alcohol once or twice a week, 5 = I drink alcohol almost daily. Smoking frequencies; 0 = I have never smoked, 1 = I have smoked cigarettes 1,2,3, or 4 times in my life, 2 = I smoke cigarettes 3 or 4 times a year, 3 = I smoke about once a month, 4 = I smoke about once or twice a week, 5 = I smoke almost daily or every day. Pubertal status is represented by percentage of participants considered pubertal.
Table 2 presents correlations among key study variables for the five waves. All variables were correlated significantly within and across waves.
Table 2.
Correlations between negative urgency, drinking expectancies, and smoking expectancies, all waves, all participants (N=1897)
| 1 | 2 | 3 | 4 | 5 | 6 | 7 | 8 | 9 | 10 | 11 | 12 | 13 | 14 | 15 | |
|---|---|---|---|---|---|---|---|---|---|---|---|---|---|---|---|
| 1. NU W1 | - | ||||||||||||||
| 2. DE W1 | .22** | - | |||||||||||||
| 3. SE W1 | .22** | .38** | - | ||||||||||||
| 4. NU W2 | .50** | .16** | .19** | - | |||||||||||
| 5. DE W2 | .18** | .36** | .17** | .27** | - | ||||||||||
| 6. SE W2 | .20** | .23** | .34** | .32** | .42** | - | |||||||||
| 7. NU W3 | .41** | .14** | .14** | .59** | .23** | .27** | - | ||||||||
| 8. DE W3 | .17** | .36** | .19** | .24** | .48** | .29** | .31** | - | |||||||
| 9. SE W3 | .21** | .22** | .24** | .26** | .25** | .40** | .32** | .44** | - | ||||||
| 10. NU W4 | .35** | .13** | .13** | .46** | .17** | .21** | .61** | .21** | .26** | - | |||||
| 11. DE W4 | .19** | .23** | .12** | .21** | .37** | .28** | .26** | .45** | .33** | .32** | - | ||||
| 12. SE W4 | .22** | .16** | .18** | .27** | .26** | .31** | .30** | .28** | .44** | .35** | .51** | - | |||
| 13. NU W5 | .26** | .10** | .05* | .38** | .15** | .17* | .47** | .21** | .21** | .53** | .23** | .28** | - | ||
| 14. DE W5 | .17** | .24** | .09** | .21** | .31** | .22** | .23** | .45** | .31** | .29** | .43** | .29** | .35** | - | |
| 15. SE W5 | .19** | .20** | .16** | .23** | .19** | .27** | .26** | .26** | .38** | .27** | .28** | .40** | .31** | .43** | - |
Note. NU = Negative urgency; DE = Drinking expectancies; SE = Smoking Expectancies.
= p< .05
= p <.01
Hypothesis Tests
Table 3 presents the results of multiple regressions at each wave, concurrently predicting drinking behavior from negative urgency, expectancy for social facilitation from drinking, and the interaction of the two. For four of the five waves, the interaction predicted drinking beyond the main effects of the trait and expectancy. At wave 1, where drinking rates were lowest and drinking was measured dichotomously, the interaction did not reach significance. Figure 1 depicts each interaction. At each wave the impact of negative urgency on drinking behavior was greater at higher levels of social facilitation from drinking expectancy. The interaction effects appear modest in magnitude at waves 1 and 2, when the base rates of drinking are low and drinking is measured dichotomously. For waves 3–5, at high levels of drinking expectancy, negative urgency shared between 16% and 21% variance with drinking frequency, whereas at low levels of drinking expectancy, negative urgency shared between 4% and less than 1% variance with drinking frequency.
Table 3.
Regression analyses predicting drinking behavior at each wave
| Wave 1 | ||||||
| B | SE | β | t | p | ᴧR2 | |
| Gender | .03 | .02 | .04 | 1.97 | .049 | .00 |
| Negative Urgency (NU) | .09 | .01 | .20 | 8.65 | <.001 | .07** |
| Drinking Expectancy (DE) | .10 | .02 | .12 | 5.02 | <.001 | |
| NU x DE | .05 | .03 | .04 | 1.79 | .074 | .006 |
| Wave 2 | ||||||
| B | SE | β | t | p | ᴧR2 | |
| Gender | .03 | .02 | .04 | 1.87 | .062 | .00 |
| Negative Urgency (NU) | .10 | .01 | .21 | 9.32 | <.001 | .11** |
| Drinking Expectancy (DE) | .16 | .02 | .19 | 8.26 | <.001 | |
| NU x DE | .10 | .03 | .09 | 4.11 | <.001 | .01** |
| Wave 3 | ||||||
| B | SE | β | t | p | ᴧR2 | |
| Gender | .00 | .03 | .00 | −.04 | .966 | .00 |
| Negative Urgency (NU) | .24 | .02 | .24 | 11.16 | <.001 | .17** |
| Drinking Expectancy (DE) | .37 | .04 | .24 | 10.67 | <.001 | |
| NU x DE | .35 | .04 | .18 | 8.57 | <.001 | .03** |
| Wave 4 | ||||||
| B | SE | β | t | p | ᴧR2 | |
| Gender | −.01 | .04 | −.01 | −.37 | .7091 | .00 |
| Negative Urgency (NU) | .24 | .03 | .19 | 8.98 | <.001 | .26** |
| Drinking Expectancy (DE) | .71 | .04 | .39 | 18.44 | <.001 | |
| NU x DE | .36 | .04 | .16 | 8.19 | <.001 | .02** |
| Wave 5 | ||||||
| B | SE | β | t | p | ᴧR2 | |
| Gender | −.06 | .04 | −.03 | −1.43 | .154 | .00 |
| Negative Urgency (NU) | .33 | .04 | .20 | 9.45 | <.001 | .21** |
| Drinking Expectancy (DE) | .71 | .05 | .32 | 14.61 | <.001 | |
| NU x DE | .28 | .05 | .11 | 5.07 | <.001 | .01** |
Note. Only the final step of the regression is reported for clarity. Negative urgency and drinking expectancy are centered.
= p < .05,
= p <.01
Figure 1. Interactions between negative urgency and drinking expectancies to predict drinking behavior.


Figure 1A. Plot of interaction between negative urgency and drinking expectancies in the prediction of drinker status. High DE refers to 1 standard deviation above the mean or higher in drinking expectancy. Mid DE refers to the mean of drinking expectancy. Low DE refers to 1 standard deviation below the mean of drinking expectancy or lower. The y axis scale reflects percentage of individuals reporting positive drinker status. Simple slopes are given for each value of the drinking expectancy. * = p < .001
Figure 1B. Plot of interaction between negative urgency and drinking expectancies in the prediction of drinker status. High DE refers to 1 standard deviation above the mean or higher in drinking expectancy. Mid DE refers to the mean of drinking expectancy. Low DE refers to 1 standard deviation below the mean of drinking expectancy or lower. The y axis scale reflects percentage of individuals reporting positive drinker status. Simple slopes are given for each value of the drinking expectancy. * = p < .001
Figure 1C. Plot of interaction between negative urgency and drinking expectancies in the prediction of drinker status. High DE refers to 1 standard deviation above the mean or higher in drinking expectancy. Mid DE refers to the mean of drinking expectancy. Low DE refers to 1 standard deviation below the mean of drinking expectancy or lower. The y axis scale refers to the score for frequency of drinking behavior. Simple slopes are given for each value of the drinking expectancy. * = p < .001
Figure 1D. Plot of interaction between negative urgency and drinking expectancies in the prediction of drinker status. High DE refers to 1 standard deviation above the mean or higher in drinking expectancy. Mid DE refers to the mean of drinking expectancy. Low DE refers to 1 standard deviation below the mean of drinking expectancy or lower. The y axis scale refers to the score for frequency of drinking behavior. Simple slopes are given for each value of the drinking expectancy. * = p < .001
Figure 1E. Plot of interaction between negative urgency and drinking expectancies in the prediction of drinker status. High DE refers to 1 standard deviation above the mean or higher in drinking expectancy. Mid DE refers to the mean of drinking expectancy. Low DE refers to 1 standard deviation below the mean of drinking expectancy or lower. The y axis scale refers to the score for frequency of drinking behavior. Simple slopes are given for each value of the drinking expectancy. * = p < .001
Table 4 presents analogous results for the concurrent prediction of smoking behavior. In all five waves, the interaction predicted smoking beyond prediction from the main effects. Figure 2 depicts each of the five interactions. The impact of negative urgency on smoking behavior was greater at higher levels of social facilitation from smoking. Analogous to drinking, the interactions at waves 1 and 2 were modest. At waves 3–5, at high levels of smoking expectancy, negative urgency shared between 15% and 26% variance with smoking frequency. At low levels of smoking frequency, shared variance was less than 1% at each wave.
Table 4.
Regression analyses predicting smoking behavior at each wave
| Wave 1 | ||||||
| B | SE | β | t | p | ᴧR2 | |
| Gender | .00 | .01 | .01 | .39 | .701 | .00 |
| Negative Urgency (NU) | .06 | .01 | .19 | 8.68 | <.001 | .09** |
| Smoking Expectancy (SE) | .07 | .01 | .17 | 7.25 | <.001 | |
| NU x SE | .05 | .01 | .10 | 4.31 | <.001 | .01** |
| Wave 2 | ||||||
| B | SE | β | t | p | ᴧR2 | |
| Gender | .00 | .01 | .00 | −.15 | .884 | .00 |
| Negative Urgency (NU) | .06 | .01 | .16 | 7.09 | <.001 | .10** |
| Smoking Expectancy (SE) | .08 | .01 | .20 | 7.73 | <.001 | |
| NU x SE | .04 | .01 | .09 | 3.54 | <.001 | .01** |
| Wave 3 | ||||||
| B | SE | β | t | p | ᴧR2 | |
| Gender | −.02 | .04 | −.01 | −.66 | .511 | .00 |
| Negative Urgency (NU) | .22 | .03 | .19 | 8.58 | <.001 | .16** |
| Smoking Expectancy (SE) | .26 | .03 | .24 | 9.90 | <.001 | |
| NU x SE | .21 | .03 | .16 | 7.04 | <.001 | .02** |
| Wave 4 | ||||||
| B | SE | β | t | p | ᴧR2 | |
| Gender | −.04 | .04 | −.02 | −.98 | .326 | .00 |
| Negative Urgency (NU) | .27 | .03 | .19 | 8.79 | <.001 | .18** |
| Smoking Expectancy (SE) | .33 | .03 | .26 | 11.00 | <.001 | |
| NU x SE | .23 | .03 | .16 | 7.31 | <.001 | .03** |
| Wave 5 | ||||||
| B | SE | β | t | p | ᴧR2 | |
| Gender | .04 | .05 | .02 | .74 | .462 | .00 |
| Negative Urgency (NU) | .36 | .04 | .20 | 9.36 | <.001 | .18** |
| Smoking Expectancy (SE) | .42 | .03 | .29 | 13.23 | <.001 | |
| NU x SE | .19 | .04 | .10 | 4.90 | <.001 | .01** |
Note. Only the final step of the regression is reported for clarity. Negative urgency and smoking expectancy are centered.
= p < .05,
= p <.01
Figure 2. Interactions between negative urgency and smoking expectancies to predict smoking behavior.


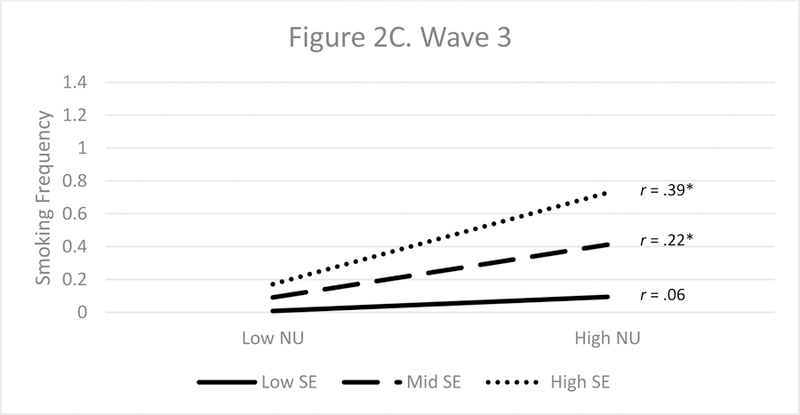


Figure 2A. Plot of interaction between negative urgency and smoking expectancies in the prediction of smoking status. High DE refers to 1 standard deviation above the mean or higher in smoking expectancy. Mid DE refers to the mean of smoking expectancy. Low DE refers to 1 standard deviation below the mean of smoking expectancy or lower. The y axis scale reflects percentage of individuals reporting positive smoker status. * = p < .001
Figure 2B. Plot of interaction between negative urgency and smoking expectancies in the prediction of smoking status. High DE refers to 1 standard deviation above the mean or higher in smoking expectancy. Mid DE refers to the mean of smoking expectancy. Low DE refers to 1 standard deviation below the mean of smoking expectancy or lower. The y axis scale reflects percentage of individuals reporting positive smoker status. * = p < .001
Figure 2C. Plot of interaction between negative urgency and smoking expectancies in the prediction of smoker status. High DE refers to 1 standard deviation above the mean or higher in smoking expectancy. Mid DE refers to the mean of smoking expectancy. Low DE refers to 1 standard deviation below the mean of smoking expectancy or lower. The y axis scale refers to the score for frequency of smoking behavior. * = p < .001
Figure 2D. Plot of interaction between negative urgency and smoking expectancies in the prediction of smoker status. High DE refers to 1 standard deviation above the mean or higher in smoking expectancy. Mid DE refers to the mean of smoking expectancy. Low DE refers to 1 standard deviation below the mean of smoking expectancy or lower. The y axis scale refers to the score for frequency of smoking behavior. * = p < .05, ** = p < .001
Figure 2E. Plot of interaction between negative urgency and smoking expectancies in the prediction of smoker status. High DE refers to 1 standard deviation above the mean or higher in smoking expectancy. Mid DE refers to the mean of smoking expectancy. Low DE refers to 1 standard deviation below the mean of smoking expectancy or lower. The y axis scale refers to the score for frequency of smoking behavior. * = p < .001
Follow-up Analyses
The pattern of effects was the same for boys and girls with respect to drinking behavior: for waves 2–5, the interaction predicted beyond the main effects of the trait and expectancy. The interaction did not predict significantly at wave 1 for either gender. The pattern was largely the same across gender for smoking behavior. For girls, the interaction predicted beyond the main effects at all five waves; for boys, it did for three of the five waves (waves 3–5). Tables S2 (drinking) and S3 (smoking) present those results in the on-line appendix.
We next tested whether a given interaction remained significant in concurrent prediction, when corrected for the other interaction. For example, did the negative urgency x drinking expectancy interaction predict drinking beyond the main effects of negative urgency, drinking expectancy, smoking expectancy, and the negative urgency x smoking expectancy interaction? In each case, the interaction continued to predict with the additional control (see Tables S4 and S5 for the drinking and smoking results, respectively).
Third, we tested whether the interaction effects prospectively predicted drinking and smoking, beyond prior rates of those behaviors, across each of four 12-month intervals. For the most part, they did not. Prospective prediction from main effects was present in each case but not from the interactions, with one exception for both drinking and smoking. For drinking, interactions between urgency and expectancies at wave 4 significantly predicted drinking behavior at wave 5. For smoking, interactions at wave 3 predicted smoking behavior at wave 4 (see Tables S6 and S7 for the drinking and smoking results, respectively).
Fourth, we examined race as an additional covariate. For drinking, at Wave 5 European Americans reported less drinking than African Americans (b=.08, p< .01). For smoking, at Waves 4 and 5 Europeans reported less smoking than African Americans (b=.09, p<.001; b=.08, p<.01, respectively). No other race effects were observed. In all analyses including race, there was no change in main or interactive effects involving negative urgency or either expectancy at any wave.
Discussion
In a sample of youth assessed five times from elementary school into high school, the joint effect of a transdiagnostic risk factor, negative urgency, and behavior-specific risk factors, alcohol or smoking reinforcement expectancies, concurrently predicted drinking or smoking behavior, beyond the main effects of each predictor. For youth at each age except grade 5, expectancies for social reinforcement from drinking or smoking related more strongly to drinking or smoking behavior at higher levels of negative urgency. For both drinking and smoking, transdiagnostic and behavior-specific risk factors interact to heighten risk.
This set of findings adds to an emerging body of evidence specifying transactions among broad and specific risk factors for addictive behaviors. In addition to the negative urgency x alcohol expectancy and negative urgency x smoking expectancy interactions documented here, there is replicated evidence that negative urgency may bias psychosocial learning, leading to increases in drinking and smoking reinforcement expectancies and thus risk for problem drinking and smoking [39,24,22,25,40]. That is, there appear to be both moderation and mediation transactional processes between transdiagnostic and behavior-specific risk factors for drinking and smoking.
It is noteworthy that these interactions were present in children as young as 6th grade (ages 11–12) and detectable even with very low base rates of the addictive behaviors. Because negative urgency and the two expectancies have all been shown to predict the subsequent onset of, and increases in, drinking or smoking, the joint effect of the two is unlikely to reflect a consequence of ongoing addictive behavior or scar effects following years of psychopathology. It is also noteworthy that the same effects appeared to operate for boys and girls.
We note two things about the current findings. First, the interactive effects were ordinal and of small magnitude; it remains important to consider the main effects of each risk factor. Nonetheless, the current findings may prove important theoretically and clinically. Theoretically, recognition of the joint operation of broad, dispositional risk processes and behavior-specific psychosocial learning may help clarify the risk process. Among youth high in the dispositional risk factor of negative urgency, those exposed to psychosocial learning indicating the reinforcing value of drinking or smoking may be especially likely to engage in these problematic behaviors at very young ages. Clinically, interventionists may need to focus on both dispositional and learning-based risk. Interventions to reduce negative urgency, emphasizing strategies to manage distress effectively, are starting to be developed [50]. There is some evidence for the efficacy of expectancy-based interventions [36], which focus on disrupting associations between drinking and social reinforcement through observational learning. A focus on dispositional risk may have transdiagnostic benefits, reducing risk for drinking, smoking, and, based on findings of other studies, binge eating and purging [51]. A companion focus on drinking-specific or smoking-specific risk may further reduce the probability of youth engaging in such behaviors.
Although each main effect was prospectively predictive, we did not find evidence for consistent prospective prediction from these interaction effects. There are at least two possible explanations for the absence of these effects. The first is that the interactions simply do not predict further engagement in addictive behaviors over time, beyond prior engagement in the behaviors and the main effects of negative urgency and expectancy. The second is that, among youth with low base rates of addictive behavior, operative prospective interaction effects could not be detected. The significant prospective prediction of drinking or smoking behavior from urgency x expectancy interactions in later waves of the study supports this explanation, since variability in the behaviors of interest was greatest at this timepoint.
The results of this study should be considered in the context of its limitations. First, although retention was good and we found no evidence of differential attrition, we cannot know if effects would have been different with complete retention. Second, all measures used were questionnaire-based. Although there is good evidence for the reliability and validity of each measure, there was no opportunity to clarify questions or responses. Third, although our focus on interaction effects is a strength, it is also a limitation: we do not know how the interaction effects relate to other risk processes beyond those studied here. Fourth, we measured gender dichotomously and cannot know whether the current findings apply to individuals with fluid or changing gender identities. Fifth, we were limited in our ability to test for cultural differences in these effects; doing so is an important avenue for future research. Sixth, cigarette smoking was the only form of tobacco use we examined, although other methods have grown in popularity among youth recently (i.e. vaping, juuling). Future work is need to examine similar effects for these methods.
With these caveats in mind, the findings of the current study suggest the value of risk models specifying interactions among broad, transdiagnostic risk factors and behavior-specific risk factors. With respect to the early onset of drinking and smoking in youth, it may be that learned expectancies for reinforcement from those behaviors are particularly potent risk factors among those high in the dispositional risk of negative urgency.
Supplementary Material
Acknowledgments
The authors gratefully acknowledge research support from the National Institute on Alcohol Abuse and Alcoholism under award number R01 AA016166 to Gregory Smith. The content is solely the responsibility of the authors and does not necessarily represent the official views of the National Institutes of Health.
References
- 1.Davis HA, Guller L, Riley EN & Smith GT A positive feedback loop of smoking risk. In: Owens CL, editor. Nicotine dependence, smoking cessation and secondhand smoke: exposure, chemical components and health consequences New York (NY): Nova Science Publishers; 2015. p. 17–32. [Google Scholar]
- 2.Davis HA, Riley EN, & Smith GT Transactions among personality and psychosocial learning risk factors for adolescent drinking: the acquired preparedness model of risk. In Monti PM, Colby SM, & O’Leary TA, editors. Adolescents, alcohol, and substance abuse: reaching teens through brief interventions 2nd ed. New York (NY): Guilford Press; in press. [Google Scholar]
- 3.Cyders MA, Smith GT Emotion-based dispositions to rash action: positive and negative urgency. Psychol Bull 2008; 134: 807–828. Available from: 10.1037/a0013341 [DOI] [PMC free article] [PubMed] [Google Scholar]
- 4.Whiteside SP, Lynam DR The five factor model and impulsivity: using a structural model of personality to understand impulsivity. Personal Individ Differ 2001; 30: 669–689. Available from: 10.1016/S0191-8869(00)00064-7 [DOI] [Google Scholar]
- 5.Chung T, Smith GT, Donovan JE, Windle M, Faden VB, Chen CM et al. Drinking frequency as a brief screen for adolescent alcohol problems. Pediatrics 2012; 1: 205–212. Available from: 10.1542/peds.2011-1828 [DOI] [PMC free article] [PubMed] [Google Scholar]
- 6.Donovan JE Really underage drinkers: the epidemiology of children’s alcohol use in the United States. Prev Sci 2007; 8: 192–205. Available from: 10.1007/s11121-007-0072-7 [DOI] [PMC free article] [PubMed] [Google Scholar]
- 7.Gunn RL, Smith GT Risk factors for elementary school drinking: pubertal status, personality, and alcohol expectancies concurrently predict fifth grade alcohol consumption. Psychol Addict Behav 2010; 24: 617–627. Available from: 10.1037/a0020334 [DOI] [PMC free article] [PubMed] [Google Scholar]
- 8.Jessor R Problem‐behavior theory, psychosocial development, and adolescent problem drinking. Br J Addic 1987; 82: 331–342. Available from: 10.1111/j.1360-0443.1987.tb01490.x [DOI] [PubMed] [Google Scholar]
- 9.DeWit DJ, Adlaf EM, Offord DR, Ogborne AC Age at first alcohol use: a risk factor for the development of alcohol disorders. Am J Psychiatry 2000; 157: 745–750. Available from: 10.1176/appi.ajp.157.5.745 [DOI] [PubMed] [Google Scholar]
- 10.Grant BF, Dawson DA Age at onset of alcohol use and its association with DSM-IV alcohol abuse and dependence: results from the National Longitudinal Alcohol Epidemiologic Survey. J Subst Abuse 1997; 9: 103–110. Available from: 10.1016/S0899-3289(97)90009-2 [DOI] [PubMed] [Google Scholar]
- 11.Guttmannova K, Hill KG, Bailey JA, Lee JO, Hartigan LA, Hawkins JD et al. Examining explanatory mechanisms of the effects of early alcohol use on young adult alcohol dependence. J Stud Alcohol Drugs 2012; 73: 379–390. Available from: 10.15288/jsad.2012.73.379 [DOI] [PMC free article] [PubMed] [Google Scholar]
- 12.Chassin L, Presson CC, Sherman SJ, Edwards DA The natural history of cigarette smoking: predicting young-adult smoking outcomes from adolescent smoking patterns. Health Psychol 1990; 9: 701–716. Available from: 10.1037/0278-6133.9.6.701 [DOI] [PubMed] [Google Scholar]
- 13.Wills TA, Sandy JM, Yaeger AM, Cleary SD, Shinar O Coping dimensions, life stress, and adolescent substance use: a latent growth analysis. J Abnorm Psychol 2001; 110: 309–323. Available from: 10.1037/0021-843X.110.2.309 [DOI] [PubMed] [Google Scholar]
- 14.Everett SA, Warren CW, Sharp D, Kann L, Husten CG, Crossett LS Initiation of cigarette smoking and subsequent smoking behavior among US high school students. Prev Med 1999; 29: 327–333. Available from: 10.1006/pmed.1999.0560 [DOI] [PubMed] [Google Scholar]
- 15.Chassin L, Presson CC, Pitts SC, Sherman SJ The natural history of cigarette smoking from adolescence to adulthood in a midwestern community sample: multiple trajectories and their psychosocial correlates. Health Psychol 2000; 19: 223–231. Available from: 10.1037/0278-6133.19.3.223 [DOI] [PubMed] [Google Scholar]
- 16.Stice E, Martinez EE Cigarette smoking prospectively predicts retarded physical growth among female adolescents. J Adolesc Health 2005; 37: 363–370. Available from: 10.1016/j.jadohealth.2004.10.017 [DOI] [PubMed] [Google Scholar]
- 17.Berg JM, Latzman RD, Bliwise NG, Lilienfeld SO Parsing the heterogeneity of impulsivity: a meta-analytic review of the behavioral implications of the UPPS for psychopathology. Psychol Assess 2015; 27: 1129–1146. Available from: 10.1037/pas0000111 [DOI] [PubMed] [Google Scholar]
- 18.Coskunpinar A, Dir AL, Cyders MA Multidimensionality in impulsivity and alcohol use: a meta‐analysis using the UPPS model of impulsivity. Alcohol Clin Exp Res 2013; 37: 1441–1450. Available from: 10.1111/acer.12131 [DOI] [PMC free article] [PubMed] [Google Scholar]
- 19.Fischer S, Smith GT, Cyders MA Another look at impulsivity: a meta-analytic review comparing specific dispositions to rash action in their relationship to bulimic symptoms. Clin Psychol Rev 2008; 28: 1413–1425. Available from: 10.1016/j.cpr.2008.09.001 [DOI] [PMC free article] [PubMed] [Google Scholar]
- 20.Stautz K, Cooper A Impulsivity-related personality traits and adolescent alcohol use: a meta-analytic review. Clin Psychol Rev 2013; 33: 574–592. Available from: 10.1016/j.cpr.2013.03.003 [DOI] [PubMed] [Google Scholar]
- 21.Guller L, Zapolski TC, Smith GT Longitudinal test of a reciprocal model of smoking expectancies and smoking experience in youth. Psychol Addict Behav 2015; 29: 201–210. Available from: 10.1037/adb0000002 [DOI] [PubMed] [Google Scholar]
- 22.Peterson SJ, Davis HA, Smith GT Personality and learning predictors of adolescent alcohol consumption trajectories. J Abnorm Psychol 2018; 127: 482–495. Available from: 10.1037/abn0000351 [DOI] [PMC free article] [PubMed] [Google Scholar]
- 23.Peterson SJ, Smith GT Association between elementary school personality and high school smoking and drinking. Addiction 2017; 112: 2043–2052. Available from: 10.1111/add.13905 [DOI] [PMC free article] [PubMed] [Google Scholar]
- 24.Doran N, Khoddam R, Sanders PE, Schweizer CA, Trim RS, Myers MG A prospective study of the acquired preparedness model: the effects of impulsivity and expectancies on smoking initiation in college students. Psychol Addict Behav 2013; 27: 714–722. Available from: 10.1037/a0028988 [DOI] [PMC free article] [PubMed] [Google Scholar]
- 25.Settles RF, Cyders M, Smith GT Longitudinal validation of the acquired preparedness model of drinking risk. Psychol Addict Behav 2010; 24: 198–208. Available from: 10.1037/a0017631 [DOI] [PMC free article] [PubMed] [Google Scholar]
- 26.Smith GT, Cyders MA Integrating affect and impulsivity: the role of positive and negative urgency in substance use risk. Drug Alcohol Depend 2016; 163: S3–12. Available from: 10.1016/j.drugalcdep.2015.08.038 [DOI] [PMC free article] [PubMed] [Google Scholar]
- 27.Bolles RC Reinforcement, expectancy, and learning. Psycholl Rev 1972. September; 79(5): 394–409. [Google Scholar]
- 28.Tolman EC. Purposive behavior in animals and men Univ of California Press; 1951. [Google Scholar]
- 29.Goldman MS, Del Boca FK, Darkes J. Alcohol expectancy theory: The application of cognitive neuroscience. Psychological theories of drinking and alcoholism 1999. May 21;2:203–46. [Google Scholar]
- 30.Goldman MS, Reich RR, Darkes J. Expectancy as a unifying construct in alcohol-related cognition. Handbook of implicit cognition and addiction 2006:105–19.
- 31.Ajzen I, Fishbein M. Understanding attitudes and predicting social behavior Englewood Cliffs, NJ: Prentice-Hall; 1980. [Google Scholar]
- 32.Goldman MS, Brown SA, Christiansen BA, Smith GT. Alcoholism and memory: Broadening the scope of alcohol expectancy research. Psychological Bulletin 1991;110:137. [DOI] [PubMed] [Google Scholar]
- 33.Ouellette JA, Gerrard M, Gibbons FX, Reis-Bergan M Parents, peers, and prototypes: antecedents of adolescent alcohol expectancies, alcohol consumption, and alcohol-related life problems in rural youth. Psychol Addict Behav 1999; 13: 183–197. Available from: 10.1037/0893-164X.13.3.183 [DOI] [Google Scholar]
- 34.Smith GT, Goldman MS, Greenbaum PE, Christiansen BA Expectancy for social facilitation from drinking: the divergent paths of high-expectancy and low-expectancy adolescents. J Abnorm Psychol 1995; 104: 32–40. Available from: 10.1037/0021-843X.104.1.32 [DOI] [PubMed] [Google Scholar]
- 35.Darkes J, Goldman MS Expectancy challenge and drinking reduction: experimental evidence for a mediational process. J Consult Clin Psychol 1993; 61: 344–353. Available from: 10.1037/0022-006X.61.2.344 [DOI] [PubMed] [Google Scholar]
- 36.Scott-Sheldon LA, Terry DL, Carey KB, Garey L, Carey MP Efficacy of expectancy challenge interventions to reduce college student drinking: a meta-analytic review. Psychol Addict Behav 2012; 26: 393–405. Available from: 10.1037/a0027565 [DOI] [PMC free article] [PubMed] [Google Scholar]
- 37.Guller L, Zapolski TC, Smith GT Personality measured in elementary school predicts middle school addictive behavior involvement. J Psychopathol Behav Assess 2015; 37: 523–532. Available from: 10.1007/s10862-014-9474-6 [DOI] [Google Scholar]
- 38.Fischer S, Smith GT, Anderson KG, Flory K. Expectancy influences the operation of personality on behavior. Psychology of addictive behaviors 2003. June;17(2):108–14. [DOI] [PubMed] [Google Scholar]
- 39.Corbin WR, Iwamoto DK, Fromme K A comprehensive longitudinal test of the acquired preparedness model for alcohol use and related problems. J Stud Alcohol Drugs 2011; 72: 602–610. Available from: 10.15288/jsad.2011.72.602 [DOI] [PMC free article] [PubMed] [Google Scholar]
- 40.Wardell JD, Read JP, Colder CR, Merrill JE Positive alcohol expectancies mediate the influence of the behavioral activation system on alcohol use: a prospective path analysis. Addict Behav 2012; 37: 435–443. Available from: 10.1016/j.addbeh.2011.12.004 [DOI] [PMC free article] [PubMed] [Google Scholar]
- 41.Zapolski TC, Stairs AM, Settles RF, Combs JL, Smith GT The measurement of dispositions to rash action in children. Assessment 2010; 17: 116–125. Available from: 10.1177/1073191109351372 [DOI] [PMC free article] [PubMed] [Google Scholar]
- 42.Dunn ME, Goldman MS Empirical modeling of an alcohol expectancy memory network in elementary school children as a function of grade. Exp Clin Psychopharmacol 1996; 4: 209–217. Available from: 10.1037/1064-1297.4.2.209 [DOI] [Google Scholar]
- 43.Settles RE, Zapolski TC, Smith GT Longitudinal test of a developmental model of the transition to early drinking. J Abnorm Psychol 2014; 123: 141–151. Available from: 10.1037/a0035670 [DOI] [PMC free article] [PubMed] [Google Scholar]
- 44.Cruz IY, Dunn ME Lowering risk for early alcohol use by challenging alcohol expectancies in elementary school children. J Consult Clin Psychol 2003; 71: 493–503. Available from: 10.1037/0022-006X.71.3.493 [DOI] [PubMed] [Google Scholar]
- 45.Dunn ME, Goldman MS Age and drinking-related differences in the memory organization of alcohol expectances in 3rd-, 6th-, 9th-, and 12th-grade children. J Consult Clin Psychol 1998; 66: 579–585. Available from: 10.1037/0022-006X.66.3.579 [DOI] [PubMed] [Google Scholar]
- 46.Lewis-Esquerre JM, Rodrigue JR, Kahler CW Development and validation of an adolescent smoking consequences questionnaire. Nicotine Tob Res 2005; 7: 81–90. Available from: 10.1080/14622200412331328475 [DOI] [PubMed] [Google Scholar]
- 47.Smith GT, McCarthy DM, Goldman MS Self-reported drinking and alcohol-related problems among early adolescents: dimensionality and validity over 24 months. J Stud Alcohol 1995; 56: 383–394. Available from: 10.15288/jsa.1995.56.383 [DOI] [PubMed] [Google Scholar]
- 48.D’Agostino AR, Peterson SJ, Smith GT A Risk Model for Addictive Behaviors in Adolescents: Interactions between Personality and Learning [Internet]. OSF; 2018. Available from: osf.io/4n9xu [DOI] [PMC free article] [PubMed]
- 49.Enders CK Analyzing structural equation models with missing data. In: Hancock GR, Mueller RO, editors. Structural equation modeling: a second course 2nd ed. Charlotte (NC): Information Age Publishing; 2006. p. 313–342. [Google Scholar]
- 50.Weiss NH, Tull MT, Sullivan TP, Dixon-Gordon KL, Gratz KL Posttraumatic stress disorder symptoms and risky behaviors among trauma-exposed inpatients with substance dependence: the influence of negative and positive urgency. Drug Alcohol Depend 2015; 155: 147–153. Available from: 10.1016/j.drugalcdep.2015.07.679 [DOI] [PMC free article] [PubMed] [Google Scholar]
- 51.Pearson CM, Smith GT Bulimic symptom onset in young girls: a longitudinal trajectory analysis. J Abnorm Psychol 2015; 124: 1003–1013. Available from: 10.1037/abn0000111 [DOI] [PMC free article] [PubMed] [Google Scholar]
Associated Data
This section collects any data citations, data availability statements, or supplementary materials included in this article.