

Abstract
Traditionally, in dose‐escalating first‐in‐human (FiH) studies, a dose cap with a 10‐fold safety margin to the no observed effect level in animals is implemented if convulsive events are observed in animals. However, the convulsive risk seen in animals does not generally translate to humans. Several lines of evidence are summarized indicating that in a dose‐escalating setting, electroencephalographic epileptiform abnormalities occur at lower doses than clinical convulsive events. Therefore, we propose to consider the occurrence of epileptiform abnormalities in toxicology studies as premonitory signals for convulsions in dose‐escalating FiH studies. Compared with the traditional dose‐cap approach, this may allow the exploration of higher doses in FiH and, subsequently, phase II studies without compromising human safety. Similarly, the presence or absence of electroencephalographic epileptiform abnormalities may also aid the assessment of proconvulsive risk in situations of increased perpetrator burden as potentially present in pharmacokinetic and/or pharmacodynamic drug–drug interactions.
Traditionally, in dose‐escalating first‐in‐human (FiH) studies, a dose cap with a 10‐fold margin to the no observed effect level (NOEL) with respect to convulsions in animals is implemented. However, the interspecies translatability of convulsive risk does not appear to be predictive of human risk as implied by animal observations.1 In this review, we summarize the evidence that epileptiform abnormalities (EAs) occur at doses lower than those associated with convulsions and, hence, propose that the occurrence vs. absence of EAs should guide dose escalation, replacing a fixed safety margin relative to NOEL for convulsions.
Background
Drug‐induced convulsions may present as a serious, potentially life‐threatening adverse drug reaction and are one of the most frequent causes of central nervous system related injury or death in human clinical trials.2, 3 For dose‐escalating FiH trials—particularly for nononcology indications typically conducted in healthy volunteers with the requirement to minimize safety risk—the uncertainty in interspecies translatability of convulsive risk has resulted in a generalized approach that limits dose escalation to a 10‐fold safety margin between the estimated plasma levels in dose‐escalation studies in humans and the plasma level associated with the NOEL for convulsions in animal toxicity studies.4, 5 According to a cross‐industry survey conducted together with the “Innovation and Quality” Consortium–DruSafe Leadership Group (https://iqconsortium.org/; unpublished data), 88% of DruSafe members apply the 10‐fold safety margin for FiH studies in healthy volunteers, either because of a perceived expectation from regulatory reviewers or sponsors’ tendencies to apply a conservative approach for safety reasons.
Regulatory guidance to determine the starting dose of FiH studies6 takes into account all available data from good laboratory practice (GLP) toxicology studies in animals as well as theoretical safety considerations. However, no numeric guidance is provided regarding the selection of the highest acceptable dose in dose‐escalating FiH studies relative to animal toxicities and the maximum tolerated dose based on safety and tolerability observations made in the FiH trial might have defined the highest dose explored. The recently released guideline by the Committee for Medicinal Products for Human Use (CHMP)7 take a different approach, stating that assessment of the maximum tolerated dose should not be an objective of FiH studies and that doses exceeding the anticipated therapeutic efficacy require justification. However, assessing the need for dose adjustment in the context of pharmacokinetic interactions benefits from exploration of doses higher than the expected therapeutic dose in FiH studies. The CHMP guideline also abstains from numeric recommendations with regard to a safety margin relative to specific toxicities (e.g., convulsions) that are observed preclinically and that may limit dose escalation in FiH trials. Dedicated safety monitoring as a follow‐up for toxicities observed in animals may not only support decisions on dose escalation but may also help assess the risk of pharmacodynamic interactions (e.g., with other drugs).
A generalized approach—such as the 10‐fold safety margin generally applied for preclinical convulsive events—might not be the most appropriate method, because it contrasts with the observation that the interspecies translatability of proconvulsive risk implied by animal observations overall is not predictive of human risk.1 Furthermore, and as summarized herein, there is evidence that EAs occur at lower doses than convulsions, suggesting that electroencephalographic (EEG) end points could provide an additional safeguard. We therefore propose an algorithm‐guided dose escalation for FiH trials using the occurrence of EAs as an alternative and more adaptable approach compared with a fixed safety margin to NOEL. EAs are characterized by changes in voltage polarity arising abruptly as asymmetric waveforms out of EEG background activity. Forms of EAs are spikes defined as waves with a duration of 20 to <70 ms, and sharp waves are EAs that last for 70–200 ms; spikes and sharp waves may also occur in combination with slow waves, classically of higher amplitudes than spikes or sharp waves.8, 9 In particular, periodic lateralized epileptiform discharges, which are defined as repetitive periodic, focal, or hemispheric epileptiform discharges (spikes, spike and waves, polyspikes, sharp waves) have been linked to convulsion risk (~50%10, 11); however, periodic lateralized epileptiform discharges are believed to occur in the context of acute organ pathologies and may not be assumed to be the most sensitive proconvulsive EEG event in the context of pharmacodynamic new molecular entity (NME) effects. While less likely drug‐induced compared with spikes and sharp waves, focal slowing has also been described as a sign of local cortical abnormality—usually related to an organic pathology—which may indicate a seizure risk.9 Focal slowing is potentially relevant in particular in the absence of sedative effects. These EAs must be distinguished from benign epileptiform variants that are not considered to be associated with convulsive risk.9 Benign epileptiform variants were noted in ~3.5% of a general outpatient population referred to an EEG examination in the context of various conditions, including seizure disorders, stroke, encephalitis, psychological or behavioral symptoms, metabolic encephalopathy, dementia, blackouts, headaches, and dizziness.12 According to this information, the distribution of benign epileptiform variants is as follows: benign sporadic sleep spikes, 1.85%; wicket waves, 0.03%; 14‐Hz and 6‐Hz positive spikes, 0.52%; 6‐Hz spike and waves, 1.02%; rhythmic temporal theta bursts of drowsiness, 0.12%; and subclinical rhythmic electroencephalographic discharge, 0.07%. An overall rate as high as 7.7% has been recently reported in aircrew applicants (anterior theta activities (4%), posterior slow waves (2.8%), alpha variants (0.6%), and wicket spikes (0.2%)).13
The translatability of convulsion risk from animals to humans varies across drug classes
PharmaPendium is a searchable database listing toxicities observed in animals and humans using various sources, and a PharmaPendium search was initially conducted in June 2017 using search terms in the following categories:
Category “adverse effect/toxicity”: seizure of any subtype including grand mal convulsion or clonic convulsion or convulsion or tonic convulsion.
Category “sources”: all available (US Food and Drug Administration (FDA) approval packages or European Medicines Agency approval documents or Meyler's or Mosby's Drug Consult or PharmaPendium published toxicities) to check for convulsions reported in animals. In a second step, the search focused on human relevance and searched for “convulsion” or “seizure” listed in the FDA label only.
Category “species”: human or rat or dog or monkey.
Antiepileptic drugs, drug combinations, biological agents, and vaccines were excluded from this search.
We first looked into drugs for which a seizure term was reported in animals (i.e., rats, dogs, monkeys) and then among those for which convulsion in clinical settings was mentioned on the FDA label. In a second step, we reversed the order and filtered drugs for which convulsion in clinical settings was mentioned on the FDA label and then checked for a seizure term event reported in animals. Subsequently, for drugs that had convulsions reported on the FDA label but for which no seizure term events were reported in animals, we distinguished those for which there was a plausible clinical context associated with seizure risk that would not have been covered by animal testing. For 58 out of 390 (15%) drugs with a seizure term noted in rats, dogs, or monkeys, the observation of convulsion in clinical trials was mentioned on the FDA label. This rate increased to 17% (65/390) when adding mouse as a species in the search. A conservative dose selection in clinical trials and/or a convulsive risk linked to supratherapeutic doses only as explored in toxicology experiments may explain the low rate of 15%.
In turn, among 122 drugs with convulsion reported on the FDA label, for 58 (48%) drugs a seizure term event was reported in rats, dogs, or monkeys, and an additional seven drugs were retrieved when adding mouse to the animal species searched for, resulting in a total of 65 (53%) drugs reporting both convulsions in clinical setting and a seizure term event in animals. For 42 drugs, convulsion was reported on the FDA label as a class effect (n = 1), as a postmarketing observation (n = 9), or in clinical context with elevated convulsion risk per se (e.g., pediatric age or concomitant medications; n = 32). Only 15 drugs that reported convulsion on the FDA label had neither a seizure term event reported in animals nor a particular clinical context that would not be mirrored in preclinical toxicology studies (Table 1).
Table 1.
Summary of PharmaPendium search
| Category | n |
|---|---|
| No. of drugs with seizures reported in rats/dogs/monkeysa | 390 |
| No. of drugs with seizures reported in animals (rats/dogs/monkeys) and on FDA label | 58a |
| No. of drugs with seizures reported in humans on FDA label | 122 |
| No. of drugs with convulsion reported on FDA label but no seizures reported in rats/dogs/monkeys | 64 |
| Seizure terms reported in micea only | 7 |
| Seizure terms reported as class effect only | 1 |
| Seizure terms reported as postmarketing report only | 9 |
| Seizure terms reported in clinical context with elevated convulsion risk (e.g., presence of comedication or neonatal age) | 32 |
| No. of drugs with seizure terms reported on FDA label, but not in animals and with no plausible clinical context associated with elevated convulsion risk | 15 |
FDA, USA Food and Drug Administration; GLP, good laboratory practice.
Rats, dogs, and monkeys were the species of focus to check for seizure terms in animals because these species are often selected in GLP toxicology experiments.
Also reported separately in 7 mice.
Mice were considered separately because they are used less frequently in GLP toxicology studies.
We looked closer at second‐generation antipsychotics (SGAs), as this class of drugs is known to be associated with convulsion risk at therapeutic doses. For clozapine, the convulsion rate is ~1% at a dose of 300 mg per day.14 The NOEL in animals corresponds to a human equivalent dose of ~1,000 mg as per allometric upscaling; however, the information regarding safety margin based on maximum plasma concentration (Cmax) is limited and might be well below 10‐fold. The prescribing information of clozapine quotes a crude rate higher than 1%; that is, 3.5% of subjects experienced a convulsive event from clinical trials (61 out of 1743 subjects enrolled), estimating a cumulative 5% risk rate of seizure for the first year of clozapine treatment.15 For other SGAs, preclinical pharmacokinetic information is available to compare the Cmax at the NOEL in animals with the Cmax in human at therapeutic dose. For olanzapine, the clinical convulsion rate at the time of filing was given as ~0.9%; however, the prescribing information refers to potential confounding factors in many of these cases, indicating that the true rate is lower.16 The margin between NOEL‐Cmax in animals and clinical Cmax is approximately twofold; that is, Cmax at NOEL is twofold higher than clinical Cmax at the therapeutic dose. Quetiapine with a clinical Cmax at a therapeutic dose that provides a margin approximately fourfold below Cmax at NOEL in animals shows a convulsion rate of ~0.5%, compared with 0.2% in a placebo group of patients with schizophrenia. For risperidone, a convulsion rate similar to placebo has been reported (~0.3%), and clinical Cmax is ~10‐fold lower than Cmax at NOEL. Thus, within the SGA class, a larger safety margin to NOEL appears to be indicative for a lower convulsion risk, and—as in the case of risperidone—a margin of ~10‐fold resulted in a convulsion risk similar to the one observed in patients on placebo.
In contrast to the SGAs, for rimonabant (Acomplia), a cannabinoid receptor‐1 antagonist that was developed for obesity but was later withdrawn because of side effects of depression, the Summary of Product Characteristics in Europe17 states that clinical trial data did not reveal a difference in convulsion incidence between verum‐ treated and placebo‐treated cohorts and convulsions are noted in the postmarketing phase. A review of its FDA convulsion profile is publicly available. Convulsions occurred in several animal species tested (rats, mice, and monkeys). Based on Cmax, the safety margin for convulsions was approximately twofold in mice and was virtually absent in rats and monkeys. A no observed adverse effect level with a margin of threefold in dogs is mentioned; however, it may have been that the no observed adverse effect level was the highest dose tested in dogs because no effect level was reported. Throughout the clinical program enrolling more than 3,500 subjects at the relevant dose (20 mg), the rate of convulsions was 0.26% compared with 0.18% prevalence in the placebo cohorts. Of note, the rate of convulsions was 0.06% at a dose of 5 mg. These data suggest an increased seizure risk, though further clinical experience is needed to clarify this potential risk. In a Roche internal program (referred to hereafter as RO‐NME‐A), a careful dose escalation in humans showed absence of clinical seizure events as well as of EAs in EEG at Cmax values, similar to Cmax values in dogs at which convulsions had been observed.
These examples illustrate that the translatability of convulsion risk from animals to humans seems to vary across substance classes (Table 2). Of note, compounds such as rimonabant and RO‐NME‐A had no apparent relevant risk for seizures or convulsions in humans, even though the safety margin was lower than threefold or even absent.
Table 2.
Summary of convulsion risk by safety margin between Cmax at NOEL for convulsion in animals and Cmax at therapeutic dose (except for clozapine)
| Molecule | Safety margin between Cmax at NOEL for convulsion in animals and Cmax at therapeutic dose (except for clozapine) | Convulsion risk |
|---|---|---|
| Clozapine | ~3× (based on dose using allometric upscaling from dogs to humans) | 1% (300 mg) |
| Olanzapine | 2× | ~0.9% |
| Quetiapine | 4× | 0.5% (vs. 0.2% on placebo) |
| Risperidone | 10× | 0.3% (as for schizophrenia patients on placebo) |
| Rimonabant | <1–3× | 0.26% vs. 0.18% on placebo |
| RO‐NME‐A | <1× | No EA/no convulsion in FiH trial |
EA, epileptiform abnormality; FiH, first‐in‐human; NOEL, no observed effect level.
EAs are a premonitory sign for convulsions in a dose‐escalating setting
In general, EAs are not clinically established as a premonitory sign timewise preceding a clinical convulsion that could be used to reduce the occurrence of convulsions. Nevertheless, for some clinical conditions, a review of existing data shows that EAs start at an earlier stage in the respective brain pathology and/or at a lower proconvulsive perpetrator burden. Specifically, longitudinal studies in individuals diagnosed with autism or tuberous sclerosis—conditions associated with high epileptic comorbidity rates—revealed a higher frequency and an earlier onset in life of EAs in EEG recordings compared with convulsions.18, 19, 20 Also, EAs appear more frequently than convulsions in children of similar age, presumably at similar stage of developing brain pathology and/or proconvulsive perpetrator burden. An increase in proconvulsive risk occurs in the acute postischemic stroke situation. The frequency of EAs as detected in a 30‐minute EEG recorded within 24 hours after an ischemic stroke was reported to be approximately fivefold higher than the frequency of clinical convulsions within subsequent days.11, 21
A frequency of EAs higher than the frequency of clinical convulsive events may indicate a dose–response relationship with a lower amount of perpetrator's burden being associated with EAs and a higher burden causing convulsions. Indeed, for proconvulsive drugs, EA frequencies reported typically are higher than the reported risk of clinical convulsions. Among a total population of 350 clozapine‐treated schizophrenia patients, 102 patients (29%) with EAs were identified,15, 22, 23, 24 which compares to a reported convulsion rate of 1–5%.15, 25 The reported EA rate of ~11% (5/46) for olanzapine‐treated patients25, 26 also is apparently much higher than the convulsion rate of ≤0.9%.16 Among 197 patients on bupropion, EAs were diagnosed in 24 (12.2%) patients, while no patient with a convulsion event was reported.27 Thus, a comparison of EA rate with historical data on convulsion rate reveals a relative association, while intraindividual risk prediction is not provided. Pooled information as available for the anesthetic sevoflurane shows that out of 60 patients with no central nervous system disease who underwent elective surgery, 44 (73.3%) patients exhibited EAs in EEG monitoring, whereas 5 (8.3%) patients showed signs of convulsions in the form of jerks. In addition, dose dependence of sevoflurane‐associated EAs has been described in patients undergoing elective gynecological surgery. At a sevoflurane dose of two times the minimal alveolar concentration (MAC), at which 50% of subjects do not react upon a painful stimulus like intubation of the trachea or skin incision, no EAs in EEG recordings were noted; at a dose of 8 MAC, 60% of patients showed EAs. This proportion increased further to 87% when hyperventilation, a provocation maneuver to produce EAs, was applied. Polyspikes, the more severe type of EA compared with sharp waves and single spikes, were recorded in 40% of patients without hyperventilation at 8 MAC sevoflurane.28, 29 Jerks were noted in 3 (20%) patients under hyperventilation but not without hyperventilation. In another study, patients with epilepsy undergoing elective surgery had EEG monitored during exposure to sevoflurane. The time with EAs as percentage of total EEG recording time was ~2% at 1 MAC and ~6% at 2 MAC sevoflurane, again demonstrating dose dependency for the rate of EAs.30 These studies show that EA frequency is a function of dose for both nonepileptic and epileptic populations.
Reviewing two Roche internal preclinical programs for which the mode of action would not be linked to a proconvulsive risk, in one program (RO‐NME‐A) convulsions were observed in dogs (Cmax ≈ 35,000 ng/mL; NOEL‐Cmax ≈ 17,000 ng/mL). In a second dog toxicity study, EEG monitoring was included, and EAs were noted at plasma concentrations (Cmax ≈ 16,000 ng/mL) close to the NOEL‐Cmax for convulsions as obtained in the first dog study. For a second program, RO‐NME‐B, convulsion and EEG data (from three recordings each 10 minutes around time period from intake of drug until reaching Cmax (Tmax)) were available for various, escalating doses administered to dogs. EAs occurred at lower doses and lower Cmax values compared with doses and Cmax causing convulsions (Table 3). The NOEL for convulsion was determined to be 50 mg/kg/day linked to a Cmax of 7,000 ng/mL. Referring to available human pharmacokinetic data, the corresponding human dose associated with such a Cmax value had been 1,000 mg. The NOEL for EAs was determined to be 10 mg/kg/day linked to a Cmax of 2,000 ng/mL, corresponding to a dose of 350 mg in humans—hence, to a considerably lower, but still higher dose than one tenth the dose associated with the NOE‐Cmax value with regard to convulsions in dogs.
Table 3.
Occurrence of EAs in EEG and convulsions in beagles treated with RO‐NME‐B relative to dose and associated Cmax
| Duration of GLP toxicology study | Dose administered to dogs | Approximate Cmax (ng/mL) | Approximate human daily equivalent dose matching Cmax in dogs | No. of dogs | |
|---|---|---|---|---|---|
| Treated | With EAs | ||||
| 13 weeks | 10 mg/kg | 2,000 | 350 mg | 6 | 0 |
| 25 mg/kg | 4,000 | 550 mg | 6 | 0 | |
| 40 mg/kg | 5,000 | 700 mg | 8 | 1 | |
| 4 weeks | 50 mg/kg | 7,000 | 1,000 mg | 6 | —a |
| 75 mg/kg | 11,000 | 1,500 mg | 10 | —a , b | |
| 13 weeks | 60 mg/kg | 13,000 | 1,750 mg | 10 | 2 |
EA, epileptiform abnormality; EEG, electroencephalographic; GLP, good laboratory practice; NOEL, no observed effect level.
No EEGs had been performed.
Across all dose levels, one dog in the 75 mg/kg/day cohort convulsed. For EAs, the NOEL would formally be linked to a Cmax of 4,000 ng/mL (i.e., 80% of the Cmax at which EAs were noted). Therefore, the NOEL was determined at the next lower level with a Cmax of 2,000 ng/mL. This dose corresponds to a human equivalent dose of 350 mg. For convulsions, the NOEL considered is linked to a Cmax of about 7,000 ng/mL, corresponding to human equivalent does of ~1,000 mg.
The continual reassessment method
To maximize the benefit of obtaining preclinical data through quantitative means while ensuring patient safety, the continual reassessment method (CRM) is increasingly used in FiH studies as a predefined framework to support dose escalation decisions.31, 32, 33
Animal experiments
As outlined in Table 3 and integrated into Figure 2, animal experiments for RO‐NME‐B showed that EAs in EEG recordings are seen at lower doses and associated with lower Cmax than convulsions. Should convulsions be noted in multiple animal species, pharmacokinetic – pharmacodynamic (PK‐PD) relationships with respect to EAs in EEG recordings and convulsions, respectively, should be taken from the most sensitive species. This analysis should also inform about the presence of a PK‐PD hysteresis between the pharmacokinetic Tmax and the occurrence of EAs and convulsions in order to define the duration of EEG recordings in FiH trials. The potential for different brain penetration of NMEs across species (e.g., due to species‐dependent affinity to the brain efflux transporter P‐glycoprotein or different plasma protein binding) should be evaluated and considered in pharmacokinetic modeling.
Figure 2.
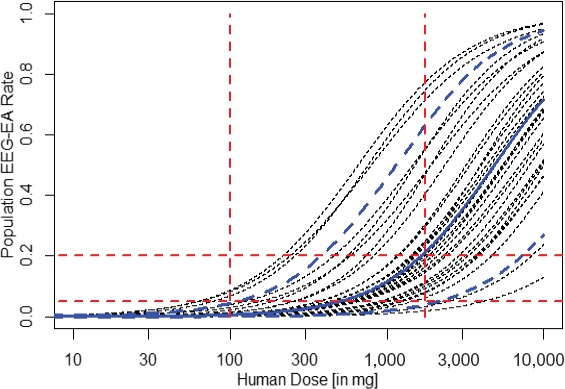
Minimally informative prior distribution for RO‐NME‐B. The lines represent probabilities for certain EA rates by human dose. This relationship derives from estimates of EA rates by exposure based on observations made in dogs with human doses matching respective exposures in dogs. The bold solid blue line corresponds to the best estimated dose toxicity relationship; bold dashed blue lines describe pointwise lower and upper 5% ranges. The thin black lines represent 30 individual patient profiles to illustrate the range of variability. These were obtained by sampling from the bivariate prior distribution for the parameters α and β as described in the text. Dashed horizontal lines correspond to population EEG‐EA rates of 5% and 20%; dashed vertical red lines indicate the two doses of 100 and 1,750 mg, which were used to construct the prior distribution as described in the text. This minimally informative prior distribution curve estimates p(EA > 20%) at a dose of 1,750 mg in human of 50%, while p(EA > 5%) is 95% at this dose and less than 10% (3.9%) for a dose of 100 mg. Of note, the NOEL in dogs corresponds to a human dose of 1,000 mg for RO‐NME‐B and, hence, the dose of 100 mg corresponds to the dose cap according to the traditional approach of keeping a 10‐fold safety margin. EEG monitoring is suggested to start at 100 mg with the dose escalation rule staying with a p(EA > 5%) of maximum 10%. EA, epileptiform abnormality; EEG, electroencephalographic; NOEL, no observed effect level.
Mathematical concept
The CRM begins by defining a “minimally informative prior distribution” describing the relationship between the percentage of animals with EAs in EEG recordings relative to the plasma concentration of the causative NME. Being minimally informative means that the distribution describes a large variety of possible relationships based on the best judgment of all preclinical data available at the start of an FiH trial. The prior distribution then serves as a framework with an ability to react to any toxicities (here the number of trial subjects showing EAs in EEG recordings) observed during the dose escalation steps in the FiH study. For past doses tested as well as for potential future doses, the probabilities for the occurrence of EAs are readjusted after each dose step based on the observed numbers of subjects who experienced EAs. Accordingly, the likelihood for the EA rate to exceed a certain threshold for decision making will increase or decrease relative to the previously derived probabilities. Computations in this manuscript have been performed using the crmPack package available via the CRAN network.34
For our example compound RO‐NME‐B and referring to the observations obtained from dogs (Table 3), the minimally informative prior distribution was derived based on the below assumptions.
At a human dose of 100 mg corresponding to a Cmax of one‐ tenth relative to the Cmax at the NOEL for convulsions in dogs, and therefore representing the traditional dose cap for the FiH study, the probability to exceed an EA rate of 5% (p(EA > 5%)) is <10% (i.e., estimated to be 3.9% as derived from 25,000 Monte Carlo simulated samples from the minimally informative prior distribution and assessing how often simulated relationships between dose and EA rate exceed the 5% value; see Table 4). EAs in various clinical scenarios occur at least fivefold more frequently than the clinical event of convulsion, hence, we consider excluding an EA rate of 5% or higher (corresponding to a convulsion risk of ~1% or higher) with 90% probability together with the general subject's safety monitoring in line with “minimal risk” requirements for healthy volunteer studies. Of note, these figures also match the risk taken with the traditional dose cap approach.
At a human dose of 1,750 mg (corresponding to a Cmax of 13,000 ng/mL), the EA rate is assumed to be below or above 20% (chosen in accordance with Table 3; at this concentration, 2 of 10 animals showed EAs) with a 50% probability each.
Table 4.
Change in the probability for EA rate to exceed 5% by dose dependent on the occurrence of EA in one out of six individuals by dose cohort
| Human dose level tested | Number of individuals per cohort receiving RO‐NME‐B | Number of subjects per cohort experiencing an EA | Probability for p(EA > 5%)a | |||
|---|---|---|---|---|---|---|
| 100 mg | 150 mg | 225 mg | 350 mg | |||
| Prior to 100 mg testedb | 3.9 | 9.2 | 18.8 | 34.3 | ||
| 100 mg | 6 | 0 | 2.5 | 6.9 | 15.5 | 31.0 |
| 6 | 1 | 19.2 | 35.1 | 54.2 | 73.0 | |
| 150 mg | 6 | 0 | 1.4 | 4.8 | 12.6 | 27.2 |
| 6 | 1 | 10.9 | 25.4 | 44.4 | 66.6 | |
| 12 | 0 | 0.8 | 3.3 | 9.7 | 23.5 | |
| 225 mgc | 6 | 0 | 0.3 | 1.8 | 7.0 | 19.6 |
| 6 | 1 | 2.8 | 11.2 | 28.6 | 53.7 | |
| 30 | 0 | 0.0 | 0.2 | 2.0 | 9.6 | |
| 350 mgd | 6 | 0 | 0.0 | 0.1 | 1.1 | 7.1 |
| 6 | 1 | 0.0 | 0.7 | 5.8 | 24.0 | |
EA, epileptiform abnormality.
Estimates for p(EA > 5%) derived from 25,000 Monte Carlo simulations.
Derived from the minimally informative prior distribution curve; for doses of 450 mg and 1,750mg, a p(EA > 5%) of 45.3% and 91.8%, respectively, was estimated.
p(EA > 5%) for 225 mg includes the scenario that 12 subjects were enrolled into the preceding 150mg dose step and no EAs had been noted.
p(EA > 5%) for 350 mg includes the scenario that 30 subjects were enrolled into the preceding 225mg dose step and no EAs had been noted.
Under these assumptions, we chose a logistic regression model for the relationship between a dose d and the likelihood p for an individual to experience an EA at dose d via the equation
wherein d* is an arbitrary fixed reference dose to improve numerical stability, and log denotes the natural logarithm.32 Assuming a distribution for the parameters α and β as being bivariate normal with mean μ and covariance matrix Σ will define a typically wide range of a priori possible relationships between the human dose and the EA rate as illustrated in Figure 1. For the example here, a reference dose of d* = 1,000 mg was chosen. The choice of the reference dose does not impact the predicted p(EA > 5%), hence, the decision making for dose escalation. For this dose, criteria 1 and 2 stated above lead to values for α and β of −2.18 and 1.35, variabilities of 55% and 18%, respectively, and a correlation of 0.26. The computational details related to the derivation of these values have been described previously by Neuenschwander et al.35
Figure 1.
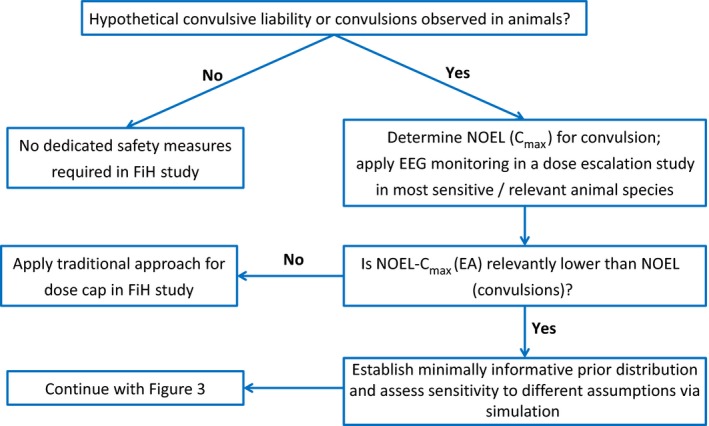
Scheme of proposed algorithm to guide dose escalation in FiH studies for NMEs with a preclinical convulsive liability: preparatory steps to generate a CRM model. CRM, continual reassessment method; EA, epileptiform abnormality; EEG, electroencephalographic; FiH, first‐in‐Human; NME, new molecular entity; NOEL, no observed effect level.
Figure 2 depicts the resulting minimally informative prior distribution. It reflects an average EA rate of ~10% at a dose of 1,000 mg and an ~2.5‐fold increase in the odds of an EA for an increase in the dose by a factor of 2. Of note is that the odds are given by p(1 − p) and are not the same as the likelihood p for an individual to experience an EA.
Dose escalation rules (see Figure 3):
Figure 3.
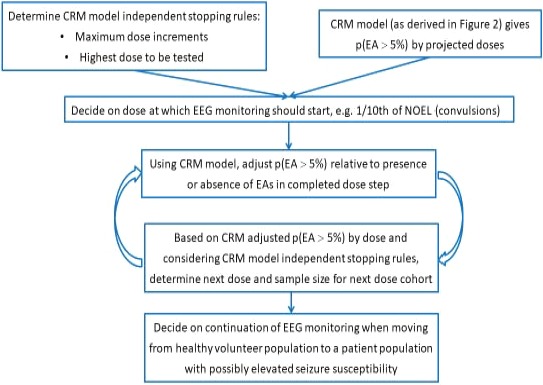
Scheme of proposed algorithm to guide dose escalation in FiH studies for NMEs with a preclinical convulsive liability: use of the CRM in an FiH trial. CRM, continual reassessment method; EA, epileptiform abnormality; EEG, electroencephalographic; FiH, first‐in‐human; NME, new molecular entity; NOEL, no observed effect level.
In line with criterion 1 for the selection of the minimally informative prior distribution, our proposed version of the CRM algorithm will allow to select doses for which, based on all data accumulated so far, the p(EA > 5%) is maximally 10% (i.e., the p(EA ≤ 5%) is at least 90%).
To account for the limited experience in exceeding one‐tenth of the NOEL exposure from animals for the event of convulsions, a maximum dose increment of 50% relative to the preceding dose should be implemented. We consider that an increase by 50% represents a meaningfully higher dose for most drugs. Should the CRM‐derived probabilities allow a dose linked to a Cmax higher than the EA‐NOEL Cmax—here, a dose of 350 mg—we suggest considering additional dedicated measures (e.g., requiring a probability of at most 5% for p(EA > 5%)), which could be achieved through a larger cohort tested at the preceding dose step and/or a reduced dose increment.
Use of CRM for the RO‐NME‐B example in a hypothetical FiH study
We assume that in the dose‐escalating FiH study each dose cohort consists of eight healthy volunteers, two of whom are randomly assigned to placebo and six of whom undergo active treatment. After each dose step, p(EA > 5%) values are recalculated. We present two examples, one in which no EAs are seen during continued dose escalation, and another in which EAs occur (Table 4).
Example 1 refers to a scenario in which no EAs are observed throughout the dose escalation steps. Here, dose steps of 100 and 150 mg would be endorsed according to a readjusted p(EA > 5%) of 3.9% and 6.9%, respectively. However, for escalation to a dose of 225 mg, the sample size of six subjects exposed to 150 mg is insufficient, even in the absence of EAs as the p(EA > 5%) for 225 mg is above 10% (i.e., 12.6%). However, the CRM allows calculation of the sample size needed at 150 mg to subsequently endorse a 225‐mg dose: Enrolling an additional six subjects (for a total sample size of 12) at 150 mg results in a p(EA > 5%) below 10%, assuming that no EAs would be observed. A similar calculation would be needed when preparing for a subsequent 350‐mg dose. Here, 30 subjects would need to receive 225 mg to obtain a p(EA > 5%) of <10% in order to progress to 350 mg, assuming no EAs would be observed at 225 mg. Conduct of a dose step at 350 mg with six subjects will then further decrease the remaining risk at that dose to 7.1%, under the prerequisite that no EAs will have been noted.
In case EAs are seen in one out of six RO‐NME‐B–treated subjects (example 2), the p(EA > 5%) changes significantly. For example, if no EAs are noted at the 100‐mg dose step but one subject experiences an EA at the 150‐mg dose, the p(EA > 5%) increases from 6.9% (prior to the 150‐mg dose) to 25.4% (after the 150‐mg dose) for the 150mg dose cohort, and the p(EA > 5%) for the 100‐mg dose also changes from 2.5% to 10.9%. Hence, the occurrence of an EA at the 150mg dose may result in the conclusion that the previous lower dose should be tested again. In general, the occurrence of an EA would typically be expected to require a larger number of healthy volunteers tested at the dose at which EA was observed or even at a lower dose. Table 4 shows how the occurrence of EAs changes the p(EA > 5%) relative to CRM‐guided adjustments and how the CRM can be used to rationalize dose escalation according to sample size in FiH studies.
Safety monitoring in fih study
In order to meet the requirement of “minimal safety risk,” the dose decision algorithm proposed is accompanied by the safety monitoring measures outlined as follows.
Considerations about mode of EEG recording
We propose that EEG monitoring (10/20 electrode placing method36) in a dose escalation study should begin at the dose that corresponds to the traditionally defined dose cap. In the example of RO‐NME‐B, the dose of 100 mg would achieve a 10‐fold safety margin to the NOEL‐Cmax in animals with regard to the event of convulsion. In our experience, neither health authorities nor ethics committees requested EEG monitoring as a safety measure using this traditional dose cap approach in dose‐escalating FiH studies. As mentioned previously, it is of note that for RO‐NME‐B, the minimally informative prior distribution would link the traditionally defined dose cap of 100 mg to a p(EA > 5%) of 3.9% (i.e., < 10%), which matches the CRM criterion proposed for subsequent dose escalations.
Next, the mode of EEG recordings is discussed in light of its four major objectives:
Identify and exclude healthy volunteers with an unknown susceptibility for EAs and/or seizures at screening. EEG monitoring at screening should include hyperventilation and intermittent photostimulation, and subjects who experience EAs during these provocation maneuvers should be excluded from the study. See also selection of trial population thereafter.
High sensitivity to detect NME‐associated EAs. NME‐associated EAs are most likely to be seen during the pharmacokinetic Tmax of the NME with the assumption that no relevant PK‐PD hysteresis exists. As mentioned above, animal studies should inform not only about the difference in doses triggering convulsions and EAs, respectively, but also about the presence or absence of a relevant delay of the occurrence of EAs and/or convulsions relative to Tmax. In order to address variability in Tmax, EEGs should be recorded for a sufficient period after NME administration to cover an estimated Tmax window. In case animal studies point to a delay of EA onset relative to pharmacokinetic Tmax, EEG recordings may be extended beyond the time of pharmacokinetic Tmax in a single‐dose setting and beyond the time of pharmacokinetic steady state for EEG monitoring in multiple‐dose studies. While causing additional operational burden for the conduct of the study, sleep EEGs and sleep deprivation EEGs may be an option for further enhancing the sensitivity to detect EAs in addition to hyperventilation and intermittent photostimulation, which can be implemented more easily. More than 60 years ago, an increase in the percentage of subjects showing questionable or clear paroxysmal EEG patterns defined as numerous spikes, sharp waves, or slow waves was reported during hyperventilation (5.7%) and intermittent photic stimulation (8.6%) relative to EEG recordings without such maneuvers (3.5%) in pilot applicants.37 In this study, the proconvulsant metrazol was administered as a pharmacological provocation, resulting in 25.2% of subjects with paroxysmal EEG patterns. This study in general reported a higher frequency of subjects with paroxysmal EEG pattern than a survey that considered several more recent screening data.38 These provocation tests may be included in dose‐escalating FiH studies as exploratory measures, keeping in mind that (i) corresponding provocations are not typically applied in animal EEG studies, (ii) the main perpetrator burden for convulsivity is the plasma concentration as a surrogate for the brain concentration of the suspected NME and the mechanism of provocation induced by hyperventilation and photostimulation may be rather artificial than endogenously present in subjects exposed to the NME, (iii) the information is scarce on the predictive value of EAs seen during hyperventilation and/or intermittent photostimulation to develop seizures during subsequent years in nonepileptic subjects, with a wide range of 2–25%38, 39, 40, 41 , and (iv) with prolonged duration and higher frequency of EEG recordings, the sensitivity to detect EAs increases to 84% and 92% with three and four EEG recordings, respectively, compared with ~50% for a single EEG.42 In various situations of prolonged EEG monitoring, the occurrence of EAs during the initial hours was predictive for the occurrence of electric seizures in EEG during later phases of the EEG monitoring.43, 44 However, CRM as part of this proposal provides probabilities for the EA occurrence in a cohort and does not preclude that an individual subject without EA on one occasion may nevertheless show EAs when reexposed to the same dose. Thus, these measures represent risk minimization vs. a risk prevention approach. Researchers may choose to add hyperventilation and/or photostimulation to EEG recordings to increase sensitivity to see EAs. However, for the reasons listed previously, the value of provocation maneuvers is considered exploratory, and EEG recording without those maneuvers is suggested to primarily guide decision on dose escalation. Sleep EEGs should be considered if the Tmax occurs during night. Also, if a sleep EEG is part of a polysomnography study to characterize the sleep pattern during treatment, it should be analyzed for EAs even if Tmax had occurred during the day. Table 5 summarizes the effects of various provocation maneuvers and prolonged EEG recording on detecting EAs.
Table 5.
Effect of various provocation maneuvers and of prolonged EEG recording on detecting EAs
| EEG specification | Percentage of subjects with detected EAs | References |
|---|---|---|
| More frequent EEGs (epilepsy patients) | 1 EEG, 50%; 3 EEGs, 84%; 4 EEGs, 92% | Salinsky et al.42 |
| Prolonged EEG monitoring (epilepsy patients) | 80% with EEG recording of median of 7 days; increased from 40% to 85% as EEG recording time increased from 20 minutes to 24 hours | Walczak et al.59; Badry60 |
| Sleep‐EEG (ASD patients without diagnosis of epilepsy) | 60% vs. historical 20% in routine EEG reported by others | Chez et al.61; Hughes and Melyn 62 |
| Sleep‐deprived EEGs (adult epilepsy patients) | routine, 43%; SD, 35%; combined, 61% | King et al.63 |
| Sleep‐deprived EEGs (epilepsy patients with normal routine EEG) | 34–52% | Fountain et al.64; Carpay et al.65 |
| Sleep‐deprived EEGs and 24‐hour EEGs (epilepsy patients with normal routine EEG) | SD, 24%; 24‐hour EEG, 33% | Liporace et al.66 |
| Sleep‐deprived EEGs in healthy volunteers | 0–2.4% | Ellingson et al.67; Jabbari et al.68 |
EA, epileptiform abnormality; EEG, electroencephalographic.
Specificity/avoidance of false positive outcomes. In the healthy volunteer population, the risk of false‐positive drug‐related EAs is low. Reviews from EEG monitoring in pilot candidates indicate an overall risk of ~0.5–1% to see EAs in a 30‐minute EEG recording involving hyperventilation and intermittent photostimulation.38 Given this low rate, and because subjects who exhibit provoked EAs at screening are excluded from an FiH study, the risk of false‐positive EAs on treatment is considered minimal, and the detection of EAs should be considered genuine by default. The EEG recording times on treatment should be comparable to that at screening, and the number of on‐treatment EEGs should generally be kept to a minimum. When approaching Cmax in an FiH trial that is close to Cmax at NOEL for EAs in animals or when moving from healthy volunteers to a patient population with an inherent proconvulsive disposition (e.g., due to underlying disease or concomitant proconvulsive medications), an additional EEG before reaching steady state should be considered.
Operational feasibility. In our experience, EEG recordings for 6–8 hours after morning administration of an NME are well tolerated by healthy subjects. The same applies to EA monitoring embedded in a polysomnography study. With central reading, a 36‐hour to 48‐hour turnaround time of EEG reading results has been feasible, too. Clearly, this requires diligent planning, but specialized vendors (contract research organizations) exist that provide central reading as well as unified EEG solutions to be employed at different trial centers with appropriate training to ensure that data are captured in the same manner at all locations.
We recommend EEG readings by a central and blinded, experienced reader. In addition, a second expert may be identified as a consultant for the central reader, because the recognition of EA patterns is not always straightforward and may benefit from collaboration.
Selection of study population
Healthy volunteers and EA provocation maneuvers
FiH studies for NMEs in nononcology indications are often conducted in healthy volunteers. We have outlined previously the recommendation to include provocation maneuvers such as hyperventilation and intermittent photostimulation at screening EEG and to enroll only those volunteers who did not show EAs with provocation maneuvers.
Family history of epilepsy
Subjects whose first‐degree relatives have epilepsy should be excluded because they have a threefold higher risk of developing epilepsy.45, 46 However, an uncomplicated single febrile seizure in childhood of a healthy volunteer does not appear to increase epilepsy risk relevantly.47, 48, 49, 50
Patient population
When moving from clinical trials in healthy volunteers to patients during the course of drug development, the possibility of a higher susceptibility to drug‐induced seizures in the patient population should be evaluated. A higher susceptibility may be caused by the disease itself, by comorbidities, or by comedications taken by the patient population. As a result, EEG monitoring in patient trials may be included even if no EAs or if EAs at doses higher than those selected for patient trials were detected in FiH trials in healthy volunteers. To our knowledge, there is no available information that would support a specific exposure margin ensuring similar convulsion risk between a healthy volunteer and a patient population with a reduced seizure threshold.
Children
For NMEs in pediatric indications, FiH trials are typically conducted in adult healthy volunteers, and children are then included in subsequent phase Ib or phase II trials. Pediatric populations, in particular those ≤13 years of age, have a higher background rate of EAs than adults, with rates of ~2–7%.51, 52, 53 The higher background rate should be taken into account when interpreting treatment‐emergent EAs. A larger cohort size, a more balanced ratio of children on verum or placebo, and the use of a sequential or crossover design exposing children to both NME and placebo are tools to be considered to reduce the risk of false‐positive observations.
Additional safety considerations
While doses below the traditionally applied dose cap (i.e., reaching 10% of the Cmax of the NOEL‐Cmax for convulsions in animals) do not require special safety measures, we suggest that subjects be closely monitored by medical professionals throughout the estimated Tmax window, starting with the dose at which EEG monitoring commences (i.e., at the traditional dose cap that reaches a mean Cmax in clinics of 10% of the Cmax linked to the NOEL for convulsions in animals). Close surveillance by medical professionals also applies during the night in the event that pharmacokinetics indicate similar or higher plasma levels during the nighttime hours vs. daytime hours.
An intravenous catheter should be established in every subject and anticonvulsive medication (e.g., short‐acting benzodiazepines), should be rapidly available. Ward staff must be trained in the use of the antiepileptic medication selected.
Critical evaluation of proposal
Following a PharmaPendium review on the translatability of drug‐related animal convulsive events to human and a literature review of EAs as premonitory signs for convulsions relative to increasing proconvulsive perpetrator burden, we propose molecule‐individualized decision making on dose escalation in FiH trials. However, it is necessary to be aware of the reasoning and the potential limitations to guide the judgement needed for some steps.
Interspecies translatability of proconvulsive risk
PharmaPendium‐derived information showed that convulsions observed in animals in the majority of cases did not translate into clinical convulsions appearing on the FDA label, which is in line with the literature on lack of concordance of convulsive toxicity between animals and humans.1 In turn, the majority of drugs reporting clinical convulsion on the FDA label either had shown seizure term events in animals or convulsions were related to a specific clinical context that is not typically mirrored in GLP toxicology animal studies. After excluding drugs for which convulsion in humans referred to class effect, postmarketing experience only, or clinical condition with elevated convulsion risk per se, only 15 of the 122 drugs (12%) had no preclinical alert for seizure in animals. The comparison of convulsive risk in animals and humans as derived from this PharmaPendium search should be carefully interpreted, because safety margins were not retrieved in this broad search, and the search was limited to marketed drugs. Thus, NMEs terminated during clinical development are not taken into account, and the reason for discontinuing development is often not available in the public domain. The rate of drugs with clinical convulsion reported both on the FDA label and in animals was 58 out of 122 (48%) and was 65 out of 122 (53%) when including mouse as a research species. This rate increased to 73% and 81% (i.e., 58 and 65 out of 80 drugs) after subtracting the 42 drugs for which convulsive events reported on the FDA label were linked to a special clinical context. These rates contrast with the report by Nagayama,54 which showed a concordance rate of only 23.8%. Specifically, seizures and/or convulsions were identified as a clinical adverse drug reaction for 105 drugs out of 393 drugs approved in Japan between 1999 and 2013. Of those, 25 drugs were found to have triggered convulsions in animals at any dose (i.e., independent of any margin consideration). In most instances, convulsions were observed in repeat‐dose toxicology studies (16 drugs), while 10 drugs had shown convulsions in proconvulsion safety pharmacology studies and seven drugs had shown convulsions in other safety pharmacology studies. Overall, eight drugs produced convulsions in both toxicology and safety pharmacology studies. Although the search criteria, the source of information, and the search period were different from our PharmaPendium search, the difference in outcomes still remains noteworthy. The lower rate of potential false‐negatives in animals seen in our PharmaPendium search might at least partially be explained by our selection criteria (e.g., excluding vaccines, disregarding drugs for which the convulsion liability referred to plausible clinical context or class effect, and postmarketing experience only). The rather low percentage of drugs (15%) with convulsive adverse drug reaction terms in the label relative to the number of drugs with seizure term event in animals may be explained by the fact that doses in toxicology studies are typically higher than the clinical recommended dose or that clinical dose selection became limited in order to stay in line with a safety margin. Indeed, within the class of SGAs, safety margin figures from a limited number of compounds seem to indicate that convulsion risk increases with reduced safety margins. Clozapine, which has a convulsion risk of ~1–5% (the highest among SGAs) and ~5‐ to 10‐fold the background convulsion rate of the recruited patient population, may have a margin of only three based on dose. For other SGAs, a margin of about fourfold relative to Cmax appears to be linked to a convulsion risk about twofold to threefold above background incidence, and convulsion risk appears to be absent with a margin of 10‐fold. On the other hand, according to publicly available information, rimonabant did not reveal relevant convulsive risk in humans, while there was a safety margin less than threefold or a negative margin relative to animal exposures. Second, for an internal compound (RO‐NME‐A), no convulsive risk and no EAs in clinical EEG monitoring emerged when doses with no safety margin to NOEL‐associated Cmax were explored.
The interspecies translatability of convulsive risk seems to differ among different classes of drugs. While psychotropic drugs generally have a higher convulsive risk than nonpsychotropic drugs,54, 55, 56 the causative biological mechanism of drug‐induced convulsion often remains unknown.54, 57 The various potential causative mechanisms may, however, be associated with different predictive values across animal species and from animal species to humans and, once available, more insights into underlying proconvulsive mechanisms and their interspecies translatability may further specify the algorithm presented herein.
EAs as premonitory signs
Next, we checked for evidence that in a dose‐escalating setting EAs in EEG may serve as premonitory signs (i.e., they may occur at lower doses than convulsions or earlier in diseases with a progredient neuropathology). First, dose‐dependent convulsion risk is well documented for clozapine, with prevalence of ~1, 2.5, and 4% for doses of <300 mg, 300–599 mg, and ≥600 mg, respectively.14 While clinical reports on dose‐related emergence and frequency of EA are scarce, such a relationship has been documented for the anesthetic sevoflurane in humans. The observations that the frequency and the severity of EAs emerged dose‐dependently and that EAs were seen at lower doses than clinical signs of convulsion (in this case, jerks) support the notion that EAs should be seen at lower doses than convulsions in a dose escalation setting. Second, we report data from dogs for an internal compound (RO‐NME‐B) demonstrating that EAs in EEG recordings occurred at lower Cmax relative to Cmax at which convulsions were observed. Third, longitudinal reports in patients with autism and tuberous sclerosis show an earlier onset of EAs relative to convulsions. These neurodevelopmental diseases are known to be associated with a high rate of comorbid epilepsy pointing to a progressive deterioration of neuronal network and an increasing lack of neuronal seizure control over time. Of note, in both conditions (i.e., drug‐induced convulsions and comorbid epilepsy linked to neuro‐developmental disorder), cross‐sectional studies consistently report a higher EA rate than convulsion rate, which is consistent with a shifted dose–response relationship to a lower perpetrator burden related to EAs and a higher burden causing clinical convulsions. We therefore anticipate that for a number of NMEs causing convulsions in animals, EAs should be seen at lower doses, and a comparison between PK‐PD relationships may reveal a relevant delta between NOEL‐linked Cmax values for EAs and convulsions, while the NOEL‐Cmax for EAs may be higher than the traditionally defined Cmax cap (i.e., higher than one tenth of the Cmax of the convulsion NOEL).
In our plan for dose escalation, if the NOEL‐Cmax for EAs was <10% of the NOEL‐Cmax for convulsions, this algorithm had the potential to limit dose escalation to lower doses compared with the traditional approach. Should that be observed in animals, the EEG monitoring may start not at the dose corresponding to the traditionally defined dose cap but at the FiH dose associated with the Cmax similar to the NOEL‐Cmax for EAs in animals. We are not aware of such a case; however, the experience is limited, hence for the time being there is a need to assess PK‐PD for convulsions and EAs in animals for every NME rather a generic x‐fold delta for the two PK‐PD curves can be provided.
In order to safely progress to doses higher than the traditionally used 10‐fold safety margin to NOEL for convulsions in FiH trials, the proposal presented herein incorporates the CRM. The CRM‐related threshold of p(EA > 5%) <10% in order to move to a higher dose refers to an approximately fivefold or higher rate of EAs relative to convulsion rate consistently observed for several drugs and in a variety of clinical conditions known to be associated with a convulsion risk. We think that excluding a 1% convulsion rate with 90% probability together with the monitoring scheme proposed herein is in line with the minimal risk that is required for healthy volunteer studies. However, the EA‐related, CRM‐based algorithm does not completely eliminate convulsion risk. Of note, however, the CRM threshold of p(EA > 5%) not exceeding 10% for escalating to the next higher dose approximately matches the CRM prior distribution derived p(EA > 5%) for the traditionally defined dose cap in the example RO‐NME‐B. It is the information from EEG monitoring at this traditional dose cap level that is used via the CRM to determine the next higher dose step (i.e., >100 mg in the example RO‐NME‐B), applying the same CRM‐based stopping criteria to the then adjusted prior distribution model.
A major limitation of the proposal to use EAs as a premonitory sign of convulsions in the dose‐escalating setting refers to the scarcity of gathering systematic data for EEG monitoring with EA analysis in a dose‐escalating setting. Bassett et al.,4 in a study of various animal species, described nonspecific symptoms such as emesis, decreased activity, hypersalivation, and tremors at lower doses of the convulsant nonselective γ‐Amino‐butyric acid receptor antagonist pentylenetetrazole (PTZ) compared with convulsions calculating the accumulated dose of PTZ administered through constant infusion. While video EEG was used in this study and changes in quantitative EEG analyses also preceded the onset of convulsions, the accumulated dose of PTZ at which EAs occurred remains unclear. Clinical symptoms such as behavioral and cognitive changes before seizure onset have also been reported in humans58; however, these symptoms are nonspecific, and confirmation by video EEG would be required to check that EAs might occur in the EEG and be linked to videotaped clinical signs and symptoms. Hence, it is important to reflect that the risk minimization measures proposed herein require the demonstration of a left‐shifted PK‐PD relationship for EAs compared with convulsion in animals and that EAs as a premonitory sign are embedded into a composite of various risk‐minimizing measures, namely (i) dose escalation rules linked to CRM, (ii) preset dose escalation limits independent from CRM‐linked rules, and (iii) tight monitoring and observation of trial participants.
The observation that EAs are observed at lower, clinical convulsions at increased proconvulsive perpetrator burden provides a rationale for also using EAs as premonitory signs in case of a potential pharmacodynamic drug–drug interaction. We think that EAs have the potential to serve as a more sensitive marker compared with clinical convulsive events to explore the proconvulsive risk when two compounds with a proconvulsive alert are administered concomitantly.
The CRM
The CRM is an established approach to guide dose escalation, with most experience published in the field of oncology; however, is also used in nononcology indications. On the one hand, the initial minimally informative prior distribution is based on animal experiments, which should have demonstrated a meaningful difference (typically more than twofold) between NOEL‐Cmax for EAs and NOEL‐Cmax for convulsions; on the other hand, it should not be too restrictive to allow adjustment for clinical EA observations. The algorithm contains flexible elements that provide space for adjustment for the uncertainty about a convulsive risk for a given NME to translate from animals to humans should EAs be observed in an FiH trial. These elements refer to the amount of animal data produced, the level of conservatism when building the initial minimally informative prior distribution, and the level of probability to exclude a specific EA rate in clinics (e.g., through the selection of sample size per dose cohort). The algorithm and the numerical criteria as presented for RO‐NME‐B should be understood as a guide to be adjusted for an NME. It is the task of the toxicologist, clinical pharmacologist, safety scientist, and statistician to align on the interpretation of the totality of all available data in order to concretize the flexible elements for an individual NME considering the mode of action, information from molecules of the same or similar class, and observations made for the NME in question in animal experiments.
Summary and outlook
The identification of a maximal NME dose to be tested in FiH trials in case of convulsions were observed in animals is challenging, and the traditional approach may turn out as unnecessarily conservative. Indeed, there are drug examples indicating a low human relevance of convulsive risk seen in animals. The algorithm proposed herein refers to the observations that EAs without convulsions are seen at doses that are lower than the doses triggering convulsions, utilizes the CRM to inform for decision making about dose escalation in FiH trials, and describes the rationale of clinical safety measures to ensure the safety of trial participants, typically healthy volunteers. This compound individualized proposal has the potential to support the selection of higher and safe doses in subsequent dose‐ranging phase II studies. Furthermore, the information from EEG profiling can also be utilized to determine the need for dose adjustments in case of PK and/or PD drug–drug interactions. Similarly, data from EEG profiling may become integrated into the benefit–risk assessment when an NME is moved from a healthy volunteer population to a patient population who inherently may have a reduced seizure threshold.
The proposed algorithm is considered a first step in offering an alternative to the traditional 10‐fold safety margin approach. Subsequently, with the availability of broader datasets collected prospectively, a further and more detailed characterization of EAs as premonitory signals may be undertaken and may become useful, for example, to rationalize further expansion of dose escalation to doses in clinical trials that are linked to the occurrence of EAs in dependency of the acceptable benefit–risk for the NME in question. Literature reports refer to EAs occurrence or absence; however, it may be of interest to explore whether—based on a broader application of EA monitoring as encouraged herein—quantitative and/or qualitative estimates in terms of number and/or shapes of EAs can provide a more accurate description of a relationship between EAs and convulsion risk. While the dose‐escalating rules may be modified further as experience grows, the concept of the CRM and EAs as premonitory signs presented herein may serve as a basis to build a respective database in a harmonized manner across the pharmaceutical industry and academic institutions.
Funding
No funding was received other than that from F. Hoffmann‐La Roche AG, Basel, Switzerland.
Conflict of Interest
M.A., T.D., A.R., E.H., R.P., and C.W. are employees of F. Hoffmann‐La Roche AG. R.D. and K.K. provided consultancy to F. Hoffmann‐La Roche AG. L.D. is a previous employee of F. Hoffmann‐La Roche AG.
References
- 1. Clark, M. & Steger‐Hartmann, T. A big data approach to the concordance of the toxicity of pharmaceuticals in animals and humans. Reg. Toxicol. Pharmacol. 96, 94–105 (2018). [DOI] [PubMed] [Google Scholar]
- 2. Bass, A. et al Origins, practices and future of safety pharmacology. J. Pharmacol. Toxicol. Meth. 49, 145–151 (2004). [DOI] [PubMed] [Google Scholar]
- 3. Kinter, L.B. et al Major organ systems toxicology: an integrated approach to pharmacodynamic safety assessment studies in animals In Comprehensive Toxicology: Vol. 2. Toxicology Testing and Evaluation (eds. Williams P.D. and Hottendorf G.H. (Series), Sipes I.G., McQueen C.A. and Gandolfi A.J. (Vol.)) 155–168 (Elsevier, New York, 1997). [Google Scholar]
- 4. Bassett, L. et al Telemetry video‐electroencephalography (EEG) in rats, dogs and non‐human primates: methods in follow‐up safety pharmacology seizure liability assessments. J. Pharmacol. Toxicol. Meth. 70, 230–240 (2014). [DOI] [PubMed] [Google Scholar]
- 5. Authier, S. et al Safety pharmacology investigations on the nervous system: an industry survey. J. Pharmacol. Toxicol. Meth. 81, 37–46 (2016). [DOI] [PubMed] [Google Scholar]
- 6. U.S. Department of Health and Human Services, Food and Drug Administration . Guidance for Industry and Reviewers (Draft): Estimating the Safe Starting Dose in Clinical Trials for Therapeutics in Adult Healthy Volunteers (2002).
- 7. European Medicines Agency, Committee for Medicinal Products for Human Use (CHMP) . Guideline on Strategies to Identify and Mitigate Risks for First‐in‐Human and Early Clinical Trials With Investigational Medicinal Products (2017).
- 8. Worrell, G.A. et al Role and limitations of routine and ambulatory scalp electroencephalography in diagnosing and managing seizures. Mayo Clin. Proc. 77, 991–998 (2002). [DOI] [PubMed] [Google Scholar]
- 9. St. Louis, E.K. (editors). Electroencephalography: An Introductory Text and Atlas of Normal and Abnormal Findings in Adults, Children, and Infants (American Epilepsy Society, Chicago, 2016). [PubMed] [Google Scholar]
- 10. Garcia‐Morales, I. et al Periodic lateralized epileptiform discharges etiology, clinical aspects, seizures, and evolution in 130 patients. J. Clin. Neurophysiol. 19, 172–177 (2002). [DOI] [PubMed] [Google Scholar]
- 11. Mecarelli, O. et al EEG patterns and epileptic seizures in acute phase stroke. Cerebrovasc. Dis. 31, 191–198 (2011). [DOI] [PubMed] [Google Scholar]
- 12. Santoshkumar, B. et al Prevalence of benign epileptiform variants. Clin. Neurophysiol. 120, 856–861 (2009). [DOI] [PubMed] [Google Scholar]
- 13. Monin, J. et al Prevalence of benign epileptiform variants during initial EEG examination in French military aircrew. Clin. Neurophysiol. 48, 171–178 (2018). [DOI] [PubMed] [Google Scholar]
- 14. Stimmel, G.L. & Dopheide, J.A. Psychotropic drug‐induced reductions in seizure threshold. CNS Drugs 5, 37–50 (1996). [Google Scholar]
- 15.Clozaril® [prescribing information]. (Novartis Pharmaceuticals Corporation East Hanover, NJ, 2014). [Google Scholar]
- 16. Zyprexa® [prescribing information]. (Lilly USA, LLC, Indianapolis, IN, 2018). [Google Scholar]
- 17. Acomplia® . Summary of Product Characteristics, European Medical Agency (2006).
- 18. Hara, H. Autism and epilepsy: a retrospective follow‐up study. Brain Develop. 29, 486–490 (2007). [DOI] [PubMed] [Google Scholar]
- 19. Parmeggiani, A. et al Epilepsy and EEG paroxysmal abnormalities in autism spectrum disorders. Brain Develop. 32, 783–789 (2010). [DOI] [PubMed] [Google Scholar]
- 20. Domanska‐Pakiela, D. et al EEG abnormalities preceding the epilepsy onset in tuberous sclerosis complex patients. A prospective study of 5 patients. Eur. J. Paediatr. Neurol. 18, 458–468 (2014). [DOI] [PubMed] [Google Scholar]
- 21. Strzelczyk, A. et al Prospective evaluation of a post‐stroke epilepsy risk scale. J. Neurol. 257, 1322–1326 (2010). [DOI] [PubMed] [Google Scholar]
- 22. Malow, B.A. et al Spectrum of EEG abnormalities during clozapine treatment. Electroencephalogr. Clin. Neurophysiol. 91, 205–211 (1994). [DOI] [PubMed] [Google Scholar]
- 23. Freudenreich, O. et al Clozapine‐induced electroencephalogram changes as a function of clozapine serum levels. Biol. Psych. 42, 132–137 (1997). [DOI] [PubMed] [Google Scholar]
- 24. Guenther, W. et al EEG alterations and seizures during treatment with clozapine. Pharmacopsychiatry 26, 69–74 (1993). [DOI] [PubMed] [Google Scholar]
- 25. Schuld, A. et al A comparison of the effects of clozapine and olanzapine on the EEG in patients with schizophrenia. Pharmacopsychiatry 33, 109–111 (2000). [DOI] [PubMed] [Google Scholar]
- 26. Amann, B.L. et al EEG abnormalities associated with antipsychotics: a comparison of quetiapine, olanzapine, haloperidol and healthy subjects. Hum. Psychopharmacol. Clin. Exp. 18, 641–646 (2003). [DOI] [PubMed] [Google Scholar]
- 27. Macaluso, M. et al Twenty percent of a representative sample of patients taking bupropion have abnormal, asymptomatic electroencephalographic findings. J. Clin. Psychopharmacol. 30, 312–317 (2010). [DOI] [PubMed] [Google Scholar]
- 28. Yli‐Hankala, A. et al Epileptiform electroencephalogram during mask induction of anesthesia with sevoflurane. Anesthesiology 91, 1596–1603 (1999). [DOI] [PubMed] [Google Scholar]
- 29. Vakkuri, A. et al Epileptiform EEG during sevoflurane mask induction: effect of delaying the onset of hyperventilation. Acta Anaesthesiol. Scand. 44, 713–719 (2000). [DOI] [PubMed] [Google Scholar]
- 30. Iijima, T. et al The epileptogenic properties of the volatile anesthetics sevoflurane and isoflurane in patients with epilepsy. Anesth. Analg. 91, 989–995 (2000). [DOI] [PubMed] [Google Scholar]
- 31. Iasonos, A. & O'Quigley, J. Adaptive dose‐finding studies: a review of model‐guided phase I clinical trials. J. Clin. Oncol. 32, 2505–2511 (2014). [DOI] [PMC free article] [PubMed] [Google Scholar]
- 32. Sturm, S. et al Results and evaluation of a first‐in human study of RG7342, a mGlu5 positive allosteric modulator, utilizing Bayesian adaptive methods. Br. J. Clin. Pharmacol. 84, 445–455 (2018). [DOI] [PMC free article] [PubMed] [Google Scholar]
- 33. Yeung, W.Y. et al Bayesian adaptive dose‐escalation designs for simultaneously estimating the optimal and maximum safe dose based on safety and efficacy. Pharm. Stat. 16, 396–413 (2017). [DOI] [PubMed] [Google Scholar]
- 34. Sabanes Bove, D. & Yeung, W.Y. Using the package crmPack: introductory examples <https://cran.r-project.org/web/packages/crmPack/vignettes/example.pdf>.
- 35. Neuenschwander, B. et al Critical aspects of the Bayesian approach to phase I cancer trials. Stat. Med. 27, 2420–2439 (2008). [DOI] [PubMed] [Google Scholar]
- 36. Flink, R. et al Guidelines for the use of EEG methodology in the diagnosis of epilepsy. Act. Neurol. Scand. 106, 1–7 (2002). [DOI] [PubMed] [Google Scholar]
- 37. Buchthal, F. & Lennox, M. The EEG effect of metrazol and photic stimulation in 682 normal subjects. EEG Clin. Neurophysiol. 5, 545–558 (1953). [DOI] [PubMed] [Google Scholar]
- 38. So, E.L. Interictal epileptiform discharges in persons without a history of seizures: what do they mean? J. Clin. Neurophysiol. 27, 229–238 (2010). [DOI] [PubMed] [Google Scholar]
- 39. Robin, J.J. et al Ten‐year experience with abnormal EEGs in asymptomatic adult males. Aviat. Space Environ. Med. 49, 732–736 (1978). [PubMed] [Google Scholar]
- 40. Hendriksen, I.J. & Elderson, A. The use of EEG in aircrew selection. Aviat. Space Environ. Med. 72, 1025–1033 (2001). [PubMed] [Google Scholar]
- 41. Gregory, R.P. et al Electroencephalogram epileptiform abnormalities in candidates for aircrew training. Electroencephalogr. Clin. Neurophysiol. 86, 75–77 (1993). [DOI] [PubMed] [Google Scholar]
- 42. Salinsky, M. et al Effectiveness of multiple EEGs in supporting the diagnosis of epilepsy: an operational curve. Epilepsia 28, 331–334 (1987). [DOI] [PubMed] [Google Scholar]
- 43. Shafi, M.M. et al Absence of early epileptiform abnormalities predicts lack of seizures on continuous EEG. Neurology 79, 1796–1801 (2012). [DOI] [PMC free article] [PubMed] [Google Scholar]
- 44. Westover, M.B. et al The probability of seizures during EEG monitoring in critically ill adults. Clin. Neurophysiol. 126, 463–471 (2015). [DOI] [PMC free article] [PubMed] [Google Scholar]
- 45. Bianchi, A. et al Family study of epilepsy in first degree relatives: data from the Italian episcreen study. Seizure 12, 203–210 (2003). [DOI] [PubMed] [Google Scholar]
- 46. Peljto, A.L. et al Familial risk of epilepsy: a population‐based study. Brain 137, 795–805 (2014). [DOI] [PMC free article] [PubMed] [Google Scholar]
- 47. Sfaihi, L. et al Febrile seizures: an epidemiological and outcome study of 482 cases. Childs Nerv. Syst. 28, 1779–1784 (2012). [DOI] [PubMed] [Google Scholar]
- 48. Ostergaard, J.R. Febrile seizures. Acta Paed. 98, 771–773 (2008). [DOI] [PubMed] [Google Scholar]
- 49. Graves, R.C. et al Febrile seizures: risks, evaluation, and prognosis. Am. Fam. Physician 85, 149–153 (2012). [PubMed] [Google Scholar]
- 50. Mittal, R. Recent advances in febrile seizures. Indian J. Pediatr. 81, 909–916 (2014). [DOI] [PubMed] [Google Scholar]
- 51. Eeg‐Olofsson, O. et al The development of the encephalogram in normal children from the age of 1 through 15 years. Neuropaediatrie 2, 375–404 (1971). [DOI] [PubMed] [Google Scholar]
- 52. Cavazzuti, G.B. et al Longitudinal study of epileptiform patterns in normal children. Epilepsia 21, 43–55 (1980). [DOI] [PubMed] [Google Scholar]
- 53. Borusiak, P. et al Prevalence of epileptiform discharges in healthy children—new data from a prospective study using digital EEG. Epilepsia 51, 1185–1187 (2010). [DOI] [PubMed] [Google Scholar]
- 54. Nagayama, T. Adverse drug reactions for medicine newly approved in Japan from 1999 to 2013: syncope/loss of consciousness and seizures/convulsions. Reg. Toxicol. Pharmacol. 72, 572–577 (2015). [DOI] [PubMed] [Google Scholar]
- 55. Kumlien, E. & Lundberg, P.O. Seizure risk associated with neuroactive drugs: data from the WHO adverse drug reactions database. Seizure 19, 69–73 (2010). [DOI] [PubMed] [Google Scholar]
- 56. Lertxundi, U. et al Antipsychotics and seizures: higher risk with atypicals? Seizure 22, 141–143 (2013). [DOI] [PubMed] [Google Scholar]
- 57. Elander, M. Drug‐induced convulsions in nonclinical safety studies: implication for clinical development. Drug Dev. Res. 74, 155–161 (2013). [Google Scholar]
- 58. Scaramelli, A. et al Prodromal symptoms in epileptic patients: clinical characterization of the pre‐ictal phase. Seizure 18, 246–250 (2009). [DOI] [PubMed] [Google Scholar]
- 59. Walczak, T.S. et al Prevalence and features of epilepsy without interictal epileptiform discharges [abstract]. Neurology 43 (suppl. 2), A287–A288 (1993). [Google Scholar]
- 60. Badry, R. Latency to the first epileptiform activity in the EEG of epileptic patients. Int. J. Neurosci. 123, 646–649 (2013). [DOI] [PubMed] [Google Scholar]
- 61. Chez, M.G. et al Frequency of epileptiform EEG abnormalities in a sequential screening of autistic patients with no known clinical epilepsy from 1996 to 2005. Epilepsy Behav. 8, 267–271 (2006). [DOI] [PubMed] [Google Scholar]
- 62. Hughes, J.R. & Melyn, M. EEG and seizures in autistic children and adolescents: further findings with therapeutic implications. Clin. EEG Neurosci. 36, 15–20 (2005). [DOI] [PubMed] [Google Scholar]
- 63. King, M.A. et al Epileptology of the first‐seizure presentation: a clinical, electroencephalographic, and magnetic resonance imaging study of 300 consecutive patients. Lancet 352, 1007–1011 (1998). [DOI] [PubMed] [Google Scholar]
- 64. Fountain, N.B. et al Sleep deprivation activates epileptiform discharges independent of the activating effects of sleep. J. Clin. Neurophysiol. 15, 69–75 (1998). [DOI] [PubMed] [Google Scholar]
- 65. Carpay, J.A. et al The diagnostic yield of a second EEG after partial sleep deprivation: a prospective study in children with newly diagnosed seizures. Epilepsia 38, 595–599 (1997). [DOI] [PubMed] [Google Scholar]
- 66. Liporace, J. et al Clinical utility of sleep‐deprived versus computer‐assisted ambulatory 16‐channel EEG in epilepsy patients: a multi‐center study. Epilepsy Res. 32, 357–362 (1998). [DOI] [PubMed] [Google Scholar]
- 67. Ellingson, R.J. et al Efficacy of sleep deprivation as an activation procedure in epilepsy patients. J. Clin. Neurophysiol. 1, 83–101 (1984). [DOI] [PubMed] [Google Scholar]
- 68. Jabbari, B. et al Electroencephalogram of asymptomatic adult subjects. Clin. Neurophysiol. 111, 102–105 (2000). [DOI] [PubMed] [Google Scholar]