

Several influential cognitive theories (e.g., Beck et al., 1985) suggest that biases in information processing play a significant role in the etiology and maintenance of emotional disorders. Numerous studies have demonstrated that individuals with emotional disorders display information processing biases across multiple cognitive domains such as memory and attention (Mathews & MacLeod, 2005). Interpretation Bias (IB), the tendency to interpret ambiguous information in a negative or threatening manner, is a specific type of cognitive bias that has been implicated in the development of emotional disorders such as Social Anxiety Disorder (SAD) and depression (for a recent review, see Hirsch, Meeten, Krahe, & Clare Reeder, 2016). Individuals with these disorders tend to exhibit a negative IB, whereas individuals without emotional disorders tend to generate benign interpretations of ambiguous stimuli (Stopa& Clark, 2000; Voncken et al., 2007). Given the critical role of IB in the development and maintenance of emotional disorders, psychological treatments have targeted negative IB through various techniques designed to help an individual reappraise ambiguous situations (e.g., Barlow et al., 2011; Becker & Heimberg, 2002;).
Attempts to empirically characterize the construct of IB in the lab have been conducted since the 1980s (e.g., Butler & Mathews, 1983). Researchers have created a variety of methods to examine and experimentally modify IB. Paradigms developed to assess IB are generally categorized as “offline” or “online” depending upon the amount of time participants are given to resolve the ambiguity of the stimuli presented. Offline methods provide an assessment of IB, after a period of reflection, using recall and question answering methods. Online methods often use reaction time to assess interpretations made at the moment an individual encounters ambiguity (Hirsch & Mathews, 2000). Common offline tasks include rank ordering experimenter-generated interpretations of ambiguous scenarios, finishing open-ended sentences, and scenario recognition tasks (for a review, see Hirsch et al., 2016). A number of studies utilizing offline methodology suggest that individuals with emotional disorders interpret ambiguous information in a negative and threatening manner compared to individuals without emotional disorders (e.g., Amir, Foa, & Coles, 1998; Huppert et al., 2003).
Despite relatively strong empirical support and ease of administration and scoring, offline measures of IB suffer from several weaknesses. Hirsch et al. (2016) noted that offline methods tend to be subject to demand effects, selection biases, and response biases that limit the utility of these instruments. Moreover, they do not capture the interpretation immediately generated when individuals first encounter an ambiguous situation. Due to these limitations, researchers developed online methodologies to assess IB.
Online measures of IB typically rely on an individual’s reaction time to make decisions about benign versus threatening resolutions of ambiguous stimuli. For example, in Hirsch & Mathews (1997; 2000), participants read ambiguous situations and then made rapid lexical and grammatical decisions about a final word that resolved the situation in either a positive or threatening manner. They found that non-anxious participants were faster to make decisions when the final word was a positive resolution of the ambiguous scenarios, whereas individuals with social anxiety disorder (SAD) made equally fast decisions for both positive and negative resolutions. Studies investigating online interpretive biases in disorders other than SAD remain scarce; though there is some evidence of online interpretive biases in individuals with panic disorder (PD) (e.g., Schneider & Schulte, 2007). Despite accounting for several of the limitations inherent in offline methodologies, online methods remain underutilized in the literature.
Beard and Amir (2008; 2009) developed a measure of IB called the Word-Sentence Association Paradigm (WSAP) that includes both offline and online components and assesses benign and negative interpretations separately. In the original version of the WSAP, each trial consists of four steps. First, a fixation cross is presented on a computer screen for 500ms. This directs participants’ attention towards the screen to alert them that a trial is starting. Second, a word representing either a benign interpretation (e.g., “funny”) or a threat interpretation (e.g., “embarrassing”) appears on the screen for 500ms. Third, an ambiguous sentence (e.g., “People laugh after something you said”) appears and remains on the screen until participants press the spacebar on the keyboard to indicate they have finished reading the sentence. Fourth, participants are prompted to press a key if they think the word and sentence were related or press a different key if they think the word and sentence were unrelated. The WSAP differs from other IB assessment instruments in that it provides two types of responses for analysis: endorsement or accuracy rates (i.e. relatively “offline”) and reaction time data (i.e. “online”). Specifically, the WSAP results in two primary indices of interpretation: (1) percentage of benign interpretations endorsed and (2) percentage of threat interpretations endorsed, and four reaction time variables: response latency to (1) endorse benign (2) reject benign (3) endorse threat (4) reject threat. Researchers sometimes combine these various WSAP indices to create bias scores.
In the initial WSAP validation study, undergraduates with high and low levels of social anxiety (SA) completed 110 trials of the WSAP (Beard & Amir, 2009). Results indicated that individuals high in SA were slower to reject and faster to endorse threatening interpretations of ambiguous social sentences than non-anxious controls. Similarly, those high in SA were also quicker to reject and slower to endorse positive interpretations of social sentences. The endorsement indices revealed that the participants high in SA endorsed positive and threatening interpretations at similar rates, whereas the non-anxious controls strongly favored positive interpretations over threat interpretations. In a follow-up study utilizing the WSAP in a clinical sample of individuals diagnosed with SAD, Amir et al. (2012) similarly found that the SAD group lacked a positive IB relative to non-anxious controls.
In addition to its utility as an assessment instrument, the WSAP has been adapted for Cognitive Bias Modification for Interpretations (CBM-I). CBM was originally designed as a method for altering cognitive biases experimentally, in order to test causal relationships between interpretation bias and emotional vulnerability. Whereas psychotherapy attempts to modify cognitive biases through explicit verbal process (e.g., instructing patient how to challenge biases), CBM relies on a more implicit, experiential process. As described by Koster, Fox, & MacLeod (2009, p. 3), CBM consists of two primary features: first, the direct target of change is a cognitive bias “known to characterize a clinical disorder, a clinically relevant symptom, or a personality trait associated with vulnerability to clinical dysfunction”; and second, the methodology of manipulating the target cognitive bias has not primarily utilized verbal instruction, but rather involved a process of repeated practice of a specific cognitive task.
When used for purposes of CBM-I, participants completing the WSAP task are given feedback as to whether their responses are “correct” or “incorrect” to train a more benign interpretation bias. Specifically, participants are “correct” when they endorse positive and reject negative interpretations. The CBM-I version of the WSAP has been shown to effectively shift IB, and these changes in IB have been associated with reductions in a variety of symptoms including anxiety and rumination (see Beard & Amir, 2008; Beard et al., 2016; Capron & Schmidt, 2016; Menne-Lothmann et al., 2014).
Given its utility as both an assessment of IB and a CBM-I intervention, and its appealing features (separate assessment of benign and threat interpretations and of offline and online interpretations), researchers have increasingly used the WSAP. In view of this expansion in use, a review of how the WSAP has been adapted for various populations is warranted. We sought to provide a systematic review of studies using the WSAP for several reasons. First, researchers have created adapted versions of the WSAP to assess IB across numerous disorders including depression (e.g., Cowden-Hindash & Amir, 2012), Body Dysmorphic Disorder (Summers & Cougle, 2016), OCD (e.g., Amir, Kuckertz, Najmi, & Conley, 2015) and PD (Beard et al., 2016). In addition to expanding to new populations, researchers have also modified the original task parameters (e.g., stimulus presentation time). A review of populations and versions of the WSAP may aid researchers in selecting an appropriate measure of IB or type of CBM-I for their specific population.
Second, as with any type of assessment, establishing the reliability of information processing assessments is crucial to ensure replicability of findings across studies and to detect changes over time in the context of an intervention. Given the problems with unreliability of other information processing tasks (i.e., dot probe, Shmukle, 2005), it is especially important to establish the WSAP’s reliability before its use becomes more widespread. Thus, we sought to identify studies that reported psychometric properties and summarize these data. Finally, we sought to summarize the range of effect sizes obtained when comparing clinical and healthy groups’ performance on the WSAP and comparing performance on the WSAP before and after a CBM-I intervention.
In this systematic review of studies that utilized the WSAP task, our overall aim was to assist investigators who may be interested in using the WSAP by compiling the literature on the ways in which it has been implemented to date, and considerations before selecting it as an instrument. We had three primary objectives: (1) characterize the different variations of the WSAP task (e.g., stimulus sets, timing parameters) in the literature and different populations for which the WSAP has been used; (2) provide data regarding the WSAP’s reliability; and (3) summarize effect sizes from existing studies.
Method
Eligibility Criterion
Eligible studies were peer-reviewed publications that included the WSAP task or a variation of the WSAP task as either an assessment of IB, modification of IB, or both.
Information Sources and Search
In March 2018, databases (i.e. PubMed, PsychInfo, PsychArticles, Academic Search Premier, Google Scholar, and the Brown University Library Article Search) were searched simultaneously with the keywords “WSAP” and “Word AND Sentence AND Association AND Paradigm” to identify studies published between 2008 and 2018. The WSAP task was first introduced in 2008 and thus articles published prior to this date were not relevant for the current study. Additionally, a manual review of authors identified through database searches was conducted. See Figure 1 for PRISMA flow diagram.
Figure 1.
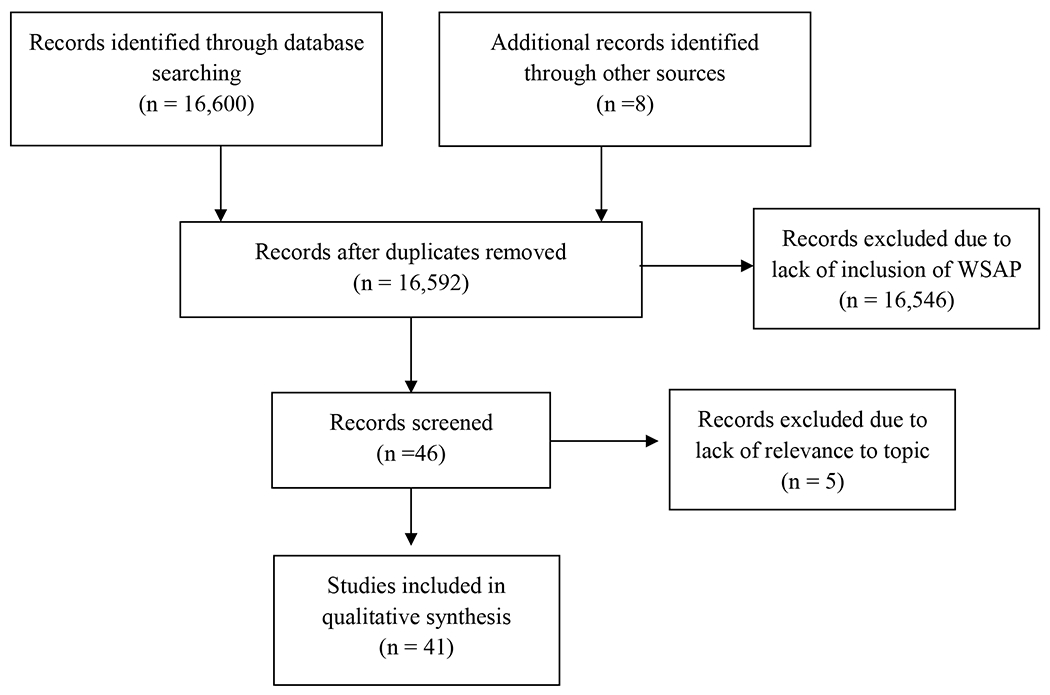
PRISMA Flow Diagram
Data Collection Process
Information pertaining to variations of the original WSAP task, study population, task administration, endorsement rates, and reaction time data were independently extracted (RLW and MG) and verified for accuracy. CB contacted authors to obtain means and standard deviations for WSAP variables that were not provided in the published articles. RLW and MG then independently extracted and verified the data obtained from investigators.
Data Items
The variables examined for the current study were endorsement rate percentages (e.g., benign and threat interpretations) and reaction time (RT) for endorsed and rejected word-sentence associations. Specifically, we extracted RT data for endorsement of negative interpretations, rejection of negative interpretations, endorsement of benign interpretations, and rejection of benign interpretations. No analyses were conducted for purposes of the current study. However, for studies that did not report effect sizes, we calculated Cohen’s d from reported means, standard deviations, and sample size.
Results
Our search yielded 41 papers that used the WSAP from 2008 until March of 2018.
Populations
Several studies have administered the WSAP to clinical populations of adults and youth (n = 17) diagnosed with PD (n = 1), OCD (n = 1), SAD (n = 3), Major Depressive Disorder (MDD; n = 2), Body Dysmorphic Disorder (BDD; n = 1), mixed anxiety disorders (n = 5),, a fear of cancer recurrence in breast cancer survivors (n = 1) and anger/hostility examined independently (n = 2) or in conjunction with Alcohol Use Disorder (AUD; n = 4). The WSAP has also been used in undergraduate and analogue community samples (n = 25). Please note that Smith et al. (2016) included both a clinical and undergraduate sample. See Table 1 for list of populations and other WSAP study characteristics.
Table 1.
WSAP Study Characteristics
| Study Name | Sample Type | Total Sample Size | Target Population | Adult or Youth | Mean Age | Age Range | Assessment and/or Modification of Interpretation Bias (IB) |
|---|---|---|---|---|---|---|---|
| 1. Amir & Taylor (2012) | Clinical | 49 | SAD | Adult | 31.13 | NA | Assessment and Modification of IB |
| 2. Amir, Kuckertz, Najmi, & Conley (2015) | Clinical | 22 | OCD | Adult | 31.50 | 17-62 | Assessment and Modification of IB |
| 3. Amir, Bomyea, & Beard (2010) | Undergraduate | 57 | SAD | Adult | 19.49 | NA | Modification of IB |
| 4. Amir, Prouvost, & Kuckertz (2012) | Clinical | 67 | SAD | Adult | 34.55 | NA | Assessment of IB |
| 5. Beard & Amir (2008) | Undergraduate | 27 | SAD | Adult | 19.52 | NA | Assessment and Modification of IB |
| 6. Beard & Amir (2009) | Undergraduate | 52 | SAD | Adult | 19.00 | NA | Assessment of IB |
| 7. Beard et al. (2016) | Clinical | 10 | PD | Adult | 51.00 | NA | Assessment and Modification of IB |
| 8. Beard, Rifkin, & Bjorgvinsson (2017) | Clinical | 65 | Depression | Adult | 32.98 | NA | Assessment of IB |
|
| |||||||
| 9. Beard, Weisberg, & Amir (2011) | Clinical | 32 | SAD | Adult | 37.38 | NA | Modification of IB |
|
| |||||||
| 10. Brosan et al. (2011) | Clinical | 13 | GAD; SAD | Adult | 37.33 | NA | Assessment and Modification of IB |
| 11. Capron & Schmidt (2016) | Undergraduate | 89 | Anxiety Sensitivity | Adult | 18.87 | NA | Assessment and Modification of IB |
| 12. Clerkin, Beard, Fisher, & Schofield (2015) | Undergraduate | 65 | Anxiety Sensitivity/PD | Adult | 18.59 | 18-22 | Assessment and Modification of IB |
| 13. Conley & Wu (2017) | Undergraduate | 74 | Contamination OCD | Adult | 19.40 | 18-28 | Assessment and Modification of IB |
| 14. Cowden Hindash & Amir (2012) | Undergraduate | 50 | Depression | Adult | 18.70 | NA | Assessment of IB |
| 15. Cowden Hindash & Rottenberg (2015) | Undergraduate | 115 | Depression | Adult | 21.68 | NA | Assessment of IB |
| 16. Cowden Hindash & Rottenberg (2017) | Undergraduate | 76 | Depression | Adult | 19.86 | NA | Assessment and Modification of IB |
| 17. Cougle et al. (2014) | Clinical | 106 | Trait Hostility | Adult | 37.20 | NA | Assessment of IB |
| 18. Cougle et al. (2017) | Clinical | 58 | Alcohol Use Disorder (AUD); Trait Anger | Adult | 40.71 | 20-62 | Assessment of IB |
|
| |||||||
| 19. Dillon et al. (2015) | Undergraduate | 517; 100; 183; 215 | Trait Hostility | Adult | 19.51; 18.98; 36.77; 36.21 | 18-44; 18-25; NA; NA | Assessment of IB |
|
| |||||||
| 20. Dryman & Heimberg (2015) | Undergraduate | 100 | SAD | Adult | 22.07 | NA | Assessment of IB |
| 21. Kuckertz, Amir, Tobin, & Najmi (2013) | Undergraduate | 103 | OCD | Adult | 19.37 | NA | Assessment of IB |
| 22. Lichtenthal et al. (2017) | Clinical | 97 | Breast Cancer Survivors with Fear of Recurrence | Adult | 55.15 | NA | Assessment and Modification of IB |
| 23. Macdonald, Koerner, & Antony (2013) | Analogue | 34 | Anxiety Sensitivity | Adult | 32.79 | NA | Modification of IB |
|
| |||||||
| 24. Martinelli, Holzinger, & Chasson (2014) | Undergraduate | 214 | Body Dissatisfaction | Adult | 20.00 | 18-33 | Assessment of IB |
| 25. Matheny et al. (2016, Study 2) | Analogue | 131 | Hostility | Adult | 34.35 | 18-63 | Assessment of IB |
| 26. McDermott et al. (2017) | Clinical | 131 | Trait Anger | Adult | 34.35 | 18-63 | Assessment of IB |
| 27. Mobius et al. (2015) | Undergraduate | 81; 105 | Depression | Adult | 23.05; 20.11 | NA; NA | Assessment and Modification of IB |
|
| |||||||
| 28. Oglesby, Allan, & Schmidt (2017) | Undergraduate | 79 | Intolerance of Uncertainty | Adult | 18.86 | 18-22 | Assessment and Modification of IB |
|
| |||||||
| 29. Oglesby et al. (2016) | Undergraduate | 76; 31 | Intolerance of Uncertainty | Adult | 19.13; 19.09 | 18-35; 18-38 | Assessment of IB |
|
| |||||||
| 30. Ogniewicz et al. (2014) | Undergraduate | 148 | GAD | Adult | 27.19 | NA | Assessment of IB |
| 31. Rozenman, Amir, & Weersing (2014) | Clinical | 26 | Youth with SAD, GAD, Separation Anxiety | Youth | 12.65 | 9-17 | Assessment of IB |
| 32. Rozenman, Vreeland, & Piacentini (2017) | Clinical | 46 | Youth with SAD, GAD, Separation Anxiety | Youth | 13.17 | 9-17 | Assessment of IB |
| 33. Salemink et al. (2013) | Undergraduate/ Community | 72 | SAD | Adult | 23.64 | 18-35 | Assessment of IB |
| 34. Salemink & Wiers (2014) | Undergraduate | 92 | Alcohol-related | Adult | 22.70 | NA | Assessment of IB |
| 35. Smith, Dillon, & Cougle (2018) | Undergraduate/ Analogue | 40 | Depression/ Hostility | Adult | 19.30 | 18-29 | Assessment and Modification of IB |
|
| |||||||
| 36. Smith et al. (2016) | Undergraduate/ Clinical | 71; 132 | Depression/ Hostility | Adult | 18.90; 34.5 | NA; 18-63 | Assessment of IB |
|
| |||||||
| 37. Sherman & Ehrenreich-May (2017) | Clinical | 30 | Anxiety Disorders | Youth | 12.17 | 8-17 | Assessment of IB |
|
| |||||||
| 38. Steinman & Teachman (2014) | Undergraduate & Analogue | 110 | Acrophobia | Adult | 23.63 | 18-67 | Modification of IB |
| 39. Summers & Cougle (2016) | Clinical | 38 | BDD | Adult | 19.79 | NA | Assessment and Modification of IB |
|
| |||||||
| 40. Viana et al. (2016) | Clinical | 44 | Anxiety Disorders | Youth | 9.60 | 8-12 | Assessment of IB |
| 41. Yang et al. (2017) | Undergraduate | 76 | Social Anxiety | Adult | 21.23 | NA | Assessment and Modification of IB |
Stimuli Content
The original WSAP task consisted of 76 ambiguous sentences that described social situations (e.g., “A friend does not respond when you wave hello”) and 34 sentences that described non-social, general anxiety situations (e.g., “Part of the building is blown up”). Each sentence was paired with both a threat interpretation word (e.g., “mad” or “terrorist”) and a benign interpretation word (e.g., “distracted” or “construction”). Our review revealed that researchers have developed several different sets of stimuli relevant to various disorder or symptom domains.
Clerkin et al. (2015) developed word-sentence pairs relevant to individuals high in anxiety sensitivity. For example, in that study, the authors paired the ambiguous sentence (e.g., “You wake up in the morning and it is hard to swallow”) with a panic-relevant threatening (e.g., “choking”) and benign (e.g., “thirsty”) interpretation. Other studies have modified and developed stimuli to target depression (e.g., Cowden-Hindash & Rottenberg, 2015), OCD (Kuckertz, Amir, Tobin, & Najmi, 2013), smoking (Cougle, Hawkins, Macatee, Saragwi, & Zvolensky, 2014), hostility (Dillon et al., 2016), intolerance of uncertainty (Oglesby, Raines, Short, Capron, & Schmidt, 2016), fear of heights (Steinman & Teachman, 2014), and alcohol use (Salemink & Wiers, 2014). WSAP stimuli have also been adapted for use with children and adolescents (Rozenman, Amir, & Weersing, 2014). In total, including the original stimuli set, we found 21 different types of stimuli. See Table 2 for full list of changes to WSAP stimuli content.
Table 2.
Changes to WSAP Stimuli Content
| Study Name | Stimuli | Changes to Stimulus Content |
|---|---|---|
| Beard et al. (2016) | PD | Stimuli modified to target PD-related physical sensations and situations where individual may feel trapped |
| Beard, Rifkin, & Bjorgvinsson (2017) | Depression | Stimuli modified to include word-sentence pairs relevant to depression and failure experiences |
| Brosan et al. (2011) | GAD/SAD | Included word pairs relevant to both GAD and SAD; inclusion of non-social threat scenarios (e.g., threatening health information) |
| Capron & Schmidt (2016) | Anxiety Sensitivity | Word-sentence pairs modified to be relevant for anxiety sensitivity |
| Clerkin et al. (2015) | PD | Word-sentence pairs modified for relevance with PD |
| Conley & Wu (2017) | Contamination OCD | Word-sentence pairs created for relevance with contamination OCD |
| Cowden-Hindash & Amir (2012); Cowden-Hindash & Rottenberg (2015; 2017); Mobius et al. (2015) | Depression | Ambiguous sentences modified to be “depression relevant” |
| Cougle et al. (2014; 2017); Dillon et al. (2016); McDermott et al. (2017); Smith et al. (2016); Smith, Dillon, & Cougle (2018) | Hostility | Stimuli modified to target hostile interpretation bias |
| Dryman & Heimberg (2015) | SAD | Eliminated “neutral” words to leave unambiguously “positive” and “negative” words followed by ambiguous sentences |
| Kuckertz et al. (2013) | OCD | Word-sentence pairs modified to target OCD-related threats |
| Lichtenthal et al. (2017) | Breast Cancer; Fear of Cancer Recurrence | Word-sentence pairs modified to target fear of cancer recurrence |
| Macdonald et al. (2013) | Anxiety Sensitivity | Word-sentence pairs modified to target anxiety sensitivity |
| Oglesby et al. (2016); Oglesby, Allan, & Schmidt (2017) | Intolerance of Uncertainty | Phrases and sentences modified to reflect “uncertainty” as opposed to social situations |
| Ogniewicz et al. (2014) | GAD | Words and sentences modified to reflect 10 different domains of worry (e.g., health of self, health of others, relationships) |
| Rozenman, Amir, & Weersing (2014); Rozenman, Vreeland, & Piacentini (2017); Sherman & Ehrenreich-May (2017) | SAD, GAD, Separation Anxiety | Modified word-sentence pairs to be “developmentally appropriate” for youths aged 8-17. Stimuli targeted a range of anxiety-related concerns, in addition to socially threatening scenarios |
| Salemink & Wiers (2014) | Alcohol-related | Stimuli adapted to assess alcohol-related memory associations |
| Steinman & Teachman (2014) | Acrophobia | Stimuli modified to be “height relevant” |
| Summers & Cougle (2016) | BDD | Word-sentence pairs adapted to assess BDD-threat related biases |
| Viana et al. (2016) | Anxiety Disorders | Word-sentence pairs adapted to reflect situations encountered by children |
| Yang et al. (2017) | Social Anxiety | Word-sentence pairs revised to “reflect Chinese students’ situations”; Rewrote the 24 types of social contact situations found in the Liebowitz (1987) scale in the national context of China; translated into Chinese |
Task Parameters
In addition to content changes, researchers have modified the presentation order and timing parameters of the WSAP. Capron & Schmidt (2016) modified word-sentence pairs such that the prime word was ambiguous (e.g., “tingly”), and the sentence that followed represented a benign (e.g., “You lightly bang your elbow and it feels funny”) or threatening interpretation (e.g., “Something is terribly wrong with you”). Other task variations included shifting order of sentence/word pairs (e.g., presenting ambiguous sentence first) and eliminating pressing spacebar (i.e. verification participant read and understood sentence) prior to providing relatedness ratings (e.g., Beard et al., 2016; Kuckertz et al. 2013).
In the original version of the WSAP, the prime word was presented for 500ms, which was intended to encourage speeded responding and discourage reflective, elaboration. Our review revealed that 12 of the 41 studies altered the presentation time. Modified presentation times ranged from 750ms to 2500ms (e.g., Martinelli, Holzinger, & Chasson, 2014; Mobius et al., 2015), with 1000ms being the most common alternative time used.
Researchers have also modified the response required from participants regarding the relatedness of the word-sentence pairs. For example, in contrast to the original yes/no response, some studies used Likert-type scales (e.g., rating similarity between word/sentence pairs on “0-6” scale) without collection of RT data to measure relatedness (n = 9). See Table 3 for full list of timing and presentation modifications.
Table 3.
WSAP Order, Timing, and Scoring Changes
| Study Name | Change in Order of Presentation | Change in Timing (original version 500ms) | Change in Scoring |
|---|---|---|---|
| Brosan et al. (2011) | N/A | Presented initial word(s) at beginning of task for 1 second | N/A |
| Capron & Schmidt (2016) | “Flipped” traditional presentation; ambiguous word presented first, followed by sentence that resolved pair in a either a benign or threatening fashion | Presented initial word(s) at beginning of task for 1 second | N/A |
| Cowden-Hindash & Amir (2012) | Ambiguous sentence presented first, followed by a negative or benign word | Presented initial sentence at beginning of task for 1 second | N/A |
| Cowden-Hindash & Rottenberg (2015) | Ambiguous sentence presented first, followed by a negative or benign word | Presented initial sentence at beginning of task for 1 second | N/A |
| Cowden-Hindash & Rottenberg (2017) | Ambiguous sentence presented first, followed by a negative or benign word | Presented initial sentence at beginning of task for 1 second | N/A |
| Cougle et al. (2014) | Ambiguous sentence presented first, followed by threatening or benign word | N/A | Participants chose number (1-6) to indicate relatedness between word-sentence pairs |
|
Cougle et al. (2017) |
Ambiguous sentence presented first, followed by threatening or benign word | N/A | Participants chose number (1-6) to indicate relatedness between word-sentence pairs |
|
Dillon et al. (2015) |
Ambiguous sentence presented first, followed by threatening or benign word | N/A | Participants chose number (1-6) to indicate relatedness between word-sentence pairs |
| Kuckertz et al. (2013) | Ambiguous sentence presented first, followed by threatening or benign word | N/A | Participants chose number (1-7) to indicated relatedness between word-sentence pairs |
| Martinelli et al. (2014) | N/A | Presented initial word on screen for 750ms | N/A |
| Matheny et al. (2016) | Participants presented 16 word-sentence pairs twice; once with ambiguous word and once with hostile word | N/A | Participants chose number (1-6) to indicate relatedness between word-sentence pairs |
| McDermott et al. (2017) | Ambiguous sentence presented first, followed by threatening or benign word | N/A | Participants chose number (1-6) to indicate relatedness between word-sentence pairs |
| Mobius et al. (2015) | Ambiguous sentence presented first followed by benign or threatening word | First sentence on screen for 2,500ms | N/A |
| Oglesby, Allan, & Schmidt (2017) | Ambiguous phrase presented first (e.g., “Doctor called”), followed by negative (e.g., “I have a terrible disease”) or a benign (e.g., “Appointment reminder”) interpretation | Presented initial ambiguous phrase for 1 second | N/A |
| Oglesby et al. (2016) | Ambiguous phrase presented first (e.g., “Doctor called”), followed by negative (e.g., “I have a terrible disease”) or a benign (e.g., “Appointment reminder”) interpretation | Presented initial ambiguous phrase for 1 second | N/A |
| Salemink & Wiers (2014) | Alcohol or non-alcohol related word presented first, followed by one of three types of sentences (i.e. ambiguous positive affect, ambiguous negative affect, and neutral affect) | Initial word on screen for 1 second | N/A |
| Sherman & Ehrenreich-May (2017) | N/A | First sentence on screen for 1,500ms | N/A |
|
Smith, Dillon, & Cougle (2018) |
Ambiguous sentence presented first, followed by threatening or benign word | N/A | Participants chose number (1-6) to indicate relatedness between word-sentence pairs |
|
Smith et al. (2016) |
Ambiguous sentence presented first, followed by threatening or benign word | N/A | Participants chose number (1-6) to indicate relatedness between word-sentence pairs |
| Summers & Cougle (2016) | Ambiguous sentence presented first, followed by threatening or benign word | N/A | Participants chose number (1-6) to indicate relatedness between word-sentence pairs |
|
Viana et al. (2016) |
Ambiguous sentence appeared with two words that represent either a threatening or benign interpretation; Participants then chose which word fit best with the sentence | Sentence and two words presented until participant responds | N/A |
Reliability
Reliability estimates were provided in 10 experiments involving hostility/anger stimuli, two experiments with body dissatisfaction or BDD stimuli, one with SAD stimuli, and one with OCD stimuli. Two studies used the original WSAP yes/no response option and yielded acceptable internal consistency for benign and threat interpretation endorsement (alphas ranged from .71 to .85), and reaction time bias scores (alpha = .93). Additionally, test-retest reliability over an average of 12 days was good in a study using a version of the WSAP assessing IB related to body dissatisfaction-relevant stimuli (r = .71; Martinelli et al., 2014).
Six studies used a modified version of the WSAP that required participants to rate the relatedness of prime words to ambiguous sentences using a Likert scale (1 to 6) and used stimuli relevant to hostility. This version of the WSAP demonstrated excellent internal consistency for benign interpretations (alphas range from .84 to .95) and hostile interpretations (alphas range from .83 to .94) and approached acceptable test-retest reliability over a one-month period (r = .65; Dillon et al., 2015). Finally, two studies utilized a Likert scale response option for stimuli relevant to OCD and two studies for stimuli relevant Body Dysmorphic Disorder also demonstrated acceptable internal consistency (alphas range from .72 to .92). It is difficult to draw conclusions regarding any differences in reliability across types of stimuli/populations due to the small numbers of studies reporting reliability for specific populations. However, of the data available, studies using stimuli related to hostility and social anxiety appear to have the higher estimates of internal consistency compared to the one study with OCD stimuli and to those with body-dissatisfaction related stimuli. See Table 4 for all reliability estimates.
Table 4.
Internal Consistency Estimates for WSAP Indices
| Study | Sample Size | Stimuli | Response Option | Benign Endorsement | Threat/Negative Endorsement | Combined/ Overall Bias | Reaction Time |
|---|---|---|---|---|---|---|---|
| Cougle et al. (2014) |
106 |
Trait Hostility |
Likert Scale 1-6 |
0.94 |
0.91 |
NA |
NA |
| Cougle et al. (2017) | 58 | AUD; Trait Anger | Likert Scale 1-6 | 0.85-0.95 | 0.89-0.94 | NA | NA |
| Dillon et al. (2015) Experiment 1 |
517 |
Trait Hostility |
Likert Scale 1-6 |
0.9 |
0.87 |
NA |
NA |
|
Experiment 2 |
100 |
Trait Hostility |
Likert Scale 1-6 |
0.88 |
0.9 |
NA |
NA |
|
Experiment 3 |
183 |
Trait Hostility |
Likert Scale 1-6 |
0.87 |
0.83 |
NA |
NA |
|
Experiment 4 |
215 |
Trait Hostility |
Likert Scale 1-6 |
0.9 |
0.88 |
NA |
NA |
| Dryman & Heimberg (2015) |
100 |
SAD |
Yes/No |
0.83 |
0.85 |
NA |
0.93 |
| Kuckertz, Amir, Tobin, & Najmi (2013) |
103 |
OCD |
Likert Scale 1-6 |
0.72 |
0.77 |
NA |
NA |
|
Martinelli, Holzinger, & Chasson (2014)
|
214 |
Body Dissatisfaction |
Yes/No |
NA |
NA |
0.71 |
NA |
| Matheny et al. (2016, Study 2) |
131 |
Hostility |
Likert Scale 1-6 |
0.94 |
0.91 |
NA |
NA |
| McDermott et al. (2017) | 131 | Trait Anger | Likert Scale 1-6 | 0.87 | 0.95 | NA | NA |
|
Smith, Dillon, & Cougle (2018) |
40 |
Hostility |
Likert Scale 1-6 |
0.85-0.88 |
0.89-0.92 |
NA |
NA |
| Smith et al. (2016) |
71 |
Hostility |
Likert Scale 1-6 |
0.84 |
0.85 |
NA |
NA |
| Summers & Cougle (2016) |
38 |
BDD |
Likert Scale 1-6 |
0.80 |
0.86 |
NA |
NA |
Validity
Twenty-four studies reported correlations between WSAP indices and measures of psychopathology (see Table 5). Correlations between interpretation bias as measured by the WSAP and measures of psychopathology ranged between .01 and .68. We classified correlations as small (.10 to .29), medium (.30 to .49), and large (.50 or greater). Of the 74 correlations reported for the benign interpretation index, 42 (56%) were small, 13 (18%) were medium, and 1(1%) was large in magnitude. Of the 79 correlations reported for the threat/negative interpretation index, 26 (33%) were small, 44 (56%) were medium, and 7 (9%) were large in magnitude. Of the 12 correlations reported for a combined/overall interpretation index, 4 (33%) were small, 3 (25%) were medium, and 4 (33%) were large in magnitude.
Table 5.
Correlations between WSAP Indices and Psychopathology
| Study | Sample Size | Measure | Form of Psychopathology | r for Benign Endorsement | r for Threat/ Negative Endorsement | r for Combined/ Overall Bias |
|---|---|---|---|---|---|---|
| Beard & Amir (2008) |
27 |
Social Phobia and Anxiety Inventory (SPAI) | Social Phobia and Anxiety |
−0.31 |
0.2* |
NA |
| Beard & Amir (2009) |
52 |
Social Phobia and Anxiety Inventory (SPAI) |
SAD |
−0.57* |
0.64* |
NA |
| Beard, Rifkin, Bjorgvinsson (2017) |
65 |
Patient Health Questionnaire 9-Item (PHQ-9) |
Depression |
−0.209 |
0.136 |
NA |
| Beard, Rifkin, Bjorgvinsson (2017) |
65 |
Generalized Anxiety Disorder 7-Item (GAD-7) |
GAD |
−0.095 |
0.082 |
NA |
| Beard, Rifkin, Bjorgvinsson (2017) |
65 |
Schwartz Outcome Scale 10-Item (SOS-10) |
Psychological Health |
−0.242 |
−0.348 |
NA |
| Beard, Rifkin, Bjorgvinsson (2017) |
65 |
Behavior and Symptom Identification Scale Revised (BASIS-24, Psychosis) |
Psychosis |
−0.223 |
0.162 |
NA |
| Beard, Rifkin, Bjorgvinsson (2017) |
65 |
Behavior and Symptom Identification Scale Revised (BASIS-24, Substance Use) |
Substance Use |
−0.094 |
−0.230 |
NA |
| Clerkin, Beard, Fisher, & Schofield (2015): |
64 |
Anxiety Sensitivity Index (ASI) |
Anxiety Sensitivity |
−0.05 |
0.43* |
NA |
| Conley & Wu (2017) | 74 | Vancouver Obsessive-Compulsive Inventory Contamination Subscale (VOCI-CTM) |
OCD |
−0.19 |
0.47* |
NA |
| Conley & Wu (2017) | 74 | Obsessive Compulsive Inventory Revised Total (OCI-R) | OCD | −0.04 | 0.43* | NA |
| Conley & Wu (2017) | 74 | Obsessive Compulsive Inventory Revised Washing Subscale (OCI-R Washing) |
OCD |
0.05 |
0.47* |
NA |
| Conley & Wu (2017) | 74 | Obsessive Beliefs Questionnaire, 44 item version (OBQ-44 Total) |
OCD |
−0.08 |
0.36* |
NA |
| Conley & Wu (2017) | 74 | Behavioral Approach Tasks Collapsed (BAT Collapsed) |
OCD |
0.07 |
−0.16 |
NA |
|
Cougle et al. (2014) |
106 |
Minnesota Multiphasic Personality Inventory (MMPI) Cook-Medley Hostility Scale |
Hostility |
NA |
NA |
0.53* |
| Cowden-Hindash & Rottenberg (2017) | 38 | Scrambled Sentence Task Negativity Index (SST) |
Depression |
NA |
0.29* |
NA |
| Dillon et al. (2015): Experiment 1 |
469 |
State-Trait Anger Expression Inventory-2 (STAXI-2 Trait Anger) |
Trait Anger |
−0.10* |
0.26* |
NA |
|
Experiment 2 |
100 |
STAXI-2 Trait Anger |
Trait Anger |
−0.21* |
0.44* |
NA |
|
Experiment 2 |
100 |
Buss-Perry Aggression Questionnaire Verbal (BPAQ Verbal) |
Verbal Aggression |
−0.08 |
0.15 |
NA |
|
Experiment 2 |
100 |
Buss-Perry Aggression Questionnaire Anger (BPAQ Anger) | Anger (Physiological Arousal) |
−0.22* |
0.30* |
NA |
| Experiment 2 | 100 | Buss-Perry Aggression Questionnaire Hostility (BPAQ Hostility) | Hostility (Cognitive Component Underlying Anger and Aggression) |
−0.16 |
0.33* |
NA |
| Experiment 2 | 100 | Depression Anxiety Stress Scale-21 Depression (DASS-21 Depression) |
Depression |
−0.19 |
0.19 |
NA |
| Experiment 2 | 100 | Depression Anxiety Stress Scale-21 Anxiety (DASS-21 Anxiety) |
Anxiety |
−0.16 |
0.21* |
NA |
|
Experiment 3 |
183 |
Cook-Medley Hostility Scale (CM-Hostility) |
Hostility |
−0.27* |
0.17* |
NA |
|
Experiment 3 |
183 |
Social Information Processing-Attribution and Emotion Response Questionnaire Hostile Attribution (SIP-AEQ HA) |
Hostile Attribution Bias |
0.23* |
0.22* |
NA |
|
Experiment 3 |
183 |
Social Information Processing-Attribution and Emotion Response Questionnaire Benign Attribution (SIP-AEQ BA) |
Benign Attribution Bias |
0.31* |
−0.13 |
NA |
|
Experiment 3 |
183 |
Social Information Processing-Attribution and Emotion Response Questionnaire Instrumental Attribution (SIP-AEQ IA) |
Instrumental Attribution Bias |
−0.32* |
0.31 |
NA |
|
Experiment 3 |
183 |
Social Information Processing-Attribution and Emotion Response Questionnaire Negative Emotional Response (SIP-AEQ NER) |
Negative Emotional Response Bias |
−0.08 |
0.24* |
NA |
|
Experiment 3 |
183 |
Word Sentence Association Test for OCD Threat (WSAO Threat) |
OCD |
0.02 |
0.38* |
NA |
|
Experiment 3 |
183 |
Word Sentence Association Test for OCD Benign (WSAO Benign) |
OCD |
0.32* |
0.26* |
NA |
|
Experiment 4 |
215 |
STAXI-2 Trait Anger |
Trait Anger |
−0.22* |
0.39* |
NA |
|
Experiment 4 |
215 |
STAXI-2 Anger Expression-Out (STAXI-2 AX-O) |
Anger |
−0.26* |
0.25* |
NA |
|
Experiment 4 |
215 |
STAXI-2 Anger Expression-In (STAXI-2 AX-I) |
Anger |
−0.10 |
0.30* |
NA |
|
Experiment 4 |
215 |
STAXI-2 Anger Control-Out (STAXI-2 AC-O) |
Anger |
0.39* |
−0.35* |
NA |
|
Experiment 4 |
215 |
STAXI-2 Anger Control-In (STAXI-2 AC-I) |
Anger |
0.32* |
−0.22* |
NA |
|
Experiment 4 |
215 |
CM-Hostility |
Hostility |
−0.37* |
0.30* |
NA |
|
Experiment 4 |
215 |
Positive and Negative Affect Scale-Negative Affect Subscale (PANAS-NA) |
Negative Affect |
−0.25* |
0.30* |
NA |
|
Experiment 4 |
215 |
Positive and Negative Affect Scale-Positive Affect Subscale (PANAS-PA) |
Positive Affect |
0.14 |
0.05 |
NA |
| Dryman & Heimberg (2015) |
100 |
Social Interaction Phobia Scale (SIPS) |
Social Anxiety |
−0.15 |
0.55* |
NA |
| Hindash & Amir (2012) | 50 | Automatic Thoughts Questionnaire-Revised Total (ATQ-R) |
Automatic Thoughts |
−0.30* |
0.51* |
NA |
| Hindash & Amir (2012) | 50 | Beck Depression Inventory-Second Edition (BDI-II) |
Depression |
−0.24 |
0.46* |
NA |
| Hindash & Amir (2012) | 50 | Speilberger State Trait Anxiety Inventory Scale-State (STAI-S) |
State Anxiety |
−0.21 |
0.36* |
NA |
| Hindash & Amir (2012) | 50 | Speilberger State Trait Anxiety Inventory Scale-Trait (STAI-T) |
Trait Anxiety |
−0.26 |
0.45* |
NA |
|
Kuckertz, Amir, Tobin, & Najmi (2013): Experiment 2 |
70 | Obsessive Compulsive Inventory-Revised (OCI-R) |
OCD |
0.22 |
0.27* |
NA |
| Experiment 2 | 70 | Behavioral Approach Test (Number of BAT Steps) |
OCD |
−0.01 |
−0.29* |
NA |
| Martinelli, Holzinger, & Chasson (2014) | 214 | Body Shape Questionnaire (BSQ) |
BDD |
NA |
NA |
0.67* |
| Martinelli, Holzinger, & Chasson (2014) | 214 | Depression Anxiety Stress Scales-Depression (DASS-Depression) |
Depression |
NA |
NA |
0.36* |
| Martinelli, Holzinger, & Chasson (2014) | 214 | Depression Anxiety Stress Scales-Anxiety (DASS-Anxiety) |
Anxiety |
NA |
NA |
0.30* |
| Martinelli, Holzinger, & Chasson (2014) | 214 | Eating Disorder Examination Questionnaire-Total (EDEQ-Total) |
Eating Disorders |
NA |
NA |
0.67* |
| Matheny et al. (2016) | 131 | Distress Intolerance Index (DII) |
Distress |
−0.29* |
0.46* |
NA |
| Matheny et al. (2016) | 131 | Heartland Forgiveness Scale-Other (HFS other) |
Forgiveness |
0.20* |
−0.36* |
NA |
| Matheny et al. (2016) | 131 | Heartland Forgiveness Scale-Self (HFS self) |
Forgiveness |
0.24* |
−0.38* |
NA |
| Matheny et al. (2016) | 131 | Heartland Forgiveness Scale-Situations (HFS sit) |
Forgiveness |
0.28* |
−0.40* |
NA |
| Matheny et al. (2016) | 131 | Hostile Automatic Thoughts Scale Total (HATS) |
Hostility |
−0.26* |
0.46* |
NA |
| Matheny et al. (2016) | 131 | BDI-II |
Depression |
−0.18* |
0.37* |
NA |
| Matheny et al. (2016) | 131 | Beck Anxiety Inventory (BAI) |
Anxiety |
−0.18* |
0.38* |
NA |
| McDermott et al. (2017) | 96 | Pain Severity | Pain | −0.17 | 0.43* | NA |
| McDermott et al. (2017) | 96 | BDI-II | Depression | −0.18* | 0.37* | NA |
| McDermott et al. (2017) | 96 | STAXI-2 Trait Anger | Trait Anger | −0.35* | 0.38* | NA |
| McDermott et al. (2017) | 96 | STAXI-2 Anger Expression Out | Trait Anger | −0.18* | 0.40* | NA |
| McDermott et al. (2017) | 96 | Hostile Automatic Thoughts Scale Total (HATS) |
Hostility |
−0.26* | 0.46* | NA |
| McDermott et al. (2017) | 96 | HATS Aggression | Hostility | −0.24* | 0.31* | NA |
| McDermott et al. (2017) | 96 | HATS Derogation | Hostility | −0.21* | 0.47* | NA |
| McDermott et al. (2017) | 96 | HATS Revenge | Hostility | −0.26* | 0.42* | NA |
| Oglesby, Allan, & Schmidt (2017) | 40 | PANAS NA |
Negative Affect |
NA |
NA |
0.60* |
|
Oglesby et al. (2016): Experiment 1 |
76 | PANAS-NA |
Negative Affect |
0.29* |
−0.21 |
NA |
| Experiment 1 | 76 | Intolerance of Uncertainty Scale Total (IUS 12-Total) |
Tolerance of Uncertainty |
0.08 |
−0.45* |
NA |
| Experiment 1 | 76 | Intolerance of Uncertainty Scale Ambiguous (IUS 12-Ambiguous) |
Concern over Ambiguous Situations |
0.02 |
−0.40* |
NA |
| Experiment 1 | 76 | Intolerance of Uncertainty Scale Negative (IUS 12-Negative) |
Concern over Negative Situations |
−0.08 |
−0.38* |
NA |
| Experiment 1 | 76 | Intolerance of Uncertainty Scale Positive (IUS 12-Positive) |
Concern over Positive Situations |
−0.01 |
−0.22 |
NA |
| Experiment 2 | 31 | IUS 12-Total |
Tolerance of Uncertainty |
−0.14 |
−0.53* |
NA |
| Ogniewicz, Dugas, Langlois, Gosselin, & Koerner (2014) | 148 | Ambiguous/ Unambiguous Situations Diary Extended Version Total (AUSD-EX Total) |
Worry |
NA |
0.27* |
NA |
| Ogniewicz, Dugas, Langlois, Gosselin, & Koerner (2014) | 148 | Ambiguous/ Unambiguous Situations Diary Extended Version Positive (AUSD-EX Positive) |
Worry |
NA |
0.23* |
NA |
| Ogniewicz, Dugas, Langlois, Gosselin, & Koerner (2014) | 148 | Ambiguous/ Unambiguous Situations Diary Extended Version Negative (AUSD-EX Negative) |
Worry |
NA |
0.11 |
NA |
| Ogniewicz, Dugas, Langlois, Gosselin, & Koerner (2014) | 148 | Ambiguous/ Unambiguous Situations Diary Extended Version Ambiguous (AUSD-EX Ambiguous) |
Worry |
NA |
0.30* |
NA |
| Rozenman, Amir, & Weersing (2014) | 26 | Pediatric Anxiety Rating Scale (PARS) |
Anxiety |
0.16 |
0.68* |
NA |
| Rozenman, Amir, & Weersing (2014) | 26 | Children’s Depression Rating Scale-Revised (CDRS-R) |
Depression |
−0.08 |
0.26 |
NA |
| Rozenman, Amir, & Weersing (2014) | 26 | ATQ-Negative |
Automatic Negative Thoughts |
−0.10 |
0.44* |
NA |
| Rozenman, Amir, & Weersing (2014) | 26 | ATQ-Positive |
Automatic Positive Thoughts |
0.03 |
−0.43* |
NA |
| Salemink &Wiers (2014) | 92 | DMQ Drinking Motives Questionnaire | Drinking Motives Enhancement Coping |
NA NA |
NA NA |
.05 to .37* .21* to .25* |
| 92 | AUDIT Alcohol Use Disorders Identification Test | Alcohol Use | NA | NA | .31* to .48* | |
| 92 | Operation Span Task | Working Memory Capacity | NA | NA | −.26* to −.08 | |
| Salemink et al. (2013) | 72 | Implicit Association Test for Social Anxiety |
Implicit Social Anxiety |
NA |
NA |
0.04 |
| Salemink et al. (2013) | 72 | Fear of Negative Evaluation Scale |
Explicit Social Anxiety |
NA |
NA |
0.24* |
| Salemink et al. (2013) | 72 | Complex Operation Span Task (OSPAN) |
Working Memory |
NA |
NA |
0.10 |
| Sherman & Ehrenreich-May (2017) | 30 | Screen for Child Anxiety Related Emotional Disorders Total (Child SCARED total); child report | Anxiety | .27 | .45* | NA |
| Sherman & Ehrenreich-May (2017) | 30 | Screen for Child Anxiety Related Emotional Disorders Generalized Anxiety Disorder Subscale (Child SCARED GAD); child report | GAD | .33 | .61* | NA |
| Sherman & Ehrenreich-May (2017) | 30 | Screen for Child Anxiety Related Emotional Disorders Social Anxiety Disorder Subscale (Child SCARED social); child report | Social Anxiety Disorder | .38* | .47* | NA |
| Smith et al. (2016) | 132 | BDI II | Depression | −0.15 | 0.38* | NA |
| Smith et al. (2016) | 132 | STAXI-2 Trait | Trait Anger | −0.35* | 0.38* | NA |
| Summers & Cougle (2016) | 40 | Yale Brown Obsessive Compulsive Scale Modified for BDD Self-Report (BDD-YBOCS-SR) | BDD | −0.43* | 0.54* | NA |
| Viana et al. (2016) | 44 | Coping with Children’s Negative Emotion States Parental Minimization Reactions (CCNES) | Emotion Socialization | NA | NA | −0.12 |
| Viana et al. (2016) | 44 | Coping with Children’s Negative Emotion States Parental Punitive Reactions (CCNES) | Emotion Socialization | NA | NA | −0.21 |
| Viana et al. (2016) | 44 | Revised Child’s Manifest Anxiety Scale (RCMAS) | Anxiety | NA | NA | 0.37* |
| Viana et al. (2016) | 44 | Child Behavior Checklist—Anxious/Depressed Scale (CBCL) | Anxiety | NA | NA | 0.05 |
Note.
reported in original manuscript as a significant correlation
We categorized the size of correlation for the most frequent types of psychopathology measures. For the benign interpretation index, the following were reported: hostility/anger (small: n = 13 (68%), medium: n = 5 (26%), large: n = 0 (0%)), general anxiety/worry(small: n= 7 (87.5%), medium: n = 1 (12.5%), large: n = 0 (0%)), depression (small: n = 5 (83%), medium: n = 0 (0%), large: n = 0 (0%)), OCD (small: n = 2 (25%), medium: n = 1 (13%), large: n = 0 (0%)), and social anxiety (small: n = 1 (25%), medium: n = 2 (50%), large: n = 1 (25%)).For the threat/negative interpretation index, the following were reported: hostility/anger (small: n = 5 (26%), medium: n = 14 (74%), large: n = 0 (0%)), general anxiety/worry (small: n = 4 (33%), medium: n = 5 (42%), large: n = 2 (17%)), depression (small: n = 4 (57%), medium: n = 3 (43%), large: n = 0 (0%)), OCD (small: n = 4 (50%), medium: n = 4 (50%), large: n = 0 (0%)), and social anxiety(small: n = 1 (25%), medium: n = 1 (25%), large: n = 2 (50%)). Thus, for both benign and threat/negative WSAP indices, correlations appeared to be strongest with measures of social anxiety and weakest with measures of OCD.
Seven studies, as seen in Table 6, compared a clinical (n = 3) or undergraduate analogue (n = 4) group to a healthy control group. We classified effect sizes as small (.20 to .49), medium (.50 to .79), and large (.80 or greater). Between-group Cohen’s d effect sizes ranged from 0.45 to 2.92 for benign interpretation, and from 0.54 to 1.64 for threat/negative interpretation. For both benign and negative interpretations, large effects were obtained in SAD (n = 3) and OCD (n = 1), and medium effects were obtained in studies of depression (n = 3).
Table 6.
Effect Sizes for Comparisons Between Healthy and Clinical Groups
| Study | Sample Size | Sample | Stimuli | Cohen’s d for Benign | Cohen’s d for Threat/Negative |
|---|---|---|---|---|---|
| Amir, Prouvost, & Kuckertz (2012) |
67 |
Clinical |
SAD |
1.190 |
1.25 |
| Beard & Amir (2009) |
52 |
Undergraduate |
SAD |
1.161 |
1.643 |
| Cowden-Hindash & Amir (2012) |
50 |
Undergraduate | Depression |
0.45 |
0.78 |
| Cowden-Hindash & Rottenberg (2015) |
115 |
Undergraduate | Depression |
NA |
0.55 |
| Kuckertz, Amir, Taylor, & Najimi (2013) |
69 |
Undergraduate | OCD |
2.92 |
1.223 |
| Rozenman, Vreeland, Piacentini (2017) |
46 |
Clinical | Youth with SAD, GAD, Separation Anxiety |
0.937 |
1.621 |
| Smith et al (2016) |
71 |
Clinical | Depression |
0.676 |
0.54 |
WSAP as CBM-I
Fifteen studies (16 experiments) used both the assessment and modification (CBM-I) versions of the WSAP and reported endorsement rates for pre- and post-training. Studies included clinical (n = 7) and undergraduate (n = 8) samples, and 12 compared the CBM-I version to a control condition. Table 7 presents the within-group pre-post effect sizes for change in WSAP scores following CBM-I and control conditions. For CBM-I, Cohen’s d effect sizes ranged from 0.25 to 2.56 for change in benign endorsement, with eight studies reporting large effects, one medium, and three small. Cohen’s d effect sizes ranged from 0.94 to 2.84 for change in threat/negative endorsement, with all 12 studies reporting large effects. Finally, four studies combined the benign and negative trials and reported change in a combined or overall WSAP bias, which ranged from 1.44 to 1.91. Overall, regardless of the bias index (negative, positive, or combined), studies of clinical populations obtained large effect sizes. Studies of undergraduates obtained slightly more variable effect sizes: 76% large, 6% medium, 18% small.
Table 7.
Pre-Post Effect Sizes following CBM-I and Control Conditions
| Study | Sample | Stimuli | Sample Size | Cohen’s d for Benign | Cohen’s d for Threat/Negative | Cohen’s d for Combined/ Overall Bias |
|---|---|---|---|---|---|---|
|
Amir & Taylor (2012) |
Clinical |
SAD |
CBM = 20 |
1.68 |
1.79 |
NA |
|
Control = 26 (50/50) |
0.35 |
0.79 |
NA |
|||
| Amir, Kuckertz, Najmi, & Conley (2015) |
Clinical |
OCD | CBM = 17 (each Ps served as own controla) | NA | NA | 1.89 |
|
Beard & Amir (2008) |
Undergraduate |
SAD |
CBM = 13 |
2.35 |
1.85 |
NA |
|
Control = 14 (50/50) |
0.34 |
0.78 |
NA |
|||
| Beard et al. (2016) | Clinical | PD | CBM = 8 (No Control) | 1.22 | 2.61 | NA |
| Brosnan et al. (2011) | Clinical | GAD / SAD | CBM = 13 (No Control) | NA | NA | 1.58 |
|
Capron & Schmidt (2016) |
Undergraduate |
Anxiety Sensitivity |
CBM = 48 |
NA |
NA |
1.44 |
|
Control = 41 (neutral stimuli) |
NA |
NA |
0.95 |
|||
|
Clerkin, Beard, Fisher, & Schofield (2015) |
Undergraduate |
Anxiety Sensitivity |
CBM = 33 |
1.79 |
1.63 |
NA |
|
Control = 32 (neutral stimuli) |
0.73 |
0.32 |
NA |
|||
|
Conley & Wu (2017) |
Undergraduate |
OCD |
CBM = 42 |
0.25 |
1.63 |
NA |
|
Control = 32 (50/50) |
0.21 |
0.21 |
NA |
|||
|
Cougle et al. (2017) |
Clinical | AUD; Trait Anger | CBM = 30 |
1.17 |
0.94 |
NA |
|
Control = 28 (psychoed) |
0.02 |
0.54 |
NA |
|||
| Cowden-Hindash & Rottenberg (2017) | Undergraduate |
Depression |
CBM = 38 |
0.29 |
1.01 |
NA |
|
Control = 42 (50/50) |
0.28 (in opposite direction) |
0.51 |
NA |
|||
|
Lichtenthal et al. (2017) |
Clinical |
Fear of breast cancer recurrence |
CBM = 64 |
1.03 |
2.20 |
NA |
|
Control = 33 (50/50) |
2.03 |
0.37 |
NA |
|||
|
Mobius et al. (2015) |
Undergraduate | Depression |
Exp. 1 CBM = 40 (No controlb) |
0.64 |
0.94 |
NA |
|
Exp. 2 CBM = 36 |
0.37 |
1.00 |
NA |
|||
|
Exp. 2 Control = 34 (no feedback) |
0.24 |
0.21 |
NA |
|||
| Oglesby, Allan, & Schmidt (2017) | Undergraduate | Intolerance of uncertainty |
CBM = 40 |
NA |
NA |
1.91 |
|
Control = 39 (neutral stimuli) |
NA |
NA |
0.41 |
|||
|
Smith, Dillon, & Cougle (2018) |
Undergraduate |
Depression |
CBM = 21 |
1.18 |
0.94 |
NA |
|
Control = 19 (psychoed) |
0.00 |
0.00 |
NA |
|||
|
Summers & Cougle (2016) |
Clinical |
BDD |
CBM = 20 |
2.56 |
2.84 |
NA |
|
Control = 20 (neural stimuli) |
0.82 |
0.94 |
NA |
Note. “50/50” refers to WSAP conditions in which positive feedback is provided 50% for endorsing threat and 50% for endorsing benign interpretations, except in one case (Cowden-Hindash & Rottenberg) - feedback was constrained such that participants received 50% positive feedback and 50% negative feedback.
“Neutral stimuli” refers to WSAP conditions that presented only neutral stimuli (e.g., same sentences used in the CBM version, but only paired with neutral words).
“No feedback” refers to the assessment version of the WSAP, such that control participants saw same word-sentence pairs, but with no feedback about their accuracy.
“psychoed” refers to psychoeducational videos.
WSAP was not administered pre-post control.
Did not include a placebo or neutral control, only a negative training condition.
CBM-I only group, study also included a combined CBM-A/CBM-I training condition. In contrast to other CBM-I studies, only presented reaction time bias scores; thus, did not calculate effect sizes.
In contrast, examining effects for all bias indices, control conditions obtained primarily small effect sizes: zero effect (18%), small (41%), medium (18%), large (23%). Control group effect sizes appeared to vary by type of control, with a no feedback version of the WSAP (i.e., assessment version) and psychoeducation resulting in almost all small or zero effects on interpretation bias (100% small, 75% small or zero respectively). Alternative versions of the WSAP showed more variability. Specifically, 60% of the effects obtained were small from studies using the “50/50” control in which participants are reinforced for endorsing threat/negative interpretations 50% of the time and for endorsing benign interpretations 50%. Studies using neutral stimuli in the WSAP task resulted in 33% of effects categorized as small.
Discussion
This systematic review yielded 41 studies that have used the WSAP to assess and modify IB across a variety of populations, age groups, and clinical symptoms. Across these studies, the WSAP demonstrated acceptable to excellent reliability, and consistently differentiated interpretive styles between healthy and clinical groups. Finally, our review identified several common changes to the task parameters that differ from the original task.
Psychometric Properties
Given the problems of unreliability with other commonly used measures of cognitive bias (e.g., Shmukle, 2005), our review aimed to summarize the reliability estimates available for the WSAP. Twelve of the 42 studies reported reliability estimates for the WSAP. Internal consistency estimates were acceptable for the original yes/no response option of the WSAP and excellent for an adapted version using a Likert scale rating. Test-retest reliability was acceptable over a 12-day (Martinelli et al., 2014) and 1-month period (Dillon et al., 2015), which is crucial for studies using the WSAP as an outcome measure before and after interventions, such as CBM-I. Importantly, only four studies used the WSAP with children or adolescents, and none of these reported reliability estimates. Thus, at this point, the WSAP can only be deemed reliable for adult populations.
Regarding validity, all seven studies that compared IB in individuals with and without psychopathology found that the WSAP was a sensitive measure of IB, with Cohen’s d between-group effect sizes ranging from 0.45 to 2.92. Four of these studies included individuals with anxiety symptoms, and these studies all yielded large effect sizes. Three studies included individuals with elevated depressive symptoms, and these all yielded medium effect sizes. However, these between-group effect sizes should be interpreted in the context of their limitations. Specifically, only three of these studies included a clinical sample, and most had modest sample sizes (N’s ranged from 46 to 115). Additionally, only one of these studies included children and adolescents; thus, the validity of the WSAP in pediatric populations remains largely unknown.
Other studies (n = 24) reported correlations between WSAP endorsement indices and various measures of psychopathology. Of the most frequently reported measures of psychopathology, the largest correlations were with measures of social anxiety, and the weakest correlations were with measures of OCD. Measures of hostility, depression, and general anxiety fell in between. Overall, correlations with the threat/negative interpretation index were larger in size than correlations with the benign interpretation index. For example, 56% of correlations with threat/negative interpretation were classified as medium in magnitude, compared to 18% of correlations with benign interpretation. Given that anxiety has been characterized by both the presence of a threat bias and lack of a benign bias, we might have expected to see similar magnitudes of correlations for threat/negative and benign indices. We can only speculate upon potential explanations for this pattern. It may be that although emotional disorders, and anxiety in particular are characterized by both types of bias, the threat/negative bias is more strongly associated with psychopathology. However, an alternative explanation is that the benign bias may not strongly correlate with psychopathology due to the mixed nature of the words that comprise this trial type in the WSAP. Specifically, whereas most threat/negative words clearly represent negative interpretations of the sentences, the ‘benign’ category may include words that represent neutral to positive interpretations. It is possible that stronger correlations with psychopathology would be observed for studies that only used objectively positive interpretations.
Most studies reported endorsement rates separately for threat/negative and benign interpretations; however, some combined these scores to report an overall IB score. Prior studies have reported small correlations between the benign and threat/negative endorsement rates (e.g., r = .25, Beard & Amir, 2009). Moreover, in a factor analysis, the correlation between threat and benign factors on the WSAP was weak, suggesting independence (Dillon et al., 2016). Consistent with more comprehensive reviews of IB overall (Hirsch et al., 2016), future research should examine threat/negative and benign facets of IB separately when using the WSAP.
Finally, our review identified 15 studies (16 experiments) that used the CBM-I version of the WSAP, in which participants are provided feedback about the “accuracy” of their responses to WSAP trials. Most of these studies reported large pre-post effect sizes for change in both benign and threat/negative WSAP scores. However, there appeared to be a pattern in effect sizes such that clinical studies reported large effect sizes, whereas undergraduate studies displayed more variability in effect size. This pattern is not surprising given that we would expect clinical populations to demonstrate more biased interpretation at baseline and thus have more room to improve. It is also possible that clinical participants were more motivated to change and therefore engaged more with the CBM-I task, although this explanation is entirely speculative at this point.
The large effect sizes obtained following the CBM-I version of the WSAP are in contrast to the primarily small effects observed following various types of control conditions. Of note, control conditions that included alternate versions of the WSAP (e.g., using only neutral stimuli, reinforcing negative and positive interpretations with equal frequency) appeared to result in larger effects on interpretation compared to other types of controls (i.e., psychoeducation, assessment-only version of the WSAP). This pattern is consistent with prior studies suggesting that 50/50 types of controls are actually diluted versions of interpretation training and are not inactive (Hirsch et al., 2016).
Overall, the CBM-I version of the WSAP appears to consistently shift responses on the WSAP in the intended direction compared to variety of control conditions. However, given the explicit nature of this type of CBM-I (i.e., participants are explicitly told which interpretations are “correct”), more studies that include an independent measure of interpretation bias (i.e., a measure that does not resemble the CBM-I task) are needed to determine whether the CBM-I version of the WSAP is effective at shifting interpretive style more broadly. Future studies might also compare different versions of CBM-I to determine whether relatively more implicit or explicit types of training are more effective in shifting interpretation bias and ultimately affecting emotional vulnerabilities.
WSAP modifications
Our review identified several studies that modified the original parameters of the WSAP. For example, in some studies, the order of the stimulus presentation was reversed such that the ambiguous sentence appeared first, followed by the word reflecting the benign or negative interpretation. The original task presented a prime word first to “better imitate the priming effects of pre-existing beliefs on interpretive processes” (Beard & Amir, 2009, p. 406). In other words, the WSAP was designed to account for the tendency of individuals with anxiety disorders to rely on pre-existing negative beliefs to resolve ambiguous information. Other researchers subsequently concurred with this design (e.g., Matinelli et al., 2014, p. 559). This is a unique feature of the WSAP, as most other assessments of IB and CBM-I task present the ambiguity first. However, the reverse order presenting the ambiguity first may better map on to the definition of interpretation bias as being the tendency to interpret ambiguity in a negative manner. While both the original and reverse order are justifiable theoretically and scientifically, studies directly comparing these two versions of the task are needed to determine the correlation between the standard and reverse order version and that both are equivalent in terms of reliability. Additionally, such studies would benefit from including other measures of interpretation bias to attempt to determine whether these two versions assess the same type of interpretation bias.
Some studies also changed the presentation time of the prime word. In the original version of the WSAP, the word was presented very quickly, i.e., 500ms. While most studies retained this timing, 12 studies increased the presentation time, most often doubling to 1000ms. It is possible that increasing the presentation time improves the ability of participants to read each word and minimizes the number of trials on which the word is “missed” because it appeared too quickly. On the other hand, it is possible that slowing the presentation time encourages more strategic and elaborative reflection regarding the word-sentence association, which may alter the intended assessment of more automatic associations. It is also not clear whether increasing the presentation time leads to overall slower reaction times, which would be important to know when comparing across studies.
As noted by Hirsch et al. (2016), like other reaction-time based measures, the WSAP may have an advantage over purely self-report questionnaires due to less susceptibility to demand or response biases. Additionally, the instructions and task features emphasize speed, and the situations presented lack context. These features are intended to elicit more automatic interpretive associations, i.e., capture an individual “jumping to conclusions.” The WSAP’s emphasis on task speed may also better capture the involuntary nature of information processing biases among anxious and depressed individuals. McNally (1995) remarked that the “hallmark of pathological anxiety” (p. 752) was the inability of the anxious individual to halt fear-generating information processing once it has begun. Indeed, in a review of the literature on automaticity in anxiety disorders and MDD, Teachman, Joorman, Steinman, and Gotlib (2012) concluded that most anxiety disorders are characterized by uncontrollable, and possibly unconscious and unintentional, biased processing of threat-relevant information, whereas depressed patients tend to exhibit uncontrollable, but not unconscious or unintentional, processing of negative information.
Strengths and Weaknesses of Existing WSAP Literature and Future Directions
Overall, there is adequate evidence for the reliability and validity of the WSAP indices for adults with elevated symptoms of anxiety, hostility, and depression. However, most of the reliability estimates were obtained from one specific version of the WSAP (WSAP-Hostility, Likert scale); thus, future studies using different versions of the WSAP should report reliability estimates. More research is also needed to determine the WSAP’s properties in child and adolescent samples. Additionally, more studies are needed to determine the between-group effect size between various clinical groups and healthy controls. Finally, many studies that changed the WSAP task did not mention such changes in their Methods sections and rather presented their procedure as though it were the standard. Future studies should clearly state the modifications to the original task and provide a rationale for the change.
A potential advantage of using the WSAP to assess IB is that it provides both an accuracy outcome (e.g., % of benign trials endorsed and % of threat trials rejected), as well as individuals’ reaction times for making those decisions. However, a major caveat of using only the WSAP reaction time indices is that the number of reaction times for each trial type will differ depending upon an individual’s endorsement rates. For example, an individual with a strong threat bias may reject only a few threat trials, which would result in a relatively smaller number of reactions used for their mean threat rejection reaction time compared to their mean threat endorsement reaction time. To date, studies that have utilized WSAP reaction time scores have not directly addressed this issue. Given these issues and concerns over the reliability of reaction-time based measures (e.g., De Schryver, Hughes, Rosseel, & Houwer, 2016), careful attention to reducing sources of error (i.e. both systematic and random) should be employed within future study designs using the reaction time indices of the WSAP. For example, Hedge, Powell, & Sumner (2018) noted that the use of alternative statistical procedures (e.g., factor analysis, SEM, linear mixed-effects models) and within-subjects designs may help to mitigate some of the reliability concerns associated with the use of these types of instruments.
While effect sizes are helpful for comparing across studies, future studies are needed to establish clinical cut-offs on the WSAP for each population. As noted previously, to date only three studies have compared a clinical group to a healthy control group. Future studies are also needed to establish normative data, which would be helpful to researchers attempting to select participants who demonstrate an elevated level of IB. For example, there are currently no norms to assist in identifying individuals for whom CBM-I or cognitive therapy may be an appropriate intervention. Data regarding a healthy score on specific versions of the WSAP may also facilitate researchers in determining if an individual’s IB has shifted into a healthy range and demonstrating the clinical significance of an intervention.
Regarding using the WSAP as a CBM-I task, the WSAP is unique because it presents both benign and threat interpretations. Thus, individuals may quickly notice over hundreds of trials that (1) there are multiple ways to interpret the same situation, and (2) the program-delivered feedback suggests that they are often jumping to a negative/threatening conclusion (Beard, Rifkin, Silverman, & Björgvinsson, 2018). It is possible that even as individuals experience symptom improvement with treatment, their initial interpretations may continue to be threatening, and therefore, practicing the skill of rejecting those threatening interpretations may be particularly helpful. This feature of the WSAP contrasts with the frequently used ambiguous scenario training task (e.g., Mathews & Macintosh, 2000), which only presents positive resolutions to ambiguous scenarios. Both types of CBM-I have demonstrated efficacy. To our knowledge, no studies to date have directly compared the WSAP with another CBM-Interpretation task. One intriguing clinical application is to combine these types of CBM-I, harnessing the strengths of both approaches and simultaneously providing a variety of tasks for the individual. Whether combining different tasks would yield additional benefits to participants is an empirical question and might depend upon whether the WSAP and other types of CBM-I are altering the same or different types of interpretive biases.
Conclusion
This review suggests that the WSAP is a reliable and valid assessment of IB across a variety of populations, and that it can also be used to modify IB. The WSAP has unique features compared with other IB assessment and modification tasks. Researchers should consider these features when selecting a measure of IB and CBM-I task. Future research is warranted to provide healthy norms and clinical cut-points, as well as to directly compare different types of IB assessments and CBM-I.
Contributor Information
Courtney Beard, McLean Hospital/Harvard Medical School, Department of Psychiatry, 115 Mill St, Mailstop 113, Belmont, MA 02478, 617.855.3557.
Meghan Gonsalves, The Mind Research Network, Kiehl Lab, 1101 Yale Boulevard NE, Albuquerque, NM 87106; 774-766-7611.
Randy Whittles, VA Boston Healthcare System, Department of Clinical Psychology, 150 S Huntington Ave, Boston, MA 02130; (774) 826-1007.
Risa Weisberg, VA Boston Healthcare System, Department of Clinical Psychology, 150 S Huntington Ave, Boston, MA 02130; 508-735-5901.
References
* = studies included in the review
- *Amir N, Bomyea J, & Beard C (2010). The Effect of Single Session Interpretation Modification on Attention Bias in Socially Anxious Individuals. Journal of Anxiety Disorders, 24, 178–182. [DOI] [PMC free article] [PubMed] [Google Scholar]
- Amir N, Foa EB, & Coles ME (1998). Negative interpretation bias in social phobia. Behaviour Research and Therapy, 36, 945–957. [DOI] [PubMed] [Google Scholar]
- *Amir N, Kuckertz JM, Najmi S, Conley SL (2015). Preliminary Evidence for the Enhancement of Self-Conducted Exposures for OCD Using Cognitive Bias Modification. Cognitive Therapy and Research, 39, 424–440. [DOI] [PMC free article] [PubMed] [Google Scholar]
- *Amir N, Prouvost C, & Kuckertz JM. (2012). Lack of a Benign Interpretation Bias in Social Anxiety Disorder. Cognitive Behaviour Therapy, 41, 119–129. [DOI] [PMC free article] [PubMed] [Google Scholar]
- *Amir N, & Taylor C (2012). Interpretation training in individuals with generalized social anxiety disorder: A randomized controlled trial. Journal of Consulting and Clinical Psychology, 80, 497–511. [DOI] [PMC free article] [PubMed] [Google Scholar]
- Barlow DH, Farchione TJ, Fairholme CP, Ellard KK, Boisseau CL, Allen LB, & Ehrenreich-May J (2011). Unified protocol for transdiagnostic treatment of emotional disorders therapist guide. New York, NY: Oxford University Press. [Google Scholar]
- *Beard C, & Amir N (2008). A multi-session interpretation modification program: changes in interpretation and social anxiety symptoms. Behaviour Research and Therapy, 46, 1135–41. [DOI] [PMC free article] [PubMed] [Google Scholar]
- *Beard C, & Amir N (2009). Interpretation in social anxiety: When meaning precedes ambiguity. Cognitive Therapy and Research, 33, 406–415. [DOI] [PMC free article] [PubMed] [Google Scholar]
- *Beard C, Fuchs C, Asnaani A, Schulson M, Schofield CA, Clerkin EM, Weisberg RB (2016). A Pilot Open Trial of Cognitive Bias Modification for Panic Disorder. Cognitive Therapy and Research, 40, 792–798. [Google Scholar]
- *Beard C, Rifkin LS, & Bjorgvinsson T. (2017). Characteristics of interpretation bias and relationship with suicidality in a psychiatric hospital sample. Journal of Affective Disorders, 207, 321–326. [DOI] [PubMed] [Google Scholar]
- Beard C, Rifkin LS, Silverman AL, & Björgvinsson T. (2018). Translating CBM-I Into Real-World Settings: Augmenting a CBT-Based Psychiatric Hospital Program. Behavior Therapy. Sept. 11. 10.1016/j.beth.2018.09.002 [DOI] [PubMed] [Google Scholar]
- *Beard C, Weisberg RB, & Amir N (2011). Combined cognitive bias modification treatment for social anxiety disorder: A pilot trial. Depression and Anxiety, 28, 981–988. [DOI] [PMC free article] [PubMed] [Google Scholar]
- Beck AT, Emery G, & Greenberg RL (1985). Anxiety disorders and phobias: A cognitive perspective. New York: Basic Books. [Google Scholar]
- *Brosan L, Hoppitt L, Shelfer S, Sillence A, & Mackintosh B (2011). Cognitive bias modification for attention and interpretation reduces trait and state anxiety in anxious patients referred to an out-patient service: Results from a pilot trial. Journal of Behavior Therapy and Experimental Psychiatry, 42, 258–264. [DOI] [PubMed] [Google Scholar]
- Butler G, & Mathews A (1983). Cognitive processes in anxiety. Advances in behaviour research and therapy, 5(1), 51–62. [Google Scholar]
- *Capron DW, & Schmidt NB (2016). Development and randomized trial evaluation of a novel computer-delivered anxiety sensitivity intervention. Behaviour Research and Therapy, 81, 47–55. [DOI] [PubMed] [Google Scholar]
- *Clerkin EM, Beard C, Fisher CR, & Schofield CA (2015). An attempt to target anxiety sensitivity via cognitive bias modification. PLoS ONE, 10(2): e0114578. [DOI] [PMC free article] [PubMed] [Google Scholar]
- *Conley SL & Wu KD (2017). Experimental modification of dysfunctional interpretations in individuals with contamination concerns. Journal of Behavior Therapy and Experimental Psychiatry, 59, 56–64. [DOI] [PubMed] [Google Scholar]
- *Cougle JR, Hawkins KA, Macatee RJ, Zvolensky MJ, &Shivali S. (2014). Trait Hostility and Hostile Interpretation Biases in Daily Smokers: Associations With Reasons for Smoking, Motivation to Quit, and Early Smoking Lapse. Psychology of Addictive Behaviors, 28, 907–911. [DOI] [PubMed] [Google Scholar]
- *Cougle JR, Summers BJ, Allan NP, Dillon KH, Smith HL, Okey SA, Harvey AM (2017). Hostile interpretation training for individuals with alcohol use disorder and elevated trait anger: A controlled trial of a web-based intervention. Behaviour Research and Therapy, 99, 57–66. [DOI] [PubMed] [Google Scholar]
- *Cowden-Hindash AH, & Amir N (2012). Negative interpretation bias in individuals with depressive symptoms. Cognitive Therapy and Research, 36, 502–511. [Google Scholar]
- *Cowden-Hindash AH, & Rottenberg J. (2015). Turning quickly on myself: Automatic interpretation biases in dysphoria are self-referent. Cognition and Emotion, 31, 395–402. [DOI] [PubMed] [Google Scholar]
- *Cowden-Hindash AH, Rottenberg JA (2017). Moving towards the benign: Automatic interpretation bias modification in dysphoria. Behaviour Research and Therapy, 99, 98–107. [DOI] [PubMed] [Google Scholar]
- De Schryver M, Hughes S, Rosseel Y, & De Houwer J (2016). Unreliable Yet Still Replicable: A Comment on LeBel and Paunomen (2011). Frontiers in Psychology, 6. doi: 10.3389/Fpsyg.2015.07039. [DOI] [PMC free article] [PubMed] [Google Scholar]
- *Dillon KH, Allan NP, Cougle JR, & Fincham FD (2016). Measuring Hostile Interpretation Bias: The WSAP-Hostility Scale. Assessment, 23, 707–719. [DOI] [PubMed] [Google Scholar]
- *Dryman MT, & Heimberg RG (2015). Examining the Relationships Among Social Anxiety, Fears of Evaluation, and Interpretation Bias. Cognitive Therapy and Research, 39, 646–657. [Google Scholar]
- Hedge C, Powell G, & Sumner P (2018). The reliability paradox: Why robust cognitive tasks do not produce reliable individual differences. Behavior Research Methods, 50, 1166–1186. [DOI] [PMC free article] [PubMed] [Google Scholar]
- Heimberg RG, & Becker RE (2002). Cognitive-behavioral group therapy for social phobia: Basic mechanisms and clinical strategies. New York: Guilford Press. [Google Scholar]
- *Hirsch CR, & Mathews A (2000). Impaired positive inferential bias in social phobia. Journal of Abnormal Psychology, 109, 705–712. [DOI] [PubMed] [Google Scholar]
- Hirsch CR, Meeten F, Krahe C, & Reeder C (2016). Resolving Ambiguity in Emotional Disorders: The Nature and Role of Interpretation Biases. Annual Review of Clinical Psychology, 12, 281–305. [DOI] [PubMed] [Google Scholar]
- Huppert JD, Foa EB, Furr JM, Filip JC, & Mathews A (2003). Interpretation Bias in Social Anxiety: A Dimensional Perspective. Cognitive Therapy and Research, 27, 569–577. [Google Scholar]
- Koster EH, Fox E, MacLeod C (2009). Introduction to the special section on cognitive bias modification in emotional disorders. Journal of Abnormal Psychology, 118, 1–4. [DOI] [PubMed] [Google Scholar]
- *Kuckertz JM, Amir N, Tobin AC, &Najmi S. (2013). Interpretation of ambiguity in individuals with obsessive-compulsive symptoms. Cognitive Therapy and Research, 37, 232–241. [DOI] [PMC free article] [PubMed] [Google Scholar]
- *Lichtenthal WG, Corner GW, Slivjak ET, Roberts KE, Li Y, Breitbart W, Lacey S, Tuman M, DuHamel KN, Blinder VS, Beard C (2017). A pilot randomized control trial of cognitive bias modification to reduce fear of breast cancer recurrence. Cancer, 123, 1424–1433. [DOI] [PMC free article] [PubMed] [Google Scholar]
- *MacDonald EM, Koerner N, & Antony MM (2013). Modification of interpretive bias: Impact on anxiety sensitivity, information processing and response to induced bodily sensations. Cognitive Therapy and Research, 37, 860–871. [Google Scholar]
- *Martinelli MK, Holzinger JB, & Chasson GS. (2014). Validation of an interpretation bias assessment for body dissatisfaction. Body Image, 11, 557–561. [DOI] [PubMed] [Google Scholar]
- *Matheny NL, Smith HL, Summers BJ, McDermott KA, Macatee RJ, Cougle JR (2017). The Role of Distress Tolerance in Multiple Facets of Hostility and Willingness to Forgive. Cognitive Therapy and Research, 41, 170–177. [Google Scholar]
- Mathews A, & MacLeod C (2005). Cognitive vulnerability to emotional disorders. Annual Review of Clinical Psychology, 1, 167–195. [DOI] [PubMed] [Google Scholar]
- Mathews A, & Mackintosh B (2000). Induced emotional interpretation bias and anxiety.Journal of abnormal psychology,109(4), 602. [PubMed] [Google Scholar]
- *McDermott KA, Smith HL, Matheny NL, Cougle JR (2017). Pain and multiple facets of anger and hostility in a sample seeking treatment for problematic anger. Psychiatry Research, 253, 311–317. [DOI] [PubMed] [Google Scholar]
- McNally RJ (1995). Automaticity and the anxiety disorders. Behaviour Research and Therapy, 33, 747–754. [DOI] [PubMed] [Google Scholar]
- Menne-Lothman C, Viechtbauer W, Hohn P, Kasanova Z, Haller SP, Drukker M, & Lau JYF (2014). How to boost positive interpretations? A meta-analysis of the effectiveness of cognitive bias modification for interpretation. PLoS ONE, 9(6), e100925. [DOI] [PMC free article] [PubMed] [Google Scholar]
- *Mobius M, Tenolkar I, Lohner V, Baltussen M, & Becker ES (2015). Refilling the half-empty glass-Investigating the potential role of the Interpretation Modification Paradigm for Depression (IMP-D). Journal of Behavior Therapy and Experimental Psychiatry, 49, 37–43. [DOI] [PubMed] [Google Scholar]
- *Oglesby ME, Allan NP, & Schmidt NB (2017). Randomized control trial investigating the efficacy of a computer-based intolerance of uncertainty intervention. Behaviour Research and Therapy, 95, 50–57. [DOI] [PubMed] [Google Scholar]
- *Oglesby ME, Raines AM, Short NA, Capron DW, & Schmidt NB (2016). Interpretation bias for uncertain threat: A replication and extension. Journal of Behavior Therapy and Experimental Psychiatry, 51, 35–42. [DOI] [PubMed] [Google Scholar]
- *Ogniewicz AS, Dugasa MJ, Langloisc F, Gosselind P, &Koernere N. (2014). An Adapted Word-Sentence Association Paradigm for Generalized Anxiety and Worry: Assessing Interpretation Bias. Journal of Experimental Psychopathology, 5, 457–476. [Google Scholar]
- *Rozenman M, Amir N, & Weersing R (2014). Performance-Based Interpretation Bias in Clinically Anxious Youths: Relationships with Attention, Anxiety, and Negative Cognition. Behavior Therapy, 45, 594–605. [DOI] [PubMed] [Google Scholar]
- *Rozenman M, Vreeland A, Piacenti J (2017). Thinking anxious, feeling anxious or both? Cognitive bias moderates the relationship between anxiety disorder status and sympathetic arousal in youth. Journal of Anxiety Disorders, 45, 34–42. [DOI] [PMC free article] [PubMed] [Google Scholar]
- *Salemink E, Friese M, Drake E, Mackintosh B, & Hoppitt L(2013). Indicators of implicit and explicit social anxiety influence threat-related interpretive bias as a function of working memory capacity. Frontiers in Human Neuroscience, 7, 220. [DOI] [PMC free article] [PubMed] [Google Scholar]
- *Salemink E, & Wiers RW. (2014). Alcohol-Related Memory Associations in Positive and Negative Affect Situations: Drinking Motives, Working Memory Capacity, and Prospective Drinking. Psychology of Addictive Behaviors, 28, 105–113. [DOI] [PubMed] [Google Scholar]
- Schneider R, & Schulte D (2007). Panic patients reveal idiographic associations between anxiety symptoms and catastrophes in a semantic priming task. Behaviour Research and Therapy, 45, 211–23. [DOI] [PubMed] [Google Scholar]
- Schmukle SC (2005). Unreliability of the dot probe task. European Journal of Personality, 19, 595–605. [Google Scholar]
- *Sherman JA & Ehrenreich-May J (2017). Ethnicity’s role in the relationship between anxiety and negative interpretation bias among clinically anxious youth: a pilot study. Child Psychiatry and Human Development, 10.1007/s10578-017-0760-x. [DOI] [PubMed] [Google Scholar]
- *Smith HL, Dilon KH, & Cougle JR. (2018). Modification of hostile interpretation bias in depression: a randomized control trial. Behavior Therapy, 49, 198–211. [DOI] [PubMed] [Google Scholar]
- *Smith HL, Summers BJ, Dillon KH, Macatee RJ, & Cougle JR. (2016). Hostile interpretation bias in depression. Journal of Affective Disorders, 203, 9–13. [DOI] [PubMed] [Google Scholar]
- *Steinman SA, & Teachman BA. (2014). Reaching new heights: Comparing interpretation bias modification to exposure therapy for extreme height fear. Journal of consulting and clinical psychology, 82, 404–417. [DOI] [PMC free article] [PubMed] [Google Scholar]
- Stopa L, & Clark DM (2000). Social phobia and interpretation of social events. Behaviour Research and Therapy, 38, 273–283. [DOI] [PubMed] [Google Scholar]
- *Summers BJ, & Cougle JR (2016). Modifying interpretation biases in body dysmorphic disorder: Evaluation of a brief computerized treatment. Behaviour Research and Therapy, 87, 117–127. [DOI] [PubMed] [Google Scholar]
- Teachman BA, Joormann J, Steinman S, & Gotlib IH (2012). Automaticity in Anxiety Disorders and Major Depressive Disorder. Clinical Psychology Review, 32, 575–603. [DOI] [PMC free article] [PubMed] [Google Scholar]
- *Viana AG, Dixon LJ, Stevens EN, Ebesutani C (2016). Parental emotion socialization strategies and their interaction with child interpretation biases among children with anxiety disorders. Cognitive Therapy and Research, 40, 717–731. [Google Scholar]
- Voncken MJ, Bogels SM, & Peeters F. (2007). Specificity of interpretation and judgmental biases in social phobia versus depression. Psychology and Psychotherapy: Theory, Research, and Practice, 80, 443–453. [DOI] [PubMed] [Google Scholar]
- *Yang R, Cui L, Li F, Xiao J, Zhang Q, & Oei TPS (2017). Effects of cognitive bias modification training via smartphones. Frontiers in Psychology, 8(1370). doi: 10.3389/fpsyg.2017.013 [DOI] [PMC free article] [PubMed] [Google Scholar]