

Abstract
ATPases associated with diverse cellular activities (AAA+) proteases utilize ATP hydrolysis to actively unfold native or misfolded proteins and translocate them into a protease chamber for degradation. This basic mechanism yields diverse cellular consequences, including the removal of misfolded proteins, control of regulatory circuits, and remodeling of protein conformation. Among various bacterial AAA+ proteases, FtsH is only membrane‐integrated and plays a key role in membrane protein quality control. Previously, we have shown that FtsH has substantial unfoldase activity for degrading membrane proteins overcoming a dual energetic burden of substrate unfolding and membrane dislocation. Here, we asked how efficiently FtsH utilizes ATP hydrolysis to degrade membrane proteins. To answer this question, we measured degradation rates of the model membrane substrate GlpG at various ATP hydrolysis rates in the lipid bilayers. We find that the dependence of degradation rates on ATP hydrolysis rates is highly nonlinear: (i) FtsH cannot degrade GlpG until it reaches a threshold ATP hydrolysis rate; (ii) after exceeding the threshold, the degradation rates steeply increase and saturate at the ATP hydrolysis rates far below the maxima. During the steep increase, FtsH efficiently utilizes ATP hydrolysis for degradation, consuming only 40–60% of the total ATP cost measured at the maximal ATP hydrolysis rates. This behavior does not fundamentally change against water‐soluble substrates as well as upon addition of the macromolecular crowding agent Ficoll 70. The Hill analysis shows that the nonlinearity stems from coupling of three to five ATP hydrolysis events to degradation, which represents unique cooperativity compared to other AAA+ proteases including ClpXP, HslUV, Lon, and proteasomes.
Keywords: AAA+ protease, FtsH, membrane protein degradation, membrane protein folding, cooperativity, membrane protein quality control, ATP hydrolysis rate, steric trapping
Short abstract
Abbreviations
- 108
an amino acid sequence, SLLWS
- AAA+
ATPases associated with diverse cellular activities
- ATP
adenosine triphosphate
- E. coli
Escherichia coli
- Ea,U
activation energy of unfolding
- GFP
green fluorescent protein
- mSA
monovalent streptavidin
- NBD
nitrobenzoxadiazole
- nH
the Hill coefficient
- PAN
proteasome‐activating AAA+ nucleotidase
- TM
transmembrane
- YccAN
the N‐terminal tail of an E. coli membrane protein YccA
- ΔGoU
free energy of unfolding
Introduction
Unicellular organisms such as bacteria need to maintain an optimal level of functional proteins and readily adjust their proteomes to the changing environment.1, 2 Therefore, rapid degradation of misfolded or damaged proteins as well as native regulatory proteins that are no longer needed is critical to the viability of the cells.3, 4, 5 In bacteria, this process is mainly mediated by ATP‐dependent proteases including ClpXP, ClpAP, HslUV, Lon, and FtsH. They generally work as large protein complexes composed of hexameric ATPases associated with diverse cellular activities (AAA+) ring ATPases and multimeric compartmental peptidases.6 For ClpXP, ClpAP, and HslUV, the AAA+ (ClpX, ClpA, and HslU) and peptidase (ClpP and HslV) domains are synthesized as separate polypeptide chains and posttranslationally assemble with their partners. For Lon and FtsH, the two domains are encoded in a single polypeptide chain and form a hexamer as a functional unit.7, 8, 9, 10, 11 For function, water‐exposed degradation markers on the substrates, which are typically peptide segments largely composed of nonpolar residues, bind to the AAA+ ring at a narrow entry pore.6, 12, 13, 14, 15 Repetitive cycles of ATP hydrolysis on individual AAA+ subunits induce power‐stroke motions, applying vectorial pulling forces on the bound substrate and mechanically unfolding it. By the same force, the unfolded substrate is translocated through the axial pore into the peptidase chamber, in which the substrate is proteolyzed into small fragments and amino acids are recycled.16
Since the coupling of ATP hydrolysis to substrate unfolding and translocation is the hallmark in the mechanisms of ATP‐dependent proteolysis, considerable efforts have been made to quantify how efficiently ATP hydrolysis drives the subsequent energy‐requiring steps.17, 18, 19, 20, 21 Despite the shared mechanisms, each AAA+ protease possesses a substantially different ability to hydrolyze ATP and unfold substrates, the two activities of which are not necessarily correlated.22 ClpAP and ClpXP are robust ATPases (400–900 ATP hydrolysis min−1 AAA+6 −1) and strong unfoldases that can rapidly degrade thermodynamically or kinetically stable globular proteins such as green fluorescent protein (GFP), dihydroxyfolate reductase, barnase, and titin I27.19, 22, 23, 24 Lon can hydrolyze ATP at a moderate speed (150–200 min−1 AAA+6 −1) when stimulated by substrates but has a weaker unfolding power to unfold stable globular proteins.13, 21, 22 HslUV is a slow ATPase (~70 min−1 AAA+6 −1) but can unfold stable substrates as well as ClpAP or ClpXP depending on the location of the degradation marker.22, 25 Finally, FtsH, which is only membrane integrated and growth essential among E. coli AAA+ proteases, is a slow ATPase (50–100 min−1 AAA+6 −1) and cannot actively unfold globular proteins.22, 26
The total ATP costs required to degrade a single copy of substrate are widely varied (0.2–6.6 ATP/residue) depending on the stability of substrate and the type of AAA+ protease.13, 17, 18, 19, 20, 21, 27 It has been shown that the rate‐determining step that requires more ATP hydrolysis is the disruption of tertiary interactions, especially those that stabilize the local structure near the degradation marker.19, 24 Interestingly, a large portion of total hydrolyzed ATP molecules are futile, that is, multiple power‐stroke motions occur to induce a single mechanical unfolding event because the substrate undergoes frequent “slipping‐release” motions without unfolding.19, 28, 29
Although a majority of studies of ATP‐dependent proteolysis have concerned water‐soluble proteins, it is poorly understood how membrane proteins are degraded in cells. Here, we investigated membrane protein degradation mediated by the membrane‐integrated AAA+ protease FtsH of E. coli [Fig. 1(a)], focusing on how efficiently FtsH utilizes ATP hydrolysis for degradation. FtsH family proteins are widely conserved in the inner membranes of bacteria and mitochondria as well as in the thylakoid membranes of chloroplasts.30, 31 In these membranes, they are responsible for quality control of membrane proteins by degrading misassembled, intrinsically unstable or damaged proteins especially under stress conditions (e.g., heat, oxidation, irradiation, and starvation).26, 32, 33, 34, 35, 36, 37, 38, 39, 40, 41, 42, 43, 44 Previously, we have successfully reconstituted FtsH‐mediated membrane protein degradation using the helical bundle membrane protein GlpG as a model membrane substrate and the large negatively charged phospholipid bicelles as a bilayer medium.20 We also have demonstrated that FtsH can accelerate unfolding of GlpG up to ~800‐fold in contrast to its poor unfoldase activity for globular proteins.20
Figure 1.
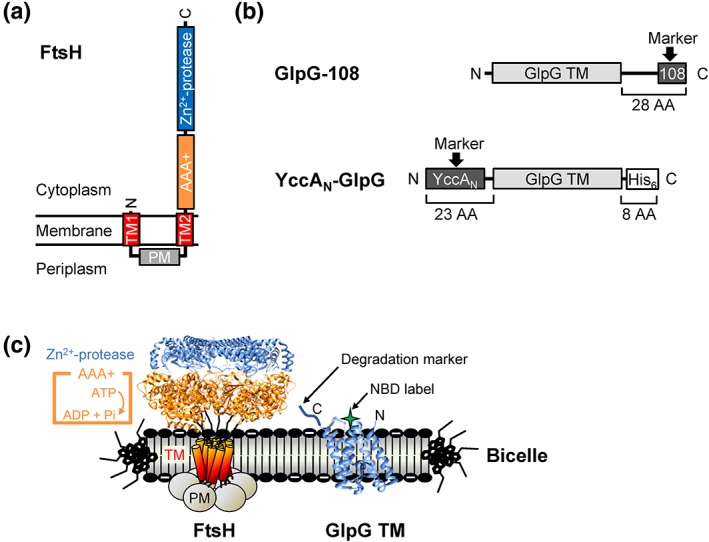
The membrane‐integrated AAA+ protease FtsH and the model membrane substrate GlpG. (a) The domain structure and membrane topology of FtsH. TM: Transmembrane segment; PM: periplasmic domain. (b) The GlpG constructs with the C‐ and N‐terminal degradation markers employed in this study. GlpG TM: The transmembrane domain of GlpG (residues 87–276); the 108‐tag: –SLLWS; the YccAN tag: MDRIVSSSHDRTSLLSTHKVLRN‐. (c) Reconstitution of FtsH‐mediated degradation of GlpG in the negatively charged DMPC/DMPG/CHAPS bicelles (molar ratio, 3:1:1). The thiol‐reactive fluorescent NBD label as a reporter group to monitor degradation was conjugated to the cytoplasmic interfacial region of the middle helix TM3 of the GlpG variant G172C (2IC8) (Reference 49). The structure of the cytoplasmic portion of FtsH from Thermotoga maritima (2CEA) is employed. (Reference 8).
Here, we aim to answer three specific questions: (i) To degrade membrane proteins, FtsH needs to overcome two thermodynamically unfavorable steps, that is, substrate unfolding in the membrane and dislocation of the hydrophobic transmembrane (TM) segments to the proteolytic active sites located in the cytosol [Fig. 1(a)]. Does the degradation linearly correlate with ATP hydrolysis rates or require a threshold? (ii) Apparently large ATP costs in protein degradation by AAA+ proteases have been attributed to the resistance of substrates against unfolding and translocation, and stochastic fluctuations in the mechanical stability of substrates or in the unfolding power of AAA+ proteases.19, 28, 45 Then, what is the effective ATP cost that is converted to actual “work” to degrade membrane proteins? (iii) In cells, protein degradation occurs in the environment crowded with macromolecules, which can affect the conformational equilibria and diffusion of both AAA+ protease and substrate.46 How does macromolecular crowding influence degradation of membrane proteins?
To answer these questions, we measured FtsH‐mediated degradation of the model membrane substrate GlpG over a wide range of ATP hydrolysis rates in bicelles. Unexpectedly, we found a sigmoidal dependence of the degradation rates on the ATP hydrolysis rates. We show that this nonlinearity originates from the cooperativity among multiple ATP hydrolysis events that efficiently converts the released free energy to the work of substrate unfolding and membrane dislocation. Macromolecular crowding mildly impacts the degradation activity. Our result provides new insights into how FtsH utilizes ATP hydrolysis for degrading membrane proteins overcoming the dual energetic burden of substrate unfolding and membrane dislocation.
Results
Dependence of degradation rates on ATP hydrolysis rates has three distinct phases
FtsH is known to initiate degradation by binding to the flexible tail at either N‐ or C‐terminus of a substrate as a degradation marker and processively proteolyze it toward the other end.14, 15, 47 It has also been reported that FtsH can initiate proteolysis at an internal site of a substrate.48 The model membrane substrate GlpG of E. coli is a site‐specific intramembrane protease composed of a cytosolic N‐terminal domain (residues 1–86) and a six‐helical bundle catalytic TM domain (residues 87–276).49 Here, we chose the constructs possessing only the TM domain to exclude the possible involvement of the cytosolic portion in degradation and focus on protein interactions within the membrane. The isolated TM domain is not degraded by FtsH, but becomes a good FtsH substrate when a degradation marker (>~20 residues) is fused to either terminus.20 We used the N‐terminal tail of an E. coli membrane protein YccA (the YccAN‐tag) as an N‐terminal marker and the sequence 108 (the 108‐tag) as a C‐terminal marker [Fig. 1(b)].15, 50 Both tags are known to be specifically recognized by FtsH.47, 51 To monitor degradation, we conjugated the environment‐sensitive fluorophore nitrobenzoxadiazole (NBD) to an engineered cysteine (G172C) in GlpG.20 NBD fluorescence is quenched when the fluorophore is transferred from the hydrophobic bicellar phase to the aqueous phase upon degradation [Fig. 1(c), S1].
To investigate how ATP hydrolysis rates of FtsH influence degradation rates of GlpG, we controlled the ATP hydrolysis rate by varying the concentration of ATP (0–5000 μM) and measured the degradation rate at each ATP concentration in the presence of an ATP regeneration system (see the Materials and Methods section). ATP hydrolysis rates measured as a function of ATP concentration in the presence of GlpG yielded the Michaelis–Menten parameters, K M,ATP ≈ 45 μM and k cat,ATP ≈ 125 min−1 FtsH6 −1 (Fig. S2).20 Thus, the ATP hydrolysis rates varied in the range of 0–125 min−1 FtsH6 −1.
Overall, GlpG with the C‐terminal degradation marker (GlpG‐108) was degraded faster than that with the N‐terminal marker (YccAN‐GlpG) (Fig. 2). The slower degradation of YccAN‐GlpG is due to the higher local conformational stability and hydrophobicity of the N‐terminal region of GlpG, which resist active unfolding and membrane dislocation, respectively.20 It should be noted that, despite the presence of the ATP regeneration system, GlpG degradation by FtsH continued only for 2–4 h, leaving 20–70% of substrates without degradation even after overnight. This is due to the inactivation of FtsH after prolonged enzyme turnover or sample incubation rather than defects in the ATP regeneration system (Fig. S3).
Figure 2.
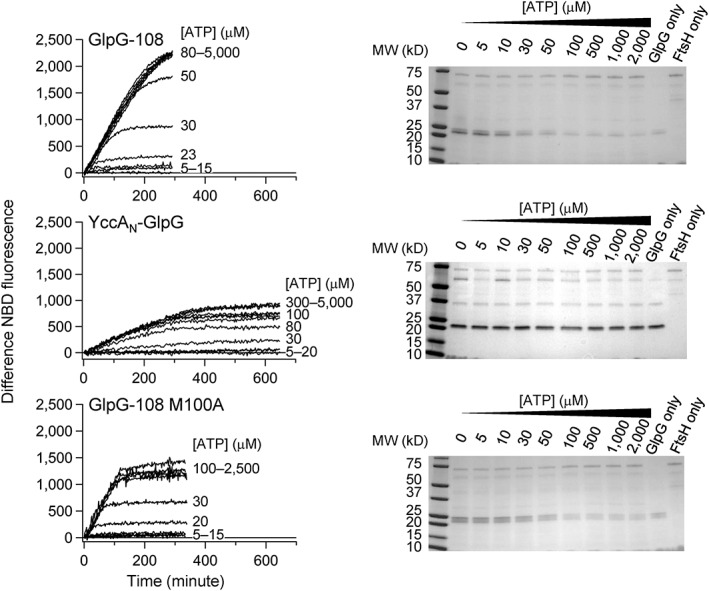
FtsH‐mediated degradation of GlpG in bicelles at various ATP concentrations. (Left) Time‐dependent degradation monitored by NBD fluorescence. (Right) End‐point degradation measured by sodium dodecylsulfate‐polyacrylamide gel electrophoresis (SDS‐PAGE) after 16 h. Top: Degradation of GlpG‐108; middle: degradation of YccAN‐GlpG; and bottom: degradation of the destabilized variant M100A of GlpG‐108. All assays were performed at 37°C with FtsH (2 μM) and GlpG (15 μM) in DMPC/DMPG/CHAPS bicelles (pH 7.5).
Interestingly, the dependence of the degradation rates on the ATP hydrolysis rates displayed a sigmoidal shape with three distinct phases for both GlpG variants [Fig. 3(a), left]: (i) At lower ATP hydrolysis rates (0–20 min−1 FtsH6 −1), the degradation rates were negligible. (ii) As the ATP hydrolysis rates increased (20–80 min−1 FtsH6 −1), the degradation rates steeply increased up to ~0.22 min−1 FtsH6 −1 for GlpG‐108 and 0.12 min−1 FtsH6 −1 for YccAN‐GlpG. (iii) At higher ATP hydrolysis rates (>80 min−1 FtsH6 −1), the degradation rates were saturated without further increase. Notably, the saturation occurred at the ATP hydrolysis rates which were far lower than the maximal ATP hydrolysis rates (k cat,ATP), even close to k cat,ATP/2.
Figure 3.
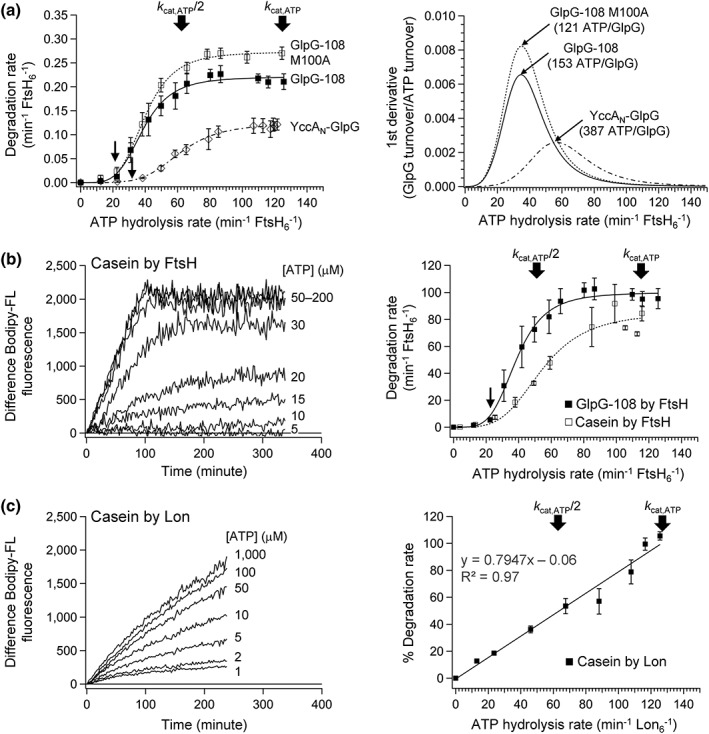
Dependence of the degradation rates of the membrane protein GlpG and water‐soluble casein on the ATP hydrolysis rates. (a) (Left) degradation rates of GlpG‐108, YccAN‐GlpG and GlpG‐108 M100A as a function of ATP hydrolysis rate at 37°C. The positions of the maximal ATP hydrolysis rates (k cat,ATP) and the half maxima (k cat,ATP/2) are marked with block arrows. The threshold ATP hydrolysis rates are marked with line arrows. (Right) The effective ATP cost for degradation of each GlpG variant (in parenthesis) was obtained from the inverse of the maximum value in the first derivative of the plot in left. (b) (Left) Time‐dependent degradation of water‐soluble Bodipy FL‐labeled casein (0.45 mg/mL) by FtsH (2 μM) at various ATP concentrations in neutral DMPC/CHAPS bicelles (molar ratio, 2.5:1). Degradation was monitored by dequenching of Bodipy FL fluorescence (λ excitation = 485 nm; λ emission = 525 nm) at 37°C. (Right) Dependence of the degradation rates of Bodipy FL casein on the ATP hydrolysis rates in comparison to that of GlpG‐108. Values are means ± SEM (N = 2–5). (c) (Left) Time‐dependent degradation of Bodipy FL‐labeled casein (0.08 mg/mL) by E. coli Lon (2 μM) in 20 mM HEPES (pH 7.5), 100 mM KCl, and 1 mM dithiothreitol (DTT) at 30°C. (Right) The relationship between degradation and ATP hydrolysis rates mediated by Lon.
This result indicates that degradation of GlpG requires a threshold level of the ATP hydrolysis rate. Remarkably, the degradation rates are highly sensitive to a small change in ATP concentration (from ~20 to ~60 μM, Fig. 2, right) or ATP hydrolysis rate [from ~25 to ~70 min−1 FtsH6 −1, Fig. 3(a), left] before reaching the maximal degradation rates.
Sigmoidal behavior is intrinsic, not depending either on the conformational stability or membrane localization of substrates
To degrade membrane proteins, FtsH actively unfolds the substrates in the membrane and dislocates them into the proteolytic active sites located in the aqueous phase. GlpG possesses moderate thermodynamic stability (ΔG o U = ~6 kcal/mol) and a high activation energy of unfolding (E a,U = ~30 kcal/mol) in mild detergent dodecylmaltoside.20, 52, 53, 54, 55, 56 Also, the free energy cost for transferring a single hydrophobic TM helix from the lipid bilayer to water in an unfolded form can be substantially large (50–100 kcal/mol).20, 57, 58 We hypothesized that FtsH requires a threshold ATP hydrolysis rate to overcome the conformational stability of GlpG and the large free energy cost for membrane dislocation. If this hypothesis is true, the threshold level will be reduced or disappear if the conformational stability of the substrate decreases or the substrate is not localized in the membrane.
To test this hypothesis, we first used a destabilized GlpG variant M100A with the C‐terminal 108‐tag as a substrate. This mutation disrupts core packing in the TM region of GlpG, lowering ΔG o U and E a,U by ~2.5 and ~5 kcal/mol relative to wild type, respectively.20, 52 This mutation accelerates spontaneous unfolding by 30‐ to 60‐fold in bicelles.20 Nonetheless, this mutation did not change the threshold ATP hydrolysis rate, retaining the sigmoidal relationship between the degradation and ATP hydrolysis rates [Fig. 2, bottom, and Fig. 3(a), left]. The decrease of conformational stability only increased the maximal degradation rate by ~30% as observed in the previous study.20 Next, we tested the influence of membrane localization using the water‐soluble model substrate casein, which lacks both membrane localization and conformational stability [Fig. 3(b)]. Again, the sigmoidal relationship was retained with the clear appearance of threshold at ~20 ATP hydrolysis min−1 FtsH6 −1.
We also asked why the degradation rates of both membrane‐ and water‐soluble substrates are saturated at the ATP hydrolysis rates far lower than the maxima. We suspected that the hexameric Zn2+ protease domain may not be fully functional in our reconstituted system, limiting the flux of translocated substrates toward degradation. However, the addition of the protein stabilizer glycerol or the macromolecular crowding agent Ficoll 70 for enhancing the assembly of FtsH hexamer did not noticeably affect the degradation rate in the absence of both (Fig. S4). Reducing the substrate load by lowering the substrate concentration by 30‐fold did not affect the sigmoidal nature either (Fig. S5).
To further confirm the sigmoidal relationship, we tested degradation of the same model substrate casein by another E. coli AAA+ protease, Lon, by which substrate degradation rates are known to linearly increase proportionally to ATP hydrolysis rates.59 Indeed, the rates of casein degradation and ATP hydrolysis displayed an excellent linear relationship (R 2 = 0.97) [Fig. 3(c), S2(D)]. Therefore, we conclude that the sigmoidal dependence of the degradation rates on the ATP hydrolysis rates is an intrinsic property of FtsH.
The Hill analysis suggests that the sigmoidal dependence stems from the cooperativity among ATP hydrolysis events
The sigmoidal relationship between the degradation and ATP hydrolysis rates strongly suggests cooperativity among multiple ATP hydrolysis events. To quantitatively understand this behavior, we employed the Hill analysis [Fig. 3(a), left]. Surprisingly, although the relationship between ATP concentrations and ATP hydrolysis rates shows weak or no cooperativity (the Hill coefficients, n H,ATP = 0.7–1.3) (Ref. 20 and Fig. S2), we observed strong cooperativity in the relationship between the degradation and ATP hydrolysis rates with n H = 4.3–4.5 for GlpG‐108 and GlpG‐108 M100A, n H = 5.0 for YccAN‐GlpG, and n H = 3.9 for casein (Table 1). K m,ATP values, the ATP hydrolysis rates at which the degradation rates reach a half‐maximum, were 40–60 min−1 FtsH6 −1, 30–50% of the maximal ATP hydrolysis rates.
Table 1.
Kinetic Parameters Describing the Dependence of Degradation Rates of GlpG on ATP Hydrolysis Rates
| k cat,deg a | K m,ATP b | n H, ATP c | |
|---|---|---|---|
| (min−1 FtsH6 −1) | (min−1 FtsH6 −1) | ||
| GlpG‐108 | 0.22 ± 0.01 | 39 ± 1 | 4.3 ± 0.4 |
| GlpG‐108 M100A | 0.27 ± 0.01 | 40 ± 1 | 4.4 ± 0.3 |
| YccAN‐GlpG | 0.12 ± 0.01 | 61 ± 1 | 5.0 ± 0.4 |
| GlpG‐108/Ficoll 70 (15%) | 0.20 ± 0.01 | 50 ± 2 | 3.4 ± 0.4 |
| Casein‐Bodipy FL | N/Ad | 54 ± 5 | 3.9 ± 1.2 |
The maximal degradation rate.
The ATP hydrolysis rate at which the degradation rate becomes k cat,deg/2.
The Hill coefficient.
Not determined because of the uncertainty in the molecular weight of Casein‐Bodipy FL.
The parameters were obtained by fitting of the data in Figure 3(a) (left), Figure 3(b) (right), and Figure 5(a) to the Hill equation (Equation 4)
Our Hill analysis reveals a remarkable principle of how FtsH, which is known as a weaker ATPase and unfoldase than other AAA+ proteases, utilizes ATP hydrolysis to carry out protein degradation. At low ATP hydrolysis rates (<20–30 min−1 FtsH6 −1), FtsH cannot drive substrate unfolding and membrane dislocation. As the ATP hydrolysis rate increases, accumulated ATP hydrolysis events start to cooperate, inducing substrate degradation that efficiently reaches the maximal rates. The steep increase of the degradation rates is an outcome of coupling of four to five ATP hydrolysis events that occur probably in an independent, stochastic manner on individual AAA+ subunits in FtsH. This cooperative behavior by FtsH is distinct from degradation mediated by other AAA+ proteases such as ClpXP, HslUV, Lon, proteasome‐activating AAA+ nucleotidase (PAN), and 26S proteasomes, which linearly increase degradation rates in response to an increase in ATP hydrolysis rate.17, 18, 59, 60, 61
Effective ATP cost for degrading GlpG
The total ATP costs by AAA+ proteases for degrading substrates have been quantified under the steady‐state conditions, where both ATP hydrolysis rates and degradation rates are maximal19:
| (Eq. 1) |
Here, k cat,ATP designates the maximal ATP hydrolysis rate per AAA+ hexamer at a saturating concentration of substrate, and τ deg indicates the substrate lifetime, that is, the inverse of the maximal substrate degradation rate, k cat,deg. Using this equation, we have determined the total ATP costs, 380 ATP for GlpG‐108, 270 ATP for destabilized variant GlpG‐108 M100A, and 550 ATP for YccAN‐GlpG.20 Despite the relevance, however, this method will generally overestimate the ATP costs for FtsH‐mediated degradation because the ATP hydrolysis rates at which the degradation rates reach a maximum are much lower than the maximal ATP hydrolysis rates.
Therefore, we suggest an alternative approach to quantify an “effective” ATP cost that actually leads to substrate degradation using the degradation rate versus the ATP hydrolysis rate plot [Fig. 3(a), left].17 As shown in the plot, after the ATP hydrolysis rates exceed the thresholds, the degradation rates increase until reaching a saturation level. In this increasing range, the inverse of the slope represents the excess number of ATP hydrolysis required to degrade one more unit of GlpG:
| (Eq. 2) |
The slope at each ATP hydrolysis rate was obtained by taking the first derivative of the functional form of the Hill equation [Fig. 3(a), right]. For each GlpG variant, we defined the effective ATP cost at the ATP hydrolysis rate, which yielded a maximal slope. The effective ATP costs were 153 ATP for GlpG‐108, 121 ATP for GlpG‐108 M100A, and 387 ATP for YccAN‐GlpG. These values were only 40–45% (GlpG‐108 WT and M100A) and ~70% (YccAN‐GlpG) of the total ATP costs measured under the steady‐state conditions.20 Thus, FtsH utilizes ATP hydrolysis more efficiently than previously thought, and the effective ATP cost is well correlated with the local stability of the region to which the degradation marker is fused.
Macromolecular crowding does not affect ATPase and protease activities of FtsH
Finally, we asked how the physical environment mimicking the crowded cellular environment influences ATPase and degradation activities of FtsH using the inert macromolecular crowding agent Ficoll 70 (average molecular weight ≈70 kDa; hydrodynamic radius ≈4 nm).62 Crowding agents at high concentrations in solution place steric constraints on proteins because of the large excluded volume. The reduced free space can influence the equilibria of protein conformations and protein–protein interactions.46, 63 In general, macromolecular crowding is known to induce compaction of unfolded states and enhance protein–protein interactions.64 We expected that Ficoll 70, which has a molecular weight similar to FtsH, may influence ATPase and degradation activities of FtsH by enhancing the hexameric assembly of FtsH, facilitating the interaction between FtsH and substrate, or possibly decreasing the volume of unfolded GlpG.
We first measured the effect of Ficoll 70 on ATPase activity in bicelles. In the range of 0–15% (w/v) Ficoll 70, ATP hydrolysis rates did not change significantly [Fig. 4(a), Fig. S6]. Also, the Michaelis–Menten analysis at 15% Ficoll 70 indicates a negligible influence of the crowding agent on ATPase activity [Fig. 4(b)]. Before assessing the effect of Ficoll 70 on degradation activity of GlpG, we tested whether the macromolecular crowding would impact the conformational stability of GlpG in the novel steric trapping method using the mild dodecylmaltoside detergent. Steric trapping couples transient unfolding of a doubly biotinylated protein to simultaneous binding of two bulky monovalent streptavidin (mSA) molecules [52 kD; Fig. 4(c)].52 This method is advantageous for measuring protein stability directly under native solvent or lipid conditions. The thermodynamic stability (ΔG o U) of GlpG was determined from the binding isotherm between doubly biotinylated GlpG and an mSA variant with a reduced biotin‐binding affinity (mSA‐S27A) (Fig. S7 for the schemes of biotinylation and binding assay). The attenuation of the second binding phase is correlated with the stability of GlpG. Addition of 15% Ficoll 70 moderately decreased the stability by ΔΔG o U = 0.4 ± 0.2 kcal/mol [Fig. 4(d)]. Probably, the excluded volume by Ficoll 70 mildly stabilized the unfolded state by inducing its compaction in the micellar phase.
Figure 4.
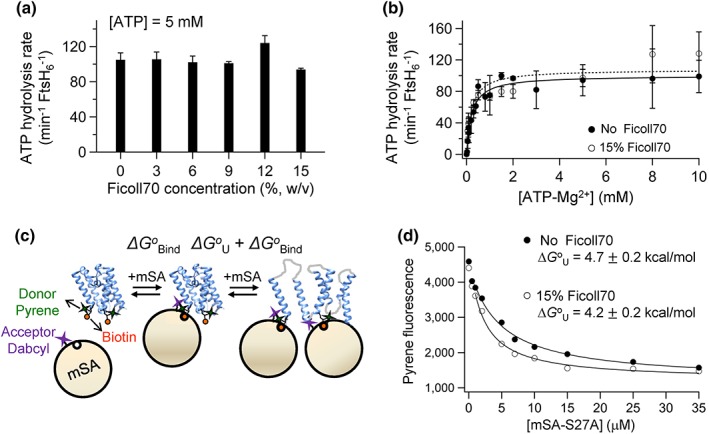
The effects of the macromolecular crowding agent Ficoll 70 on ATPase activity of FtsH and thermodynamic stability of GlpG. (a) Dependence of ATP hydrolysis rates of FtsH (2 μM) on the concentration of Ficoll 70 measured at a saturating concentration of ATP (5 mM) in DMPC/DMPG/CHAPS bicelles at 37°C (see also Fig. S6). (b) Michaelis–Menten analysis of ATPase activity in DMPC/DMPG/CHAPS bicelles in the presence and absence of 15% Ficoll 70 (w/v). (c) The principle of steric trapping.52 When biotin tags are conjugated to two specific residues that are spatially close in the folded state but distant in the amino acid sequence, the first mSA binds either biotin label with the intrinsic binding affinity (ΔG o Bind). Because of steric hindrance, the second mSA binds only when native tertiary contacts are unraveled by transient unfolding. Hence, binding of the second mSA is attenuated depending on the stability of the target protein (ΔG o Bind + ΔG o U). By adjusting the biotin affinity of mSA by mutation, unfolding and binding reactions can be reversibly controlled, and ΔG o U of the target protein can be obtained by monitoring the binding of the second mSA. Binding of mSA to biotin labels on GlpG was measured by FRET‐based assay employing the BtnPyr label (donor) and mSA labeled with a nonfluorescent dabcyl quencher (acceptor) [Ref. 52 Fig. S7(a)]. (d) The effect of Ficoll 70 on the stability of GlpG in dodecylmaltoside detergent (5 mM). Binding isotherms between double‐biotin variants of GlpG (172/267‐BtnPyr2) and a mSADAB variant with a reduced biotin‐binding affinity (mSADAB‐S27A, K d,biotin = 1.4 nM) monitored by quenching of pyrene fluorescence.52 15% Ficoll 70 does not affect the intrinsic biotin‐binding affinity of mSA to the biotin labels [Fig. S7(B)]. Values are means ± SEM (N = 2–3).
Next, the degradation rates of GlpG‐108 were measured as a function of ATP hydrolysis rate in bicelles containing 15% (w/v) Ficoll 70 [Fig. 5(a)]. While Ficoll 70 overall induced a decrease of degradation rates, the threshold ATP hydrolysis and maximal degradation rates remained similar, and the degradation rate became less sensitive to the increase of ATP hydrolysis rate. As a result, the effective ATP cost increased by 40% relative to that without Ficoll 70 [Fig. 5(b)]. Probably, the large increase in viscosity caused by Ficoll 70 slowed down the dislocation of the unfolded substrate, making the ATP cost larger.65 Overall, the macromolecular crowding had a mild impact on the activities of FtsH.
Figure 5.
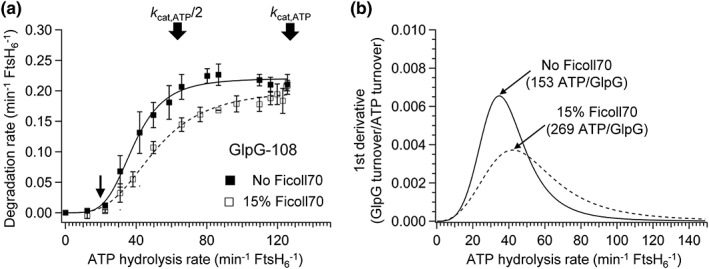
The effect of the macromolecular crowding agent Ficoll 70 on the relationship between the degradation and ATP hydrolysis rates. (a) Degradation rates of GlpG‐108 in DMPC/DMPG/CHAPS bicelles measured as a function of ATP hydrolysis rate in the presence of 15% Ficoll 70. The data were compared with those in the absence of Ficoll 70. Values are means ± SEM (N = 2). (b) The influence of Ficoll 70 on the effective ATP cost (parenthesis) obtained from the inverse of the first derivative of the plot in Figure 5(a).
Discussion
The most striking finding of this study is that degradation rates of FtsH display a nonlinear dependence on ATP hydrolysis rates. At least, ~20 ATP hydrolysis events need to be accumulated per minute for degradation to occur, but once exceeding the threshold, FtsH tightly couples ATP hydrolysis to degradation in a highly cooperative manner (n H = 4–5). The degradation rates are saturated at remarkably low ATP hydrolysis rates, with only 50–70% of the maximal ATP hydrolysis rates. It is surprising because in the cases of other relatively well‐characterized AAA+ proteases such as E. coli ClpXP, E. coli HslUV, E. coli Lon, yeast 20S proteasomes, and archaeal PAN proteasomes, the rates of degradation and ATP hydrolysis are linearly correlated.18, 59, 60, 61, 66 A notable exception is degradation of GFP by ClpXP, which requires ~20% of the maximal ATP hydrolysis rate to initiate degradation.60 In that study, the existence of the threshold has been attributed to a stable unfolding intermediate of GFP, which is rapidly formed in‐between low‐frequency bursts of ATP hydrolysis on ClpX.28, 60 However, after the ATP hydrolysis rate exceeds the threshold, the degradation rate of GFP keeps increasing until the ATP hydrolysis rate reaches a maximum. This is different from the unique cooperativity observed in FtsH‐mediated degradation.
We also hypothesized that certain folding features of GlpG may have caused the appearance of the threshold. In comparison to water‐soluble substrates, ATP‐dependent degradation of membrane proteins poses a general thermodynamic challenge, that is, dislocation of hydrophobic TM segments from the membrane to the proteolytic active sites located in the cytosol (ΔG dislocation = 50–100 kcal/mol per TM),20, 57, 58 as seen in the degradation by FtsH, the endoplasmic reticulum‐associated degradation by the Hrd1 ubiquitin ligase complex/Cdc48 (an AAA+ enzyme)/26S proteasome system and the dislocation of mislocalized tail‐anchored membrane proteins from the mitochondrial outer membranes by the membrane‐anchored AAA+ enzyme Msp1.43, 67, 68, 69 The conformational stabilities of membrane proteins can also be substantial (ΔG o U = 3–12 kcal/mol).52, 70, 71, 72, 73 Nonetheless, we always observed a sigmoidal dependence with thresholds, regardless of substrate stability and membrane localization, indicating that the high degree of cooperativity among ATP hydrolysis events is an intrinsic feature of FtsH‐mediated protein degradation. Probably, this cooperativity would be suitable for FtsH to efficiently overcome the large energetic costs of substrate unfolding and membrane dislocation.
Another interesting finding in this study is that while ATP hydrolysis on FtsH occurs independently (n H ≈ 1 for ATP hydrolysis rates vs. ATP concentration), these independent events become cooperative in degrading substrates. Because the Hill coefficients in this process are 4–5, we can speculate that the cooperativity stems from the coordination of ATP hydrolysis throughout the subunits within the AAA+ hexamer ring of FtsH. Intriguingly, a recent cryogenic electron microscopy (cryo‐EM) study of FtsH orthologs, Yme1 of yeast, suggests a remarkable mechanism by which the Yme1 hexamer carries out substrate translocation by tightly coordinating ATP‐bound, ADP‐bound, and apo forms of the six AAA+ subunits with (4ATP:1ADP:1apo) stoichiometry.9 However, the cryo‐EM structures of substrate‐bound 26S proteasomes that have a linear relationship between degradation and ATP hydrolysis rates also show a similar number of bound nucleotides (4ATP:1ADP:1apo, 3ATP:2ADP:1apo, or 3ATP:1ADP:2apo).74 The structures of PAN proteasomes that have the linear relationship again suggest the coordination of five nucleotides' binding (4ATP:1ADP:1apo) on the PAN ATPase during substrate translocation.75 These results imply that the coordination of multiple nucleotides' binding itself may not explain the cooperativity between multiple ATP hydrolysis events for degradation by FtsH. To better understand the mechanism, it is necessary to precisely determine the binding stoichiometry, affinity, and kinetics between FtsH and ATP or ADP as well as to track down the origin of cooperativity at each functional step during degradation.
Our study suggests that FtsH is a slow but highly efficient degradation machine for membrane proteins. The effective ATP costs for degrading GlpG (150–390 ATP, 0.6–1.9 ATP per residue) were only 40–70% of those measured under steady‐state conditions (380–550 ATP, 1.8–2.6 ATP hydrolysis per residue).20 Considering the reported range of ATP costs for various AAA+ proteases and substrates (0.2–6.6 ATP per residue),13, 17, 18, 19, 20, 21, 27 the effective ATP costs by FtsH fall into the lower edge of the range. This finding demonstrates a remarkable ATP efficiency achieved by FtsH, which overcomes the large free energy costs to degrade membrane proteins. Our result reasonably agrees with recent single‐molecule force spectroscopic studies showing that ClpXP spends 40–70% of the time working for unfolding and translocation with many futile ATP hydrolysis events over a wide range of dwelling time (a few seconds to a hundred seconds) before inducing abrupt and cooperative substrate unfolding.28, 29
What can we learn about membrane protein quality control in the cells from our in vitro studies? The macromolecular crowding agent Ficoll 70 for mimicking the cellular environment has mild impacts on ATPase and degradation activities of FtsH. Therefore, it is likely that the features of FtsH discovered in this study will be maintained in the cells. The fact that the maximal degradation rates depend on the conformational stability suggests that the AAA+ ATPase of FtsH has a limited pulling power such that, as the ATP hydrolysis rate increases, an equilibrium point is reached at which the resisting force (substrate stability, hydrophobicity, and diffusive dissociation of substrates) and pulling force are balanced. This principle may explain the ability of FtsH as quality control machinery for membrane proteins, preferentially degrading misfolded or intrinsically unstable membrane proteins.
We observed that, because of the cooperativity, the maximal degradation rates of FtsH are reached at surprisingly low ATP concentrations (60–80 μM). For comparison, degradation activity of ClpXP can be modulated in the range of 0–500 μM ATP because of the linearity between ATP hydrolysis and degradation rates.22, 60, 76 Considering that ATP concentrations in a single E. coli cell vary from ~200 to ~5000 μM under normal growth conditions,77 ClpXP activity will respond sensitively to the changes in the availability of ATP. One clear example is the control of the cellular concentration of RspO (σ s factor) by ClpXP in E. coli. RspO is accumulated under nutrient deprivation or in the stationary growth phase, inducing the transcription of various stress response genes.1 Degradation of RspO by ClpXP is known to be directly controlled by the cellular level of ATP upon carbon starvation.78 On the other hand, we expect that FtsH works at its full degradation capacity under broad stress conditions, which compromise membrane protein quality and deplete the cellular levels of ATP.79, 80, 81 This feature may also serve as a safety scheme at an elevated ATP level (e.g., heat shock),82 preventing excessive membrane protein degradation in the cell membranes.
Materials and Methods
Cloning, expression, and purification of FtsH
FtsH encoded in the pET21a vector with a C‐terminal His6‐tag was expressed in E. coli C43 (DE3) cells.52 The cells transformed with the expression vector were cultivated in LB (Luria‐Bertani) media (100 mg/L ampicillin) at 37°C until OD600nm (optical density at 600 nm) reached 0.9–1.1. Protein expression was induced with 1 mM isopropyl β‐d‐thiogalactopyranoside (IPTG) and the culture was further incubated at 37°C for an additional 3 h. Harvested cells were resuspended in 25 mM Tris‐(hydroxymethyl)‐aminomethane–HCl (Tris–HCl, pH 8.0), 0.1% β‐mercaptoethanol (BME) (v/v), and 0.5 mM phenylmethylsulfonyl fluoride (PMSF). After cell lysis and removal of cell debris, the total membrane fraction was obtained by ultracentrifugation (Beckman Coulter, Type 45 Ti rotor) at 28,000 rpm for 2 h. The membrane pellets were resuspended in base buffer (25 mM Tris–HCl, pH 8.0, 200 mM KCl, and 15% glycerol) using a tissue homogenizer. The resuspension was solubilized by the addition of Triton X‐100 to a final concentration of 2% (w/v), followed by the removal of aggregation by centrifugation. FtsH in the supernatant was purified using Ni2+‐NTA affinity chromatography (Qiagen) with elution buffer (base buffer with 0.1% Triton X‐100, 20 mM imidazole, 15% glycerol, and 0.1% BME). Excess imidazole was removed in a desalting column (Bio‐Rad). The protein was concentrated to the final volume of 0.5–1.0 mL (60–150 μM) per liter culture (660 nm protein assay, Pierce). All purification procedures were carried out at 4°C.
ATPase activity assay of FtsH
The ATP hydrolysis rate by FtsH was measured by an enzyme‐coupled assay using a microplate reader (M5e, Molecular Devices) at 37°C. The assay solution contained 2 μM FtsH, 20 mM 4‐(2‐hydroxyethyl)‐1‐piperazineethanesulfonic acid (HEPES, pH 7.5), 10 mM MgCl2, 400 μM ZnCl2, 0.1% BME, 100 mM KCl, 15% glycerol, 0.5 mM NADH, 10 mM phosphoenolpyruvic acid, 0.5 units of pyruvate kinase, and 0.5 units of lactic dehydrogenase. The oxidation of NADH coupled to ATP hydrolysis was monitored by OD340 nm.
Preparation of bicelles
Fifteen percent (w/v) stock of DMPC (1,2‐dimyristoyl‐sn‐glycero‐3‐phosphocholine)/DMPG (1,2‐dimyristoyl‐sn‐glycero‐3‐phospho‐[1′‐rac‐glycerol])/CHAPS (3‐[(3‐cholamidopropyl)dimethylammonio]‐1‐propanesulfonate) (lipid‐to‐detergent molar ratio, q = 2.8) bicelles was prepared by resuspending DMPC/DMPG (molar ratio = 3:1) lipids with water and then by addition of CHAPS to the desired q value. Bicellar samples were homogenized using freeze–thaw cycles and sonication. Bicellar stocks were kept at −20°C prior to use.
Cloning and mutagenesis of GlpG
A GlpG TM domain (residues 87–276) fused to a N‐terminal maltose‐binding protein (MBP) followed by a cleavage site for tobacco etch virus nuclear‐inclusion‐A endopeptidase (TEVcleavage) was cloned into pET30a vector using NdeI and XhoI restriction sites.20 A degradation marker for FtsH was fused to the N‐ (the YccAN tag) or C‐terminus (the 108‐tag) of GlpG. The resulting constructs were MBP‐TEVcleavage‐YccAN‐GlpG‐His6 and His6‐MBP‐TEVcleavage‐GlpG‐108. Cysteine mutant G172C was generated by QuikChange site‐directed mutagenesis for thiol‐reactive fluorophore labeling.
Purification of GlpG variants
MBP‐TEVcleavage‐GlpG possessing a degradation marker was expressed in E. coli BL21 (DE3) RP cells.20 Escherichia coli cells transformed with a GlpG plasmid were cultivated in LB media (50 mg/L kanamycin) at 37°C until an OD600nm reached 0.6–0.9. The culture was cooled down on ice. Protein expression was induced with IPTG at a final concentration of 0.5 mM for 16 h at 15°C. The cells were harvested and resuspended in 50 mM Tris–HCl buffer (pH 8.0) with 0.5 mM tris(2‐carboxyethyl)phosphine hydrochloride (TCEP) and 0.5 mM PMSF. After cell lysis and removal of cell debris, the supernatant was ultracentrifuged at 28,000 rpm for 2 h in a Type 45 Ti rotor to yield the total membrane fraction. The membrane pellets were resuspended in 50 mM Tris–HCl, 200 mM NaCl, and 0.5 mM TCEP buffer solution (pH 8.0) and solubilized by the addition of n‐decyl‐β‐d‐maltoside (DM, Anatrace) to a final concentration of 2% (w/v). After the removal of aggregation using centrifugation, His6‐MBP‐TEVcleavage‐GlpG‐108 was purified using Ni2+‐NTA affinity chromatography. Excess imidazole was removed in a desalting column (Bio‐Rad). The linker between His6‐MBP and GlpG was cleaved using TEV protease with an N‐terminal His7‐tag ([GlpG]/[TEV protease] = 5) after 6 h of gentle stirring at room temperature. Ni‐NTA resin was added to the cleavage product to bind His7‐TEV protease and His6‐MBP. The GlpG portion was isolated in the flow‐through and further concentrated. MBP‐TEVcleavage‐YccAN‐GlpG‐His6 was first cleaved by TEV protease without a His6‐tag for 6 h of gentle stirring at room temperature and purified by Ni‐NTA affinity chromatography. Excess imidazole was removed in a desalting column and the protein was further concentrated.
NBD labeling of GlpG variants
Thirty to Fifty micromolar of purified single‐cysteine mutant (G172C) of GlpG variants in 0.5% DM, 50 mM Tris–HCl, and 200 mM NaCl (pH 8.0) was incubated with 0.5 mM TCEP for 1 h at room temperature. Thiol‐reactive, environment‐sensitive fluorophore IA‐NBD dissolved in dimethylsulfoxide (DMSO) was added to the mixture at a final concentration of 1 mM while vortexing. A labeling reaction was incubated at 4°C overnight. Excess free labels were removed by dialysis against buffer containing 0.2% DM, 20 mM HEPES, and 100 mM KCl (pH 7.6) and a desalting column. The labeling efficiency of NBD ranged from 0.5 to 1.2 as determined by comparing the concentration of NBD measured by UV–Vis absorbance (ε 480nm = 23,500 M cm−1) to that of GlpG measured by 660 nm protein assay (Pierce).
Reconstitution of GlpG in bicelles and degradation assay using NBD fluorescence
Degradation of NBD‐labeled GlpG variants by FtsH was measured in 2% (w/v) negatively charged bicelles (DMPC/DMPG/CHAPS, q = 2.8). GlpG was first reconstituted in 3% (w/v) DMPC/DMPG liposomes ([DMPC]:[DMPG] = 3:1) in 20 mM HEPES (pH 7.5) 100 mM KCl, 15% glycerol, and 0.1% BME. The NBD‐labeled GlpG stock in DM was mixed with the lipids solubilized with 4% n‐octyl‐β‐d‐glucoside to a final concentration of 50–100 μM and incubated on ice for 1 h. For removal of residual detergents, the mixture was dialyzed against 20 mM HEPES (pH 7.5), 100 mM KCl, and 0.1% BME at 4°C overnight, followed by incubation with Bio‐Beads (Bio‐Rad) for 3 days at room temperature. The resulting proteoliposomes were extruded through a 0.2 μM pore size polycarbonate membrane (Waters) to remove aggregation. The total phospholipid concentration was determined by an organic phosphate assay. On the basis of measured lipid concentration, a desired amount of CHAPS was added to form bicelles with q = 2.8. The final concentration of NBD‐labeled GlpG in bicelles was determined by 660 nm assay.
Time‐dependent degradation of GlpG was measured in 2% bicellar solution (20 mM HEPES, pH 7.5, 100 mM KCl, 15% glycerol, 0.1% BME, 10 mM MgCl2, and 400 μM ZnCl2) with an ATP regeneration system (0.5 unit/100 μL pyruvate kinase and 10 mM phosphoenolpyruvic acid). FtsH was incorporated into bicelles by the direct injection of FtsH stock solution in Triton X‐100 to preformed bicelles at a final monomer concentration of 2 μM on ice. A total volume of 100 μL of each sample was transferred to a 96‐well UV‐compatible microplate (Greiner Bio‐One) and sealed with a polyolefin film. Degradation of GlpG was initiated by the addition of ATP to each well and monitored by quenching of NBD fluorescence at 545 nm with an excitation wavelength of 485 nm using a plate reader. The change of NBD fluorescence induced by GlpG degradation was obtained by subtracting the time‐dependent change of NBD fluorescence in the presence of ATP from that in the absence of ATP at each GlpG concentration. The degradation rate of GlpG by each FtsH hexamer per minute (ν deg) is defined as:
| (Eq. 3) |
where ΔF/min and ΔF ∞/[GlpG] were obtained from the slopes as shown in Figure S1C and S1D, respectively. For the assay of casein degradation, casein excessively labeled with Bodipy FL (Thermo Fisher Scientific) was used. Casein degradation was monitored by dequenching of Bodipy FL fluorescence at 525 nm (λ emission = 485 nm).
The Hill equation to fit the degradation rate versus the ATP hydrolysis rate of FtsH is given as:
| (Eq. 4) |
where n H,ATP is the Hill constant of FtsH hexamer ATPase activity.
Cloning, expression, and purification of E. coli Lon
The gene of lon of E. coli strain K12 MG1655 was amplified by colony polymerase chain reaction (PCR) with the primers containing NheI (5′‐end) and XhoI (3′‐end) restriction sites, and then inserted into the pET21a vector with a C‐terminal His6‐tag. The Lon protein was expressed in E. coli C43 (DE3) pLysS cells. The cells transformed with the expression vector were cultivated in LB media (100 mg/L ampicillin) at 37°C until OD600nm reached 0.6. Protein expression was induced with 0.2 mM IPTG, and the culture was further incubated at 24°C for an additional 16 h. Harvested cells were resuspended in resuspension buffer (20 mM HEPES pH 7.5, 400 mM NaCl, 100 mM KCl, and 1 mM TCEP). After cell lysis using a C5 pressure homogenizer, the soluble fraction was obtained by ultracentrifugation (Beckman Coulter, Type 45 Ti rotor) at 18,000 rpm for 20 min. The supernatant containing Lon was purified using Ni2+‐NTA‐affinity chromatography (Qiagen). The packed resin was washed with resuspension buffer containing 100 mM imidazole and eluded with 15 mL resuspension buffer containing 800 mM imidazole. Excess imidazole in the eluent was removed by dialysis against storage buffer (25 mM HEPES pH 7.5, 100 mM KCl, and 1 mM DTT). Purified Lon was concentrated to the final concentration of 40–50 μM per liter culture (660 nm protein assay, Pierce). All purification procedures were carried out at 4°C.
Measuring thermodynamic stability of GlpG using steric trapping
Detailed procedures of steric trapping have been previously reported.52 Briefly, a double‐cysteine variant of GlpG (G172C/V267C) purified in dodecylmaltoside (DDM, Anatrace) was labeled with the thiol‐reactive biotin derivative possessing pyrene fluorophore, N‐(5‐(2‐iodoacetamido)‐6‐oxo‐6‐(2‐(+)‐biotin hydrazinyl)hexyl)‐4‐(pyren‐1‐yl)butanamide (BtnPyr‐IA) to yield 172/267‐BtnPyr2.52 Thermodynamic stability of GlpG in DDM micelles was determined by measuring the attenuated second binding of mSA labeled with a dabcyl quencher (mSADAB) to 172/267‐BtnPyr2 at room temperature.52 mSADAB binding was monitored by quenching of pyrene fluorescence from BtnPyr labels by Förster resonance energy transfer. 1 μM of 172/267C‐BtnPyr2 was titrated with an mSADAB variant possessing a reduced biotin‐binding affinity,52 mSADAB‐S27A (K d,biotin = 1.4 ± 0.9 nM) in 20 mM DDM, 0.25 mM TCEP, 20 mM sodium phosphate, and 200 mM NaCl (pH 7.5).52 Quenching of pyrene‐monomer fluorescence at 390 nm was monitored at an excitation wavelength of 345 nm using a plate reader. The attenuated second binding phase of a binding isotherm was fitted to the equation:
| (Eq. 5) |
where F is the measured fluorescence intensity, and F 0 and F ∞ are the fluorescence intensities at [mSA] = 0 and at the saturated‐bound level, respectively. [mSA] is the total mSA concentration, K d,biotin is the dissociation constant for unhindered biotin‐binding affinity of mSA, and K U is the equilibrium constant for unfolding of GlpG. After obtaining the fitted K U, the thermodynamic stability was calculated using the equation ΔG o U = –RTlnK U.
Conflict of Interest
The authors declare that there is no conflict of interest related to this work.
Supporting information
Figure S1 The procedures to determine FtsH‐mediated degradation of GlpG using NBD fluorescence.
Figure S2. Measurement of ATP hydrolysis rate of FtsH as a function of ATP concentration.
Figure S3. Supporting data for explaining incomplete degradation of GlpG by FtsH in Figure 2.
Figure S4. The addition of glycerol (protein stabilizer) or Ficoll 70 (macromolecular crowding agent) does not significantly affect the degradation rates of GlpG.
Figure S5. Reducing the substrate load for FtsH does not fundamentally change the relationship between the degradation and ATP hydrolysis rates.
Figure S6. The macromolecular crowding agent Ficoll 70 does not significantly affect the intrinsic binding affinity of monovalent streptavidin to a single biotin label on GlpG‐G172C.
Figure S7. The macromolecular crowding agent Ficoll 70 does not affect the ATP hydrolysis rate by FtsH.
Acknowledgments
We thank Denis Proshlyakov at Michigan State University for stimulating discussion and the Hong lab members for critical reading of the manuscript. This work is supported by NIH (R01GM118685), the cystic fibrosis basic research grant from the Hunt for Cure Foundation, and the Michigan State University start‐up fund to H.H.
Significance statement: FtsH is a membrane‐integrated ATP‐dependent protease, playing a key role in membrane protein quality control. Here, we investigated how FtsH utilizes ATP hydrolysis to degrade proteins. We find that FtsH couples multiple ATP hydrolysis events to degradation in a highly cooperative and efficient manner. This mechanism explains how FtsH overcomes large energetic costs in unfolding substrates in the membranes and extracting them toward its protease domain located outside the membrane.
References
- 1. Battesti A, Majdalani N, Gottesman S (2011) The RpoS‐mediated general stress response in Escherichia coli . Annu Rev Microbiol 65:189–213. [DOI] [PMC free article] [PubMed] [Google Scholar]
- 2. Gottesman S (1996) Proteases and their targets in Escherichia coli . Annu Rev Genet 30:465–506. [DOI] [PubMed] [Google Scholar]
- 3. Mogk A, Huber D, Bukau B (2011) Integrating protein homeostasis strategies in prokaryotes. Cold Spring Harb Perspect Biol 3:a004366. [DOI] [PMC free article] [PubMed] [Google Scholar]
- 4. Wickner S, Maurizi MR, Gottesman S (1999) Posttranslational quality control: folding, refolding, and degrading proteins. Science 286:1888–1893. [DOI] [PubMed] [Google Scholar]
- 5. Gottesman S, Wickner S, Maurizi MR (1997) Protein quality control: triage by chaperones and proteases. Genes Dev 11:815–823. [DOI] [PubMed] [Google Scholar]
- 6. Sauer RT, Baker TA (2011) AAA+ proteases: ATP‐fueled machines of protein destruction. Annu Rev Biochem 80:587–612. [DOI] [PubMed] [Google Scholar]
- 7. Vieux EF, Wohlever ML, Chen JZ, Sauer RT, Baker TA (2013) Distinct quaternary structures of the AAA plus Lon protease control substrate degradation. Proc Natl Acad Sci U S A 110:E2002–E2008. [DOI] [PMC free article] [PubMed] [Google Scholar]
- 8. Bieniossek C, Niederhauser B, Baumann UM (2009) The crystal structure of apo‐FtsH reveals domain movements necessary for substrate unfolding and translocation. Proc Natl Acad Sci U S A 106:21579–21584. [DOI] [PMC free article] [PubMed] [Google Scholar]
- 9. Puchades C, Rampello AJ, Shin M, Giuliano CJ, Wiseman RL, Glynn SE, Lander GC (2017) Structure of the mitochondrial inner membrane AAA+ protease YME1 gives insight into substrate processing. Science 358:eaao0464. [DOI] [PMC free article] [PubMed] [Google Scholar]
- 10. Lee S, Augustin S, Tatsuta T, Gerdes F, Langer T, Tsai FT (2011) Electron cryomicroscopy structure of a membrane‐anchored mitochondrial AAA protease. J Biol Chem 286:4404–4411. [DOI] [PMC free article] [PubMed] [Google Scholar]
- 11. Suno R, Niwa H, Tsuchiya D, Zhang XD, Yoshida M, Morikawa K (2006) Structure of the whole cytosolic region of ATP‐dependent protease FtsH. Mol Cell 22:575–585. [DOI] [PubMed] [Google Scholar]
- 12. Gottesman S, Roche E, Zhou Y, Sauer RT (1998) The ClpXP and ClpAP proteases degrade proteins with carboxy‐terminal peptide tails added by the SsrA‐tagging system. Genes Dev 12:1338–1347. [DOI] [PMC free article] [PubMed] [Google Scholar]
- 13. Gur E, Sauer RT (2008) Recognition of misfolded proteins by Lon, a AAA+ protease. Genes Dev 22:2267–2277. [DOI] [PMC free article] [PubMed] [Google Scholar]
- 14. Chiba S, Akiyama Y, Ito K (2002) Membrane protein degradation by FtsH can be initiated from either end. J Bacteriol 184:4775–4782. [DOI] [PMC free article] [PubMed] [Google Scholar]
- 15. Chiba S, Akiyama Y, Mori H, Matsuo E, Ito K (2000) Length recognition at the N‐terminal tail for the initiation of FtsH‐mediated proteolysis. EMBO Rep 1:47–52. [DOI] [PMC free article] [PubMed] [Google Scholar]
- 16. Olivares AO, Baker TA, Sauer RT (2018) Mechanical protein unfolding and degradation. Annu Rev Physiol 80:413–429. [DOI] [PubMed] [Google Scholar]
- 17. Benaroudj N, Zwickl P, Seemuller E, Baumeister W, Goldberg AL (2003) ATP hydrolysis by the proteasome regulatory complex PAN serves multiple functions in protein degradation. Mol Cell 11:69–78. [DOI] [PubMed] [Google Scholar]
- 18. Peth A, Nathan JA, Goldberg AL (2013) The ATP costs and time required to degrade ubiquitinated proteins by the 26 S proteasome. J Biol Chem 288:29215–29222. [DOI] [PMC free article] [PubMed] [Google Scholar]
- 19. Kenniston JA, Baker TA, Fernandez JM, Sauer RT (2003) Linkage between ATP consumption and mechanical unfolding during the protein processing reactions of an AAA+ degradation machine. Cell 114:511–520. [DOI] [PubMed] [Google Scholar]
- 20. Yang Y, Guo R, Gaffney K, Kim M, Muhammednazaar S, Tian W, Wang B, Liang J, Hong H (2018) Folding‐degradation relationship of a membrane protein mediated by the universally conserved ATP‐dependent protease FtsH. J Am Chem Soc 140:4656–4665. [DOI] [PMC free article] [PubMed] [Google Scholar]
- 21. Wohlever ML, Nager AR, Baker TA, Sauer RT (2013) Engineering fluorescent protein substrates for the AAA+ Lon protease. Protein Eng Des Sel 26:299–305. [DOI] [PMC free article] [PubMed] [Google Scholar]
- 22. Koodathingal P, Jaffe NE, Kraut DA, Prakash S, Fishbain S, Herman C, Matouschek A (2009) ATP‐dependent proteases differ substantially in their ability to unfold globular proteins. J Biol Chem 284:18674–18684. [DOI] [PMC free article] [PubMed] [Google Scholar]
- 23. Kim YI, Burton RE, Burton BM, Sauer RT, Baker TA (2000) Dynamics of substrate denaturation and translocation by the ClpXP degradation machine. Mol Cell 5:639–648. [DOI] [PubMed] [Google Scholar]
- 24. Lee C, Schwartz MP, Prakash S, Iwakura M, Matouschek A (2001) ATP‐dependent proteases degrade their substrates by processively unraveling them from the degradation signal. Mol Cell 7:627–637. [DOI] [PubMed] [Google Scholar]
- 25. Yakamavich JA, Baker TA, Sauer RT (2008) Asymmetric nucleotide transactions of the HslUV protease. J Mol Biol 380:946–957. [DOI] [PMC free article] [PubMed] [Google Scholar]
- 26. Herman C, Prakash S, Lu CZ, Matouschek A, Gross CA (2003) Lack of a robust unfoldase activity confers a unique level of substrate specificity to the universal AAA protease FtsH. Mol Cell 11:659–669. [DOI] [PubMed] [Google Scholar]
- 27. Okuno T, Yamada‐Inagawa T, Karata K, Yamanaka K, Ogura T (2004) Spectrometric analysis of degradation of a physiological substrate sigma32 by Escherichia coli AAA protease FtsH. J Struct Biol 146:148–154. [DOI] [PubMed] [Google Scholar]
- 28. Maillard RA, Chistol G, Sen M, Righini M, Tan J, Kaiser CM, Hodges C, Martin A, Bustamante C (2011) ClpX(P) generates mechanical force to unfold and translocate its protein substrates. Cell 145:459–469. [DOI] [PMC free article] [PubMed] [Google Scholar]
- 29. Aubin‐Tam ME, Olivares AO, Sauer RT, Baker TA, Lang MJ (2011) Single‐molecule protein unfolding and translocation by an ATP‐fueled proteolytic machine. Cell 145:257–267. [DOI] [PMC free article] [PubMed] [Google Scholar]
- 30. Langer T (2000) AAA proteases: cellular machines for degrading membrane proteins. Trends Biochem Sci 25:247–251. [DOI] [PubMed] [Google Scholar]
- 31. Ito K, Akiyama Y (2005) Cellular functions, mechanism of action, and regulation of FtsH protease. Annu Rev Microbiol 59:211–231. [DOI] [PubMed] [Google Scholar]
- 32. Akiyama Y, Kihara A, Tokuda H, Ito K (1996) FtsH (HflB) is an ATP‐dependent protease selectively acting on SecY and some other membrane proteins. J Biol Chem 271:31196–31201. [DOI] [PubMed] [Google Scholar]
- 33. Hari SB, Sauer RT (2016) The AAA+ FtsH protease degrades an ssrA‐tagged model protein in the inner membrane of Escherichia coli . Biochemistry 55:5649–5652. [DOI] [PMC free article] [PubMed] [Google Scholar]
- 34. Jarvi S, Suorsa M, Tadini L, Ivanauskaite A, Rantala S, Allahverdiyeva Y, Leister D, Aro EM (2016) Thylakoid‐bound FtsH proteins facilitate proper biosynthesis of photosystem I. Plant Physiol 171:1333–1343. [DOI] [PMC free article] [PubMed] [Google Scholar]
- 35. Krynicka V, Shao S, Nixon PJ, Komenda J (2015) Accessibility controls selective degradation of photosystem II subunits by FtsH protease. Nat Plants 1:15168. [DOI] [PubMed] [Google Scholar]
- 36. Ostersetzer O, Adam Z (1997) Light‐stimulated degradation of an unassembled Rieske FeS protein by a thylakoid‐bound protease: the possible role of the FtsH protease. Plant Cell 9:957–965. [DOI] [PMC free article] [PubMed] [Google Scholar]
- 37. Arlt H, Steglich G, Perryman R, Guiard B, Neupert W, Langer T (1998) The formation of respiratory chain complexes in mitochondria is under the proteolytic control of the m‐AAA protease. EMBO J 17:4837–4847. [DOI] [PMC free article] [PubMed] [Google Scholar]
- 38. Leonhard K, Stiegler A, Neupert W, Langer T (1999) Chaperone‐like activity of the AAA domain of the yeast Yme1 AAA protease. Nature 398:348–351. [DOI] [PubMed] [Google Scholar]
- 39. Nolden M, Ehses S, Koppen M, Bernacchia A, Rugarli EI, Langer T (2005) The m‐AAA protease defective in hereditary spastic paraplegia controls ribosome assembly in mitochondria. Cell 123:277–289. [DOI] [PubMed] [Google Scholar]
- 40. Janska H, Kwasniak M, Szczepanowska J (2013) Protein quality control in organelles—AAA/FtsH story. Biochim Biophys Acta 1833:381–387. [DOI] [PubMed] [Google Scholar]
- 41. Janska H, Piechota J, Kwasniak M (2010) ATP‐dependent proteases in biogenesis and maintenance of plant mitochondria. Biochim Biophys Acta 1797:1071–1075. [DOI] [PubMed] [Google Scholar]
- 42. Langer T, Kaser M, Klanner C, Leonhard K (2001) AAA proteases of mitochondria: quality control of membrane proteins and regulatory functions during mitochondrial biogenesis. Biochem Soc Trans 29:431–436. [DOI] [PubMed] [Google Scholar]
- 43. Leonhard K, Guiard B, Pellecchia G, Tzagoloff A, Neupert W, Langer T (2000) Membrane protein degradation by AAA proteases in mitochondria: extraction of substrates from either membrane surface. Mol Cell 5:629–638. [DOI] [PubMed] [Google Scholar]
- 44. Leonhard K, Herrmann JM, Stuart RA, Mannhaupt G, Neupert W, Langer T (1996) AAA proteases with catalytic sites on opposite membrane surfaces comprise a proteolytic system for the ATP‐dependent degradation of inner membrane proteins in mitochondria. EMBO J 15:4218–4229. [PMC free article] [PubMed] [Google Scholar]
- 45. Cordova JC, Olivares AO, Shin Y, Stinson BM, Calmat S, Schmitz KR, Aubin‐Tam ME, Baker TA, Lang MJ, Sauer RT (2014) Stochastic but highly coordinated protein unfolding and translocation by the ClpXP proteolytic machine. Cell 158:647–658. [DOI] [PMC free article] [PubMed] [Google Scholar]
- 46. Rivas G, Minton AP (2016) Macromolecular crowding in vitro, in vivo, and in between. Trends Biochem Sci 41:970–981. [DOI] [PMC free article] [PubMed] [Google Scholar]
- 47. Herman C, Thevenet D, Bouloc P, Walker GC, D'Ari R (1998) Degradation of carboxy‐terminal‐tagged cytoplasmic proteins by the Escherichia coli protease HflB (FtsH). Genes Dev 12:1348–1355. [DOI] [PMC free article] [PubMed] [Google Scholar]
- 48. Okuno T, Yamanaka K, Ogura T (2006) An AAA protease FtsH can initiate proteolysis from internal sites of a model substrate, apo‐flavodoxin. Genes Cells 11:261–268. [DOI] [PubMed] [Google Scholar]
- 49. Wang Y, Zhang Y, Ha Y (2006) Crystal structure of a rhomboid family intramembrane protease. Nature 444:179–180. [DOI] [PubMed] [Google Scholar]
- 50. Parsell DA, Silber KR, Sauer RT (1990) Carboxy‐terminal determinants of intracellular protein degradation. Genes Dev 4:277–286. [DOI] [PubMed] [Google Scholar]
- 51. Kihara A, Akiyama Y, Ito K (1998) Different pathways for protein degradation by the FtsH/HflKC membrane‐embedded protease complex: an implication from the interference by a mutant form of a new substrate protein, YccA. J Mol Biol 279:175–188. [DOI] [PubMed] [Google Scholar]
- 52. Guo R, Gaffney K, Yang Z, Kim M, Sungsuwan S, Huang X, Hubbell WL, Hong H (2016) Steric trapping reveals a cooperativity network in the intramembrane protease GlpG. Nat Chem Biol 12:353–360. [DOI] [PMC free article] [PubMed] [Google Scholar]
- 53. Min D, Jefferson RE, Bowie JU, Yoon TY (2015) Mapping the energy landscape for second‐stage folding of a single membrane protein. Nat Chem Biol 11:981–987. [DOI] [PMC free article] [PubMed] [Google Scholar]
- 54. Paslawski W, Lillelund OK, Kristensen JV, Schafer NP, Baker RP, Urban S, Otzen DE (2015) Cooperative folding of a polytopic alpha‐helical membrane protein involves a compact N‐terminal nucleus and nonnative loops. Proc Natl Acad Sci U S A 112:7978–7983. [DOI] [PMC free article] [PubMed] [Google Scholar]
- 55. Baker RP, Urban S (2012) Architectural and thermodynamic principles underlying intramembrane protease function. Nat Chem Biol 8:759–768. [DOI] [PMC free article] [PubMed] [Google Scholar]
- 56. Lu W, Schafer NP, Wolynes PG (2018) Energy landscape underlying spontaneous insertion and folding of an alpha‐helical transmembrane protein into a bilayer. Nat Commun 9:4949. [DOI] [PMC free article] [PubMed] [Google Scholar]
- 57. Cymer F, von Heijne G, White SH (2015) Mechanisms of integral membrane protein insertion and folding. J Mol Biol 427:999–1022. [DOI] [PMC free article] [PubMed] [Google Scholar]
- 58. Preiner J, Janovjak H, Rankl C, Knaus H, Cisneros DA, Kedrov A, Kienberger F, Muller DJ, Hinterdorfer P (2007) Free energy of membrane protein unfolding derived from single‐molecule force measurements. Biophys J 93:930–937. [DOI] [PMC free article] [PubMed] [Google Scholar]
- 59. Waxman L, Goldberg AL (1982) Protease La from Escherichia coli hydrolyzes ATP and proteins in a linked fashion. Proc Natl Acad Sci U S A 79:4883–4887. [DOI] [PMC free article] [PubMed] [Google Scholar]
- 60. Martin A, Baker TA, Sauer RT (2008) Protein unfolding by a AAA+ protease is dependent on ATP‐hydrolysis rates and substrate energy landscapes. Nat Struct Mol Biol 15:139–145. [DOI] [PubMed] [Google Scholar]
- 61. Baytshtok V, Chen JJ, Glynn SE, Nager AR, Grant RA, Baker TA, Sauer RT (2017) Covalently linked HslU hexamers support a probabilistic mechanism that links ATP hydrolysis to protein unfolding and translocation. J Biol Chem 292:5695–5704. [DOI] [PMC free article] [PubMed] [Google Scholar]
- 62. Armstrong JK, Wenby RB, Meiselman HJ, Fisher TC (2004) The hydrodynamic radii of macromolecules and their effect on red blood cell aggregation. Biophys J 87:4259–4270. [DOI] [PMC free article] [PubMed] [Google Scholar]
- 63. Minton AP (2005) Models for excluded volume interaction between an unfolded protein and rigid macromolecular cosolutes: macromolecular crowding and protein stability revisited. Biophys J 88:971–985. [DOI] [PMC free article] [PubMed] [Google Scholar]
- 64. Kuznetsova IM, Turoverov KK, Uversky VN (2014) What macromolecular crowding can do to a protein. Int J Mol Sci 15:23090–23140. [DOI] [PMC free article] [PubMed] [Google Scholar]
- 65. Shi XY, Wu T, Cole CM, Devaraj NK, Joseph S (2018) Optimization of ClpXP activity and protein synthesis in an E. coli extract‐based cell‐free expression system. Sci Rep 8:3488. [DOI] [PMC free article] [PubMed] [Google Scholar]
- 66. Benaroudj N, Goldberg AL (2000) PAN, the proteasome‐activating nucleotidase from archaebacteria, is a protein‐unfolding molecular chaperone. Nat Cell Biol 2:833–839. [DOI] [PubMed] [Google Scholar]
- 67. Carvalho P, Goder V, Rapoport TA (2006) Distinct ubiquitin‐ligase complexes define convergent pathways for the degradation of ER proteins. Cell 126:361–373. [DOI] [PubMed] [Google Scholar]
- 68. Kihara A, Akiyama Y, Ito K (1999) Dislocation of membrane proteins in FtsH‐mediated proteolysis. EMBO J 18:2970–2981. [DOI] [PMC free article] [PubMed] [Google Scholar]
- 69. Wohlever ML, Mateja A, McGilvray PT, Day KJ, Keenan RJ (2017) Msp1 is a membrane protein dislocase for tail‐anchored proteins. Mol Cell 67:194–202. [DOI] [PMC free article] [PubMed] [Google Scholar]
- 70. Sanders MR, Findlay HE, Booth PJ (2018) Lipid bilayer composition modulates the unfolding free energy of a knotted alpha‐helical membrane protein. Proc Natl Acad Sci U S A 115:E1799–E1808. [DOI] [PMC free article] [PubMed] [Google Scholar]
- 71. Chang YC, Bowie JU (2014) Measuring membrane protein stability under native conditions. Proc Natl Acad Sci U S A 111:219–224. [DOI] [PMC free article] [PubMed] [Google Scholar]
- 72. Findlay HE, Rutherford NG, Henderson PJ, Booth PJ (2010) Unfolding free energy of a two‐domain transmembrane sugar transport protein. Proc Natl Acad Sci U S A 107:18451–18456. [DOI] [PMC free article] [PubMed] [Google Scholar]
- 73. Harris NJ, Findlay HE, Simms J, Liu X, Booth PJ (2014) Relative domain folding and stability of a membrane transport protein. J Mol Biol 426:1812–1825. [DOI] [PubMed] [Google Scholar]
- 74. Dong YC, Zhang SW, Wu ZL, Li XM, Wang WL, Zhu YA, Stoilova‐McPhie S, Lu Y, Finley D, Mao YD (2019) Cryo‐EM structures and dynamics of substrate‐engaged human 26S proteasome. Nature 565:49–55. [DOI] [PMC free article] [PubMed] [Google Scholar]
- 75. Majumder P, Rudack T, Beck F, Danev R, Pfeifer G, Nagy I, Baumeister W (2019) Cryo‐EM structures of the archaeal PAN‐proteasome reveal an around‐the‐ring ATPase cycle. Proc Natl Acad Sci U S A 116:534–539. [DOI] [PMC free article] [PubMed] [Google Scholar]
- 76. Hersch GL, Burton RE, Bolon DN, Baker TA, Sauer RT (2005) Asymmetric interactions of ATP with the AAA+ ClpX6 unfoldase: allosteric control of a protein machine. Cell 121:1017–1027. [DOI] [PubMed] [Google Scholar]
- 77. Yaginuma H, Kawai S, Tabata KV, Tomiyama K, Kakizuka A, Komatsuzaki T, Noji H, Imamura H (2014) Diversity in ATP concentrations in a single bacterial cell population revealed by quantitative single‐cell imaging. Sci Rep 4:6522. [DOI] [PMC free article] [PubMed] [Google Scholar]
- 78. Peterson CN, Levchenko I, Rabinowitz JD, Baker TA, Silhavy TJ (2012) RpoS proteolysis is controlled directly by ATP levels in Escherichia coli . Genes Dev 26:548–553. [DOI] [PMC free article] [PubMed] [Google Scholar]
- 79. Linkerhagner K, Oelze J (1995) Cellular Atp levels and nitrogenase switchoff upon oxygen stress in chemostat cultures of Azotobacter vinelandii . J Bacteriol 177:5289–5293. [DOI] [PMC free article] [PubMed] [Google Scholar]
- 80. Picard M, McEwen BS, Epel ES, Sandi C (2018) An energetic view of stress: focus on mitochondria. Front Neuroendocrinol 49:72–85. [DOI] [PMC free article] [PubMed] [Google Scholar]
- 81. Tiwari BS, Belenghi B, Levine A (2002) Oxidative stress increased respiration and generation of reactive oxygen species, resulting in ATP depletion, opening of mitochondrial permeability transition, and programmed cell death. Plant Physiol 128:1271–1281. [DOI] [PMC free article] [PubMed] [Google Scholar]
- 82. Soini J, Falschlehner C, Mayer C, Bohm D, Weinel S, Panula J, Vasala A, Neubauer P (2005) Transient increase of ATP as a response to temperature up‐shift in Escherichia coli . Microb Cell Fact 4:9. [DOI] [PMC free article] [PubMed] [Google Scholar]
Associated Data
This section collects any data citations, data availability statements, or supplementary materials included in this article.
Supplementary Materials
Figure S1 The procedures to determine FtsH‐mediated degradation of GlpG using NBD fluorescence.
Figure S2. Measurement of ATP hydrolysis rate of FtsH as a function of ATP concentration.
Figure S3. Supporting data for explaining incomplete degradation of GlpG by FtsH in Figure 2.
Figure S4. The addition of glycerol (protein stabilizer) or Ficoll 70 (macromolecular crowding agent) does not significantly affect the degradation rates of GlpG.
Figure S5. Reducing the substrate load for FtsH does not fundamentally change the relationship between the degradation and ATP hydrolysis rates.
Figure S6. The macromolecular crowding agent Ficoll 70 does not significantly affect the intrinsic binding affinity of monovalent streptavidin to a single biotin label on GlpG‐G172C.
Figure S7. The macromolecular crowding agent Ficoll 70 does not affect the ATP hydrolysis rate by FtsH.