

SUMMARY
Early genome-wide association studies (GWASs) led to the surprising discovery that, for typical complex traits, most of the heritability is due to huge numbers of common variants with tiny effect sizes. Previously, we argued that new models are needed to understand these patterns. Here, we provide a formal model in which genetic contributions to complex traits are partitioned into direct effects from core genes and indirect effects from peripheral genes acting in trans. We propose that most heritability is driven by weak trans-eQTL SNPs, whose effects are mediated through peripheral genes to impact the expression of core genes. In particular, if the core genes for a trait tend to be co-regulated, then the effects of peripheral variation can be amplified such that nearly all of the genetic variance is driven by weak trans effects. Thus, our model proposes a framework for understanding key features of the architecture of complex traits.
Graphical Abstract

In Brief
Development of the “omnigenic” model to encompass specific effects on gene expression provides a defined framework for testing how variants in core and peripheral genes reflect genetic heritability.
INTRODUCTION
During the past 12 years, genome-wide association studies (GWASs) have been used to study the genetic basis for a wide variety of complex traits ranging from diseases such as diabetes, Crohn’s disease, and schizophrenia to quantitative traits such as lipid levels, height, and educational attainment (Wellcome Trust Case Control Consortium, 2007). These studies have identified thousands of genetic loci associated with diverse complex traits, and in some cases, it has been possible to dissect the molecular mechanisms that link the identified GWAS variants to disease (Claussnitzer et al., 2015; Sekar et al., 2016).
Nonetheless, early practitioners of GWASs were surprised to find that even the strongest GWAS hits tend to have modest effect sizes on risk and that all the genome-wide significant hits in combination explained only a small fraction of the expected genetic component of risk (Manolio et al., 2009). For example, the 18 genome-wide significant loci for type 2 diabetes identified by 2010 explained just 6% of the expected heritability; for height, the 40 genome-wide significant loci explained just 5% of the heritability (Manolio et al., 2009). Since then, the fractions of heritability explained by genome-wide significant loci have only increased modestly, even with much larger sample sizes and many more significant loci (Shi et al., 2016). The observation that genome-wide significant loci only capture a small proportion of the expected genetic heritability became known as the problem of “missing heritability.” Subsequent work has largely resolved this initial mystery by showing that most of the missing heritability is due to large numbers of small-effect common variants that are not significant at current sample sizes (Purcell et al., 2009; Yang et al., 2010; Loh et al., 2015; Shi et al., 2016).
While the initial mystery has been resolved, the resolution led to another surprising finding: the large numbers of small-effect variants tend to be spread extremely widely across the genome and implicate a considerable fraction of all genes expressed in relevant tissues. Indeed, for many traits, most of the genome contributes to heritability (Purcell et al., 2009). For example, between 71% and 100% of 1 megabase (Mb) windows in the genome are estimated to contribute to the heritability of schizophrenia (Loh et al., 2015). Similarly, a recent study of polygenic prediction models found that for most of the diseases studied, the models achieved peak accuracies when assuming that 0.1%–1% of common SNPs have causal effects (Khera et al., 2018).
We recently argued that the data suggest a large fraction of all genes expressed in relevant tissues can affect a phenotype and that much of the trait variance is mediated through genes that are not directly involved in the trait in question (Boyle et al., 2017a). These observations appear at odds with conventional ways of understanding the links from genotype to phenotype. Indeed, much of the progress in classical genetics has come from detailed molecular work to dissect the biological mechanisms of individual mutations. That work is predicated on the expectation that there is a relatively direct molecular pathway from genotype to phenotype. Yet the genetic basis of complex traits is highly diffuse, and it remains unclear how we should conceptualize the molecular mapping from genotype to phenotype.
Specifically, the data suggest several key questions:
Why does such a large portion of the genome contribute to heritability?
Why do the lead hits for a typical trait contribute so little to heritability?
What factors determine the effect sizes of SNPs on traits?
In this paper, we develop a statistical model to explore these questions. Our model necessarily simplifies a more complex reality and elides specific details of biology and genetic architecture that vary across traits. Nonetheless, we believe it is essential for the field to develop conceptual models for understanding complex trait architecture, and the model proposed here is a step in that direction.
The central thesis of the present paper is that known properties of cis- and trans-regulatory effects (i.e., cis and trans expression- or protein-quantitative trait loci [eQTLs and pQTLs, respectively]) provide essential clues to understanding key features of the architecture of complex traits.
RESULTS
Key Observations
As discussed in our previous paper (Boyle et al., 2017a), a conceptual model of complex traits should allow for the following observations:
The most important loci contribute only a modest fraction of the total heritability (Shi et al., 2016). Nevertheless, for many traits the most significant signals are located near genes that make functional sense. This has been established both by detailed molecular dissection of top hits as well as by enrichment analyses of significant loci (although the strength of enrichment is generally modest and varies among traits) (Jostins et al., 2012; Wood et al., 2014; Fernandez-Tajes et al., 2018; Zhu and Stephens, 2018).
The bulk of the heritability can be attributed to a huge number of common variants with very small effect sizes. Moreover, these variants tend to be spread very broadly across the genome (Loh et al., 2015). For traits such as schizophrenia and height, analyses suggest that as many as half of all SNPs may be in linkage disequilibrium with causal variants (Boyle et al., 2017a).
Consistent with the latter observations, genes with putatively relevant functions (e.g., neuronal functions for schizophrenia and immune functions for Crohn’s disease) contribute only slightly more to the heritability than do random genes, as measured on a per-SNP basis. While gene functional annotations are imperfect, it is worth noting that other kinds of experiments, such as genome-scale CRISPR screens, often yield much stronger functional enrichments than seen in most GWAS data (Bassik et al., 2013; Parnas et al., 2015; Kramer et al., 2018). The clearest functional pattern is that genes not expressed in relevant cell types do not contribute significantly to heritability (Boyle et al., 2017a).
Similarly, the per-SNP heritability in tissue-specific regulatory elements is only modestly increased relative to SNPs in broadly active regulatory elements, provided that they are active in relevant tissues (Boyle et al., 2017a). Thus, various lines of evidence indicate that the heritability of a typical complex trait is driven by variation in a large number of regulatory elements and genes, spread widely across the genome, and mediated through a wide range of gene functional categories.
For most complex traits, the heritability is dominated by common variants (Shi et al., 2016; Yang et al., 2010; Glassberg et al., 2019). While rare variants with large effect sizes do exist for some complex traits, and often highlight genes with key biological roles (Clément et al., 1998; Dron and Hegele, 2016), rare variants are generally not major contributors to the overall phenotypic variance.
SNPs in active chromatin and protein-coding variants are both significantly enriched for contributing to complex traits. However, protein-coding variants are relatively rare in the genome and thus contribute only a small fraction of heritability. Instead, the heritability is generally dominated by noncoding variants, especially variants in gene regulatory regions (Pickrell, 2014; Trynka et al., 2013; Finucane et al., 2015). There is strong enrichment of both cis- and trans-eQTLs among GWAS hits, albeit still a considerable gap in linking all hits to eQTLs (Ardlie et al., 2015; Westra et al., 2013; Emilsson et al., 2018; Chun et al., 2017; Võsa et al., 2018).
Together, these points suggest an architecture in which some genes (and their regulatory networks) are functionally proximate to disease risk. These genes tend to produce the biggest signals in common- and rare-variant association studies, and they tend to be the most illuminating from the point of view of understanding disease etiology. However, they are responsible for only a small fraction of the genetic variance in disease risk. Instead, the bulk of the heritability is mediated through genes that have a wide variety of functions, many of which have no obvious functional connection to disease. Lastly, most of the GWAS hits are in noncoding, putatively regulatory regions of the genome, indicating that the primary links between genetic variation and complex disease are via gene regulation.
The Omnigenic Model
We previously proposed the omnigenic model as a conceptual framework to explain the observations above (Figure 1) (Boyle et al., 2017a, 2017b). The omnigenic model partitions genes into core genes and peripheral genes. Core genes can affect disease risk directly, while peripheral genes can only affect risk indirectly through trans-regulatory effects on core genes. Two key proposals of the omnigenic model are (1) that most, if not all, genes expressed in trait-relevant cells have the potential to affect core-gene regulation and (2) that for typical traits, nearly all of the heritability is determined by variation near peripheral genes. Thus, while core genes are the key drivers of disease, it is the cumulative effects of many peripheral gene variants that determine polygenic risk.
Figure 1. Our Model Starts by Defining “Core” Genes as the Set of Genes that Exert Direct Effects on a Trait, i.e., Not Mediated through Regulation of Other Genes.
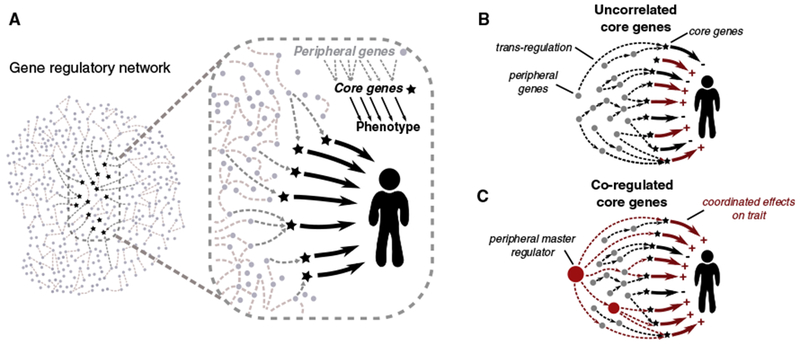
(A) Core genes are embedded in gene regulatory networks; other expressed genes (i.e., peripheral genes) may affect core-gene expression through the network and thus affect the trait indirectly. (B) According to the model, most cis-regulatory variants for peripheral genes are also weak trans-QTLs for core genes, and the direction of effect varies across core genes. Thus, typical peripheral variants make tiny contributions to heritability, but because there are so many, they are responsible for most of the heritability. (C) Some peripheral genes drive coordinated regulation of multiple core genes with shared directional effects and can thus stand out as relatively strong GWAS hits. As discussed later in the paper, likely examples include KLF14 and IRX3/5 (Claussnitzer et al., 2015; Small et al., 2018).
As defined in this paper, “omnigenic” has a more precise meaning than the term “polygenic.” Polygenic can be used to describe the involvement of anything from tens of loci to every variant in the genome and would include omnigenic as a special case, toward the high end of the polygenic spectrum. We also use the term “omnigenic model” to refer to our specific model of complex trait architecture in which heritability is mainly driven by peripheral genes that trans-regulate core genes. It is also worth distinguishing our model from Fisher’s classic infinitesimal model (Fisher, 1918; Barton et al., 2017). The infinitesimal model was originally developed in the pre-molecular era. While fundamentally important for understanding patterns of inheritance, it does not tell us how many causal variants to expect in practice nor about the molecular mechanisms linking genetic variation to phenotypes.
Definitions
We define a gene as a “core gene” if and only if the gene product (protein, or RNA for a noncoding gene) has a direct effect—not mediated through regulation of another gene—on cellular and organismal processes leading to a change in the expected value of a particular phenotype. This definition improves on our previous definition of core genes, which was less precise.
All other genes expressed in relevant cell types are considered “peripheral genes” and can only affect the phenotype indirectly through regulatory effects on core genes. Here, we use the term “regulatory” to include diverse forms of regulation of core genes by other gene products within a cell: this includes regulation of mRNA or protein expression levels, and transcript usage; post-translational modifications such as phosphorylation and glycosylation; and protein localization. We exclude detection of extracellular signaling such as hormones or cytokines from this definition, such that signaling receptors can be core genes (see Discussion).
These definitions imply that the phenotype of an individual is conditionally independent of the peripheral genes, given the expression levels and coding sequences of the core genes (Figure 2).
Figure 2. Causal Pathways for Variants Affecting a Trait through Core Genes.
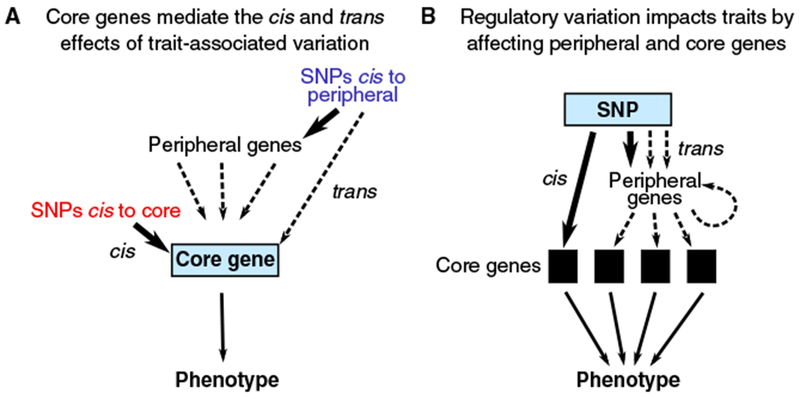
By definition, only the core genes exert direct effects on the phenotype. We assume that they do so mainly through variation in expression levels. (A) cis- and trans-regulatory effects are funneled through core genes to affect the phenotype. (B) From the vantage point of a regulatory QTL SNP, effects fan out through cellular regulatory networks to affect one or more core genes.
Lastly, genes that are “unexpressed” in trait-relevant tissues are assumed not to contribute to heritability.
While most peripheral genes make small contributions to heritability, some peripheral genes, such as transcription factors and protein regulators, play important roles because they regulate multiple core genes (Figure 1C). As discussed below, when a single peripheral gene coordinately regulates multiple downstream core genes with shared directions of effect, there is a potential for relatively large effect sizes at that peripheral gene. We refer to such genes as “peripheral master regulators.” In the Discussion, we provide examples to illustrate these definitions.
The Role of Natural Selection in Shaping Genetic Architecture
In this article, we consider all of the parameter values—including SNP allele frequencies and effect sizes and the structure of regulatory networks—as fixed (though generally not known at the present time) and seek to understand how these drive the architecture of complex traits.
However, it is important to note that these parameters are evolved properties of the biological system. In particular, natural selection acts most strongly against the largest-effect variants (Simons et al., 2018). This limits the potential contributions of the most constrained genes, and thus, the genes that are biologically most important for a given trait may contribute less to heritability than would be expected from their intrinsic importance (O’Connor et al., 2018). For example, it has been argued that master regulators are under particularly strong selective constraint; hence, they may not show up well in association studies of common variants (Chen et al., 2017). We plan to expand on these points in a future manuscript.
A Quantitative Phenotype Model Based on Core-Gene Expression
To model the contribution of core and peripheral genes to complex trait heritability, we now propose a quantitative model that links phenotypic variation to the expression levels of core genes in a disease-relevant tissue:
| (1) |
Here Yi denotes the phenotype value in individual i, and is the population mean phenotype. γj, denotes the direct effect of a unit change in expression of core gene j on E(Yi), and xi,j, is the expression of gene j in individual i (with population mean ). There are M core genes out of N total expressed genes. The random error term εYirepresents environmental and stochastic effects. It has mean 0 and is assumed to be independent of genotype and gene expression. A summary of notation and further modeling details appears in the STAR Methods.
Importantly, this model assumes that each core gene affects the expected phenotype value as a linear function of its expression level (with slope γj). Although the expression levels of peripheral genes do not have direct effects on phenotype Y, peripheral genes can affect Y indirectly by modifying the expression of core genes as trans-QTLs. This model assumes the simplest possible relationship between expression levels of core genes and the phenotype: namely that the expression of each core gene is linearly related to the expected phenotype value and with no additional interaction terms.
Though we do not consider it here, many traits are affected by distinct biological processes acting in different tissues. This would be easy to model by adding tissue-specific subscripts to the notation. Then, assuming no interaction terms between tissues, the GWAS effect size on SNP l is just the sum of tissue-specific effects. We also note that, although this model is described in terms of quantitative phenotypes, presence or absence of a disease can be modeled by assuming that disease risk is determined by an underlying quantitative liability scale.
Cis and Trans Contributions to Heritability
We next use this model to explore the relationship between cis- and trans-QTL effects and heritability. Equation 1 models the relationship between the phenotype value Y and the expression of the core genes. Then, using the laws of probability, the phenotypic variance is given by
| (2) |
where the variances and covariances in gene expression (xi,j) are computed across individuals (subscript i). Here, the first sum adds up the variances of expression of the core genes, and the second sum adds the covariances of expression between all pairs of core genes. Based on this relationship, we can now obtain our key result, by writing the phenotypic variance Var(Yi) in terms of genetic variances and covariances of the expression of core genes (STAR Methods, cis and trans Contributions to Heritability):
| (3) |
Here Vj,cis measures the genetic variance in expression of core gene j that is determined by cis effects, and Vj,trans is the corresponding quantity for trans effects. Cj,k denotes the genetic covariance of expression of genes j and k. (The “nongenefic variance” equals Var(ϵxi,j) + 2γjγkCov(ϵxi,j,ϵxi,k) + Var(ϵYi), where ϵxi,j is the random nongenetic variation in expression of gene j and where ϵYi. is random nongenetic variation in Yi not mediated through core-gene expression.)
Equation 3 illustrates the key factors determining how cis- and trans-eQTL effects on core genes impact complex trait heritability. The first two groups of terms on the right-hand side of this expression depend on the relative importance of cis and trans effects in determining expression heritability of core genes. As discussed in the next section, for typical genes, about 70% of expression heritability is caused by trans effects. The third group of terms depends on genetic covariances between pairs of core genes. Aside from the special case of core genes that are adjacent in the genome, these genetic covariances must arise from trans effects. As there are many more pairs of core genes (nearly M2) than core genes (M), we argue that these terms may dominate the heritability for most traits.
Core-Gene Effects on Heritability
The Heritability of Expression Is Dominated by Many Small Trans Effects
To interpret Equation 3, we need to measure the relative importance of cis versus trans effects in driving the heritability of gene expression. Measuring the importance of trans effects is not straightforward, as most studies are hugely underpowered to detect trans-eQTLs, and thus, estimates of trans heritability must rely on statistical methods that aggregate weak signals. However, the literature is reassuringly consistent across a range of study designs, indicating that around 60%−90% of genetic variance in expression is due to trans-acting variation (Table 1; Figure S1). For clarity, we will refer to the fraction of trans heritability as 70%, while noting uncertainty in the precise value.
Table 1.
Studies of cis versus trans Heritability
| Percent h2 in trans | Tissue/Organism | Platform | Sample Size | Method | Reference |
|---|---|---|---|---|---|
| 88% | LCL from admixed inds | Affymetrix Array | 89 | African-European ancestry | Price et al. (2008) |
| 76%, 61% | Drosophila, whole body | RNA-seq | multi-fly pools | fly hybrids | McManus et al. (2010) |
| 76%, 63% | adipose, blood | custom array | 638, 687 | cis/trans IBD in families | Price et al. (2011) |
| 70%, 65%, 64% | adipose, LCL, skin | Illumina Array | 856 | twin design | Grundberg et al. (2012) |
| 77%, 69% | peripheral blood | Affymetrix Array | 2,752 | twin design, LD Score | Wright et al. (2014); Liu et al. (2017) |
| 72% | yeast segregants | RNA-seq | 1012 | cis versus trans eQTLs | Albert et al. (2018) |
| 62% | mouse liver | RNA-seq | 192 | GCTA | This study; data (Chick et al., 2016) |
| 72% | mouse liver (proteins) | Mass Spec | 192 | GCTA | This study; data (Chick et al., 2016) |
| 78% | human plasma (proteins) | protein aptamers | 3301 | LD Score Regression | This study; data (Sun et al., 2018) |
Despite some variability across species, cell types, and analytic methods, these studies all indicate that most heritability of gene expression is due to trans variation. Data refer to mRNA expression, except the last two rows, which are for protein expression. As a simplifying assumption, these studies assume that QTLs within a pre-specified physical distance of the target gene, such as 1 Mb, act as cis-regulatory variants, and all others act in trans. See the STAR Methods, Table S1, and Figure S1 for further notes on these studies.
Despite the overall importance of trans effects, trans-eQTLs are notoriously difficult to find in humans (Petretto et al., 2006; Westra et al., 2013; Battle et al., 2014, 2017). This is partly due to the extra multiple testing burden on trans-eQTLs but is mainly due to the small effect sizes of trans-eQTLs. To illustrate this, Figure 3 plots the cumulative distributions of cis and trans effects in a sample of 913 individuals in whole blood, showing that trans effects are uniformly small compared to cis effects, with only a handful reaching significance. Given that most trans-eQTLs are far below the detection threshold for current eQTL studies, it is difficult at present to estimate how many trans-eQTLs act on a typical gene. Nonetheless, since ~70% of the heritability of expression is in trans, this implies that typical genes must have very large numbers of weak trans-eQTLs.
If we assume that typical complex traits have, perhaps, hundreds of core genes, each of which is likely affected by many weak trans-eQTLs, this model starts to explain why so much of the genome contributes heritability for typical traits.
Most Trait Heritability Is Likely Mediated through Trans Effects
With these results in hand, we can now return to Equation 3. Recall that this result expresses complex trait heritability as a sum of cis and trans contributions to core-gene expression, as well as genetic covariances of expression of core-gene pairs. At the present time, we have limited knowledge about the magnitude of the covariance terms, and so we consider two main biologically plausible cases, depending on whether the average of γjγkCj,k is around zero or substantially positive (Figure 4). (The third possibility, in which γjγkCj,k is substantially negative, seems less biologically relevant as it requires a preponderance of gene pairs with configurations such as anti-correlated expression but shared directional effects.)
Figure 4. Modeling Predicts that 70% to Nearly 100% of Heritability Is Driven by Weak Trans Effects.

(A) In model 1, we assume that expression of core genes tends to be relatively independent. In this case, we predict that about 30% of heritability is in cis to the core genes. In model 2, we assume that core genes are often co-regulated, with coordinated directions of effects. In this case, for any given individual, the aggregated effects of peripheral variants are partially shared across core genes, while the directions of cis effects at core genes may be up, or down, independently across genes. This effectively transfers most of the heritability out to a large number of peripheral regulators.
(B) Illustration of the fraction of genetic variance due to trans variance and covariance effects (Equation 3). Simplifications for plotting: Vj and |γj| constant across j. The different curves show different values of the “scaled correlation” E[sign(γjγk)•Cj,k]/. See also Figure S2.
Model 1: Core Genes Generally Not Co-regulated. Suppose that core genes tend to be dispersed in gene regulatory networks or that the signs of their effects on disease are not coordinated. In this case, the average value of γjγkCj,k, computed across pairs of core genes, is approximately 0, and we can ignore the last group of terms in Equation 3.
Then the fraction of complex trait heritability that is due to cis variants at core genes simply reflects the average fraction of expression heritability due to cis effects. If we assume that core genes are typical of genes overall, then about 30% of trait heritability would be due to cis-regulatory variants acting on core genes, and 70% to trans effects, mainly from peripheral genes. These estimates assume that the effects γj on the trait are independent of the cis and trans genetic variance in expression (Vj,cis and Vj,trans). However, in the plausible case that the effect sizes and cis-genetic variance are negatively correlated (e.g., due to purifying selection), the heritability explained by variants cis to core genes would be further reduced.
Model 2: Core Genes Generally Co-regulated. In contrast to model 1, suppose instead that a considerable fraction of core genes are either co-regulated with shared directions of effects or negatively co-regulated with opposite directions of effects (i.e., γjγkCj,k > 0). In this case, the sum of covariance terms can dominate the genetic variance for trait Y because there are nearly M-fold as many covariance terms in Equation 3 as variance terms. Since covariances are primarily driven by trans effects, co-regulated networks could potentially act as strong amplifiers for trans-acting variants that are shared among core genes in those networks.
For example, a recent paper by Gandal et al. identified several co-expressed gene modules that are either upregulated or downregulated in various psychiatric conditions, compared to controls (Gandal et al., 2018). We hypothesize that such modules may often contain multiple core genes with covarying directions of effects, as well as genetic co-regulation. If this is the case, then most of the heritability may be driven by (trans-acting) covariance terms.
There has been little work so far on measuring the genetic basis of gene expression correlations. Nonetheless, the work to date shows that expression covariance is substantially driven by genetic factors. For example, Goldinger et al. (2013) studied heritability of principal components (PCs) in a dataset of whole-blood gene expression from 335 individuals. They reported a strong genetic component in the lead PCs, with an average heritability of 0.39 for the first 50 PCs.
Similarly, Lukowski et al. (2017) tested for genetic covariance between gene pairs and identified 15,000 gene pairs (0.5% of all gene pairs) with significantly nonzero genetic covariance at 5% false discovery rate (FDR). Since the significance test is likely underpowered, there are likely many more gene pairs with genetic covariance. For example, for the 10% of gene pairs with the highest phenotypic correlation, the average genetic correlation is 0.12 (STAR Methods; Table S2). This magnitude is potentially large enough to make an important contribution to heritability (Figure 4B). However, their data show roughly equal numbers of positive and negative genetic correlations overall (Figure S2). Since the overall contribution of the covariance terms depends on the average of γjγkCj,k, this means that in order for the covariance terms to contribute to phenotypic variance, either the core gene pairs would have to be enriched for positive covariances or the sign of the covariance for a given pair would have to match the sign of γjγk more often than not. Both scenarios seem plausible but will require further study.
In summary, each core gene is likely affected by large numbers of weak trans-acting (peripheral) variants. Assuming that a typical trait might have hundreds of core genes, this may help to explain why so many loci across the genome contribute to heritability for typical traits. Furthermore, this model suggests that most trait heritability is mediated through trans effects, especially if core genes tend to be positively co-regulated.
SNP Effect Sizes on Disease Risk
In the previous section, we focused on the behavior of the model from the point of view of core genes, which collect QTL effects from cis and trans variants. We now turn our attention to a SNP-centric viewpoint. The effects of a single SNP potentially fan through multiple core genes to affect the phenotype (Figures 2B and 5). The SNP effect sizes that are measured in GWASs correspond to the aggregated effects of each SNP on all core genes, as described next.
Figure 5. Effect Sizes of Cis- and Trans-Regulatory Variants on a Trait.
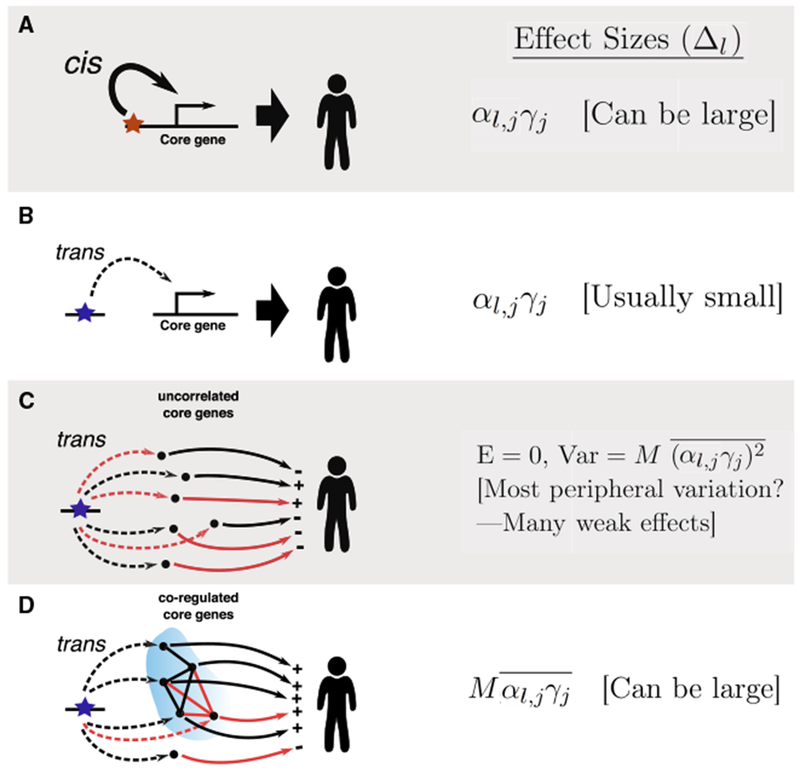
Here, the αs are eQTL effect sizes of SNPs on core genes, and the γs are effect sizes of core genes on the phenotype.
(A and B) For a single core gene, cis-regulatory variants will tend to have larger effect sizes on the trait compared to trans variants, as cis-eQTLs tend to be much stronger than trans-eQTLs.
(C) trans-acting variants that affect many core genes will usually, but not always, have small effect sizes on the trait if the directions of effects on core genes are uncorrelated.
(D) trans-regulators can have large effects on a trait if they act on many core genes in a correlated manner. Black and red arrows indicate positive and negative effects, respectively. “+” and “-“ indicate the sign of αl,jγj for each core gene.
SNP Effect Sizes
Suppose that SNP l is an eQTL for core gene j. As before, αl,j is the effect size of SNP l on the expression of gene j (each additional copy of the alternate allele at l increases expression of j by αl,j units). We denote the expected change in phenotype Ydue to one additional copy of the alternate allele as Δl. Suppose that gene j is the only core gene for which l is an eQTL. Then the effect size of l on phenotype Y is Δl = αl,jγj. Since trans-eQTLs tend to have very small effect sizes, we can expect that Δl will tend to be very small if l is in trans to j, compared to when l is in cis.
Next, what happens if l is a trans-QTL for multiple core genes? Now, the total phenotypic effect of l is a sum of trans effects as mediated through each core gene j:
| (4) |
First, consider a regulatory variant that affects multiple core genes but not in a coordinated way. In other words, the effects of SNP l, as mediated through different core genes may be both trait increasing and trait decreasing. Specifically, if we assume that αl,jγj has an expected value of 0 and is uncorrelated across j, then
| (5) |
Although the effects tend to cancel out on average, the variance of the phenotypic effects scales with M. Although not shown here, any correlations in αl,jγj among core genes would further increase the variance.
In summary, while most SNPs would have effect sizes near zero in this model, some SNPs may have appreciable effect sizes if a preponderance of the αl,jγj happen to share the same direction of effect by chance. We hypothesize that the bulk of complex trait heritability is driven by weak random effects of this type from peripheral genes.
Peripheral Master Regulators. In some cases, the lead hits from GWASs do not tag core genes but master regulators such as KLF14 (diabetes) and IRX3/5 at the FTO locus (obesity) (Small et al., 2018; Claussnitzer et al., 2015). Given that individual trans-eQTLs tend to be very weak, it seems likely that these genes drive coordinated effects on many downstream target core genes, such that the sign of αl,jγj for a given SNP tends to be systematically positive (or negative). In this case, the effect of SNP l is given by M. If αl,jγj tends to have the same sign across different core genes (j), this may potentially add up to a relatively large effect (Figure 5D).
One recent study suggests that this pattern may be a common disease architecture. Reshef et al., (2018) found a number of transcription factor-disease pairs for which SNPs in the transcription factor binding sites showed a persistent directional effect such that the alleles that increase binding tend to increase (or alternatively, to decrease) disease risk. We interpret this as implying that increased binding of the transcription factor tends to drive directional effects on disease risk across many target genes. Thus, a single variant that affects the protein or expression of the transcription factor may have a coordinated effect on many target genes.
Pleiotropy
Lastly, this model suggests a conceptual framework for interpreting variants that affect multiple traits (STAR Methods, Pleiotropy and Genetic Covariance of Traits; Figure 6) (Sivakumaran et al., 2011; Evans and Davey Smith, 2015; Bulik-Sullivan et al., 2015; Pickrell et al., 2016).
Figure 6. Pleiotropy and Genetic Correlation.
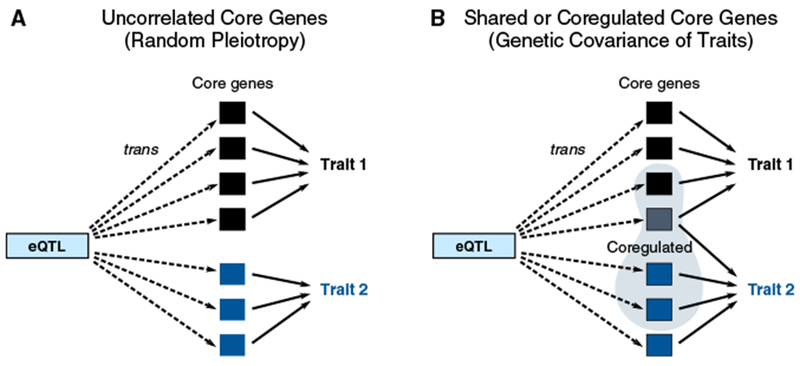
(A) If the core genes for two traits are uncorrelated, then variants that are trans-eQTLs may affect both traits but with uncorrelated directions of effect.
(B) If some of the core genes are shared between traits or expression of the core genes is genetically correlated, then this may lead to genetic covariance of the traits. Genetic covariance of the traits occurs if the directions of trans-regulation and effect sizes tend to line up between the two traits in a coordinated way (i.e., that sums of γj,Aγj,B for shared core genes, and γj,Aγk,BCj,k across pairs of core genes, are either substantially positive or negative overall).
First, suppose that two traits have core genes in different parts of the network (i.e., that there is no genetic covariance in the expression of the core genes). In this case, individual variants may affect both traits in a sporadic fashion: Δl for both traits is nonzero but with the direction of effects uncorrelated (see e.g., Figure 5C). We previously referred to these random effects as “network pleiotropy” (Boyle et al., 2017a), and this is related to the concept of “type 1 pleiotropy” (Wagner and Zhang, 2011).
Second, suppose that two traits either share core genes or that both traits have core genes in the same co-regulated networks. In these cases, the two traits can potentially have correlated SNP effects; i.e., they share genetic covariance (Bulik-Sullivan et al., 2015; Shi et al., 2017). Let γj,A and γk,B measure the effects of expression of genes j and k on traits A and B, respectively, extending the previous γj notation to multiple traits. Then the genetic covariance will be nonzero if the directions of the gene effects tend to line up in a consistent way, as follows (STAR Methods, Pleiotropy and Genetic Covariance of Traits). For shared core genes we simply need the product γj,Aγj,B to tend to be consistently positive or consistently negative. Similarly, co-regulated core genes would need to have consistently shared (or consistently opposite) directions of effects and co-regulation (i.e., that the sum of γjAγkBCj,k across all pairs of core genes is substantially nonzero). These conditions may be met if traits are driven by overlapping genes or gene networks (as seems to be the case for psychiatric diseases [Gandal et al., 2018; Anttila et al., 2018]). More trivially, this is almost guaranteed to occur if one trait contributes causally to another, downstream of genetic effects—for example, lipid levels contribute causally to coronary artery disease (Pickrell et al., 2016).
DISCUSSION
The field of human genetics has made huge strides toward elucidating the genetic basis of a wide range of complex traits. However, there is a paucity of new conceptual models for the links between genetic and phenotypic variation. In particular, how should we understand the observations that (1) an enormous number of variants, spread widely across most of the genome affect any given trait and that (2) together, the biggest GWAS hits generally contribute just a small fraction of the total heritability? Our main goal in this paper is to flesh out details of the omnigenic model that we proposed previously as a candidate framework for understanding complex trait architecture.
Our model partitions genes into core genes (i.e., those with direct effects on the phenotype in question) and peripheral genes (non-core genes that are expressed in disease-relevant tissues). We proposed an equation that relates the expression of the core genes to the expected phenotype value (Equation 1).
Most of the heritability of gene expression (~70%) is controlled in trans (Table 1), and yet individual trans effects are almost uniformly tiny (Figure 3). This implies that the expression of a typical gene is affected by huge numbers of trans-eQTLs. If we hypothesize that there are at least hundreds of core genes for typical disease phenotypes, each with many trans-eQTLs, these observations may start to explain why such a large part of the genome is implicated in any given trait.
This model allows us to predict the fraction of complex trait heritability that is mediated through cis effects at core genes versus through trans effects (Figure 4). If the regulation of core genes tends to be uncorrelated, then the heritability located near core genes simply matches the fraction of heritability that is due to cis-regulatory variants in general–i.e., ~30%. In contrast, if core genes are often coregulated, with shared directions of effects, as seems likely, then nearly all heritability would be due to trans effects.
Figure 5 suggests predictions regarding the effect sizes of regulatory variants. Because cis-eQTLs usually have much larger effect sizes than trans-eQTLs, we can expect that many of the biggest signals in GWASs are cis regulators of core genes. Second, peripheral gene-regulatory variants may become notable hits if they are trans-eQTLs for many core genes with correlated directions of effect. Third, we hypothesize that the bulk of trait heritability is driven by a huge number of peripheral variants that are weak trans-eQTLs for core genes.
Lastly, the model provides a conceptual framework for pleiotropic effects between traits (Figure 6). Even for unrelated traits, it is likely that a large fraction of variants may have small effects on both traits, but with uncorrelated directions of effects. For traits that share core genes, or for which some of the core genes are in the same co-regulated networks, we can expect genetic correlation if the products γj,Aγk,B for shared core genes and γj,Aγk,BCj,k across pairs of core genes are substantially positive, or negative, on average.
Figure 3. Cumulative Distributions of Signal Sizes for the Strongest cis- and trans-eQTLs for Each Expressed Gene in Whole Blood (n = 913).
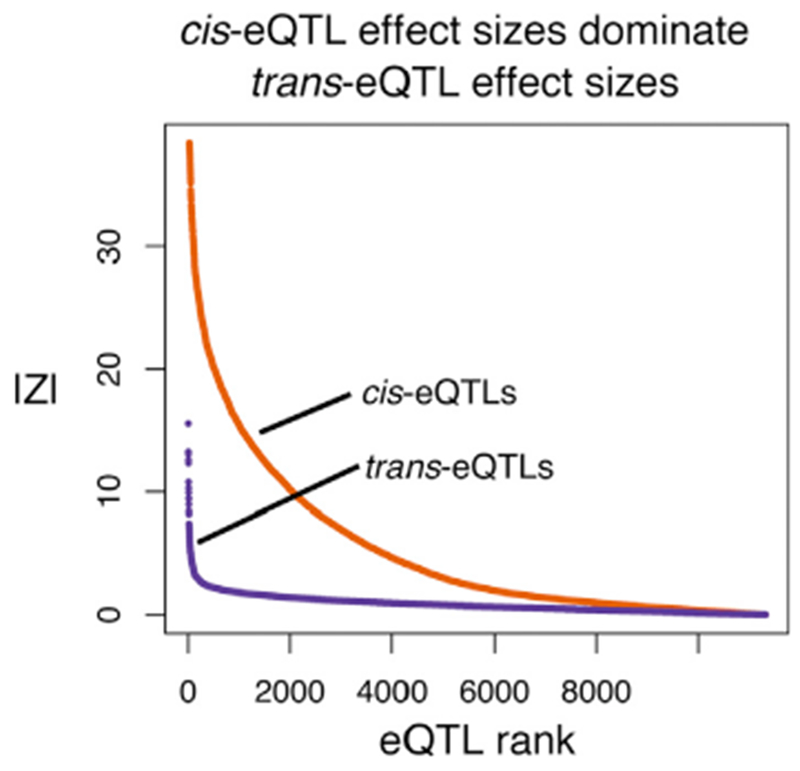
The signals are plotted as |Z| scores; note that Z2 is proportional to the genetic variance contributed by each SNP. To reduce the biasing effects of winner’s curse and the very different numbers of tests in cis and trans, we first identified the most significant cis and most significant trans signal for every gene in one dataset (Wright et al., 2014) and plot here the distribution of Z scores for those SNP-gene pairs in a replication dataset (Battle et al., 2014) (Key Resources Table).
While our model is both an abstraction and a simplification of complex trait architectures, it may be helpful to interpret this model in the light of well-studied traits.
Core Genes in Example Traits
Some of the best-understood examples of core genes come from studies of plasma lipid levels (LDL, HDL, and triglyceride levels), which are important risk factors for heart disease. The genetics of lipid levels include both monogenic syndromes (collectively referred to as dyslipidemias) and a polygenic component that drives most of the population-level variance. At least nine genes are currently implicated in familial hypercholesterolemia, and additional genes cause other forms of dyslipidemia (Dron and Hegele, 2016). The monogenic syndrome genes are closely involved in aspects of lipid metabolism or regulation and should likely be considered core genes for these traits. For example, APOB encodes Apolipoprotein B, the primary protein in low-density lipoprotein (LDL) particles. The LDL-R protein is a receptor for LDL particles, removing them from the bloodstream and transporting them into cells, thus reducing plasma levels of LDL. Presumably additional core genes have not yet been identified as such.
Notably, most of the dyslipidemia genes are also linked to GWAS signals, indicating that common variants at these loci also contribute to lipid levels (Teslovich et al., 2010; Willer et al., 2013; Lu et al., 2017; Liu et al., 2017; Hoffmann et al., 2018). For example, 7 out of 10 genes associated with monogenic disorders of LDL-cholesterol levels are within the set of 57 genome-wide significant hit regions from a GWAS of LDL levels (Dron and Hegele, 2016; Willer et al., 2013).
However, while the genome-wide significant hits are highly enriched with putative core genes for this trait, it is striking that they are responsible for only a modest fraction of the heritability of LDL levels. The 57 genome-wide significant loci explain ~20% of the heritability, while all variation tagged in current GWASs together explains ~80% (Shi et al., 2016). One study estimated that 54% of 1 Mb windows in the genome contribute to the heritability of extreme lipid levels (Loh et al., 2015). Thus, in the case of LDL levels, we have clear evidence for the involvement of core genes, yet they contribute only a small fraction of the genetic variance in the trait. Our model predicts that much of the remaining variance is due to the combined contributions of many small trans effects being funneled through the core genes.
However, in most diseases it is currently much harder to enumerate likely core genes. In part this is because most complex diseases are poorly understood compared to lipid levels. But more fundamentally, many diseases likely have much larger core gene sets, potentially affecting multiple biological mechanisms and potentially in multiple tissue types. For example, schizophrenia is substantially more polygenic than lipid levels (Loh et al., 2015; Shi et al., 2016), and analyses of large-effect rare variants have nominated broad pathways of enrichment but thus far have not identified many genes that are individually significant (Fromer et al., 2014; Purcell et al., 2014). We hypothesize that a disease such as schizophrenia likely has a very large number of core genes and master regulators and that no single core gene has large effects on its own.
Furthermore, some traits of interest are themselves impacted by multiple other complex traits. Recent work on educational attainment provides an extreme example (Lee et al., 2018). The measured phenotype of educational attainment is affected by many different aspects of behavior and health; presumably, each of these has its own core genes (Turkheimer, 2000), and the measured effect sizes for each SNP on educational attainment represent weighted averages across all these simpler traits.
Lastly, it is important to note that our definition of core genes is a simplification of a more complex reality. There are various edge cases that are hard to classify. For example, PCSK9, which is an important drug target for lipid levels, acts by degrading LDL receptor proteins. It is tempting to label this as a core gene, though strictly speaking it acts through protein regulation of the LDLR gene and by our definition should thus be considered peripheral. As another example, many receptor genes are involved in receiving extracellular signals such as hormones or cytokines and then driving internal cellular regulatory networks. We are inclined to regard these as potential core genes as they interact directly with external signals, leading to changes in cellular function; however, they do not fit neatly within our definition.
Peripheral Master Regulators
Because trans-eQTL effect sizes tend to be extremely small, most peripheral genes exert small effects on traits. But there are now several examples of variants that likely affect many core genes in a coordinated way and thus stand out as important GWAS hits (Figure 1C). Such variants may affect trans-regulation in steady-state contexts or may act by altering developmental trajectories.
For example, a variant at the KLF14 locus is associated with dyslipidemia, insulin dependence, and type 2 diabetes (Small et al., 2018). This variant, which is a cis-eQTL for KLF14, is a trans-eQTL for a network of 385 other genes in adipose tissue. Several of the target genes are strong candidates for driving aspects of the organism-level phenotypes, and it is likely that the overall effects of KLF14 are mediated through multiple core genes in this network.
Similarly, a SNP at the FTO locus that is a cis-eQTL for IRX3 and IRX5 is associated with triglyceride levels, obesity, and diabetes (Willer et al., 2013; Smemo et al., 2014; Claussnitzer et al., 2015). These two alleles control the fractions of adipocyte precursors that differentiate into white and beige adipocytes, respectively (Claussnitzer et al., 2015), thereby acting as a developmental switch. In both the KLF14 and FTO examples, the SNPs alter transcriptional programs with downstream consequences on disease risk.
As a third example, circadian rhythms are controlled by a well-understood set of transcriptional regulators and repressors that drive daily cycling of thousands of genes (Takahashi, 2017; Ruben et al., 2018). A recent GWAS for whether people are “morning people” or “evening people” identified 351 loci, with strong enrichment of signal among genes expressed in the brain and pituitary (Jones et al., 2019). Notably, the peaks included nearly all of the key circadian regulators. In our terminology, these are not core genes as they do not exert direct causal effects on chronotype but instead act as coordinated master regulators of many downstream core genes that drive daily physiological cycling.
We anticipate that many of the examples of transcription factors, chromatin modifiers, and other regulatory genes that have emerged as strong hits in disease studies act as peripheral master regulators, driving coordinated regulation of many core genes. Such genes are of particular interest for understanding biological drivers of a trait; however, they are often under particularly strong selective constraint and may thus be missed in GWASs (Chen et al., 2017; O’Connor et al., 2018).
Next Steps in Deciphering Complex Traits
Genetic studies of complex traits can contribute to genetic medicine in two broad areas: (1) prediction of individuals at risk of disease and (2) elucidation of biological mechanisms and identification of potential therapeutic targets.
With recent progress on polygenic risk scores, the GWAS field is now making meaningful strides toward the goal of risk prediction in clinical applications (Khera et al., 2018; Torkamani et al., 2018). Accurate polygenic risk prediction depends on having accurate estimates of tiny effect sizes across millions of SNPs. Polygenic prediction can be done without a deep understanding of biological mechanisms of disease, but it does require enormous sample sizes. Therefore, to achieve the full potential of polygenic prediction, it will be essential to continue building larger GWAS samples for the major diseases. Fortunately, the cost and difficulty of building large GWAS samples continue to drop through both public and private efforts.
A more difficult question will be how to determine the best paths forward for linking GWAS data to biological mechanisms. In our view, the biggest current gap is the very limited knowledge of trans-regulatory networks. If we had high-quality trans-regulatory networks and trans-QTL information, then these could potentially be combined with GWAS effect-size estimates to enable a complete description of core and peripheral genes and the flow of genetic effects through the regulatory network. Existing methods that combine GWAS and eQTL data, such as PrediXcan and TWAS, use cis-eQTLs to identify genes that lie upstream in causal pathways of disease (Gamazon et al., 2015; Gusev et al., 2016). With high-quality network information, it may be possible to extend this concept to perform joint inference on all genes to identify which genes are core genes, which are master regulators, and which are weaker peripheral genes.
The key question then is how to infer regulatory networks. One approach is through trans-eQTL mapping, but this requires extremely large sample sizes. Studies of whole blood are starting to approach the required sample sizes (Võsa et al., 2018), but extremely large samples are far less practical for most other tissues or cell types. Alternatively, we are optimistic that high-throughput experimental perturbation methods may help to fill this gap (Jaitin et al., 2016; Datlinger et al., 2017; Subramanian et al., 2017).
Another open question is the value of deep sequencing to identify rare variants of larger effects. These approaches have so far had mixed success, depending on the disease (Rivas et al., 2011; Purcell et al., 2014; Fuchsberger et al., 2016; Natarajan et al., 2018). In principle, rare variants of larger effect can provide orthogonal information to the common variant signal, should generally be more proximate to the mechanism of action, and may help to identify important genes that are refractory to common variation. On the other hand, most of these studies continue to be underpowered at current sample sizes. As sequencing costs continue to drop, we believe that deep sequencing will be an important tool that provides complementary information, while recognizing that it is no panacea. Ultimately a full mechanistic dissection of complex traits will require a combination of all these kinds of approaches, along with detailed functional biology of key targets.
In summary, this paper aims to provide a simple, but formal, model for the links between genetic variation, expression of core genes, and disease risk. We have argued previously that most of the heritability for typical complex traits is mediated through genes that have only distant connections to disease biology. Here, we have expanded on this theme, proposing that this is a consequence of known features of cis- and trans-eQTL architecture.
STAR★METHODS
CONTACT FOR REAGENT AND RESOURCE SHARING
Further information and requests for resources, including computer code used in this study, should be directed to and will be fulfilled by the lead contact, Jonathan K. Pritchard (pritch@stanford.edu).
METHOD DETAILS
Theoretical models
Summary of notation
| Yi; ; Var(Yi) | Phenotype of individual i; mean phenotype; phenotypic variance |
| M ; N | Number of core genes; total number of genes |
| γj | Mean effect of a unit change in expression of gene j on Yi |
| xi,j; | Expression of gene j in individual i; mean expression of gene j |
| ϵYi | Random variation in Yi not mediated through core gene expression |
| Var(ϵYi) | Variance of random phenotypic effects (ϵYi) |
| Var(ϵxi,j); Cov(xi,j, xi,k) | Phenotypic variance of gene j; Phenotypic covariance of genes j and k |
| ϵxij | Random (nongenetic) variation in expression of gene j in individual i |
| I…L | Index over causal sites (loci) |
| Vj; Vj,cis; Vj,trans | Genetic variance for gene j; cis and trans genetic variances of j |
| Cj,k | Genetic covariance of genes j and k |
| Δl | Effect size of variant l on expression of gene j |
Incorporating Genetic Variation into the Model
Suppose that there are Lj distinct eQTLs for core gene j, of which Lj,cis are in cis, and Lj - Lj,cis are in trans. Let αl,j denote the effect size of eQTL l on expression of gene j (each additional copy of the alternate allele at l increases expression of j by αl,j units).Then, assuming a linear model of eQTL effects with no interaction terms, the expression level of gene j in individual i depends on that individual’s genotype as follows:
| (6) |
where gi,l 2 {0, 1, 2} is the genotype of individual i at SNP l, and pl is the population allele frequency at SNP l (i.e., 2pl is the average genotype). The random error term ϵj reflects nongenetic variation, and has mean 0. Plugging Equation 6 into Equation 1 and assuming no interaction effects, we can write the expected phenotype
Y for individual i in terms of their genotype:
| (7) |
In this latter expression, SNPs or other variants near to core genes affect their expression as cis-eQTLs, and SNPs elsewhere in the genome act as trans-eQTLs on core genes. The form of Equation 7 is reminiscent of a polygenic risk score, except that in a polygenic score, the terms are re-organized into a sum over SNPs. In the following sections we will argue that most heritability is due to trans effects from the second group of terms.
Cis and Trans Contributions to Heritability
Equation 1 models the relationship between the phenotype value Y and the expression of the core genes. Then, we can write the phenotypic variance as in Equation 2. To evaluate this, we need to write the variances and covariances of expression in terms of genetic contributions. As before, we assume fully additive models without GxG or GxE interaction terms, and in this case, linkage equilibrium between eQTLs:
| (8) |
| (9) |
The equations above define the cis and trans components of expression variance of gene j (Vj,cis and Vj, trans, respectively), and the genetic covariance C(j, k) of genes j and k. Lj and Lk denote the sets of eQTLs for genes j and k respectively. Var(ϵj) and Cov(ϵj, ϵk) are the environmental and random variances and covariances of core genes, and gene pairs, respectively. Plugging the genetic variance and covariance expressions into Equation 2 we obtain Equation 3.
Pleiotropy and Genetic Covariance of Traits
Consider two traits A and B, where Yi,A and Yi,B denote the phenotypes of individual i, and where MA and MB denote the sets of core genes for each trait, respectively. From Equation 1, the phenotypic covariance of these traits is
| (10) |
The genetic component of the covariance then depends on a sum of terms due to core genes shared between the traits, and a sum of terms based on genetic covariance of all pairs of core genes. Specifically, the genetic covariance of traits A and B is
| (11) |
Here the first sum indexes over shared core genes, and will contribute positive trait covariance if the core genes tend to have the same directions of effects on both traits. The other sum indexes over pairs of core genes, and will contribute positive trait covariance if core gene pairs with positive expression covariance tend to have same-direction effects on both traits (and negatively correlated core genes tend to have opposite-direction effects). Reversal of these conditions would produce negative trait covariances.
Estimation of trans Heritability
In Table S1, we present additional considerations regarding the fraction of trans heritability estimated by different studies reported in Table 1.
cis and trans Heritability of Mouse RNA and Proteins
To estimate the proportion of mRNA and protein expression level heritability due to cis and trans variants, we downloaded liver mRNA and protein expression level quantifications, and genetic information for each of the 192 Collaborative Cross mice (see Key Resource Table). Because the genetic information for each mouse was in the form of estimated founder dosage (from eight founder strains) and not genetic dosage, we used the predicted founder dosage and the founder genotypes to convert founder dosage into genotype dosage for each of the 192 mice. In addition, because the founder dosage was reported at a restricted number of measured markers, we converted the founder dosage to genotype dosage only when SNPs were at most 10kb away from the measured marker. This is rather conservative as the haplotype blocks in these mice were generally much larger than 10kb (often tens of MBs).
KEY RESOURCES TABLE
| REAGENT or RESOURCE | SOURCE | IDENTIFIER |
|---|---|---|
| Software and Algorithms | ||
| GCTA | Yang et al., 2011 | https://cnsgenomics.com/software/gcta/ |
| LD Score Regression | Finucane et al., 2015 | https://github.com/bulik/ldsc |
| Deposited Data | ||
| RNA-seq and genotype data (Depression Genes and Networks cohort) | Battle et al., 2014 | https://www.nimhgenetics.org/request-access/how-to-request-access |
| Expression Array and genotype data (Netherlands Twin Register) | Wright et al., 2014 | https://www.nimhgenetics.org/download-tool/NTR |
| RNA-seq and genotype data (Collaborative Cross) | Chick et al., 2016 | ftp://ftp.jax.org/scm/ChickMungeretal2016_DiversityOutbred.Rdata |
| protein QTLs summary statistics | Sun et al., 2018 | http://www.phpc.cam.ac.uk/ceu/proteins/ |
To compute heritability of gene expression and protein expression levels, we used GCTA (Yang et al., 2011) with standard parameters on 20,650 genes and 7,826 proteins, respectively, whose expression levels were measured in the 192 mice. We used 5 phenotype and 5 genetic PCs as covariates for all genes. To estimate the proportion of heritability explained by variants cis to a gene, we ran GCTA using the genetic relationship matrix (GRM) created using all SNPs on the same chromosome as the gene. In contrast, we estimated the proportion of heritability explained by variants in trans by running GCTA using the GRM computed using all SNPs from the 21 other chromosomes. We note that our definition of genetic variants contributing to gene expression variation in cis is extremely permissive, however, it is reasonable in our case as we are primarily interested in a lower bound for the heritability explained by variants that function in trans.
In summary, we estimated that 62% of mRNA heritability and 72% of protein heritability are determined in trans. The larger trans component for proteins is robust across the full spectrum of total heritability values (Figure S1).
cis and trans Heritability of Human Plasma Proteins
Genome-wide summary association statistics of protein QTLs (pQTLs) for 3,622 plasma proteins from Sun et al. (Sun et al., 2018) were downloaded (see Key Resources Table). We applied LD Score Regression (LDSC) (Finucane et al., 2015) to the summary statistics to estimate cis and trans SNP heritability. We defined regions within 1Mb to the transcription starting sites (TSS) of each gene as cis regions, and all regions larger than 5Mb away from TSS of the gene and the rest of the 21 chromosomes as trans regions. LDSC analyses were run on the cis and trans regions of each protein. LDSC baseline annotations V2.0 were used, and we fixed the LDSC regression intercept to 1 in order to reduce noise (Liu et al., 2017). Cis-heritability of 1,588 proteins and trans heritability of 2,483 proteins are in the 0–1 range. We computed the ratio of cis and trans heritability as the ratio of the average cis and trans heritability obtained from these proteins.
eQTL Effects in the Netherlands Twin Register Dataset and Replication in the Depression Genes and Networks Dataset
We wanted to compare the distribution of effect sizes between cis- and trans-eQTLs. This kind of analysis is challenging because most studies are underpowered to detect trans-eQTLs, and because significant signals-especially those in trans-suffer from winner’s curse (i.e., the effect that significant SNPs passing a significance threshold may have over-estimated effect sizes). To correct for winner’s curse and obtain eQTL effect sizes that are less biased, we analyzed two gene expression datasets in this paper (see Key Resource Table). Our strategy was to first select significant cis and trans eQTL associations in the Netherlands Twin Register (NTR) dataset (Wright et al., 2014), and then replicate the association signals in the Depression Genes and Networks (DGN) dataset (Battle et al., 2014).
The NTR dataset consists of two study cohorts: the Netherlands Twin Registry cohort and the Netherlands Study of Depression and Anxiety (NESDA) cohort. Genotype and expression quality control and genotype imputation were done in (Wright et al., 2014). Summary statistics were first computed at probe level (each gene corresponds to one or more probes). Since the NTR cohort is comprised of monozygotic and dizygotic twins, t-statistics were computed for each equal split twin set, and combined z-statistics were calculated using empirical correlations among monozygotic and dizygotic twins. Meta-analyzed z-statistics of each probe for NTR and NESDA cohorts were computed using inverse-variance weighting by sample size. We further combined probe-level summary statistics into gene level summary statistics of 17,118 genes, by averaging the z-statistics across probes belonging to the same gene. For each gene, we determined the most significant eQTL variant in cis, and in trans, and then took these forward for replication testing in the DGN dataset.
For the DGN dataset, we performed genotype and sample QC and quantified expression levels. More specifically, genotype QC includes removal of SNPs with MAF<0.05, Hardy-Weinberg equilibrium smaller than 1 × 10⁻⁶, or missing rate exceeding 1%. We then generated a genetic relationship matrix (GRM) and removed one of each pair of samples with relatedness greater than 0.05. Our final QCed dataset of contains 913 individuals and 6,231,867 SNPs. To reduce false positive trans-associations due to biases in sequence reads mapping, we only kept uniquely mapped reads and further discarded reads mapped genomic regions of low mappability (mappability <1). The mappability of every 36-mer of the reference human genome (hg19) were computed by the ENCODE project. We quantified expression levels of 13,634 genes using FeatureCount (Liao et al., 2014), which had measurable expression in at least half of the samples. Gene expression levels were estimated as Reads per kilo base per million mapped reads (RPKM). For each significant SNP-gene association identified in NTR, we tested its association while using the top 20 surrogate variables as covariates in a linear model.
Genetic Correlation of Gene Expression Levels
Genetic covariance and correlation estimates were computed by Lukowski et al. (2017) using expression array data from whole blood for 1,748 unrelated individuals of European ancestry. We downloaded their estimates from http://computationalgenomics.com.au/shiny/rg/. They reported genetic covariance and genetic correlation () between each pairwise combination of 2469 highly heritable (h2g>0.25) transcripts. Genetic correlations were estimated using the bivariate GREML model, implemented in the GCTA software (Yang et al., 2011). See also the Supplementary Information of Lukowski et al. for extensive analyses of these data.
It is well known that gene expression data often show strong correlation structure among individuals, and the Lukowski data confirm that gene expression levels are heavily controlled by genetic variation. Using the data that they processed, we computed that the Pearson correlation between and was 0.16 (p ≪ 2.2 × 10⁻¹⁶). At the tails of the distribution, which indicates co-expression of transcripts, the average are particularly large (Table S2), suggesting shared genetic control for co-expressed transcripts. We observed that the distributions of pairwise phenotypic correlations () and genetic correlations () were approximately symmetric around zero, albeit with slightly more weight in the positive tail of the distribution (Figure S2, Table S2). Together, these results show that the magnitudes of the genetic correlations of gene expression are often large, supporting the idea that the genetic covariance of core gene expression levels may make an important contribution to disease heritability (depending on the signs of the effects sizes and correlations).
Supplementary Material
Highlights.
We propose a quantitative phenotype model based on core and peripheral genes
Model is parameterized using data on cis and trans heritability of gene expression
Analysis implies that heritability explained by trans-acting variants is at least 70%
Co-regulation of core genes can further amplify the contribution of trans effects
ACKNOWLEDGMENTS
We thank many people for helpful conversations or comments including Evan Boyle, Diego Calderon, Jake Freimer, Ziyue Gao, Arbel Harpak, Mark McCarthy, Hanna Ollila, Luke O’Connor, Molly Przeworski, Andrey Rzhetsky, Guy Sella, Eilon Sharon, Gavin Sherlock, Yuval Simons, Nasa Sinnott-Armstrong, and four anonymous reviewers. This work was supported by NIH grants HG008140 and HG009431.
Footnotes
SUPPLEMENTAL INFORMATION
Supplemental Information can be found online at https://doi.org/10.1016/j.cell.2019.04.014.
DECLARATION OF INTERESTS
The authors have no conflict of interest to declare.
REFERENCES
- Albert FW, Bloom JS, Siegel J, Day L, and Kruglyak L (2018). Genetics of trans-regulatory variation in gene expression. eLife 7, e35471. [DOI] [PMC free article] [PubMed] [Google Scholar]
- Anttila V, Bulik-Sullivan B, Finucane HK, Walters RK, Bras J, Duncan L, Escott-Price V, Falcone GJ, Gormley P, Malik R, et al. ; Brainstorm Consortium (2018). Analysis of shared heritability in common disorders of the brain. Science 360, eaap8757. [DOI] [PMC free article] [PubMed] [Google Scholar]
- Ardlie KG, Deluca DS, Segrè AV, Sullivan TJ, Young TR, Gelfand ET, Trowbridge CA, Maller JB, Tukiainen T, Lek M, et al. ; GTEx Consortium (2015). Human genomics. The Genotype-Tissue Expression (GTEx) pilot analysis: multitissue gene regulation in humans. Science 348, 648–660. [DOI] [PMC free article] [PubMed] [Google Scholar]
- Barton NH, Etheridge AM, and Vèber A (2017). The infinitesimal model: Definition, derivation, and implications. Theor. Popul. Biol. 118, 50–73. [DOI] [PubMed] [Google Scholar]
- Bassik MC, Kampmann M, Lebbink RJ, Wang S, Hein MY, Poser I, Weibezahn J, Horlbeck MA, Chen S, Mann M, et al. (2013).A systematic mammalian genetic interaction map reveals pathways underlying ricin susceptibility. Cell 152, 909–922. [DOI] [PMC free article] [PubMed] [Google Scholar]
- Battle A, Mostafavi S, Zhu X, Potash JB, Weissman MM, McCormick C, Haudenschild CD, Beckman KB, Shi J, Mei R, et al. (2014). Characterizing the genetic basis of transcriptome diversity through RNA-sequencing of 922 individuals. Genome Res. 24, 14–24. [DOI] [PMC free article] [PubMed] [Google Scholar]
- Battle A, Khan Z, Wang SH, Mitrano A, Ford MJ, Pritchard JK, and Gilad Y (2015). Genomic variation. Impact of regulatory variation from RNA to protein. Science 347, 664–667. [DOI] [PMC free article] [PubMed] [Google Scholar]
- Battle A, Brown CD, Engelhardt BE, Montgomery SB, Getz G, Hadley K, Handsaker R, Huang K, Kashin S, Karczewski K, et al. ; GTEx Consortium; Laboratory, Data Analysis &Coordinating Center (LDACC)–Analysis Working Group; Statistical Methods groups–Analysis Working Group; Enhancing GTEx (eGTEx) groups; NIH Common Fund; NIH/NCI; NIH/NHGRI; NIH/NIMH; NIH/NIDA; Biospecimen Collection Source Site–NDRI; Biospecimen Collection Source Site–RPCI; Biospecimen Core Resource–VARI; Brain Bank Repository–University of Miami Brain Endowment Bank; Leidos Biomedical–Project Management; ELSI Study; Genome Browser Data Integration &Visualization–EBI; Genome Browser Data Integration &Visualization–UCSC Genomics Institute, University of California Santa Cruz; Lead analysts; Laboratory, Data Analysis &Coordinating Center (LDACC); NIH program management; Biospecimen collection; Pathology; eQTL manuscript working group (2017). Genetic effects on gene expression across human tissues. Nature 550, 204–213.29022597 [Google Scholar]
- Boyle EA, Li YI, and Pritchard JK (2017a). An Expanded View of Complex Traits: From Polygenic to Omnigenic. Cell 160, 1177–1186. [DOI] [PMC free article] [PubMed] [Google Scholar]
- Boyle E, Li Y, and Pritchard J (2017b). The Omnigenic Model: Response from the Authors. J Psychiatr Brain Sci. 2, S8. [Google Scholar]
- Bulik-Sullivan B, Finucane HK, Anttila V, Gusev A, Day FR, Loh P-R, Duncan L, Perry JR, Patterson N, Robinson EB, et al. ; ReproGen Consortium; Psychiatric Genomics Consortium; Genetic Consortium for Anorexia Nervosa of the WellcomeTrust Case Control Consortium 3 (2015). An atlas of genetic correlations across human diseases and traits. Nat. Genet. 47, 1236–1241. [DOI] [PMC free article] [PubMed] [Google Scholar]
- Chen H, Wu C-I, and He X (2017). The genotype-phenotype relationships in the light of natural selection. Mol. Biol. Evol. 35, 525–542. [DOI] [PMC free article] [PubMed] [Google Scholar]
- Chick JM, Munger SC, Simecek P, Huttlin EL, Choi K, Gatti DM, Raghupathy N, Svenson KL, Churchill GA, and Gygi SP (2016). Defining the consequences of genetic variation on a proteome-wide scale. Nature 534, 500–505. [DOI] [PMC free article] [PubMed] [Google Scholar]
- Chun S, Casparino A, Patsopoulos NA, Croteau-Chonka DC, Raby BA, De Jager PL, Sunyaev SR, and Cotsapas C (2017). Limited statistical evidence for shared genetic effects of eQTLs and autoimmune-disease-associated loci in three major immune-cell types. Nat. Genet. 49, 600–605. [DOI] [PMC free article] [PubMed] [Google Scholar]
- Claussnitzer M, Dankel SN, Kim KH, Quon G, Meuleman W, Haugen C , Glunk V, Sousa IS, Beaudry JL, Puviindran V, et al. (2015). FTO Obesity Variant Circuitry and Adipocyte Browning in Humans. N. Engl. J. Med. 373, 895–907. [DOI] [PMC free article] [PubMed] [Google Scholar]
- Clément K, Vaisse C, Lahlou N, Cabrol S, Pelloux V, Cassuto D, Gourmelen M, Dina C, Chambaz J, Lacorte J-M, et al. (1998).Amutation in the human leptin receptor gene causes obesity and pituitary dysfunction. Nature 392, 398–401. [DOI] [PubMed] [Google Scholar]
- Datlinger P, Rendeiro AF, Schmidl C, Krausgruber T, Traxler P, Klughammer J, Schuster LC, Kuchler A, Alpar D, and Bock C (2017). Pooled CRISPR screening with single-cell transcriptome readout. Nat. Methods 14, 297–301. [DOI] [PMC free article] [PubMed] [Google Scholar]
- Dron JS, and Hegele RA (2016). Genetics of lipid and lipoprotein disorders and traits. Curr. Genet. Med. Rep. 4, 130–141. [DOI] [PMC free article] [PubMed] [Google Scholar]
- Emilsson V, Ilkov M, Lamb JR, Finkel N, Gudmundsson EF, Pitts R, Hoover H, Gudmundsdottir V, Horman SR, Aspelund T, et al. (2018). Co-regulatory networks of human serum proteins link genetics to disease. Science 361, 769–773. [DOI] [PMC free article] [PubMed] [Google Scholar]
- Evans DM, and Davey Smith G (2015). Mendelian randomization: new applications in the coming age of hypothesis-free causality. Annu. Rev. Genomics Hum. Genet. 16, 327–350. [DOI] [PubMed] [Google Scholar]
- Fernandez-Tajes J, Gaulton KJ, van de Bunt M, Torres J, Mahajan A, Gloyn AL, Lage K, and McCarthy MI (2018). Developing a network view of type 2 diabetes risk pathways through integration of genetic, genomic and functional data. bioRxiv. 10.1101/350181. [DOI] [PMC free article] [PubMed] [Google Scholar]
- Finucane HK, Bulik-Sullivan B, Gusev A,Trynka G, Reshef Y, Loh P-R, Anttila V, Xu H, Zang C, Farh K, et al. ; ReproGen Consortium; Schizophrenia Working Group of the Psychiatric Genomics Consortium; RACI Consortium (2015). Partitioning heritability by functional annotation using genome-wide association summary statistics. Nat. Genet. 47, 1228–1235. [DOI] [PMC free article] [PubMed] [Google Scholar]
- Fisher RA (1918). The correlation between relatives on the supposition of Mendelian inheritance. Transactions of the Royal Society of Edinburgh 52, 399–433. [Google Scholar]
- Fromer M, Pocklington AJ, Kavanagh DH, Williams HJ, Dwyer S, Gormley P, Georgieva L, Rees E, Palta P, Ruderfer DM, et al. (2014). De novo mutations in schizophrenia implicate synaptic networks. Nature 506, 179–184. [DOI] [PMC free article] [PubMed] [Google Scholar]
- Fuchsberger C, Flannick J, Teslovich TM, Mahajan A, Agarwala V, Gaulton KJ, Ma C, Fontanillas P, Moutsianas L, McCarthy DJ, et al. (2016). The genetic architecture of type 2 diabetes. Nature 536, 41–47. [DOI] [PMC free article] [PubMed] [Google Scholar]
- Gamazon ER, Wheeler HE, Shah KP, Mozaffari SV, Aquino-Michaels K, Carroll RJ, Eyler AE, Denny JC, Nicolae DL, Cox NJ, and Im HK; GTEx Consortium (2015).Agene-based association method for mapping traits using reference transcriptome data. Nat. Genet. 47, 1091–1098. [DOI] [PMC free article] [PubMed] [Google Scholar]
- Gandal MJ, Haney JR, Parikshak NN, Leppa V, Ramaswami G, Hartl C, Schork AJ, Appadurai V, Buil A, Werge TM, et al. ; CommonMind Consortium; PsychENCODE Consortium; iPSYCH-BROAD Working Group (2018). Shared molecular neuropathology across major psychiatric disorders parallels polygenic overlap. Science 359, 693–697.29439242 [Google Scholar]
- Glassberg EC, Gao Z, Harpak A, Lan X, and Pritchard JK (2019). Evidence for Weak Selective Constraint on Human Gene Expression. Genetics 211, 757–772. [DOI] [PMC free article] [PubMed] [Google Scholar]
- Goldinger A, Henders AK, McRae AF, Martin NG, Gibson G, Montgomery GW, Visscher PM, and Powell JE (2013). Genetic and non-genetic variation revealed for the principal components of human gene expression. Genetics 195, 1117–1128. [DOI] [PMC free article] [PubMed] [Google Scholar]
- Grundberg E, Small KS, Hedman ÅK, Nica AC, Buil A, Keildson S, Bell JT, Yang T-P, Meduri E, Barrett A, et al. ; Multiple Tissue Human Expression Resource (MuTHER) Consortium (2012). Mapping cis- and trans-regulatory effects across multiple tissues in twins. Nat. Genet. 44,1084–1089. [DOI] [PMC free article] [PubMed] [Google Scholar]
- Gusev A, Ko A, Shi H, Bhatia G, Chung W, Penninx BW, Jansen R, de Geus EJ, Boomsma DI, Wright FA, et al. (2016). Integrative approaches for large-scale transcriptome-wide association studies. Nat. Genet. 48, 245–252. [DOI] [PMC free article] [PubMed] [Google Scholar]
- Hoffmann TJ, Theusch E, Haldar T, Ranatunga DK, Jorgenson E, Medina MW, Kvale MN, Kwok P-Y, Schaefer C, Krauss RM, et al. (2018). A large electronic-health-record-based genome-wide study of serum lipids. Nat. Genet. 50, 401–413. [DOI] [PMC free article] [PubMed] [Google Scholar]
- Jaitin DA, Weiner A, Yofe I, Lara-Astiaso D, Keren-Shaul H, David E, Salame TM, Tanay A, van Oudenaarden A, and Amit I (2016). Dissecting immune circuits by linking CRISPR-pooled screens with single-cell RNA-seq. Cell 167, 1883–1896. e15. [DOI] [PubMed] [Google Scholar]
- Jones SE, Lane JM, Wood AR, van Hees VT, Tyrrell J, Beaumont RN, Jeffries AR, Dashti HS, Hillsdon M, Ruth KS, et al. (2019). Genome-wide association analyses of chronotype in 697,828 individuals provides insights into circadian rhythms. Nat. Commun. 10, 343. [DOI] [PMC free article] [PubMed] [Google Scholar]
- Jostins L, Ripke S, Weersma RK, Duerr RH, McGovern DP, Hui KY, Lee JC, Schumm LP, Sharma Y, Anderson CA, et al. ; International IBD Genetics Consortium (IIBDGC) (2012). Host-microbe interactions have shaped the genetic architecture of inflammatory bowel disease. Nature 491,119–124. [DOI] [PMC free article] [PubMed] [Google Scholar]
- Khera AV, Chaffin M, Aragam KG, Haas ME, Roselli C, Choi SH, Natarajan P, Lander ES, Lubitz SA, Ellinor PT, and Kathiresan S (2018). Genome-wide polygenic scores for common diseases identify individuals with risk equivalent to monogenic mutations. Nat. Genet. 50, 1219–1224. [DOI] [PMC free article] [PubMed] [Google Scholar]
- Kramer NJ, Haney MS, Morgens DW, Jovičić A, Couthouis J, Li A, Ousey J, Ma R, Bieri G, Tsui CK, et al. (2018). CRISPR-Cas9 screens in human cells and primary neurons identify modifiers of C9ORF72 dipeptide-repeat-protein toxicity. Nat. Genet. 50, 603–612. [DOI] [PMC free article] [PubMed] [Google Scholar]
- Lee JJ, Wedow R, Okbay A, Kong E, Maghzian O, Zacher M, Nguyen-Viet TA, Bowers P, Sidorenko J, Karlsson Linnér R, et al. ; 23andMe Research Team; COGENT (Cognitive Genomics Consortium); Social Science Genetic Association Consortium (2018). Gene discovery and polygenic prediction from a genome-wide association study of educational attainment in 1.1 million individuals. Nat. Genet. 50, 1112–1121. [DOI] [PMC free article] [PubMed] [Google Scholar]
- Liao Y, Smyth GK, and Shi W (2014). featureCounts: an efficient general purpose program for assigning sequence reads to genomic features. Bioinformatics 30, 923–930. [DOI] [PubMed] [Google Scholar]
- Liu X, Finucane HK, Gusev A, Bhatia G, Gazal S, O’Connor L, Bulik-Sullivan B, Wright FA, Sullivan PF, Neale BM, and Price AL (2017). Functional architectures of local and distal regulation of gene expression in multiple human tissues. Am. J. Hum. Genet. 100, 605–616. [DOI] [PMC free article] [PubMed] [Google Scholar]
- Loh P-R, Bhatia G, Gusev A, Finucane HK, Bulik-Sullivan BK, Pollack SJ, deCandia TR, Lee SH, Wray NR, Kendler KS, et al. ; Schizophrenia Working Group of Psychiatric Genomics Consortium (2015). Contrasting genetic architectures of schizophrenia and other complex diseases using fast variance-components analysis. Nat. Genet. 47, 1385–1392. [DOI] [PMC free article] [PubMed] [Google Scholar]
- Lu X, Peloso GM, Liu DJ, Wu Y, Zhang H, Zhou W, Li J, Tang CS, Dorajoo R, Li H, et al. ; GLGC Consortium (2017). Exome chip meta-analysis identifies novel loci and East Asian-specific coding variants that contribute to lipid levels and coronary artery disease. Nat. Genet. 49, 1722–1730. [DOI] [PMC free article] [PubMed] [Google Scholar]
- Lukowski SW, Lloyd-Jones LR, Holloway A, Kirsten H, Hemani G, Yang J, Small K, Zhao J, Metspalu A, Dermitzakis ET, et al. (2017). Genetic correlations reveal the shared genetic architecture of transcription in human peripheral blood. Nat. Commun. 8, 483. [DOI] [PMC free article] [PubMed] [Google Scholar]
- Manolio TA, Collins FS, Cox NJ, Goldstein DB, Hindorff LA, Hunter DJ, McCarthy MI, Ramos EM, Cardon LR, Chakravarti A, et al. (2009). Finding the missing heritability of complex diseases. Nature 461, 747–753. [DOI] [PMC free article] [PubMed] [Google Scholar]
- McManus CJ, Coolon JD, Duff MO, Eipper-Mains J, Graveley BR, and Wittkopp PJ (2010). Regulatory divergence in Drosophila revealed by mRNA-seq. Genome Res. 20, 816–825. [DOI] [PMC free article] [PubMed] [Google Scholar]
- Natarajan P, Peloso GM, Zekavat SM, Montasser M, Ganna A, Chaffin M, Khera AV, Zhou W, Bloom JM, Engreitz JM, et al. ; NHLBI TOPMed Lipids Working Group (2018). Deep-coverage whole genome sequences and blood lipids among 16,324 individuals. Nat. Commun. 9, 3391. [DOI] [PMC free article] [PubMed] [Google Scholar]
- O’Connor LJ, Schoech AP, Hormozdiari F, Gazal S, Patterson N, and Price AL (2018). Polygenicity of complex traits is explained by negative selection. bioRxiv. 10.1101/420497. [DOI] [PMC free article] [PubMed] [Google Scholar]
- Parnas O, Jovanovic M, Eisenhaure TM, Herbst RH, Dixit A, Ye CJ, Przybylski D, Platt RJ, Tirosh I, Sanjana NE, et al. (2015). A genomewide CRISPR screen in primary immune cells to dissect regulatory networks. Cell 162, 675–686. [DOI] [PMC free article] [PubMed] [Google Scholar]
- Petretto E, Mangion J, Dickens NJ, Cook SA, Kumaran MK, Lu H, Fischer J, Maatz H, Kren V, Pravenec M, et al. (2006). Heritability and tissue specificity of expression quantitative trait loci. PLoS Genet. 2, e172. [DOI] [PMC free article] [PubMed] [Google Scholar]
- Pickrell JK (2014). Joint analysis of functional genomic data and genomewide association studies of 18 human traits. Am. J. Hum. Genet. 94, 559–573. [DOI] [PMC free article] [PubMed] [Google Scholar]
- Pickrell JK, Berisa T, Liu JZ, Segurel L, Tung JY, and Hinds DA (2016). Detection and interpretation of shared genetic influences on 42 human traits. Nat. Genet. 48, 709–717. [DOI] [PMC free article] [PubMed] [Google Scholar]
- Price AL, Patterson N, Hancks DC, Myers S, Reich D, Cheung VG, and Spielman RS (2008). Effects of cis and trans genetic ancestry on gene expression in African Americans. PLoS Genet. 4, e1000294. [DOI] [PMC free article] [PubMed] [Google Scholar]
- Price AL, Helgason A, Thorleifsson G, McCarroll SA, Kong A, and Stefansson K (2011). Single-tissue and cross-tissue heritability of gene expression via identity-by-descent in related or unrelated individuals. PLoS Genet. 7, e1001317. [DOI] [PMC free article] [PubMed] [Google Scholar]
- Purcell SM, Wray NR, Stone JL, Visscher PM, O’Donovan MC, Sullivan PF, Sklar P, Ruderfer DM, McQuillin A, Morris DW, et al. ; International Schizophrenia Consortium (2009). Common polygenic variation contributes to risk of schizophrenia and bipolar disorder. Nature 460, 748–752. [DOI] [PMC free article] [PubMed] [Google Scholar]
- Purcell SM, Moran JL, Fromer M, Ruderfer D, Solovieff N, Roussos P, O’Dushlaine C, Chambert K, Bergen SE, Kähler A, et al. (2014). A polygenic burden of rare disruptive mutations in schizophrenia. Nature 506, 185–190. [DOI] [PMC free article] [PubMed] [Google Scholar]
- Reshef YA, Finucane HK, Kelley DR, Gusev A, Kotliar D, Ulirsch JC, Hormozdiari F, Nasser J, O’Connor L,van deGeijn B, et al. (2018). Detecting genome-wide directional effects of transcription factor binding on polygenic disease risk. Nat. Genet. 50, 1483–1493. [DOI] [PMC free article] [PubMed] [Google Scholar]
- Rivas MA, Beaudoin M, Gardet A, Stevens C, Sharma Y, Zhang CK, Boucher G, Ripke S, Ellinghaus D, Burtt N, et al. ; National Institute of Diabetes and Digestive Kidney Diseases Inflammatory Bowel Disease Genetics Consortium (NIDDK IBDGC); United Kingdom Inflammatory Bowel Disease Genetics Consortium; International Inflammatory Bowel Disease Genetics Consortium (2011). Deep resequencing of GWAS loci identifies independent rare variants associated with inflammatory bowel disease. Nat. Genet. 43, 1066–1073. [DOI] [PMC free article] [PubMed] [Google Scholar]
- Ruben MD, Wu G, Smith DF, Schmidt RE, Francey LJ, Anafi RC, and Hogenesch JB (2018). A population-based human enCYCLOPedia for circadian medicine. bioRxiv 10.1101/301580. [DOI] [Google Scholar]
- Sekar A, Bialas AR, de Rivera H, Davis A, Hammond TR, Kamitaki N, Tooley K, Presumey J, Baum M, Van Doren V, et al. ; Schizophrenia Working Group of the Psychiatric Genomics Consortium (2016). Schizophrenia risk from complex variation of complement component 4. Nature 530, 177–183. [DOI] [PMC free article] [PubMed] [Google Scholar]
- Shi H, Kichaev G, and Pasaniuc B (2016). Contrasting the genetic architecture of 30 complex traits from summary association data. Am. J. Hum. Genet. 99, 139–153. [DOI] [PMC free article] [PubMed] [Google Scholar]
- Shi H, Mancuso N, Spendlove S, and Pasaniuc B (2017). Local genetic correlation gives insights into the shared genetic architecture of complex traits. Am. J. Hum. Genet. 101, 737–751. [DOI] [PMC free article] [PubMed] [Google Scholar]
- Simons YB, Bullaughey K, Hudson RR, and Sella G (2018). A population genetic interpretation of GWAS findings for human quantitative traits. PLoS Biol. 16, e2002985. [DOI] [PMC free article] [PubMed] [Google Scholar]
- Sivakumaran S, Agakov F, Theodoratou E, Prendergast JG, Zgaga L, Manolio T, Rudan I, McKeigue P, Wilson JF, and Campbell H (2011). Abundant pleiotropy in human complex diseases and traits. Am. J. Hum. Genet. 89, 607–618. [DOI] [PMC free article] [PubMed] [Google Scholar]
- Small KS, Todorčević M, Civelek M, El-Sayed Moustafa JS, Wang X, Simon MM, Fernandez-Tajes J, Mahajan A, Horikoshi M, Hugill A, et al. (2018). Regulatory variants at KLF14 influence type 2 diabetes risk via a female-specific effect on adipocyte size and body composition. Nat. Genet. 50, 572–580. [DOI] [PMC free article] [PubMed] [Google Scholar]
- Smemo S, Tena JJ, Kim K-H, Gamazon ER, Sakabe NJ, Gómez-Marín C, Aneas I, Credidio FL, Sobreira DR, Wasserman NF, et al. (2014). Obesity-associated variants within FTO form long-range functional connections with IRX3. Nature 507, 371–375. [DOI] [PMC free article] [PubMed] [Google Scholar]
- Subramanian A, Narayan R, Corsello SM, Peck DD, Natoli TE, Lu X, Gould J, Davis JF, Tubelli AA, Asiedu JK, et al. (2017). A next generation connectivity map: L1000 platform and the first 1,000,000 profiles. Cell 171, 1437–1452. e17. [DOI] [PMC free article] [PubMed] [Google Scholar]
- Sun BB, Maranville JC, Peters JE, Stacey D, Staley JR, Blackshaw J, Burgess S, Jiang T, Paige E, Surendran P, et al. (2018). Genomic atlas of the human plasma proteome. Nature 558, 73–79. [DOI] [PMC free article] [PubMed] [Google Scholar]
- Takahashi JS (2017). Transcriptional architecture of the mammalian circadian clock. Nat. Rev. Genet. 18, 164–179. [DOI] [PMC free article] [PubMed] [Google Scholar]
- Teslovich TM, Musunuru K, Smith AV, Edmondson AC, Stylianou IM, Koseki M, Pirruccello JP, Ripatti S, Chasman DI, Willer CJ, et al. (2010). Biological, clinical and population relevance of 95 loci for blood lipids. Nature 466, 707–713. [DOI] [PMC free article] [PubMed] [Google Scholar]
- Torkamani A, Wineinger NE, and Topol EJ (2018). The personal and clinical utility of polygenic risk scores. Nat. Rev. Genet. 19, 581–590. [DOI] [PubMed] [Google Scholar]
- Trynka G, Sandor C, Han B, Xu H, Stranger BE, Liu XS, and Raychaudhuri S (2013). Chromatin marks identify critical cell types for fine mapping complex trait variants. Nat. Genet. 45, 124–130. [DOI] [PMC free article] [PubMed] [Google Scholar]
- Turkheimer E (2000). Three laws of behavior genetics and what they mean. Curr. Dir. Psychol. Sci. 9, 160–164. [Google Scholar]
- Võsa U, Claringbould A, Westra H-J, Bonder MJ, Deelen P, Zeng B, Kirsten H, Saha A, Kreuzhuber R, Kasela S, et al. (2018). Unraveling the polygenic architecture of complex traits using blood eQTL meta-analysis. bioRxiv 10.1101/447367. [DOI] [Google Scholar]
- Wagner GP, and Zhang J (2011). The pleiotropic structure of the genotype-phenotype map: the evolvability of complex organisms. Nat. Rev. Genet. 12, 204–213. [DOI] [PubMed] [Google Scholar]
- Wellcome Trust Case Control Consortium (2007). Genome-wide association study of 14,000 cases of seven common diseases and 3,000 shared controls. Nature 447, 661–678. [DOI] [PMC free article] [PubMed] [Google Scholar]
- Westra H-J, Peters MJ, Esko T, Yaghootkar H, Schurmann C, Kettunen J, Christiansen MW, Fairfax BP, Schramm K, Powell JE, et al. (2013). Systematic identification of trans eQTLs as putative drivers of known disease associations. Nat. Genet. 45, 1238–1243. [DOI] [PMC free article] [PubMed] [Google Scholar]
- Willer CJ, Schmidt EM, Sengupta S, Peloso GM, Gustafsson S, Kanoni S, Ganna A, Chen J, Buchkovich ML, Mora S, et al. ; Global Lipids Genetics Consortium (2013). Discovery and refinement of loci associated with lipid levels. Nat. Genet. 45, 1274–1283. [DOI] [PMC free article] [PubMed] [Google Scholar]
- Wood AR, Esko T, Yang J, Vedantam S, Pers TH, Gustafsson S, Chu AY, Estrada K, Luan J, Kutalik Z, et al. ; Electronic Medical Records and Genomics (eMEMERGEGE) Consortium; MIGen Consortium; PAGEGE Consortium; LifeLines Cohort Study (2014). Defining the role of common variation in the genomic and biological architecture of adult human height. Nat. Genet. 46, 1173–1186. [DOI] [PMC free article] [PubMed] [Google Scholar]
- Wright FA, Sullivan PF, Brooks AI, Zou F, Sun W, Xia K, Madar V, Jansen R, Chung W, Zhou Y-H, et al. (2014). Heritability and genomics of gene expression in peripheral blood. Nat. Genet. 46, 430–437. [DOI] [PMC free article] [PubMed] [Google Scholar]
- Yang J, Benyamin B, McEvoy BP, Gordon S, Henders AK, Nyholt DR, Madden PA, Heath AC, Martin NG, Montgomery GW, et al. (2010). Common SNPs explain a large proportion of the heritability for human height. Nat. Genet. 42, 565–569. [DOI] [PMC free article] [PubMed] [Google Scholar]
- Yang J, Lee SH, Goddard ME, and Visscher PM (2011). GCTA: a tool for genome-wide complex trait analysis. Am. J. Hum. Genet. 88, 76–82. [DOI] [PMC free article] [PubMed] [Google Scholar]
- Zhu X, and Stephens M (2018). Large-scale genome-wide enrichment analyses identify new trait-associated genes and pathways across 31 human phenotypes. Nat. Commun. 9, 4361. [DOI] [PMC free article] [PubMed] [Google Scholar]
Associated Data
This section collects any data citations, data availability statements, or supplementary materials included in this article.