

Abstract
The increase of diabetic retinopathy patients and diabetic mellitus worldwide yields lot of challenges to ophthalmologists in the screening of diabetic retinopathy. Different signs of diabetic retinopathy were identified in retinal images taken through fundus photography. Among these stages, the early stage of diabetic retinopathy termed as microaneurysms plays a vital role in diabetic retinopathy patients. To assist the ophthalmologists, and to avoid vision loss among diabetic retinopathy patients, a computer-aided diagnosis is essential that can be used as a second opinion while screening diabetic retinopathy. On this vision, a new methodology is proposed to detect the microaneurysms and non-microaneurysms through the stages of image pre-processing, candidate extraction, feature extraction, and classification. The feature extractor, generalized rotational invariant local binary pattern, contributes in extracting the texture-based features of microaneurysms. As a result, our proposed system achieved a free-response receiver operating characteristic score of 0.421 with Retinopathy Online Challenge database.
Keywords: Fundus image, Local binary pattern, Diabetic retinopathy, Microaneurysms, Optic disc
Introduction
Epidemiological survey says diabetic retinopathy (DR) is one among the four major causes of vision impairment [1]. Among the patients having type 1 diabetes, 60% of patients can expect type 2 diabetes after 20 years. Hence, a regular screening is needed to prevent vision loss; if detected in the later stage, the vision loss cannot be recovered. The main stages of DR are (i) non-proliferative diabetic retinopathy (NPDR) and (ii) proliferative diabetic retinopathy (PDR) shown in Fig. 1. Mild NPDR is the early stage symptom of swelling in tiny blood vessels called microaneurysms (MAs) [2]. If blood vessels become weak, leakage forming a small dot is called hemorrhages (H). The next stage is the hard exudates (HE) which appear like yellow patch when leakage of blood vessel contains fats or proteins. In case, small and thin blood vessels of retina shut off forming woolly-like white patches called cotton wool spots [3]. In PDR stage, blood circulation problem occur and oxygen supply is deprived that leads to damage of blood vessels and retinal detachment [4]. Thus, the early signs of DR show the existence of MAs in the retina of eyes. MAs are small circular red deep spots with diameter 10 to 100 μM [5]. Initially, MAs are acquired with one or two red spots around the macular region of the retina, spotted in left-centred optic disc fundus images.
Fig. 1.
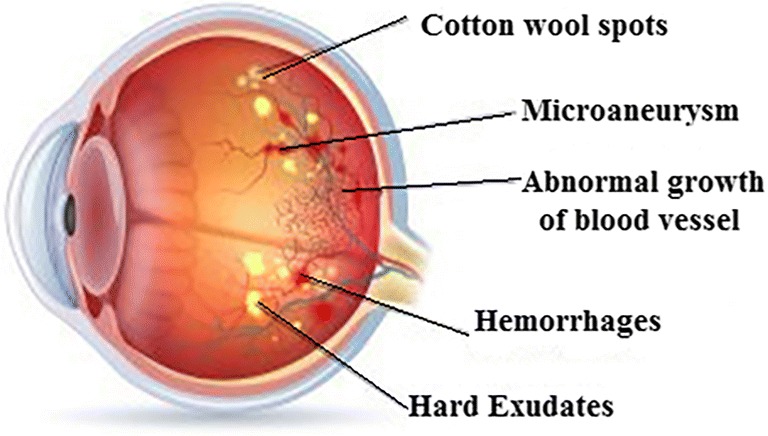
Fundus image showing various stages of DR
In hospitals, if ophthalmologist diagnoses MAs manually, it leads to error and is more time-consuming [6]. Hence, an automated diagnosis system is needed to analyze MAs in DR patients. At this point, to help the ophthalmologist, different sorts of validation methods are introduced which acts as a secondary opinion in the diagnosis of MAs. Therefore, a new strategy has been developed which includes pre-processing of fundus image, candidate extraction, and extraction of texture descriptors using local binary pattern (LBP) and generalized rotational invariant LBP (GRILBP). Finally, the LBP histograms are fed to a support vector machine (SVM) classifier which detects the MA lesions. The rest of the paper is structured as follows: Section II describes various works associated with MAs. In Section III, proposed MAs detection system is presented in detail. Section IV reports the results and discussion. Finally, Section V gives the conclusion and future suggestions on the proposed work.
Review on Related Work
Diabetic retinopathy detection is a well-known research area in which researchers focus and contribute their ideas that put forward in the improvement of various assessment techniques. Accordingly, researchers presented various detection methods [7–11] reveal low sensitivity, high cost, and human ability in the detection of MAs. In [12], detection of MAs is done after removal of blood vessels followed by circular Hough transform (CHT) and the outputs are validated by ophthalmologist experts. Still, there exists a possibility of misclassification of blood vessels as MAs. In [13], detection of MA lesion is performed based on its size and field of view (FOV) of fundus camera. Here, classification by Early Treatment Diabetic Retinopathy Study [ETDRS] method produces an accuracy of 88%. Allan D Fleming et al. [14] proposed a framework for classification of MAs in fundus images. Initially, contrast normalization is used to recognize the MAs from other existing lesions; the K-Nearest Neighbour (KNN) classifier detects the red spots which record a sensitivity of 85.4% and specificity of 83.1%. Bob Zhang et al. [15] presented an approach to detect all red lesions from color fundus photograph called multi-scale correlation filtering (MSCF). This method follows two levels such as Gaussian distribution of red spots as the first level and detection of features like shape, pixel intensity, and color as the second level. While tested with ROC dataset, the FROC score of 0.201 is achieved. Moreover, Yuji et al. [16] suggested a technique in which retinal image is pre-processed using double ring filter, also 28 features are selected using principal component analysis (PCA). An artificial neural network (ANN) is trained with the extracted features to classify MAs and a sensitivity of 68% is obtained for ROC dataset. In [17], the automated system for MA detection involves three steps: (1) pre-processing of image by singular value decomposition (SVD), (2) feature description using speeded-up robust feature (SURF) and radon transform space feature (RTSF), and (3) MAs classification using the KNN, Naïve Bayes classifier and SVM. An overall competitive performance measure (CPM) of 0.364 is achieved for ROC dataset.
M. Tamilarasi et al. [18] presented a methodology for automated detection of MAs. Here, bottom-hat filtering and gamma correction method are applied on the green channel image. Histogram-based features are extracted from the filtered image and multilayer perceptron feed forward classifier is used to classify MAs. The results are evaluated with two public datasets diaretdB0 and diaretdB1, thus the sensitivity, specificity, and accuracy for diaretdB0 are 98.32%, 97.59%, and 97.86%, whereas with diatretdB1 the performance validations are 98.91%, 97.65%, and 98.33% respectively. Furthermore, in [19], detection of MAs is processed with a new system where the input retinal image is pre-processed with illumination correction; normalization and bottom-hat transform which differentiate red lesions in fundus images. In the selected region of interest (ROI), blood vessels are eliminated by hit or miss transformation and true MA lesions are detected by applying PCA. The ROC dataset is tested and reported with 88.06% sensitivity, 97.47% specificity and 92% accuracy. In addition, Juan Shan et al. [20] enumerated a new method called stacked sparse autoencoder (SSCE) to detect MAs. The high-level features are extracted from the image patches that are generated by 25 × 25 square windows for 89 images. By this method, 2182 image patches for MA lesions and 6220 image patches for non-MAs are generated. These image patches are used to train the classifier, which increases the complexity of the system. When it is subjected to soft-max classifier, the value of area under curve (AUC) is 91.3% and 96.2% for an F-measure classifier is produced. In addition, Su Wang et al. [21] proposed a method in classification of MAs that can be processed in three stages. Pre-processing is the first stage, done by Gaussian filtering and adaptive histogram applied to green channel of fundus image. In the second stage, MA candidate is extracted using Gaussian correlation coefficient method. Finally, MAs are classified using KNN classifier and the evaluated performance with ROC dataset shows 96.3% sensitivity and 88.4% specificity. In the abovementioned literature, the performance analysis is done using sensitivity, specificity, and accuracy. However, if the analysis is done based on false positive per image (FPPI), the detection of MA lesions will be more effective. Similarly, if energy-based features are considered, there may be a chance for misclassification due to the inaccuracy in feature extraction. Likewise, in SSCE method, the patches generated before feature extraction is quite complex, also it varies depending on the size and resolution of the input image. Therefore, to reduce the complexity and to attain a better accuracy in classification of MAs, the researchers presented a texture-based GRILBP feature extraction method.
Proposed Methodology
The proposed flow of work is depicted in Fig. 2. Initially, spatial calibration is performed to adapt for various image resolutions. Secondly, the input fundus image is pre-processed to improve the performance of feature extraction. Thirdly, the optic disc is removed to avoid misclassification of MAs. Fourthly, the candidate of MA lesions is extracted using morphological operations. Fifthly, LBP and GRILBP are implied to extract MA features required for classification. Finally, the extracted MAs and non-MAs histograms are presented in a SVM classifier to detect MA lesions. These steps are detailed in below sections:
Fig. 2.

Flow diagram of the proposed method in detection of MAs
Spatial Calibration
Spatial calibration is needed for any digital fundus image [22] to adapt different resolutions during image zoom or blur. Here, instead of resizing the image, diameter (D) of the entire image is considered as the size invariant parameter. Mostly, DR screening is done with a FOV of 45°, and D is chosen as a function to design various filters. In this method, we use three parameters ‘k1’ as the average radius of optic disc, ‘k2’ as the size of MAs and ‘K3’as size of exudates. These values are obtained by:
Image Pre-processing
Usually, fundus database are of non-uniform color, luminosity, and quality. The pre-processing steps play a vital role in prior to feature extraction process, that makes the input image a noise-free and invariant to color and brightness.
Luminosity Correction (Ilc)
Since the brightness of the image is non-uniform, a luminosity correction method is required [23] which is given by:
| 1 |
Here, the large mean filter ‘fm1’ with diameter k1 is applied to each color channel of the input image ‘I’. After averaging the color component, the estimated color image I*fm1 is subtracted from the original image. Also, the average intensity ‘Iav’ is added to the input image.
Noise Removal (Idn)
To reduce noise distortions, a small mean filter ‘fm2’ with diameter k2 is implied on each color channel of luminosity corrected image Ilc. Thereby, the de-noised image ‘Idn’ is obtained directly from luminosity corrected image.
| 2 |
Contrast Enhancement (Ice)
Following the noise removal, the contrast of the image is enhanced by calculating local standard deviation ‘Is’ of each color channel. Therefore, the low contrast regions of an input image are sharpened using the mean filter ‘fm3’.
| 3 |
Color Equalization
A standardized color image is obtained by applying color equalization over a contrast-enhanced image Ice. The window technique is applied to remove the unwanted boundaries of each channel component of ‘Ice’. It is processed by applying an image histogram stretching and clippings with the range of μ ± 3σ. The resulting pre-processed images are shown in Fig. 3
Fig. 3.

Steps in pre-processing (FOV at 45° images are shown in the first row, and ROI portion is given in the second row) a original image, b luminosity correction, c contrast enhancement, d color equalization
Optic Disc Removal
To avoid false MA detection, it is essential to remove the optic disc portion from the pre-processed image [14]. Since the optic disc region is of high intensity, morphological closing operations are required to enhance the high-intensity regions in the pre-processed image. Later, a canny edge detector is applied to detect the edges of high intensity circular region. Finally, the circle with a maximum diameter of high intensity is segmented using CHT is shown in Fig. 4.
Fig. 4.

Optic disc removal a detection of OD, b segmentation of OD
Candidate Extraction
The morphological operation such as erosion and dilation is implied on the smoothened image. In dilation process, a disc structure of 5 × 5 structuring element is applied on each pixel by window technique. The pixel in nerve and lesion region gets enlarged on dilated image. Furthermore, erosion is needed to normalize the background pixels and highlight the enlarged pixels. This can be obtained by applying a 5 × 5 disc structuring element on the dilated image. Now, the eroded image is subtracted from the segmented image, thus a detailed or marker image (GM) is obtained. The ‘GM’ image highlights the lesions, nerves, and some high-intensity pixels like noise pixels. As smoothening is performed in the previous stage, a few high intensity pixels appear like minimum intensity pixels. To overcome this, a morphological flooding and morphological reconstruction are implemented as a combined process. The marker image is reconstructed by applying flooding process to separate nerves and lesions as separate candidates. MAs may occur as small spots attached to the wall of the nerves, and there is a chance of misclassification of MAs as nerves during candidate extraction. Hence, the morphological flooding process is started in which water flooding fills the entire nerve thereby the nerves and MAs attached to the nerves are discriminated. In addition, to the extraction of nerves, it is necessary to estimate the noise pixels. This can be obtained by evaluating the standard deviation (SD) of the marker image GM. By using window technique on GM with 3 × 3 window size, the SD of the pixels is evaluated. The pixels with minimum SD are estimated as noise pixels σnoise. The process of candidate extraction is shown in Fig. 5.
Fig. 5.

Process in candidate extraction. a Contrast enhancement. b Threshold image
Feature Extraction
Local Binary Pattern
Before introducing the new texture-based feature extraction method the basic LBP method is also considered in our work. Accordingly, a binary code of length 8 is generated by considering a 3 × 3 neighbourhood with centre pixel and other pixels as reference. Also, histograms of 256 bins are computed based on the occurrences of each binary code which provides a texture pattern of the image. Since LBP produce a long histogram of 256 bins, it will reduce the speed of classification algorithm. In addition, it is sensitive to random noise and non-monotonic illumination variation [23].
Generalized Rotational Invariant LBP
Here, we propose a texture-based method of extracting the features using GRILBP. It is a combined method of generalized LBP (GLBP) and rotation invariant LBP (RILBP) [24]. According to this method, we derive an operator based on circular symmetric neighbourhood with a set of ‘P’ pixels of radius ‘R’. GLBPP, R operator produces a 2P output value that corresponds to different 2P binary patterns formed by ‘P’ pixels.
| 4 |
where, ge is the grey value of centre pixel. The generated patterns in the neighbourhood of each pixel are recorded in P dimension histogram. The pattern with highest difference indicates the dark MA spots. The obtained GLBPP, R, for an example, circular symmetric set with P = 8 and R = 1, is shown in Fig. 6.
Fig. 6.

Circular symmetric set for different P, R
Similarly, RILBPP, R operator is obtained by rotating the neighbourhood pixel set in clockwise direction for many times from most significant bit (MSB) position gp–1. Here, we perform RILBP8, 1 and RILBP16, 2 for different individual rotations to generate different binary patterns.
| 5 |
ROT refers to circular bitwise right shift on the ‘P’ pixels for i-times. The circular structure that contains very few spatial transitions are considered as uniform patterns which function as features for dark MA lesions. Normally, there exist 256 bins of co-occurrence pixels in the histogram distribution. But in our case, there exist only 0 to16 bins for GLBP8, 1and RILBP8, 1, whereas 0 to 4 bins for RILBP16, 2. The intensity of lesions remains same if 0/1 transition in the pattern is low. Moreover, the size of MA lesion is small, therefore a uniform pattern exists in 36 (16 + 16 + 4) bins. Each bin in the histogram provides a probability estimation of uniform patterns in the MA texture. Figure 7 shows an example of histogram distributions of MAs and non-MAs pattern in a feature vector of 36 bins. This histogram distribution of each bin varies for different retinal images. The estimated histogram of training dataset is provided for MA classification.
Fig. 7.

Histogram distribution pattern of a MAs b Non-MAs
Classification: Support Vector Machine
For MA detection, the 36-dimensional feature vector obtained from GRILBP is fed to radial basis function (RBF) kernel SVM [25]. It maps the input vector ‘X’ into high-dimensional feature space ‘D’ which is given in the form:
| 6 |
where, ‘w’ is the weight factor, and ‘b’ is the bias function. These parameters are evaluated on training the database. By using kernel function k (xi, yi), the training data will be linearly separable in high dimensional space. The vector of training sample (xi, yi) which follows a condition:
| 7 |
Now, the SVM function can be written as:
| 8 |
Where, ‘Rk’ is the support vector. Here, we are using RBF kernel SVM for MA classification that can be expressed as:
| 9 |
where, ‘d’ is the distance between input space ‘X’ and high dimensional feature vector ‘D’. The regularization parameter ‘P’ which controls the spline of RBP hyper plane is given as:
| 10 |
where, ‘ei’ is the classification error. In our work, we have selected GRILBP pattern of 3 × 3 neighborhood applied on each ROI to generate 36-dimension feature vector for MAs and blood vessel region. Finally, RBF hyper plane will classify MAs and non-MAs as 1, 0 respectively. Figure 8 shows the detected MA lesion marked as green circle.
Fig. 8.

a Ground truth image. b MA detected image (detected lesions are marked in green circles)
Experimental Results and Discussion
The testing of our proposed system is performed using Retinopathy Online Challenge (ROC) public database [26]. This data set is authorized by the University of IOWA which consists of 50 training and 50 testing images. Normally, ROC dataset is acquired in three different resolutions such as 768 × 576, 1058 × 1061, and 1389 × 1383 with a field of view (FOV) ranges from 45 to 50°. In ROC dataset, out of 50 test images, only 37 images contain MAs, while remaining 13 images are healthy retina.
To assess our proposed system, two levels of analysis such as per-lesion and per-image are carried out. Under per-lesion analysis, we performed free-response receiver operating characteristic (FROC) evaluation. Thereby, FROC score is evaluated by averaging the sensitivities at the specified points corresponds to 1/8, 1/4, 1/2, 1, 2, 4, 8, and false positives per image. Even though ROC datasets are of varying quality, contrast and noise, texture-based MA detection system achieves a better FROC score of 0.421. Figure 9 shows the FROC curves of LBP and GRILBP methods. Moreover, per-image evaluation is carried out if the retinal image has at least one MA lesion. Receiver operating characteristics (ROC) is plotted with true positive rate (TPR) versus false positive rate (FPR) by varying the threshold ‘T’. In addition, we measure the area under curve (AUC) value for ROC dataset shows 0.906 for basic LBP and 0.923 for GRILBP. Figure 10 shows the ROC curve for MA classification by applying GRILBP and LBP features.
Fig. 9.

FROC curves using LBP and GRILBP methods
Fig. 10.

ROC curve of MA detection
Table 1 shows the comparison of FROC score for LBP and GRILBP feature extraction methods. When comparing with various shape-based feature extraction methods texture-based descriptors produced better results in MA detection [21, 22, 27, 28]. The terms such as true positive (TP), true negative (TN), false positive (FP), and false negative (FN) are calculated using the standard equations and the performance metrics such sensitivity and specificity are estimated. Above all, our system provides a better performance with a sensitivity of 96.13% and specificity of 81.16%. While using LBP, we have to map 256 dimension feature vectors, but in GRILBP the feature vector dimensions are reduced from 256 to 36. The features of MAs and non-MAs will exist within 36 bins. Since, we are using only a reduced number of texture features; the overall computation time is only 29 s which is much lesser than other published results. The simulations are carried out in MATLAB 2013 platform using Intel i3 processor with 4GB RAM.
Table 1.
Comparison of FROC score
| Methods | 1/8 | 1/4 | 1/2 | 1 | 2 | 4 | 8 | F-score |
|---|---|---|---|---|---|---|---|---|
| LBP | 0.294 | 0.365 | 0.393 | 0.428 | 0.447 | 0.465 | 0.481 | 0.410 |
| GRILBP | 0.304 | 0.375 | 0.403 | 0.438 | 0.457 | 0.475 | 0.491 | 0.421 |
Conclusions and Future Scope
To our best of knowledge, texture-based features are used only in few literatures until now. GRILBP-based feature extraction method increases the sensitivity of MA detection more than shape-and color-based features. The obtained results indicate better efficiency in discrimination of MAs and non-MAs than the conventional LBP method. The proposed system has achieved an improved performance on per lesion and per image analysis. For public dataset such as ROC, the current method has achieved a FROC score of 0.421 with GRILBP features whereas, LBP scored 0.410. Since, spatial calibration and pre-processing steps are incorporated; this system shows robustness for different resolution images. This methodology can be integrated with real-time images too. Currently, we are collecting a new real-time database of retinal images from Agarwal’s Eye Hospital, Tirunelveli, South India. In the future scope, this methodology is to be executed for real-time images that will be more helpful for clinicians in the diagnosis of MAs.
Footnotes
Publisher’s Note
Springer Nature remains neutral with regard to jurisdictional claims in published maps and institutional affiliations.
Contributor Information
D. Jeba Derwin, Email: d.jebaderwin@gmail.com.
S. Tami Selvi, Email: stsece@nec.edu.in.
O. Jeba Singh, Email: o.jebasingh@rediffmail.com.
References
- 1.Ministry of Health Malaysia Diabetic Retinopathy Screening Team . Diabetes mellitus and complications-Module. Putrajaya: Ministry of Health Malaysia; 2012. [Google Scholar]
- 2.Klein R, Klein BEK, Moss SE. Visual Impairment in Diabetes. Ophthalmology. 1984;91:1–9. doi: 10.1016/S0161-6420(84)34337-8. [DOI] [PubMed] [Google Scholar]
- 3.Amos AF, McCarty DJ, Zimmet P. The rising global burden of diabetes and its complications: Estimates and Projections to the year 2010. Diabet Med. 1997;14:S1–S85. doi: 10.1002/(SICI)1096-9136(199712)14:5+<S7::AID-DIA522>3.3.CO;2-I. [DOI] [PubMed] [Google Scholar]
- 4.Kohner EM, Aldington SJ, Stratton IM, Manley SE, Holman RR, Matthews DR. United Kingdom prospective diabetes study, “Diabetic Retinopathy at Diagnosis of Noninsulin-Dependent Diabetes Mellitus And associated risk factors”. Arch Ophthalmol. 1998;116:297–303. doi: 10.1001/archopht.116.3.297. [DOI] [PubMed] [Google Scholar]
- 5.Pereira C, Veiga D, Mahdjoub J, Guessoum Z, Goncalves L, Ferriera M, Monterio J. Using a Multi-Agent system approach for Microaneurysms detection in fundus images. Artif Intell Med. 2014;60:170–188. doi: 10.1016/j.artmed.2013.12.005. [DOI] [PubMed] [Google Scholar]
- 6.Wu B, Zhu W, Shuria Zhu F, Chen X. Automatic detection of Microaneurysms in retinal fundus images. Comput Med Imaging Graph. 2016;55:106–112. doi: 10.1016/j.compmedimag.2016.08.001. [DOI] [PubMed] [Google Scholar]
- 7.Spencer T, Olson JA, McHardy KC, Sharp PF, Forrester JV. Animate-processing strategy for the segmentation and quantification of microaneurysms in fluoresce in angiograms of the ocular fundus. Comput Biomed Rev. 1996;2:284–302. doi: 10.1006/cbmr.1996.0021. [DOI] [PubMed] [Google Scholar]
- 8.Niemeijer M, Van Ginneken B, Staal J, Suttorp-Schulten MSA, Abramoff MD. Automatic detection of red lesions in digital color fundus photographs. IEEE Trans Med Imaging. 2005;24:584–592. doi: 10.1109/TMI.2005.843738. [DOI] [PubMed] [Google Scholar]
- 9.Sopharak A, Uyyanonvara B, Barman SA. Simple hybrid method for fine microaneurysm detection from non-dilated diabetic retinopathy retinal images. Comput Med Imaging Graph. 2013;37:394–402. doi: 10.1016/j.compmedimag.2013.05.005. [DOI] [PubMed] [Google Scholar]
- 10.Tang L, Niemeijer M, Reinhardt JM, Garvin MK, Abramoff MD. Splat feature classification with application to retinal hemorrhage detection in fundus images. IEEE Trans Med Imaging. 2013;32:364–375. doi: 10.1109/TMI.2012.2227119. [DOI] [PubMed] [Google Scholar]
- 11.Zhang B, Wu X, You J, Li Q, Karray F. Detection of microaneurysms using multi-scale correlation coefficients. Pattern Recogn. 2010;43:2237–2248. doi: 10.1016/j.patcog.2009.12.017. [DOI] [Google Scholar]
- 12.Abelazeem S, Hafez M, Auda G: Using Circular Hough Transform for Detecting Microaneurysms in Fluorescein Angiograms of the Ocular Fundus. Int Conf Ind Electron Cairo, 2001
- 13.Lee SC, Lee ET, Wang Y, Klein R. Computer classification of NPDR. Arch Ophthalmol. 2005;123:759–764. doi: 10.1001/archopht.123.6.759. [DOI] [PubMed] [Google Scholar]
- 14.Fleming AD, Philip S, Goatman KA, Olson JA, Sharp PF. Automated Microaneurysm Detection using Local Contrast Normalization And Local Vessel Detection. IEEE Trans Med Imaging. 2006;25:1223–1232. doi: 10.1109/TMI.2006.879953. [DOI] [PubMed] [Google Scholar]
- 15.Zhang B, Wu X, You J, Li Q, Karray F: Hierarchical detection of red lesions in retinal images by multi scale correlation filtering. Proc SPIE Int Soc Opt Eng, 2009
- 16.Hatanaka Y, Inoue T, Okumura S, Muramatsu C, Fujita H: Automated Microaneurysms detection method based on double ring filter and feature analysis in retinal fundus image. 25th IEEE International Symposium on Computer-Based Medical Systems (CBMS), 2012
- 17.Kedir M, Adal D, Sidibe S, Ali E, Chaum TP, Karnowski FM. Automated detection of Microaneurysms using scale-adapted blob analysis and semi-supervised learning. Comput Methods Prog Biomed. 2015;114:1–10. doi: 10.1016/j.cmpb.2013.12.009. [DOI] [PubMed] [Google Scholar]
- 18.Tamilarasi M, Duraiswamy K. Automatic detection of Microaneurysms using microstructure and wavelet methods. SADHANA Acad Proc Eng Sci. 2015;40:1185–1203. [Google Scholar]
- 19.Rosas-Romero R, Martinez-Carballido J, Hernandez-Capistran J, Uribe-Valencia LJ. Method to assist in the diagnosis of early Diabetic Retinopathy :Image processing applied to detection of Microaneurysms in fundus images. Comput Med Imaging Graph. 2015;20:41–53. doi: 10.1016/j.compmedimag.2015.07.001. [DOI] [PubMed] [Google Scholar]
- 20.Shan J, Li L: A deep learning method for Microaneurysm detection in fundus images. IEEE first conference on connected health: applications, systems and Engineering technologies, 2016
- 21.Wang S, Tang HL, Al Turk LI, Sanei S. Localizing MA in fundus Image through Singular Spectrum Analysis. IEEE Trans Biomed Eng. 2017;64:990–1002. doi: 10.1109/TBME.2016.2585344. [DOI] [PubMed] [Google Scholar]
- 22.Seoud L, Hurtut T, Chelbi J, Cheriet F, Langlois JMP. Red lesion detection using dynamic shape features for diabetic retinopathy screening. IEEE Trans Med Imaging. 2016;35:1116–1126. doi: 10.1109/TMI.2015.2509785. [DOI] [PubMed] [Google Scholar]
- 23.Ojala T, Pietikainen M, Maenpaa T. Multi- resolution Gray-Scale and Rotation Invariant Texture Classification with Local Binary Patterns. IEEE Trans Pattern Anal Mach Intell. 2002;24:971–987. doi: 10.1109/TPAMI.2002.1017623. [DOI] [Google Scholar]
- 24.Alaei A, Pal S, Pal U, Blumenstein M. An efficient signature verification method based on an interval symbolic representation and a fuzzy similarity measure. IEEE Trans Inform Forensics Secur. 2017;12:2360–2372. doi: 10.1109/TIFS.2017.2707332. [DOI] [Google Scholar]
- 25.Guyon N, Matic, Vapnik VN. Discovering information patterns and data cleaning. Cambridge: MIT Press; 1996. [Google Scholar]
- 26.http://webeye.ophth.ulowa.edu/roc/var/www/university of Iowa, Retinopathy Online Challenge: 2007.
- 27.Rituparna Saha, Amrita Roy Chowdhury, Sreeparna Banerjee Diabetic Retinopathy related lesions detection and classifications using Machine learning Technology, Springer International Publishing, Switzerland, Part II, LNAI 9693, 734–745, 2016.
- 28.Lazar I, Hajdu A. Retinal Microaneurysm detection through local rotating cross-section profile analysis. IEEE Trans Med Imaging. 2013;32:400–407. doi: 10.1109/TMI.2012.2228665. [DOI] [PubMed] [Google Scholar]