

Summary
Interleukin (IL)‐10 plays a key role in controlling intestinal inflammation. IL‐10‐deficient mice and patients with mutations in IL‐10 or its receptor, IL‐10R, show increased susceptibility to inflammatory bowel diseases (IBD). Protein tyrosine phosphatase, non‐receptor type 22 (PTPN22) controls immune cell activation and the equilibrium between regulatory and effector T cells, playing an important role in controlling immune homoeostasis of the gut. Here, we examined the role of PTPN22 in intestinal inflammation of IL‐10‐deficient (IL‐10–/–) mice. We crossed IL‐10–/– mice with PTPN22–/– mice to generate PTPN22–/–IL‐10–/– double knock‐out mice and induced colitis with dextran sodium sulphate (DSS). In line with previous reports, DSS‐induced acute and chronic colitis was exacerbated in IL‐10–/– mice compared to wild‐type (WT) controls. However, PTPN22–/–IL‐10–/– double knock‐out mice developed milder disease compared to IL‐10–/– mice. IL‐17‐promoting innate cytokines and T helper type 17 (Th17) cells were markedly increased in PTPN22–/–IL‐10–/– mice, but did not provide a protctive function. CXCL1/KC was also increased in PTPN22–/–IL‐10–/– mice, but therapeutic injection of CXCL1/KC in IL‐10–/– mice did not ameliorate colitis. These results show that PTPN22 promotes intestinal inflammation in IL‐10‐deficient mice, suggesting that therapeutic targeting of PTPN22 might be beneficial in patients with IBD and mutations in IL‐10 and IL‐10R.
Keywords: colitis, IL‐10, inflammatory bowel diseases (IBD), PTPN22
Introduction
Inflammatory bowel diseases (IBD) are a group of heterogeneous diseases, and their main subforms are Crohn’s disease (CD) and ulcerative colitis (UC). CD usually affects the distal ileum, but the diseases can be located anywhere from the oral cavity to the anus 1. UC colitis is restricted to the colon and the inflammation is limited to the mucosa that affect the upper and lower gastrointestinal tract 2, 3. IBD is driven by aberrant activation of innate and adaptive immune responses. Genetic variants and alterations in the gut microflora strongly influence disease predisposition 2, 3. In IBD, genomewide association studies (GWAS) have identified single nucleotide polymorphisms (SNPs) in more than 160 risk genes 2, 3. Among the risk genes, those encoding for interleukin (IL)‐10 and protein tyrosine phosphatase, non‐receptor type 22 (PTPN22) have been strongly associated with enhanced and reduced risk to IBD, respectively 2, 3.
The importance of IL‐10 in intestinal homoeostasis was shown in patients with early‐onset IBD who carried pathogenic variants in IL‐10 and IL‐10R 4. IL‐10 is a potent anti‐inflammatory cytokine that inhibits T cell differentiation, proliferation and effector function, and exerts a protective role against IBD 5. IL‐10‐deficient mice develop spontaneous IBD characterized by the presence of inflammatory infiltrates made up of lymphocytes, macrophages and neutrophils 6, 7. In line with this, inflammation develops in mice treated with neutralizing anti‐IL‐10R 8, confirming the essential role of IL‐10 in intestinal homoeostasis.
Genetic variants in PTPN22, and particularly the most well‐known variant R620W (C1858T), were shown to be associated with a reduced risk for Crohn’s disease in humans 9, 10. PTPN22 encodes a lymphoid tyrosine phosphatase that is expressed by both myeloid and lymphoid immune cells 3. In T cells, PTPN22 binds to C‐terminal Src tyrosine kinase (Csk) and inhibits T cell receptor (TCR) signalling through dephosphorylation of the Lck protein tyrosine kinase 11, 12. Consequently, PTPN22 impacts T cell signalling, activation and function 13. PTPN22‐deficient mice show lymphoproliferation and effector memory T cell accumulation, but do not progress to autoimmunity due to an expansion of forkhead box protein 3 (FoxP3)+, regulatory T (Treg) and type 1 regulatory (Tr1) cells 14, 15.
The role of PTPN22 in intestinal homoeostasis has been extensively studied in two mouse models of experimental colitis. In a T cell‐mediated model of experimental colitis, transfer of naive PTPN22‐deficient CD4+ T cells into immunodeficient mice induced aggravated intestinal inflammation compared to PTPN22‐wild‐type (WT) naive CD4+ T cells 15. Transfer of PTPN22‐deficient but not PTPN22‐sufficient Tregs protected from colitis in this setting due to an enhanced capacity of PTPN22‐deficient Tregs in expressing lymphocyte function‐associated antigen 1 (LFA‐1) and producing IL‐10, compared to WT Tregs 15, 16, 17. A protective role for PTPN22 was shown in studies of dextran sodium sulphate (DSS)‐induced acute colitis 18, 19, 20. In these studies, lack of PTPN22 aggravated weight loss and exacerbated intestinal inflammation. The mechanism by which PTPN22 deficiency exacerbated DSS‐induced acute colitis is still unclear, and so far has been attributed to a reduced type I interferon production and an altered macrophage polarization 18, 19. The role of PTPN22 in human IBD is unclear 3. One study found that patients with IBD showed reduced levels of PTPN22 in the intestine, and specifically in their myeloid cells. Given the dual role of PTPN22 in restricting proinflammatory but also regulatory responses, we sought to investigate its biological significance in the IL‐10‐deficient background by assessing colitis susceptibility in double knock‐out PTPN22–/–IL‐10–/– mice.
Materials and methods
Mice
PTPN22–/– mice and IL‐10–/– (C57BL/6 background) were bred in‐house as previously described 21. PTPN22–/–IL‐10–/– double knock‐out mice were obtained by crossing PTPN22–/– mice and IL‐10–/– and intercrossing the F1, and by crossing F2 PTPN22+/–IL‐10–/– mice with PTPN22+/–IL‐10+/– or PTPN22+/–IL‐10–/– mice. The genetic background of the mice was tested by polymerase chain reaction (PCR). All mice were housed under specific pathogen‐free conditions at the San Raffaele Scientific Institute in compliance with guidelines of the Institutional Animal Care and Use Committee (IACUC #677).
DSS‐induced acute and chronic colitis
Acute DSS‐induced colitis was induced in female mice (average age 18·89 ± 7·75 weeks) by adding 2·5% (weight/volume) dextran sodium sulphate (DSS) (mol. wt 40 kD; TdB Consultancy, Uppsala, Sweden) to the drinking water 22. Mice were first treated for 7 days with DSS and then stabilized with normal drinking water for the following 2 days. Mice were euthanized 9 days after DSS treatment. For chronic DSS‐induced colitis, mice were treated with two cycles of DSS (2·5%) for 7 days/cycle and 14 days of normal drinking water in between. Mice were monitored daily before and after oral DSS conditioning. Body weight was assessed regularly (daily during the first 7 days) and mice were euthanized when they had lost more than 30% of their initial body weight. Mesenteric lymph nodes (MLN), spleen and large intestine (LI) were collected 9 days after the initial DSS treatment. Spleen weight and the LI length were also recorded.
Monoclonal anti‐mouse IL‐17A and recombinant CXCL1/KC treatments
The neutralizing rat anti‐mouse IL‐17A monoclonal antibody (mAb) was purchased from BioXCell (clone: 17F3; Cat #: BE0173). At the start of the DSS exposure, 100 µg of anti‐IL‐17A was administered intraperitoneally (i.p.) and administration of the same dose of mAb was repeated every 48 h for the duration of the experiment. Mouse recombinant CXCL1/KC was purchased from Biolegend (Cat. no. 573702); 100 ng of CXCL1/KC [in phosphate‐buffered saline (PBS)] was administered i.p. starting on the day of DSS treatment and injections continued daily for the whole duration of the experiment.
Cell isolation
Single‐cell suspensions of MLN were prepared by mechanical crushing with the end of a syringe plunger. Cells were subsequently passed through a 40‐μm nylon mesh cell strainer (Falcon, SACCO S.R.L., Cadorago, Italy) to remove aggregates. Large intestine was excised and mononuclear cells were isolated according to the protocol for isolation of murine lamina propria mononuclear cells, as previously described 23. Briefly, after removing the colonic patches, tissue was cleaned with PBS, opened longitudinally and then predigested twice in Hanks’s balanced salt solution (HBSS) without Ca2+ and Mg2+ with [1 mM dithiothreitol (DTT), 5 mM ethylenediamine tetraacetic acid (EDTA)] for 20 min at 37°C in a shaking incubator. After removing the adipose tissue, the LI was cut into pieces 1–2 mm long and incubated in a digestion solution (HBSS containing 0·5 mg/ml collagenase D (Roche, Basel, Switzerland), 1 mg/ml Dispase II (Roche) and 5 U/ml DNase I (Sigma, St Louis, MO, USA). The isolated cells were washed, resuspended in 5 m of 40% Percoll (Sigma) and overlaid on 2·5 m of 80% Percoll in a 15‐ml Falcon tube and centrifuged for 20 min at 1000 g. The interphase containing the mononuclear cells was collected, filtered and centrifuged for 10 min at 500 g. The resulting cells were then used for flow cytometry analysis.
Flow cytometry
Following a 2.4G2 (Fc) blocking step, cell surface staining was performed with anti‐mouse CD3, CD4, CD25, CD45, CD44, CD8, CD62L, LFA‐1, Ly6C, I‐Ab, CD11b, F4/80, Ly6G and CD11c mAbs at 1 : 100 dilution in staining buffer [PBS, 2% fetal calf serum (FCS), 0·1% NaN3] (a list of the mAbs is shown in Supporting information, Table S1). To detect FoxP3, cells were treated and stained with the FoxP3 fixation/permeabilization kit, according to the manufacturer’s instructions (eBioscience, San Diego, CA, USA). For cytokine analysis, cells were resuspended at a concentration 5–10 × 106/ml in 10% cRPMI and activated in 96‐well plates, by plating 100 µl (0·5–1 × 10⁶ cells). Cells were activated with the addition of 0·5 µl (in 100 µl) of leucocyte activation cocktail (LAC, BD Biosciences, San Jose, CA, USA) containing phorbol myristate acetate (PMA)/ionomycin for 3 h and stained as described above. All samples were acquired using fluorescence activated cell sorter (FACS) Canto flow cytometer (BD Biosciences) and analysed with FlowJo software (Tree Star, Ashland, OR, USA).
Serum cytokines and chemokines
The concentration of cytokines/chemokines in the serum was measured 1 day before and 3 days post‐DSS treatment using a mouse cytokine 23‐plex (Bio‐Plex Pro Mouse Cytokine 23‐plex Assay, Cat. no. M60009RDPD), according to the manufacturer’s instructions (Bio‐Rad, Hercules, CA, USA) and analysed using Bio‐Plex Manager software. The kit consisted of the following cytokines/chemokines: IL‐1α, IL‐1β, IL‐2, IL‐3, IL‐4, IL‐5, IL‐6, IL‐9, IL‐10, IL‐12 subunit p40 [IL‐12(p40)], IL‐12(p70), IL‐13, IL‐17, IL‐18, eotaxin, granulocyte colony‐stimulating factor (G‐CSF), granulocyte‐macrophage colony‐stimulating factor (GM‐CSF), interferon (IFN)‐γ, keratinocyte chemoattractant (KC), monocyte chemotactic protein (MCP)‐1, macrophage inflammatory protein (MIP)‐1α, macrophage inflammatory protein (MIP)‐1β, regulated upon activation, normal T cell expressed, and secreted (RANTES) and tumour necrosis factor (TNF).
Histopathological analysis
For post‐mortem histopathology, murine colons were excised, fixed in zinc‐formalin (Sigma) and embedded in paraffin. Serial 4‐µm sections were stained with haematoxylin and eosin (H&E) and images were acquired using Aperio AT2 (Leica Biosystems, Wetzlar, Germany). For colitis score assessment, the entire digital images were analysed based on (i) enterocytes loss, (ii) crypt inflammation, (iii) infiltration of mononuclear cells and (iv) polymorphonuclear leucocytes in the lamina propria and (v) epithelial hyperplasia, as described previously by Kennedy et al. 24. Final colitis scores were expressed in a range from 0 to 15 to describe healthy and severe conditions, respectively.
Statistical analysis
Weight loss curves were compared with the two‐way analysis of variance (anova) test followed by Bonferroni’s post‐test to compare replicate means for each time‐point. Comparisons between groups were performed using Kruskal–Wallis analysis followed by Dunn’s post‐test (one‐way anova test) or a Mann–Whitney U‐test where appropriate. In all cases the Prism software (GraphPad, La Jolla, CA, USA) was used. All error bars indicate standard error of the mean (s.e.m.), while horizontal lines show the mean. Asterisks in the graphs indicate significant P‐values as follows: *P < 0·05, **P < 0·01, ***P < 0·001 and ****P < 0·0001.
Results
PTPN22 promotes acute experimental colitis in IL‐10‐deficient mice
In order to address the effect of PTPN22 in the intestinal inflammation of IL‐10‐deficient, PTPN22 and IL‐10 double knock‐out (PTPN22 –/– IL‐10–/–) mice were generated. IL‐10‐deficient (IL‐10–/–) and PTPN22 –/– IL‐10–/– double knock‐out mice were monitored for up to 24 weeks of age and no significant signs of spontaneous colitis were observed macroscopically (no weight loss, reduction in gut length or presence of loose stools) (Supporting information, Fig. S1). WT, IL‐10–/–, PTPN22 –/– and PTPN22 –/– IL‐10–/– mice were treated with DSS to induce acute colitis and mouse body weight was evaluated daily. While IL‐10–/– and PTPN22 –/– mice showed aggravated body weight loss compared to WT mice, body weight loss in PTPN22 –/– IL‐10–/– mice was similar to that observed in WT mice (Fig. 1a,b, Table 1). Thus, PTPN22 –/– IL‐10–/– mice were less susceptible to acute DSS‐induced acute colitis compared to IL‐10–/– and PTPN22 –/– mice. PTPN22 –/– and IL‐10–/– mice had shorter colons and a higher degree of gut inflammation compared to WT controls (Fig. 1c–e), confirming previous data concerning the protective role of IL‐10 and PTPN22 in DSS‐induced acute colitis in mice 18, 19, 25. Instead, PTPN22 –/– IL‐10–/– mice had longer colons and showed reduced gut inflammation compared to single knock‐out, IL‐10–/– and PTPN22 –/– mice (Fig. 1d,e). Also, DSS‐treated IL‐10 –/– mice had smaller spleens compared to PTPN22 –/– IL‐10–/– mice (Fig. 1f). No significant differences in the spleen size were observed in the steady state among the four groups (Supporting information, Fig. S1c). Taken together, our data show that PTPN22 and IL‐10 prevent acute DSS‐induced colitis in mice. However, in the absence of PTPN22, IL‐10‐deficient mice are less susceptible to acute DSS‐induced colitis. Thus, PTPN22 promotes colitis in IL‐10‐deficient mice.
Figure 1.
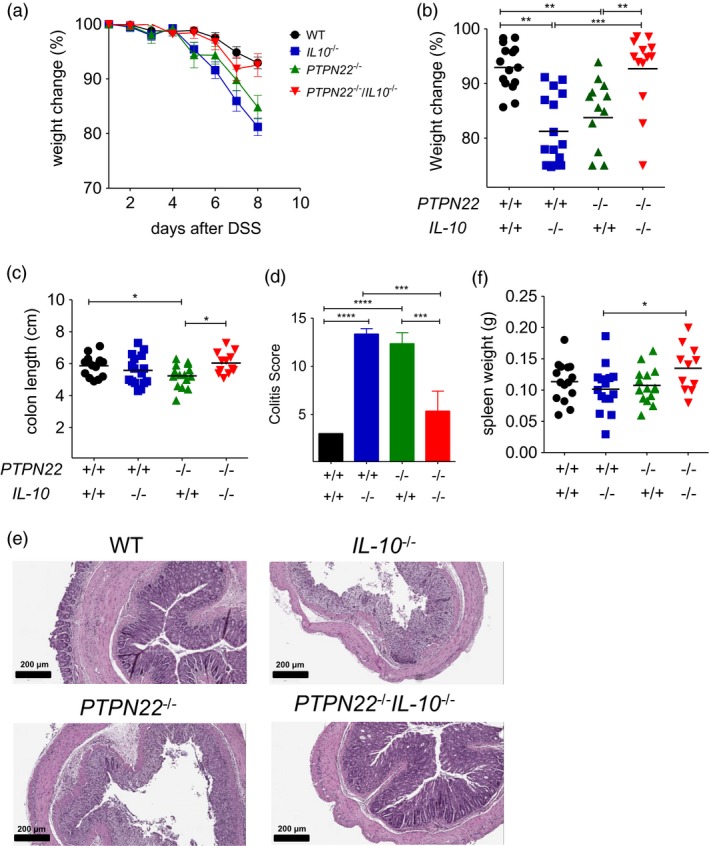
Protein tyrosine phosphatase, non‐receptor type 22 (PTPN22) promotes acute dextran sodium sulphate (DSS)‐induced experimental colitis in IL‐10‐deficient mice. (a) Weight was measured in DSS‐treated mice daily [wild‐type (WT), n = 15; PTPN22–/–, n = 15; IL‐10–/–, n = 17 and PTPN22–/–IL‐10–/–, n = 13]. Graph shows daily weight change (in percentage) compared to the initial weight. (b) Percentage of weight change from initial weight of DSS‐treated mice of (a) analysed at day 8. (c) Colon length among DSS‐treated mice at day 8 expressed in cm. (d,e) Colitis score and representative haematoxylin and eosin (H&E) colon sections from DSS‐treated mice of the indicated genotypes (n = 3/group). Scale bars: 200 μm, high‐power fields. (f) Spleen weight in grams analysed in DSS‐treated mice at day 8. Horizontal lines in (b,c,f) show the mean. Each symbol represents an individual mouse. Data are pooled from three experiments with similar results. Statistical significance was determined by Kruskal–Wallis analysis followed by Dunn’s post‐test [one‐way analysis of variance (anova) test] (*P < 0·05, **P < 0·01 and ***P < 0·001).
Table 1.
Statistical analysis of weight change in mice shown in Fig. 1
| WT | IL‐10–/– | PTPN22–/– | PTPN22–/–IL‐10–/– | |
|---|---|---|---|---|
| WT | *** | * | n.s. | |
| IL‐10–/– | *** | n.s. | *** | |
| PTPN22–/– | * | n.s. | n.s. | |
| PTPN22–/–IL‐10–/– | n.s. | *** | n.s. |
P < 0.05;
P < 0.01 and
P < 0.001;
n.s. = not statistically significant. WT = wild‐type; IL = interleukin; PTPN22 = protein tyrosine phosphatase, non‐receptor type 22.
PTPN22 promotes chronic experimental colitis in mice
Acute colitis induction with DSS relys on barrier defects, and the main disease mediators are cells of the innate immune system 26. Given that PTPN22 affects both innate and adaptive immune responses, we additionally assessed the role of PTPN22 in a model of chronic colitis that is thought to be predominantly mediated by T cells 26. Here, mice were treated with two cycles of DSS for 7 days/cycle alternating 14 days of normal drinking water in between. Unlike acute colitis, PTPN22 –/– mice developed chronic disease that was less severe compared to WT controls (Fig. 2a). Instead, IL‐10–/– mice showed severe weight loss and had to be euthanized. Interestingly, PTPN22 –/– IL‐10–/– mice showed weight lost that was similar to that observed in WT mice. The mortality rate was also significant in these mice, but was reduced compared to IL‐10–/– mice (Fig. 2b). Taken together, these data suggest that lack of PTPN22 also protects mice from DSS‐induced chronic colitis in the context of IL‐10‐deficiency (Table 2).
Figure 2.
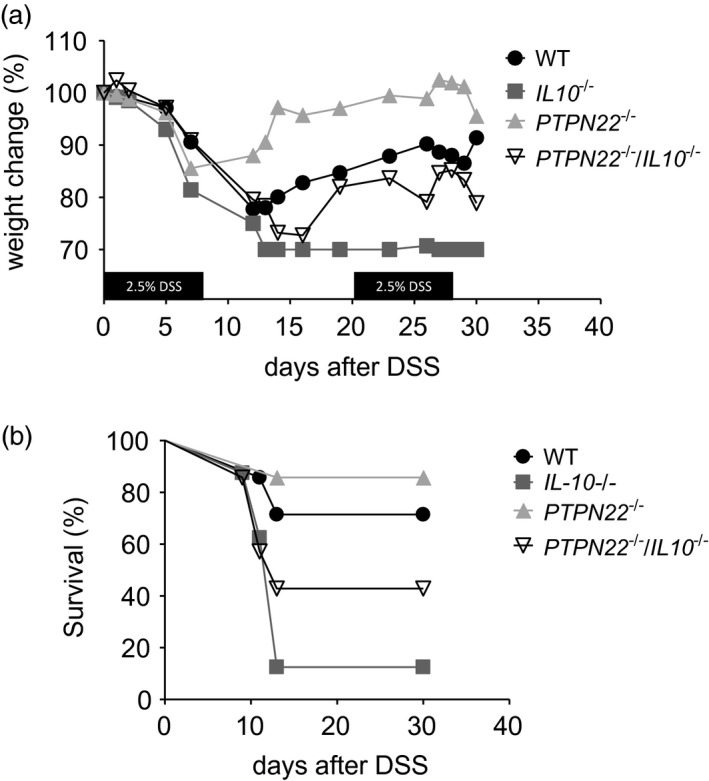
Protein tyrosine phosphatase, non‐receptor type 22 (PTPN22) promotes chronic dextran sodium sulphate (DSS)‐induced experimental colitis. (a) Weight was measured in DSS‐treated mice [wild‐type (WT), n = 7; PTPN22–/–, n = 8; IL‐10–/–, n = 7 and PTPN22–/–IL‐10–/–, n = 7). Graph shows weight change (in percentage) compared to the initial weight. The mice were followed until day 31. (b) Survival curve of mice exposed to DSS from days 1 to 31. The same mice as in (a) are included. Statistical analysis of weight change is summarized in Table 3.
Table 2.
Statistical analysis of weight change in mice shown in Fig. 2
| WT | IL‐10–/– | PTPN22–/– | PTPN22–/–IL‐10–/– | |
|---|---|---|---|---|
| WT | *** | * | n.s. | |
| IL‐10–/– | *** | * | * | |
| PTPN22–/– | * | n.s. | n.s. | |
| PTPN22–/–IL‐10–/– | n.s. | * | * |
WT = wild‐type; IL = interleukin; PTPN22 = protein tyrosine phosphatase, non‐receptor type 22; n.s. = not significant.
PTPN22 and IL‐10 control LFA‐1 expression in FoxP3+CD4+ Treg cells
In order to understand how PTPN22 controls gut inflammation in an IL‐10‐sufficient and IL‐10‐deficient context, we analysed the frequency and phenotype of FoxP3+ Treg cells, whose development and function is controlled by PTPN22 15, 16, 27, 28. MLN and lymphocytes of the LI were collected 8 days after DSS treatment and stained for analysis. PTPN22 –/– and PTPN22 –/– IL‐10–/– mice showed an increased percentage of FoxP3+ and CD25+FoxP3+ CD4+ T cells (Treg) in their MLN compared to WT mice (Fig. 3a,b and Supporting information, Fig. S2 for gating strategy). Instead, IL‐10–/– mice showed a reduction in Treg cells in the LI compared to WT and PTPN22 –/– mice (Fig. 3c and Table 3). To address whether this effect was specific to the DSS‐induced inflammation, we evaluated the frequency of Treg cells in the steady state. Treg cell frequency was found elevated in the MLN and LI of PTPN22 –/– and PTPN22 –/– IL‐10–/– mice compared to WT controls (Supporting information, Fig. S3b,c), suggesting that PTPN22 controls Treg cell development in the MLN both in the steady state and under inflammatory conditions.
Figure 3.
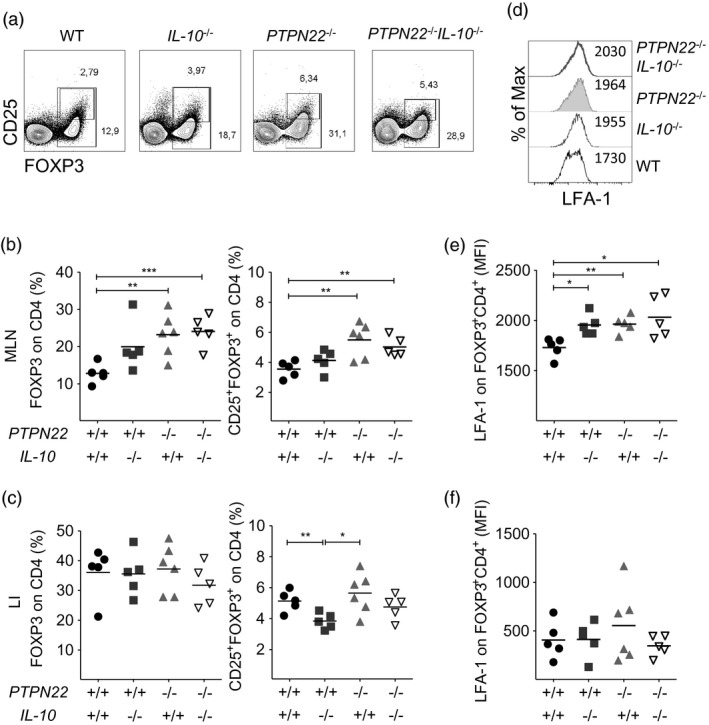
Protein tyrosine phosphatase, non‐receptor type 22 (PTPN22) controls the number of forkhead box protein 3 (FoxP3)+ regulatory T cells (Treg) and their expression of lymphocyte function‐associated antigen 1 (LFA‐1) in colitic IL‐10‐deficient mice. (a) Representative fluorescence activated cell sorter (FACS) plots show frequency of FoxP3+ and CD25+FoxP3+ Treg cells in the mesenteric lymph nodes (MLN) of wild‐type (WT), PTPN22–/–, IL‐10–/– and PTPN22–/–IL‐10–/– mice treated with dextran sodium sulphate (DSS) for 8 days. One representative mouse per group is shown. (b,c) Graphs display Treg frequencies in MLN (b) and large intestine (LI) (c) from multiple mice (n = 5–6/group). (d) Histogram overlay depicting LFA‐1 expression levels (% of max.) on FoxP3+ Treg cells from MLNs. (e,f) Mean fluorescence intensity (gMFI) of LFA‐1 on FoxP3+ Treg cells from MLN (e) and LI (f). Horizontal lines in (b,c) and (e,f) show mean. Each symbol represents an individual mouse. Data are pooled from two experiments with similar results. Statistical significance was determined by Kruskal–Wallis analysis followed by Dunn’s post‐test [one‐way analysis of variance (anova) test] (*P < 0·05, **P < 0·01 and ***P < 0·001).
Table 3.
Summary of changes in Treg and Th17 subset distribution according to genotype in DSS‐colitic mice
| DSS colitic mice | mLN | LI | ||
|---|---|---|---|---|
| T reg | Th17 | T reg | Th17 | |
| WT | = | = | = | = |
| IL‐10–/– | = | = | = | ↑ |
| PTPN22–/– | ↑ | = | = | = |
| PTPN22–/–IL‐10–/– | ↑ | ↑ | = | ↑ |
WT = wild‐type; IL = interleukin; PTPN22 = protein tyrosine phosphatase, non‐receptor type 22; Treg = regulatory T cells; Th17 = T helper type 17; mLN = mesenteric lymph nodes; LI = large intestine; DSS = dextran sodium sulphate.
Recent results have shown that Treg cells need to express LFA‐1 to mediate their suppressive function and that PTPN22 controls LFA‐1 expression in Treg cells 17, 29. Here, we analysed the expression levels of LFA‐1 on FoxP3+ Treg cells in the MLN and LI of the four groups of mice 8 days after DSS treatment. We found that IL‐10–/–, PTPN22 –/– and PTPN22 –/– IL‐10–/– mice showed elevated expression of LFA‐1 on FoxP3+ Treg cells from MLN in comparison to WT mice, while no differences were seen in the LI (Fig. 3d–f). Thus, our findings support a role for PTPN22 and IL‐10 in LFA‐1 expression levels by Tregs in the MLN of colitic mice.
IL‐17 production is increased in the MLN and LI of PTPN22–/–IL‐10–/– mice with colitis
Experimental colitis is mediated by effector T cells that home in the gut when the gut epithelial barrier is breached by DSS and cause inflammation via the production of inflammatory cytokines, including IFN‐γ, TNF and IL‐17 30. Here, we evaluated the profile of proinflammatory cytokine production by gut infiltrating lymphocytes. Co‐staining for IFN‐γ and TNF identified three populations of CD4+ T cells in the MLN and LI: IFN‐γ–TNF+, IFN‐γ+TNF+ and IFN‐γ+TNF– cells (Supporting information, Fig. S4). No differences in the percentage of IFN‐γ+TNF+ CD4+ T cells were found in any of the groups (see Supporting information, Fig. S4 and S5 for gating strategy). Co‐staining for IFN‐γ and IL‐17 identified three subsets of CD4+ T cells: IFN‐γ–IL‐17+ [T helper type 17 (Th17)], IFN‐γ+IL‐17+ (Th1/Th17) and IFN‐γ+IL‐17– (Th1) (Fig. 4a). The proportion of Th17 cells was significantly elevated in the MLN and LI of PTPN22 –/– IL‐10–/– mice compared to the other groups (Fig. 4b,c, left panels and see Supporting information, Fig. S5 for gating strategy). Moreover, the proportion of Th1/Th17 cells was also increased in the MLN and LI of the PTPN22 –/– IL‐10–/– mice compared to the other groups (Fig. 4b,c, middle panels). Instead, the proportion of Th1 cells was higher in the MLN of PTPN22 –/– IL‐10–/– and PTPN22 –/– mice compared to WT controls (Fig. 4b,c, right panels). Taken together, IL‐17 production by CD4+ T cells was found significantly elevated in the MLN and LI of PTPN22 –/– IL‐10–/– mice compared to PTPN22 –/–, IL‐10–/– and WT mice (Table 3).
Figure 4.
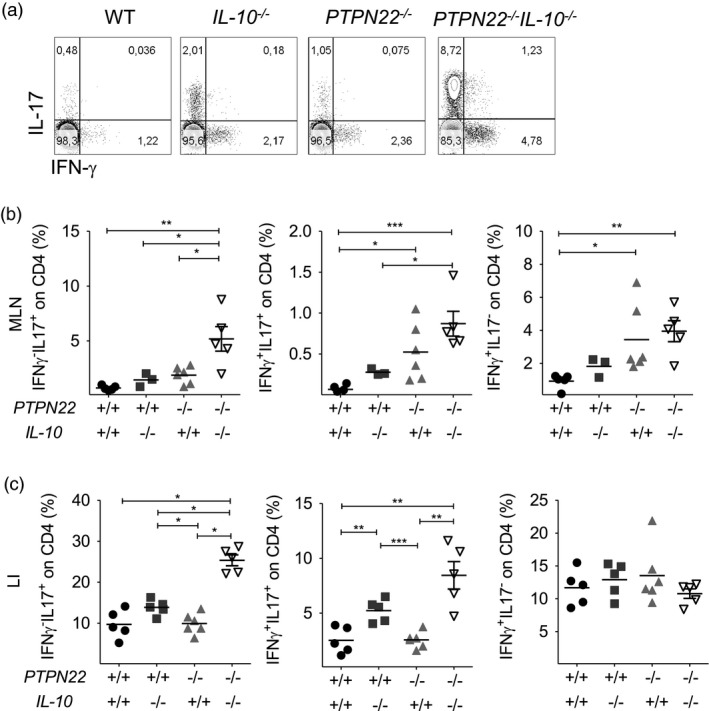
Protein tyrosine phosphatase, non‐receptor type 22 (PTPN22) restricts interleukin (IL)‐17 production by CD4 T cells in IL‐10‐deficient mice treated with dextran sodium sulphate (DSS). Lamina propria mononuclear cells from WT, PTPN22–/–, IL‐10–/– and PTPN22–/–IL‐10–/– mice treated with DSS for 8 days were processed, fixed, permeabilized and stained to assess interferon (IFN)‐γ and IL‐17 by CD4+ T cells. (a) Representative fluorescence activated cell sorter (FACS) plots display frequency of IFN‐γ–IL‐17+, IFN‐γ+IL‐17+ and IFN‐γ+IL‐17– CD4 T cells from the mesenteric lymph nodes (MLN). A representative mouse from each strain is shown. (b,c) Graphs display frequency in MLN (b) and large intestine (LI) (c) from multiple mice (n = 3–5/group). Horizontal lines show mean. Each symbol represents an individual mouse. Data are pooled from two experiments with similar results. Statistical significance was determined by Kruskal–Wallis analysis followed by Dunn’s post‐test [one‐way analysis of variance (anova) test] (*P < 0·05, **P < 0·01 and ***P < 0·001).
It has been previously reported that CD8+ T cells also participate in the intestinal inflammatory process of the gut mucosa 31. Hence, we also analysed the cytokine profile of gut infiltrating CD8+ T cells. Similarly to CD4+ T cells, cytokine‐producing CD8+ T cells were grouped into six subsets according to their cytokine expression profile (Fig. 5a and Supporting information, Fig. S6a). The percentage of IFN‐γ+TNF+ CD8+ T cells was increased in the MLN of PTPN22 –/– IL‐10–/– mice in comparison to IL‐10–/– mice (Supporting information, Fig. S6a,b). While no significant differences in the percentage of IL‐17 and IFN‐γ‐expressing CD8+ T cells were observed in MLN (Fig. 5b), analysis of LI showed a higher proportion of IL‐17 and IFN‐γ co‐expressing CD8+ T cells of PTPN22 –/– IL‐10–/– mice in comparison to the other groups (Fig. 5c). Together, these data show that the proportion of IL‐17‐producing CD4+ and CD8+ T cells are increased in the gut of PTPN22 –/– IL‐10–/– mice compared to PTPN22–/–, IL‐10–/– mice and WT controls.
Figure 5.
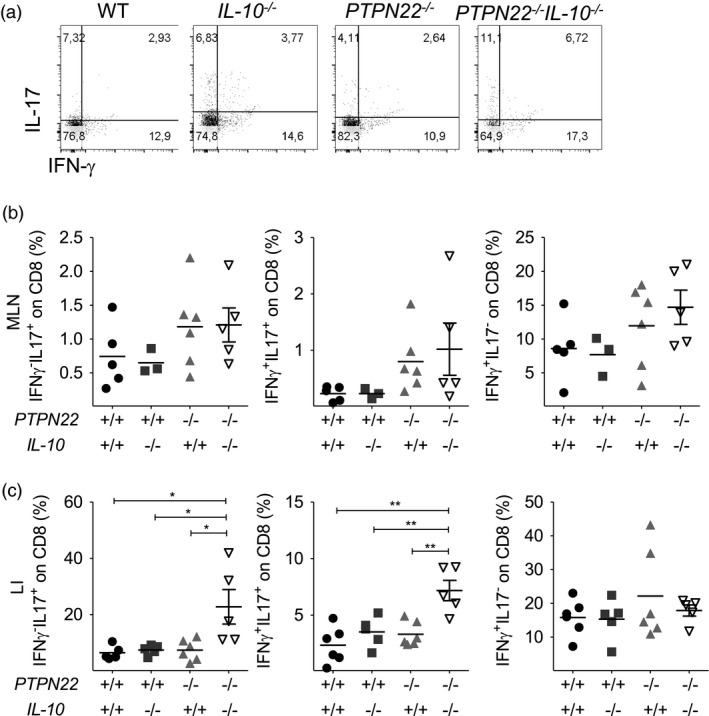
Protein tyrosine phosphatase, non‐receptor type 22 (PTPN22) restricts interleukin (IL)‐17 production by CD8 T cells in IL‐10‐deficient mice treated with dextran sodium sulphate (DSS). Wild‐type (WT), PTPN22–/–, IL‐10–/– and PTPN22–/–IL‐10–/– mice were treated with DSS for 8 days and their mesenteric lymph node (MLN) and large intestine (LI) were processed, fixed, permeabilized and stained to assess interferon (IFN)‐γ and IL‐17 by CD8+ T cells. (a) Representative fluorescence activated cell sorter (FACS) plots display frequency of IFN‐γ–IL‐17+, IFN‐γ+IL‐17+ and IFN‐γ+IL‐17– CD8 T cells from the LI. A representative mouse from each strain is shown. (b,c) Graphs display frequency in MLN (b) and LI (c) from multiple mice (n = 5/group). Horizontal lines show mean. Each symbol represents an individual mouse. Data are pooled from two experiments with similar results. Statistical significance was determined by Kruskal–Wallis analysis followed by Dunn’s post‐test [one‐way analysis of variance (anova) test] (*P < 0·05, **P < 0·01 and ***P < 0·001).
PTPN22 controls DSS‐induced innate proinflammatory cytokine production
Innate immune cells of myeloid origin and antigen‐presenting cells (APC), e.g. dendritic cells (DCs), that infiltrate the inflamed lamina propria have been shown to sustain and propagate intestinal inflammation 32, 33, 34, 35. Here, we analysed the frequency of F4/80+ monocytes/macrophages and eosinophils, CD11b+Ly6G+ neutrophils and CD11c+ and CD11b+CD11c+ DCs in the LI of DSS‐treated mice and observed no significant differences between the four group of mice (Supporting information, Fig. S7 for gating strategy and Supporting information, Fig. S8 for data). Next, we assessed by Bio‐Plex the serum levels of 23 cytokines and chemokines that could be involved in intestinal inflammation. Serum was collected 3 days after the initiation of DSS and eight cytokines/chemokines were found significantly elevated in PTPN22 –/– IL‐10–/– mice: IL‐1b, IL‐6, IL‐12 (p40), IL‐2, MIP‐1a, MIP‐1b, CXCL1/KC, MCP‐1 and RANTES (Fig. 6).
Figure 6.
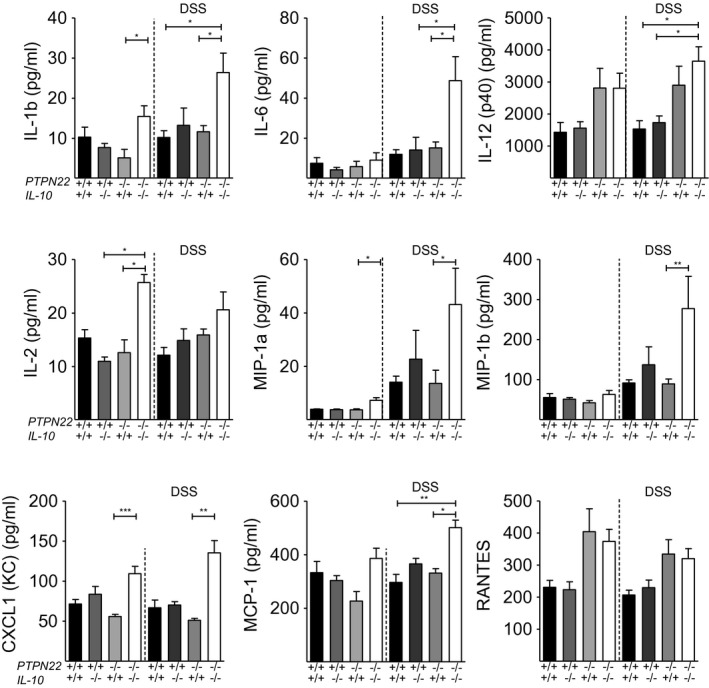
Innate serum cytokine and chemokine analysis with Bio‐Plex. Serum was collected on day 3 after dextran sodium sulphate (DSS) treatment. (a) Plots show levels of between interleukin (IL)‐1b, IL‐6, IL‐12 (p40), IL‐2, macrophage inflammatory protein (MIP)‐1α, MIP‐1β, chemokine (C‐X‐C motif) ligand 1 (CXCL1) (KC), monocyte chemotactic protein (MCP)‐1 and regulated upon activation, normal T cell expressed, and secreted (RANTES) in WT (n = 5), protein tyrosine phosphatase, non‐receptor type 22 (PTPN22–/–) (n = 5), IL‐10–/– (n = 7) and PTPN22–/–IL‐10–/– (n = 7) mice. Statistical significance was determined by Kruskal–Wallis analysis followed by Dunn’s post‐test [one‐way analysis of variance (anova) test] (*P < 0·05, **P < 0·01 and ***P < 0·001). Each symbol represents an individual mouse.
Blockade of IL‐17 does not worsen DSS‐induced acute colitis in of PTPN22–/–IL‐10–/– mice
IL‐1b, IL‐6 and IL‐12 (p40) comprise part of the group of innate cytokines that promote Th17 polarization 36. The increased levels of these cytokine mediators in the sera of PTPN22 –/– IL‐10–/– mice (Fig. 6) are in line with the elevated levels of Th17 cells found in their gut (Fig. 4c). Two recent independent reports by Ogawa et al. 37 and O’Connor et al. 38 showed that IL‐17 can exert a protective role from colitis and maintain gut homoeostasis by suppressing Th1 differentiation. Therefore, we hypothesized that the production of IL‐17‐promoting cytokines and T cell‐derived IL‐17 might be the reason for disease protection in PTPN22–/–IL‐10–/– mice. Consequently, PTPN22–/–IL‐10–/– mice were treated with anti‐IL‐17A and monitored for weight loss. In contrast to our initial hypothesis, IL‐17A blockade did not worsen acute DSS‐induced colitis in PTPN22–/–IL‐10–/– mice (Fig. 7a). Colon length was found increased in PTPN22–/–IL‐10–/– mice treated with anti‐IL‐17A, suggesting that IL‐17 played a proinflammatory rather than a protective role (Fig. 7b). These findings suggest that neither IL‐17 nor IL‐17‐promoting innate cytokines mediated protection from colitis PTPN22–/–IL‐10–/– mice 39, 40.
Figure 7.

Interleukin (IL)‐17 blockade in protein tyrosine phosphatase, non‐receptor type 22 (PTPN22–/–)IL‐10–/– mice does not increase susceptibility to dextran sodium sulphate (DSS)‐induced acute colitis. (a) Weight was measured in DSS‐treated mice daily (IL‐10–/–, n = 6, PTPN22–/–IL‐10–/– n = 6 and PTPN22–/–IL‐10–/– + anti‐IL‐17, n = 4). Graph shows daily weight change (in percentage) compared to the initial weight. (b) Colon length among DSS‐treated mice at day 8 expressed in cm. (c) Weight was measured in DSS‐treated mice daily (IL‐10–/–, n = 18, IL‐10–/– +CXCL1/KC, n = 5). Graph shows daily weight change (in percentage) between IL‐10–/– and IL‐10–/– mice, treated with CXCL1/KC, compared to the initial weight.
CXCL1/KC administration delays but does not protect from acute colitis IL‐10‐deficient mice
Given the elevated levels of CXCL1/KC in the sera IL‐10–/– mice, we thought to determine the role of CXCL1/KC in their intestinal response to inflammation. Earlier studies by Donohue et al. showed that mice with a targeted mutation in CXCL1/KC exhibit a much more profound colitis in response to DSS, supporting a protective role of CXCL1/KC in this disease 41. Consequently, we hypothesized that the increased levels of CXCL1/KC in the sera of PTPN22–/–IL‐10–/– mice might have had an anti‐inflammatory activity. To test this hypothesis, we administered recombinant CXCL1/KC to IL‐10‐deficient mice. We found that CXCL1/KC treatment delayed disease progression by a couple of days and, with the exception of one mouse that was protected from colitis, the remaining four CXCL1‐treated mice developed wasting disease and acute colitis (Fig. 7c).
Discussion
This study shows that PTPN22–/–IL‐10–/– mice are less susceptible to acute DSS‐induced experimental colitis compared to PTPN22–/– and IL‐10–/– mice. This finding was surprising and unexpected, as both PTPN22–/– and IL‐10–/– mice are more susceptible to acute DSS‐colitis when compared to WT controls. Of note, neither IL‐10–/– nor PTPN22–/–IL‐10–/– double knock‐out mice showed any macroscopic evidence of autoimmunity or colitis in the steady state. We also found that PTPN22 is a promoter of chronic DSS‐induced colitis in mice. Lack of PTPN22 protected from chronic DSS‐induced colitis in both IL‐10‐sufficient and IL‐10‐deficient mice. These findings suggest a dual, context‐dependent role of PTPN22: PTPN22 acts as a repressor of acute inflammatory immune responses in the gut in the presence of IL‐10, but acts as a promoter of acute gut inflammation in the absence of IL‐10. During chronic inflammation, however, PTPN22 promotes gut inflammation irrespective of the presence of IL‐10.
Similarly to PTPN22–/– mice, PTPN22–/–IL‐10–/– mice had a substantial increase of MLN‐residing Treg cells (CD4+FoxP3+) that expressed elevated levels LFA‐1 compared to WT mice 17. However, the elevation in FoxP3+ Treg and LFA‐1 levels probably played a minor role in protecting from acute DSS‐colitis, as PTPN22–/– mice were more susceptible to this form of colitis that is driven by an innate proinflammatory response 18, 19. However, Tregs might have played a role in protecting PTPN22‐deficient from chronic colitis that is thought to be T cell‐mediated.
Unfortunately, the use of littermates was not possible in all experiments. Consequently, microbiota could have played a role in disease protection. To evaluate their contribution, we repeated some of the experiments by randomly mixing the mice and allowing them to exchange bedding material for 2 weeks prior to DSS treatment. The results obtained were similar (although repeated only twice; data not shown), suggesting that PTPN22 promotes acute and chronic colitis in IL‐10‐deficient mice. Of note, in the chronic colitis experiments mice were treated with only two cycles of DSS. The experiment had to be interrupted because IL‐10–/– mice showed severe weight loss (loss of 30% of initial body weight is considered as death) compared to the other stains and had to be euthanized.
The role of IL‐10 in intestinal inflammation is well established, while that of the PTPN22 is less understood 3. Depending on the experimental system, and the cellular and molecular mechanisms that are involved, PTPN22 R620W seems to act as a loss‐of‐function or gain‐of‐function variant 42, 43, 44, 45. Our data suggest that PTPN22 promotes inflammation when the expression of IL‐10 is perturbed. Hence, we hypothesize that if PTPN22 R620W acts as a loss‐of‐function variant in IBD, then individuals with variants in both IL‐10 and PTPN22 might be less susceptible to developing the disease. Inevitably, our work has some limitations, but it would be interesting to analyse the association between IL‐10/IL‐10R and PTPN22 variants and susceptibility to IBD.
To address the mechanism by which PTPN22 promotes gut inflammation in IL‐10–/– mice, we analysed the innate and adaptive proinflammatory cytokine profile. IL‐17‐promoting innate cytokines and Th17 polarization were highly increased in PTPN22–/–IL‐10–/– mice compared to the other strains. However, IL‐17 blockade did not aggravate disease in PTPN22–/–IL‐10–/– double knock‐out mice, suggesting that the elevated levels of IL‐17 were not involved in protection from DSS‐induced colitis.
IBDs are the result of complex interactions between various signalling pathways and different cell types that interact through chemokines and cytokines in the intestine and in other parts of the lymphoid and non‐lymphoid organs 46. To clarify the regulatory pathway that was activated in PTPN22–/–IL‐10–/– double knock‐out mice and protected from colitis development, we decided to investigate the role of CXCL1/KC, a chemokine that is known to play a protective role from DSS‐induced colitis in C57BL/6 mice 41. We found that CXCL1/KC treatment delayed disease progression but did not protect IL‐10–/– mice from acute colitis.
In summary, we have shown that PTPN22 promotes gut inflammation in IL‐10–/– colitic mice. Moreover, PTPN22 restricts FoxP3 expression in CD4+ T cells even in the absence of IL‐10, and both molecules (PTPN22 and IL‐10) restrict LFA‐1 expression in Treg cells. PTPN22 and IL‐10 also restrict Th17 cells at the inflammatory site, but this mechanism is not responsible for preventing gut inflammation in PTPN22–/–IL‐10–/– mice. Probably the prevention of excessive inflammatory response in PTPN22–/–IL‐10–/– mice is determined by a combination of factors rather than an individual cytokine/chemokine. Although further studies are needed, our data provide new insights into the mechanism by which PTPN22 and IL‐10 co‐operate in defining innate immune responses, Treg and Th17 differentiation and influence the course of inflammatory conditions such as IBD.
Disclosures
The authors have declared that no conflicts of interest exist.
Supporting information
Fig. S1. (a) Weight was measured WT (n = 16), PTPN22–/– (n = 12), IL‐10–/–,(n = 17) and PTPN22–/–IL‐ 10–/– (n = 17) mice at the steady‐state. (b‐c) Colon length and spleen weight were determined for the same group of mice (n = 6‐9/group). Each symbol represents an individual mouse. Data are pooled from >3 experiments with similar results.
Fig. S2. Representative FACS plots showing gating strategy used to characterize FOXP3+ and CD25+FOXP3+ CD4 T cells. The representative sample is from LI.
Fig. S3. (a) Representative FACS plots show frequency of FOXP3+ and CD25+FOXP3+ Treg cells in the MLN of WT, PTPN22–/–, IL‐10–/– and PTPN22–/–IL‐10–/– mice at the steady state. One representative mouse per group is shown. (b‐c) Graphs display Treg frequency in MLN (b) and LI (c) from multiple mice (n = 6‐9/group). (d) Lamina propria mononuclear cells were stained to assess IFN‐γ and IL‐17 by CD4+ T cells. Results are from multiple mice (n = 3/group). Horizontal lines show mean. Each symbol represents an individual mouse. Statistical significance was determined by Kruskal–Wallis analysis followed by Dunn’s post‐test (1‐way ANOVA test) (*P < 0.05; **P < 0.01 and ***P < 0.001).
Fig. S4. MLN and lamina propria mononuclear cells from WT, PTPN22–/–, IL‐10‐/‐, and PTPN22–/–IL‐10‐/‐ mice treated with DSS for 8 days were processed, stained, fixed and permeabilized to assess IFN‐γ and TNF by CD4+ T cells (a) Representative FACS plots display frequency of IFN‐γ‐TNF+, IFN‐γ+TNF+ and IFN‐γ+TNF‐ CD4 T cells from the LI. A representative mouse from each strain is shown. (b‐c) Graphs display frequency in MLN (b) and LI (c) from multiple mice (n = 3‐6/group). Horizontal lines show mean. Each symbol represents an individual mouse. Data are pooled from two experiments with similar results.
Fig. S5. Representative FACS plots showing gating strategy used to characterized cytokine production by CD4+ and CD8+ T cells. The representative sample is from LI.
Fig. S6. MLN and lamina propria mononuclear cells from WT, PTPN22–/–, IL‐10–/–, and PTPN22–/–IL‐10–/– mice treated with DSS for 8 days were processed, stained, fixed and permeabilized to assess IFN‐γ and TNF by CD8+ T cells (a) Representative FACS plots display frequency of IFN‐γ‐TNF+, IFN‐γ+TNF+ and IFN‐γ+TNF‐ CD8 T cells from the LI. A representative mouse from each strain is shown. (b‐c) Graphs display frequency in MLN (b) and LI (c) from multiple mice (n = 3‐6/group). Horizontal lines show mean. Each symbol represents an individual mouse. Data are pooled from two experiments with similar results.
Fig. S7. Representative FACS plots showing gating strategy used to characterized innate immune cells. The subpopulation analysed are lymphoid DCs (CD11b‐CD11c+), myeloid DCs (CD11b+CD11c+) and other myeloid cells (CD11b+CD11c‐). Following gating on CD11b+CD11c‐ we characterized neutrophils (F4/80‐LY6G+) and macrophages (F4/80+LY6G‐). Further gating on F4/80+ cells enabled the characterization of monocytes and macrophages and eosinophils. The representative sample is from LI of a PTPN22–/–IL‐10–/– mouse.
Fig. S8. Innate immune cell distribution. MLN and LI of DSS‐treated mice (WT, PTPN22–/–, IL‐10–/– and PTPN22–/–IL‐10–/–) were processed and stained to assess the composition of innate immune cells during acute experimental colitis. (a) Representative graphs display frequency of innate cells in MLN. (b) Frequency of innate cells in LI is displayed. Each symbol represents an individual mouse.
Table S1. List of the antibodies and fluorophore conjugates used, including the dye, commercial source, clone and catalog number.
Acknowledgements
This study was supported by a Marie Curie Reintegration Grant to G. F. T. J.; G. G. performed experiments, analysed data and assisted with writing the manuscript. I. C., L. D. G. and C. S. assisted with the isolation of lamina propria mononuclear cells. A. A. performed Bio‐Plex analyses. A. V. assisted with colitis scoring. M. F. reviewed the manuscript. G. F. oversaw the study, analysed data and wrote the manuscript.
References
- 1. Huang BL, Chandra S, Shih DQ. Skin manifestations of inflammatory bowel disease. Front Physiol 2012; 3:13. [DOI] [PMC free article] [PubMed] [Google Scholar]
- 2. Lees CW, Barrett JC, Parkes M, Satsangi J. New IBD genetics: common pathways with other diseases. Gut 2011; 60:1739–53. [DOI] [PubMed] [Google Scholar]
- 3. Spalinger MR, Scharl M. The role for protein tyrosine phosphatase non‐receptor type 22 in regulating intestinal homeostasis. United Eur Gastroenterol J 2016; 4:325–32. [DOI] [PMC free article] [PubMed] [Google Scholar]
- 4. Moran CJ, Walters TD, Guo CH et al IL‐10R polymorphisms are associated with very‐early‐onset ulcerative colitis. Inflamm Bowel Dis 2013; 19:115–23. [DOI] [PMC free article] [PubMed] [Google Scholar]
- 5. Kole A, Maloy KJ. Control of intestinal inflammation by interleukin‐10. Curr Top Microbiol Immunol 2014; 380:19–38. [DOI] [PubMed] [Google Scholar]
- 6. Keubler LM, Buettner M, Häger C, Bleich A. A multihit model: colitis lessons from the interleukin‐10–deficient mouse. Inflamm Bowel Dis 2015; 21:1967–75. [DOI] [PMC free article] [PubMed] [Google Scholar]
- 7. Kiesler P, Fuss IJ, Strober W. Experimental models of inflammatory bowel diseases. Cell Mol Gastroenterol Hepatol 2015; 1:154–70. [DOI] [PMC free article] [PubMed] [Google Scholar]
- 8. Asseman C, Mauze S, Leach MW, Coffman RL, Powrie F. An essential role for interleukin 10 in the function of regulatory T cells that inhibit intestinal inflammation. J Exp Med 1999; 190:995–1004. [DOI] [PMC free article] [PubMed] [Google Scholar]
- 9. Diaz‐Gallo LM, Espino‐Paisán L, Fransen K et al Differential association of two PTPN22 coding variants with Crohn’s disease and ulcerative colitis. Inflamm Bowel Dis 2011; 17:2287–94. [DOI] [PubMed] [Google Scholar]
- 10. Zheng J, Ibrahim S, Petersen F, Yu X. Meta‐analysis reveals an association of PTPN22 C1858T with autoimmune diseases, which depends on the localization of the affected tissue. Genes Immun 2012; 13:641–52. [DOI] [PubMed] [Google Scholar]
- 11. Davidson D, Veillette A. PTP‐PEST, a scaffold protein tyrosine phosphatase, negatively regulates lymphocyte activation by targeting a unique set of substrates. EMBO J 2011; 20:3414–26. [DOI] [PMC free article] [PubMed] [Google Scholar]
- 12. Cloutier JF, Veillette A. Cooperative inhibition of T‐cell antigen receptor signaling by a complex between a kinase and a phosphatase. J Exp Med 1999; 189:111–21. [DOI] [PMC free article] [PubMed] [Google Scholar]
- 13. Cloutier JF, Veillette A. Association of inhibitory tyrosine protein kinase p50csk with protein tyrosine phosphatase PEP in T cells and other hemopoietic cells. EMBO J 1996; 15:4909–18. [PMC free article] [PubMed] [Google Scholar]
- 14. Hasegawa K, Martin F, Huang G, Tumas D, Diehl L, Chan CA. PEST domain‐enriched tyrosine phosphatase (PEP) regulation of effector/memory T cells. Science 2004; 303:685–9. [DOI] [PubMed] [Google Scholar]
- 15. Brownlie RJ, Miosge LA, Vassilakos D, Svensson LM, Cope A, Zamoyska R. Lack of the phosphatase PTPN22 increases adhesion of murine regulatory T cells to improve their immunosuppressive function. Sci Signal 2012; 5:ra87. [DOI] [PMC free article] [PubMed] [Google Scholar]
- 16. Maine CJ, Hamilton‐Williams EE, Cheung J et al PTPN22 alters the development of regulatory T cells in the thymus. J Immunol 2012; 188:5267–75. [DOI] [PMC free article] [PubMed] [Google Scholar]
- 17. Brownlie RJ, Miosge LA, Vassilakos D, Svensson LM, Cope A, Zamoyska R. Lack of PTPN22 increases LFA‐1‐dependent adhesion of murine regulatory T Cells improving their regulatory function. Sci Signal 2012; 5:ra87. [DOI] [PMC free article] [PubMed] [Google Scholar]
- 18. Wang Y, Shaked I, Stanford SM et al The autoimmunity‐associated gene PTPN22 potentiates Toll‐like receptor‐driven, type 1 interferon‐dependent immunity. Immunity 2013; 39:111–22. [DOI] [PMC free article] [PubMed] [Google Scholar]
- 19. Chang HH, Miaw SC, Tseng W et al PTPN22 modulates macrophage polarization and susceptibility to dextran sulfate sodium‐induced colitis. J Immunol 2013; 191:2134–43. [DOI] [PubMed] [Google Scholar]
- 20. Spalinger MR, Kasper S, Gottier C et al NLRP3 tyrosine phosphorylation is controlled by protein tyrosine phosphatase PTPN22. J Clin Invest 2016; 126:1783–800. [DOI] [PMC free article] [PubMed] [Google Scholar]
- 21. Fousteri G, Jofra T, Debernardis I et al The protein tyrosine phosphatase PTPN22 controls forkhead box protein 3 T regulatory cell induction but is dispensable for T helper type 1 cell polarization. Clin Exp Immunol 2014; 178:178–89. [DOI] [PMC free article] [PubMed] [Google Scholar]
- 22. Wirtz S, Neufert C, Weigmann B, Neurath MF. Chemically induced mouse models of intestinal inflammation. Nat Protocols 2007; 2:541–6. [DOI] [PubMed] [Google Scholar]
- 23. Weigmann B, Tubbe I, Seidel D, Nicolaev A, Becker C, Neurath MF. Isolation and subsequent analysis of murine lamina propria mononuclear cells from colonic tissue. Nat Protoc 2007; 2:2307–11. [DOI] [PubMed] [Google Scholar]
- 24. Kennedy RJ, Hoper M, Deodhar K, Erwin PJ, Kirk SJ, Gardiner KR. Interleukin 10‐deficient colitis: new similarities to human inflammatory bowel disease. Br J Surg 2000; 87:1346–51. [DOI] [PubMed] [Google Scholar]
- 25. Keubler LM, Buettner M, Häger C, Bleich A. A multihit model: colitis lessons from the interleukin‐10–deficient mouse. Inflamm Bowel Dis 2015; 21:1967–75. [DOI] [PMC free article] [PubMed] [Google Scholar]
- 26. Chassaing B, Aitken JD, Malleshappa M, Vijay‐Kumar M. Dextran sulfate sodium (DSS)‐induced colitis in mice. Curr Protoc Immunol 2014; 104:25. [DOI] [PMC free article] [PubMed] [Google Scholar]
- 27. Fousteri G, Liossis SNC, Battaglia M. Roles of the protein tyrosine phosphatase PTPN22 in immunity and autoimmunity. Clin Immunol 2013; 149:556–65. [DOI] [PubMed] [Google Scholar]
- 28. Zheng P, Kissler S. PTPN22 silencing in the NOD model indicates the type 1 diabetes‐associated allele is not a loss‐of‐function variant. Diabetes 2013; 62:896–904. [DOI] [PMC free article] [PubMed] [Google Scholar]
- 29. Wohler J, Bullard D, Schoeb T, Barnum S. LFA‐1 is critical for regulatory T cell homeostasis and function. Mol Immunol 2009; 46:2424–8. [DOI] [PMC free article] [PubMed] [Google Scholar]
- 30. Kiesler P, Fuss IJ, Strober W. Experimental models of inflammatory bowel diseases. Cell Mol Gastroenterol Hepatol 2015; 1:154–70. [DOI] [PMC free article] [PubMed] [Google Scholar]
- 31. Nancey S, Holvöet S, Graber I et al CD8+ cytotoxic T cells induce relapsing colitis in normal mice. Gastroenterology 2006; 131:485–96. [DOI] [PubMed] [Google Scholar]
- 32. Vermeren S, Miles K, Chu JY, Salter D, Zamoyska R, Gray M. PTPN22 is a critical regulator of Fcγ receptor‐mediated neutrophil activation. J Immunol 2016; 197:4771–4779. [DOI] [PMC free article] [PubMed] [Google Scholar]
- 33. Wéra O, Lancellotti P, Oury C. The dual role of neutrophils in inflammatory bowel diseases. J Clin Med 2016; 5:118. [DOI] [PMC free article] [PubMed] [Google Scholar]
- 34. Cruickshank SM, English NR, Felsburg PJ, Carding SR. Characterization of colonic dendritic cells in normal and colitic mice. World J Gastroenterol 2005; 11:6338–47. [DOI] [PMC free article] [PubMed] [Google Scholar]
- 35. Qualls JE, Tuna H, Kaplan AM, Cohen DA. Suppression of experimental colitis in mice by CD11c+ dendritic cells. Inflamm Bowel Dis 2009; 15:236–47. [DOI] [PubMed] [Google Scholar]
- 36. Strober W, Fuss IJ. Pro‐inflammatory cytokines in the pathogenesis of IBD. Gastroenterology 2011; 140:1756–67. [DOI] [PMC free article] [PubMed] [Google Scholar]
- 37. Ogawa A, Andoh A, Araki Y, Bamba T, Fujiyama Y. Neutralization of interleukin‐17 aggravates dextran sulfate sodium‐induced colitis in mice. Clin Immunol 2004; 110:55–62. [DOI] [PubMed] [Google Scholar]
- 38. O'Connor W Jr, Kamanaka M, Booth CJ et al A protective function for interleukin 17A in T cell–mediated intestinal inflammation. Nat Immunol 2009; 10:603–9. [DOI] [PMC free article] [PubMed] [Google Scholar]
- 39. Feng T, Qin H, Wang L, Benveniste EN, Elson CO, Cong Y. Th17 cells induce colitis and promote Th1 cell responses through IL‐17 induction of innate IL‐12 and IL‐23 production. J Immunol 2011; 186:6313–8. [DOI] [PMC free article] [PubMed] [Google Scholar]
- 40. Ito R, Kita M, Shin‐Ya M et al Involvement of IL‐17A in the pathogenesis of DSS‐induced colitis in mice. Biochem Biophys Res Comm 2008; 377:12–6. [DOI] [PubMed] [Google Scholar]
- 41. Shea‐Donohue T, Thomas K, Cody MJ et al Mice deficient in the CXCR41 ligand, CXCL1 (KC/GRO‐α), exhibit increased susceptibility to dextran sodium sulfate (DSS)‐induced colitis. Innate Immun 2008; 14:117–24. [DOI] [PMC free article] [PubMed] [Google Scholar]
- 42. Zheng J, Petersen F, Yu X. The role of PTPN22 in autoimmunity: learning from mice. Autoimmun Rev 2014; 13:266–71. [DOI] [PubMed] [Google Scholar]
- 43. Zhang J, Zahir N, Jiang Q et al The autoimmune disease‐associated PTPN22 variant promotes calpain‐mediated Lyp/Pep degradation associated with lymphocyte and dendritic cell hyperresponsiveness. Nat Genet 2011; 43:902–7. [DOI] [PubMed] [Google Scholar]
- 44. Vang T, Congia M, Macis MD et al Autoimmune‐associated lymphoid tyrosine phosphatase is a gain‐of‐function variant. Nat Genet 2005; 37:1317–9. [DOI] [PubMed] [Google Scholar]
- 45. Galvani G, Fousteri G. PTPN22 and islet‐specific autoimmunity: what have the mouse models taught us? World J Diabetes 2017; 8:330–6. [DOI] [PMC free article] [PubMed] [Google Scholar]
- 46. Singh UP, Singh NP, Murphy EA et al Chemokine and cytokine levels in inflammatory bowel disease patients. Cytokine 2016; 77:44–9. [DOI] [PMC free article] [PubMed] [Google Scholar]
Associated Data
This section collects any data citations, data availability statements, or supplementary materials included in this article.
Supplementary Materials
Fig. S1. (a) Weight was measured WT (n = 16), PTPN22–/– (n = 12), IL‐10–/–,(n = 17) and PTPN22–/–IL‐ 10–/– (n = 17) mice at the steady‐state. (b‐c) Colon length and spleen weight were determined for the same group of mice (n = 6‐9/group). Each symbol represents an individual mouse. Data are pooled from >3 experiments with similar results.
Fig. S2. Representative FACS plots showing gating strategy used to characterize FOXP3+ and CD25+FOXP3+ CD4 T cells. The representative sample is from LI.
Fig. S3. (a) Representative FACS plots show frequency of FOXP3+ and CD25+FOXP3+ Treg cells in the MLN of WT, PTPN22–/–, IL‐10–/– and PTPN22–/–IL‐10–/– mice at the steady state. One representative mouse per group is shown. (b‐c) Graphs display Treg frequency in MLN (b) and LI (c) from multiple mice (n = 6‐9/group). (d) Lamina propria mononuclear cells were stained to assess IFN‐γ and IL‐17 by CD4+ T cells. Results are from multiple mice (n = 3/group). Horizontal lines show mean. Each symbol represents an individual mouse. Statistical significance was determined by Kruskal–Wallis analysis followed by Dunn’s post‐test (1‐way ANOVA test) (*P < 0.05; **P < 0.01 and ***P < 0.001).
Fig. S4. MLN and lamina propria mononuclear cells from WT, PTPN22–/–, IL‐10‐/‐, and PTPN22–/–IL‐10‐/‐ mice treated with DSS for 8 days were processed, stained, fixed and permeabilized to assess IFN‐γ and TNF by CD4+ T cells (a) Representative FACS plots display frequency of IFN‐γ‐TNF+, IFN‐γ+TNF+ and IFN‐γ+TNF‐ CD4 T cells from the LI. A representative mouse from each strain is shown. (b‐c) Graphs display frequency in MLN (b) and LI (c) from multiple mice (n = 3‐6/group). Horizontal lines show mean. Each symbol represents an individual mouse. Data are pooled from two experiments with similar results.
Fig. S5. Representative FACS plots showing gating strategy used to characterized cytokine production by CD4+ and CD8+ T cells. The representative sample is from LI.
Fig. S6. MLN and lamina propria mononuclear cells from WT, PTPN22–/–, IL‐10–/–, and PTPN22–/–IL‐10–/– mice treated with DSS for 8 days were processed, stained, fixed and permeabilized to assess IFN‐γ and TNF by CD8+ T cells (a) Representative FACS plots display frequency of IFN‐γ‐TNF+, IFN‐γ+TNF+ and IFN‐γ+TNF‐ CD8 T cells from the LI. A representative mouse from each strain is shown. (b‐c) Graphs display frequency in MLN (b) and LI (c) from multiple mice (n = 3‐6/group). Horizontal lines show mean. Each symbol represents an individual mouse. Data are pooled from two experiments with similar results.
Fig. S7. Representative FACS plots showing gating strategy used to characterized innate immune cells. The subpopulation analysed are lymphoid DCs (CD11b‐CD11c+), myeloid DCs (CD11b+CD11c+) and other myeloid cells (CD11b+CD11c‐). Following gating on CD11b+CD11c‐ we characterized neutrophils (F4/80‐LY6G+) and macrophages (F4/80+LY6G‐). Further gating on F4/80+ cells enabled the characterization of monocytes and macrophages and eosinophils. The representative sample is from LI of a PTPN22–/–IL‐10–/– mouse.
Fig. S8. Innate immune cell distribution. MLN and LI of DSS‐treated mice (WT, PTPN22–/–, IL‐10–/– and PTPN22–/–IL‐10–/–) were processed and stained to assess the composition of innate immune cells during acute experimental colitis. (a) Representative graphs display frequency of innate cells in MLN. (b) Frequency of innate cells in LI is displayed. Each symbol represents an individual mouse.
Table S1. List of the antibodies and fluorophore conjugates used, including the dye, commercial source, clone and catalog number.