

| Declaration of potential conflict of interest of authors/collaborators of the Vascular Ultrasound Statement from the Department of Cardiovascular Imaging of the Brazilian Society of Cardiology – 2019 | |||||||
|---|---|---|---|---|---|---|---|
| If the last three years the author/developer of the Statement: | |||||||
| Names Members of the Statement | Participated in clinical studies and/or experimental trials supported by pharmaceutical or equipment related to the guideline in question | Has spoken at events or activities sponsored by industry related to the guideline in question | It was (is) advisory board member or director of a pharmaceutical or equipment | Committees participated in completion of research sponsored by industry | Personal or institutional aid received from industry | Produced scientific papers in journals sponsored by industry | It shares the industry |
| Cláudia Maria Vilas Freire | No | No | No | No | No | No | No |
| José Aldo Ribeiro Teodoro | No | No | No | No | No | No | No |
| Carmen Lucia Lascasas Porto | No | No | No | No | No | No | No |
| Orlando Veloso | No | No | No | No | No | No | No |
| Ana Cláudia Gomes Pereira Petisco | No | No | No | No | No | No | No |
| Fanilda Souto Barros | No | No | No | No | No | No | No |
| Márcio Vinícius Lins Barros | No | No | No | No | No | No | No |
| Mohamed Hassan Saleh | No | No | No | No | No | No | No |
| Marcelo Luiz Campos Vieira | No | No | No | No | No | No | No |
| Simone Nascimento dos Santos | No | No | No | No | No | No | No |
| Monica Luiza de Alcantara | No | No | No | No | No | No | No |
| Salomon Israel do Amaral | No | No | No | No | No | No | No |
| Ana Cristina Lopes Albricker | No | No | No | No | No | No | No |
| Armando Luis Cantisano | No | No | No | No | No | No | No |
1. Introduction and Equipment
1.1. Introduction
The use of ultrasound (US) in Medicine started in the decade of 1940 and, since then, it has played a significant role in the diagnosis of cardiovascular diseases (CVD). It is a diverse technology that follows the physical principles of propagation of US waves in different media. Due to its broad applicability, relatively low-cost, and reproducibility, US has a secure place in diagnostic aid. Members of the Department of Cardiovascular Imaging (DCI) - experts in vascular ultrasound (VUS) - prepared this guideline to indicate the best use of this technique, according to recommendations from the current medical literature. We included the main aspects related to equipment components, software, transducers, and their evolution since the last guideline, and addressed the most relevant topics in the field of diagnosis of vascular diseases. The foundation behind using VUS to diagnose important pathologies, such as carotid atherosclerotic disease, diseases in vertebral arteries, abdominal aorta and its branches, was based on recommendations from the DCI panel of experts in 2015 and 2016.1,2
This guideline does not aim to compare VUS with other imaging examination methods or expound on the use of VUS in the follow-up of vascular diseases after the initial diagnosis. For this content, the reader should consult more extensive and specific publications on the subject.
Our goal is to disseminate the best practices in VUS to various services in the country, standardize the interpretation of examinations, and contribute to the proper use of this non-invasive, widely available, and low-cost tool.
1.2. Equipment
In a country with continental dimensions and different economic realities like Brazil, it is difficult to determine what ideal equipment is. We cannot demand from a small laboratory in the interior of the country to work with equipment that has the same technological resources needed for a laboratory that assists a large number of patients. This standardization intends to suggest the appropriate minimum resources of equipment and the ideal way to perform, with safety and accuracy, the examinations whose protocols will be described below, always remembering that this area is in constant evolution.
1.2.1. Machine
The equipment must be capable of delivering the following types of image and Doppler: (a) two-dimensional image; (b) color flow imaging (CFI); (c) pulsed wave Doppler; (d) continuous wave Doppler (for some types of transducers, but not required for vascular examinations); (e) power Doppler, also known as power angio and Doppler energy - way of mapping the flow without indicating the direction, based on the amplitude of the signal (ideal resource, but not essential to the examination).
More advanced tools, such as second-harmonic imaging, B-Flow, inversion recovery pulse sequences - for the use of microbubble contrast -, and even transducers capable of producing three-dimensional images, are useful in complex examinations, but not yet part of our daily practice. They will also be covered for information purposes as a way to encourage the technological progress that brings additional benefits to patients.
1.2.2. Applications (Software)
Among the application options, the equipment must have specific presets to each type of study to expedite and facilitate the task of the examiner.
1.2.3. Multi-frequency or Broadband Transducers
Linear transducer: ideal frequency between 5 and 10 MHz (in some cases, frequencies of 4 or 12 MHz can be useful); for studies of superficial structures, since transducers of higher frequency have better axial image resolution, but their use is limited due to the large sound damping when traveling through tissues.
Convex transducer: ideal frequency between 2 and 5 MHz; used in studies of deeper structures, such as abdominal ones, with the advantage of covering a larger area compared to sector transducers of similar frequencies.
Low-frequency sector transducer: 2 to 4 MHz; useful when the examiner needs continuous Doppler in studies of abdominal arteries.
High-frequency sector transducer: 4 to 10 MHz; useful when the acoustic window is limited by bone structures.
Micro-convex transducer: frequency between 4 and 8 MHz; adaptable to sites with limited window, such as bone structures, dressings, wounds, or other situations in which the contact surface available for the probe is reduced, without loss of lateral resolution in distal fields, as presented by sector transducers.
1.2.3.1. Image Orientation
In longitudinal images, most vascular imaging guides recommend displaying cranial structures on the left side of the screen, and caudal structures on the right. In transverse planes, structures on the left side of the screen must correspond to the marking on the upper left corner of the monitor. That way, transverse planes will display right lateral structures, as well as left medial structures on the left side of the monitor screen.3,4
2. Carotid and Vertebral Arteries
According to the World Health Organization (WHO), CVDs are the main causes of morbidity and mortality worldwide. In 2012, 17.5 million people died from CVDs, the equivalent to 31% of all deaths occurred in the period, with estimates that 7.4 million resulted from coronary artery disease (CAD) and 6.7 million from cerebrovascular accident (CVA).5
Ultrasound of carotid arteries is valuable and widely used in cardiovascular risk assessment, as it measures the intima-media thickness (IMT), detects atherosclerotic plaques, and can evaluate the morphology of plaques and degree of stenosis, characteristics associated with cerebrovascular events.
2.1. Intima-media Thickness and Detection of Carotid Artery Plaques for Cardiovascular Risk Assessment
With the publication of the Brazilian Guidelines for Dyslipidemia and Atherosclerosis Prevention in 2007 and 2013,1,6-8 the Mannheim consensus documents of 2004-2011,9 and the American Society of Echocardiography consensus,10 Brazilian experts in the VUS field joined forces to disseminate the correct way to measure IMT and detect atherosclerotic plaques in carotid arteries. In the latest update of the Brazilian guideline in 2017,8 IMT measurement was not included separately in the stratification of cardiovascular risk, but in the characterization of atherosclerotic plaque as IMT > 1.5 mm. Another aspect that shows the importance of correctly measuring IMT is its use in several research protocols. Since the American and European expert consensuses use IMT as an aggravating factor for cardiovascular risk, we decided to include the measurement technique in this guideline. This section aims to standardize the technique to measure IMT and detect carotid plaques.
2.2. Ultrasound Definition of Intima-media Thickness and Carotid Plaque
In two-dimensional images, IMT is characterized by a double line with defined intima-lumen and media-adventitia interfaces. IMT is the distance between the two acoustic interfaces. The atheromatous carotid plaque (CP) can be defined as a focal structure that spreads at least 0.5 mm into the arterial lumen, and/or measures more than 50% of the surrounding IMT value, and/or has an IMT > 1.5 mm.9 Figure 1 schematically illustrates the IMT measurement and the three ways to define CP.
Figure 1.

Schematic illustration showing examples of IMT and plaque measurements. IMT measurement (A). Different measurements of 3 carotid plaques: encroaching ≥ 0.5 mm on the arterial lumen (B); measurement > 50% of the surrounding IMT value (C); large plaque (D).
2.2.1. Indications
The European and American consensuses9,10 recommend measuring IMT in specific groups (Table 1). In these groups of individuals, IMT is considered increased when above the 75 percentile for their age, gender, and ethnicity, according to one of the normative tables, assisting in the discussion of clinical treatment and change in lifestyle. If a CP is found, regardless of the obstruction degree, IMT measurement does not need to be reported, except for exams explicitly requested for this purpose. In these cases, if the CP is located in the IMT measurement, it should be included in the value.
Table 1.
When to measure the intima-media thickness
| 1. Intermediate cardiovascular risk: use the IMT measurement as an aggravating factor for high risk reclassification10 |
| 2. Patients known to have a higher cardiovascular risk and hard clinical classification: |
| • Patients with familial hypercholesterolemia11 |
| • Patients with autoimmune diseases or who use immunosuppressants, corticosteroids, antiretroviral drugs, or other medicines that induce elevation of cholesterol12 |
| • History of early cardiovascular disease in first-degree relatives10 |
| • Individuals < 60 years with a severe abnormality in a risk factor10 |
| • Women < 60 years with at least two risk factors10 |
IMT: intima-media thickness.
2.2.2. Measurement Protocol
The recommended protocol is similar to the one described by the ELSA-Brasil study13 (Table 2).
Table 2.
Protocol to measure intima-media thickness
| • Two-dimensional fundamental imaging |
| • Do not zoom |
| • Transducer with frequency > 7 MHz |
| • Proper gain adjustment; depth between 3.0 and 4.0 cm |
| • Longitudinal plane of the common carotid and carotid bifurcation |
| • Capture images in the anterior and posterior accesses or the sternocleidomastoid muscle, with the most rectilinear image possible and with a well-defined double-line pattern, and choose the best one |
After collecting numerical IMT data, the average values will be compared with existing reference numbers, according to normative tables of the studies ELSA Brasil,13 CAPS,14 or MESA.15 The decision about which table to use will depend on the gender, age, and ethnicity of the individual.
Although the manual point-to-point measurement is less reproducible - considering the differences in ultrasound equipment used in our country -, the consensus was that it could be used if the equipment does not automatically measure IMT, strictly respecting the technical recommendations. The examiner should pay special attention when placing the cursor in the intima-lumen and media-adventitia interfaces and be very cautious not to overestimate the values. In this case, measure each side at least five times to obtain the mean value (mean IMT).16
2.2.3. Interpretation of Results
Mean IMT [mean of measurements in the right or left common carotid artery (RCCA and LCCA, respectively)]: most types of equipment provide this measurement automatically or semi-automatically (in the latter case, the examiner can make small adjustments based on the automatic one). After calculating the mean IMT values from each side, compare them to the table to find the equivalent percentile. The individual under study is classified in the highest percentile.
To determine the percentile of IMT measurement, consult tables 3 to 5, according to the age group of the individual under study.
Table 3.
ELSA Brasil:13 individuals of both genders, aged 40 to 65 years, of white, multiracial, or black ethnicity
| Mean IMT LCCA (mm) | Mean IMT RCCA (mm) | |||||||||||||||||
|---|---|---|---|---|---|---|---|---|---|---|---|---|---|---|---|---|---|---|
| Ethnicity | Percentile | 40y | 45y | 50y | 55y | 60y | 65y | Man | Ethnicity | Percentile | 40y | 45y | 50y | 55y | 60y | 65y | ||
| Man | White | P 25 | 0.47 | 0.49 | 0.52 | 0.54 | 0.57 | 0.60 | White | P 25 | 0.45 | 0.48 | 0.51 | 0.53 | 0.56 | 0.59 | ||
| P 50 | 0.53 | 0.57 | 0.60 | 0.64 | 0.67 | 0.71 | P 50 | 0.51 | 0.54 | 0.58 | 0.61 | 0.65 | 0.69 | |||||
| P 75 | 0.60 | 0.65 | 0.69 | 0.73 | 0.77 | 0.81 | P 75 | 0.59 | 0.63 | 0.67 | 0.71 | 0.75 | 0.79 | |||||
| P 90 | 0.70 | 0.75 | 0.80 | 0.85 | 0.90 | 0.95 | P 90 | 0.66 | 0.71 | 0.76 | 0.81 | 0.85 | 0.90 | |||||
| Multiracial | P 25 | 0.48 | 0.50 | 0.53 | 0.56 | 0.58 | 0.61 | Multiracial | P 25 | 0.44 | 0.47 | 0.50 | 0.53 | 0.56 | 0.60 | |||
| P 50 | 0.53 | 0.57 | 0.61 | 0.65 | 0.69 | 0.73 | P 50 | 0.50 | 0.54 | 0.58 | 0.62 | 0.66 | 0.69 | |||||
| P 75 | 0.60 | 0.65 | 0.70 | 0.75 | 0.80 | 0.85 | P 75 | 0.58 | 0.63 | 0.68 | 0.73 | 0.77 | 0.82 | |||||
| P 90 | 0.69 | 0.75 | 0.80 | 0.86 | 0.92 | 0.97 | P 90 | 0.69 | 0.74 | 0.79 | 0.84 | 0.89 | 0.94 | |||||
| Black | P 25 | 0.49 | 0.52 | 0.55 | 0.58 | 0.62 | 0.65 | Black | P 25 | 0.46 | 0.50 | 0.53 | 0.57 | 0.60 | 0.64 | |||
| P 50 | 0.56 | 0.59 | 0.63 | 0.67 | 0.71 | 0.75 | P 50 | 0.54 | 0.58 | 0.62 | 0.66 | 0.70 | 0.74 | |||||
| P 75 | 0.64 | 0.68 | 0.72 | 0.77 | 0.81 | 0.86 | P 75 | 0.61 | 0.67 | 0.73 | 0.78 | 0.84 | 0.90 | |||||
| P 90 | 0.71 | 0.78 | 0.84 | 0.91 | 0.97 | 1.03 | P 90 | 0.70 | 0.77 | 0.83 | 0.89 | 0.95 | 1.02 | |||||
| Woman | Etnia | Percentile | 40y | 45y | 50y | 55y | 60y | 65y | Woman | Etnia | Percentile | 40y | 45y | 50y | 55y | 60y | 65y | |
| White | P 25 | 0.44 | 0.47 | 0.50 | 0.53 | 0.56 | 0.59 | White | P 25 | 0.44 | 0.47 | 0.50 | 0.53 | 0.55 | 0.58 | |||
| P 50 | 0.49 | 0.52 | 0.56 | 0.59 | 0.63 | 0.66 | P 50 | 0.48 | 0.52 | 0.56 | 0.59 | 0.63 | 0.66 | |||||
| P 75 | 0.54 | 0.58 | 0.63 | 0.67 | 0.71 | 0.75 | P 75 | 0.53 | 0.58 | 0.62 | 0.66 | 0.70 | 0.75 | |||||
| P 90 | 0.61 | 0.66 | 0.71 | 0.76 | 0.81 | 0.86 | P 90 | 0.59 | 0.64 | 0.69 | 0.74 | 0.79 | 0.84 | |||||
| Multiracial | P 25 | 0.45 | 0.48 | 0.51 | 0.54 | 0.57 | 0.60 | Multiracial | P 25 | 0.44 | 0.47 | 0.50 | 0.53 | 0.56 | 0.59 | |||
| P 50 | 0.50 | 0.53 | 0.57 | 0.60 | 0.64 | 0.67 | P 50 | 0.49 | 0.52 | 0.56 | 0.60 | 0.64 | 0.68 | |||||
| P 75 | 0.56 | 0.60 | 0.64 | 0.68 | 0.72 | 0.77 | P 75 | 0.55 | 0.59 | 0.63 | 0.68 | 0.72 | 0.76 | |||||
| P 90 | 0.63 | 0.68 | 0.73 | 0.78 | 0.83 | 0.88 | P 90 | 0.62 | 0.67 | 0.72 | 0.77 | 0.82 | 0.87 | |||||
| Black | P 25 | 0.46 | 0.49 | 0.52 | 0.55 | 0.58 | 0.61 | Black | P 25 | 0.46 | 0.49 | 0.53 | 0.56 | 0.59 | 0.63 | |||
| P 50 | 0.51 | 0.55 | 0.59 | 0.63 | 0.67 | 0.70 | P 50 | 0.51 | 0.55 | 0.59 | 0.63 | 0.67 | 0.71 | |||||
| P 75 | 0.57 | 0.62 | 0.66 | 0.70 | 0.75 | 0.79 | P 75 | 0.58 | 0.62 | 0.67 | 0.71 | 0.76 | 0.80 | |||||
| P 90 | 0.64 | 0.70 | 0.76 | 0.82 | 0.88 | 0.94 | P 90 | 0.64 | 0.71 | 0.77 | 0.83 | 0.90 | 0.96 | |||||
RCCA: right common carotid artery; LCCA: left common carotid artery; IMT: intima-media thickness.
Table 5.
MESA table:15 individuals of both genders, aged 65 to 84 years, of white, black, Chinese, or Hispanic ethnicity
| Mean IMT RCCA | ||||||||||||||||
|---|---|---|---|---|---|---|---|---|---|---|---|---|---|---|---|---|
| Percentile | White man | White woman | Black man | Black woman | ||||||||||||
| Age | Age | Age | Age | |||||||||||||
| 45-54 | 55-64 | 65-74 | 75-84 | 45-54 | 55-64 | 65-74 | 75-84 | 45-54 | 55-64 | 65-74 | 75-84 | 45-54 | 55-64 | 65-74 | 75-84 | |
| %25 | 0.52 | 0.57 | 0.65 | 0.72 | 0.51 | 0.55 | 0.65 | 0.72 | 0.58 | 0.61 | 0.71 | 0.74 | 0.55 | 0.60 | 0.65 | 0.71 |
| %50 | 0.62 | 0.68 | 0.77 | 0.83 | 0.58 | 0.65 | 0.75 | 0.83 | 0.67 | 0.74 | 0.85 | 0.85 | 0.64 | 0.71 | 0.76 | 0.83 |
| %75 | 0.71 | 0.81 | 0.92 | 0.97 | 0.67 | 0.76 | 0.87 | 0.93 | 0.80 | 0.92 | 0.99 | 1,02 | 0.74 | 0.81 | 0.92 | 0.96 |
| Percentile | Chinese man | Chinese woman | Hispanic man | Hispanic woman | ||||||||||||
| Age | Age | Age | Age | |||||||||||||
| 45-54 | 55-64 | 65-74 | 75-84 | 45-54 | 55-64 | 65-74 | 75-84 | 45-54 | 55-64 | 65-74 | 75-84 | 45-54 | 55-64 | 65-74 | 75-84 | |
| %25 | 0.54 | 0.56 | 0.62 | 0.66 | 0.55 | 0.54 | 0.59 | 0.67 | 0.53 | 0.60 | 0.65 | 0.71 | 0.51 | 0.57 | 0.65 | 0.63 |
| %50 | 0.64 | 0.70 | 0.73 | 0.79 | 0.60 | 0.63 | 0.71 | 0.77 | 0.62 | 0.67 | 0.78 | 0.81 | 0.58 | 0.69 | 0.76 | 0.78 |
| %75 | 0.73 | 0.83 | 0.92 | 0.98 | 0.70 | 0.77 | 0.84 | 0.96 | 0.73 | 0.82 | 0.90 | 0.92 | 0.67 | 0.77 | 0.87 | 0.92 |
| Mean IMT LCCA | ||||||||||||||||
| Percentile | White man | White woman | Black man | Black woman | ||||||||||||
| Age | Age | Age | Age | |||||||||||||
| 45-54 | 55-64 | 65-74 | 75-84 | 45-54 | 55-64 | 65-74 | 75-84 | 45-54 | 55-64 | 65-74 | 75-84 | 45-54 | 55-64 | 65-74 | 75-84 | |
| %25 | 0.54 | 0.57 | 0.67 | 0.71 | 0.50 | 0.55 | 0.63 | 0.70 | 0.56 | 0.63 | 0.69 | 0.72 | 0.54 | 0.59 | 0.63 | 0.68 |
| %50 | 0.63 | 0.69 | 0.81 | 0.85 | 0.58 | 0.64 | 0.73 | 0.80 | 0.69 | 0.75 | 0.82 | 0.85 | 0.63 | 0.67 | 0.76 | 0.78 |
| %75 | 0.78 | 0.82 | 0.95 | 1,00 | 0.67 | 0.75 | 0.85 | 0.94 | 0.81 | 0.92 | 0.99 | 1,02 | 0.73 | 0.80 | 0.90 | 0.91 |
| Percentil | Chinese man | Chinese woman | Hispanic man | Hispanic woman | ||||||||||||
| Age | Age | Age | Age | |||||||||||||
| 45-54 | 55-64 | 65-74 | 75-84 | 45-54 | 55-64 | 65-74 | 75-84 | 45-54 | 55-64 | 65-74 | 75-84 | 45-54 | 55-64 | 65-74 | 75-84 | |
| %25 | 0.55 | 0.57 | 0.62 | 0.69 | 0.49 | 0.52 | 0.58 | 0.64 | 0.55 | 0.61 | 0.68 | 0.72 | 0.51 | 0.58 | 0.62 | 0.68 |
| %50 | 0.63 | 0.70 | 0.72 | 0.84 | 0.58 | 0.63 | 0.71 | 0.76 | 0.64 | 0.72 | 0.80 | 0.86 | 0.58 | 0.68 | 0.72 | 0.77 |
| %75 | 0.73 | 0.84 | 0.86 | 0.97 | 0.67 | 0.72 | 0.87 | 0.94 | 0.75 | 0.85 | 0.98 | 0.97 | 0.68 | 0.79 | 0.86 | 0.91 |
RCCA: right common carotid artery; LCCA: left common carotid artery; IMT: intima-media thickness.
2.2.4. How to Prepare a Report
Describe the mean IMT on each side, in mm, in the body of the report. Also, include in conclusion if the value is above or below the 75 percentile and the table used, with its bibliographic reference.
Inform the presence of carotid plaques, with their specific characteristics and quantification, according to the criteria recommended by the recent Brazilian consensus.1
2.3. Morphological Evaluation of Carotid Atherosclerotic Plaques
CP morphology plays an essential role in the incidence of cerebrovascular events and can also be an important predictor of events.17,18
Recognizing the ultrasound characteristics of the plaque can help to identify unstable ones. Describe the following properties: location, extension, echogenicity, texture, surface, presence of movable components, and anechoic areas next to the fibrotic capsule. Report these characteristics for the most important plaques, particularly those with more than 50% stenosis.
• Location: we recommend subdividing the carotids into distal and proximal common carotid, bifurcation, external branch, and proximal and medial internal branch (Figure 2).
Figure 2.

Right carotid and its anatomical subdivisions recommended by the group (adapted from the Mannheim study).9 CC: common carotid; IB: internal branch; BCA: brachiocephalic artery.
• Extension: must be measured, as it can be correlated with events and affects the choice of surgical and endovascular treatment.19
• Echogenicity: defined by comparing the plaque echogenicity to that of adjacent structures (blood, muscle, adventitia of the vessel, and bone), and classified into:20
- Hypoechoic or echolucent: darker, that is, echogenicity similar to that of blood and less echogenic than the sternocleidomastoid muscle.
- Isoechoic: echogenicity close to that of muscle.
- Hyperechoic: lighter than the adjacent muscle.
- Calcified: very echogenic, creating acoustic shadowing due to calcium deposition. Echogenicity is comparable to that of the bone.
• Echotexture: Reilly et al.21 classified the texture of the plaque as homogeneous or heterogeneous.
- Homogeneous: uniform in both low and high echo levels.
- Heterogeneous: a mixture of high, medium, and low echo levels.
• Surface: lumen surface is categorized into three classes:20,22
- Smooth: irregularities of less than 0.4 mm depth.
- Irregular: from 0.4 to 2 mm depth.
- Ulcerated: crater greater than 2.0 mm depth.
2.4. Quantification of Carotid Artery Stenosis
Several institutions published evaluation criteria for carotid stenosis, with some differences in interpretation.3,23-25 However, in 2003, a consensus document was published in the USA to make recommendations on the performance of VUS of carotid arteries. The United Kingdom followed them in 2009, and the DCI of the Brazilian Society of Cardiology (BSC) in 2015.1,3,4
2.4.1. Measurement Techniques to Quantify Stenosis
The assessment of carotid stenosis with VUS is based on measurements of flow velocity and their relationships using spectral Doppler, associated with the evaluation of two-dimensional and color Doppler imaging. With the patient in the supine position, use transverse and longitudinal ultrasound planes that allow the visualization of the right and left carotid system.
Figure 3 shows the recommendation from DCI-BSC for the sequence of evaluation of carotid stenosis.
Figure 3.

Recommendation from the Department of Cardiovascular Imaging of the Brazilian Society of Cardiology for the sequence of evaluation of carotid stenosis. PSV: peak systolic velocity.
2.4.1.1. Quantification of Carotid Stenosis with Hemodynamic Parameters
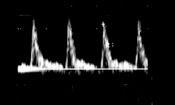
Arterial flow velocity measured by Doppler is presented as flow velocity waveforms (spectrum) for each site examined. Wave characteristics depend on the type of local flow, as well as changes in blood velocity resulting from conditions proximal and distal to the measurement site. In the internal carotid artery (ICA), the resistance of flow velocity waveforms is usually of low. In the external carotid artery (ECA), the resistance of velocity waveform is high, while in the common carotid artery (CCA), it is intermediate between ICA and ECA13(Figure 4).
Figure 4.

Normal flow patterns of carotid arteries. (A) Common carotid artery. (B) Internal carotid artery. (C) External carotid artery.
Measure the velocities in the proximal and distal segments of CCA. To evaluate the velocity ratio in the quantification of ICA stenosis, assess CCA at approximately 2 cm from the bifurcation, preferably in a rectilinear segment, without plaques.4 Analyze ICA in the proximal and middle segments, since atherosclerotic lesions usually affect the proximal 2 cm. The cursor must be parallel to the vessel wall, with a volume sample smaller than the lumen, and positioned in its center and toward the flow, so the insonation angle is ≤ 60º (Figure 5).1,26
Figure 5.

(1) Diagram illustrating the placement of the cursor and the insonation angle. (A) Parallel to the jet in case of stenosis. (B) Parallel to the vessel. (2) Cursor and insonation angle toward the flow jet in case of stenosis (arrow).
After identifying the stenosis with B-scan and/or color Doppler, document the spectral tracing in this point, and pre-stenotic and post-stenotic regions. The velocity evaluation given by the spectral tracing must include the peak systolic velocity (PSV) and end-diastolic velocity (EDV) in CCA and ICA. Systolic and diastolic velocities provide the following relationships (ratios): PSV ICA/PSV CCA, PSV ICA/EDV CCA, and EDV ICA/EDV CCA.
Subocclusions are diagnosed based on the narrowing of the vessel lumen using color/power Doppler, with thin flow (string sign or trickle flow); however, it might be associated with high, low, or undetectable velocities, which occasionally hinders the diagnosis.1
In turn, carotid occlusions can be diagnosed with ultrasound as the absence of patent lumen in grayscale and undetected flow with color/power Doppler and/or spectral Doppler, in addition to the presence of high-resistance flow in CCA and staccato flow - flow with minimal velocity and very high-resistance at the occlusion or pre-occlusion site.1
The study group from DCI-BSC suggests the use of table 6 to quantify ICA stenosis.1
Table 6.
Quantification of internal carotid artery stenosis (Department of Cardiovascular Imaging of the Brazilian Society of Cardiology)
| % Anat Dist St (Nascet) | PSV cm/s | EDV cm/s | PSV lC/ PSV CC | PSV IC / EDV CC | EDV IC / EDV CC |
|---|---|---|---|---|---|
| < 50% | < 140 | < 40 | < 2.0 | < 8 | < 2.6 |
| 50 to 59% | 140 to 230 | 40 to 69 | 2.0 to 3.1 | 8 to 10 | 2.6 to 5.5 |
| 60 to 69% | – | 70 to 100 | 3.2 to 4.0 | 11 to 13 | – |
| 70 to 79% | > 230 | > 100 | > 4.0 | 14 to 21 | – |
| 80 to 89% | – | > 140 | – | 22 to 29 | > 5.5 |
| > 90% | > 400 | – | > 5.0 | > 30 | |
| Subocclusion | Variable – thin flow | Variable – thin flow | Variable – thin flow | Variable – thin flow | Variable – thin flow |
| Occlusion | Lack of flow | Lack of flow | Not applicable | Not applicable | Not applicable |
The colors represent, from left to right, the most relevant criteria according to the literature. CC: common carotid; IC: internal carotid; EDV: end-diastolic velocity; PSV: peak systolic velocity.
2.4.1.2. Quantification of Carotid Stenosis with Anatomic Parameters
The anatomical criterion (Figure 6) is based on the assessment of lumen reduction and should be used to characterize, in particular, stenosis below 50% (without hemodynamic repercussion); however, it is also a great contributor in stenosis greater than 50%, in which the hemodynamic criterion can fail to quantify stenosis accurately (e.g., severe aortic stenosis, significant contralateral carotid stenosis, among others). Lumen reduction is preferentially measured by diameter, and the result of the carotid stenosis range should be reported in intervals of 10%. It is recommended not to measure plaques smaller than 20% to avoid possible differences in the measurement of diameter reduction when the thickened intima is included or stopped being included.1
Figure 6.

Measurement of lumen reduction. (A) Smooth atheromatous plaque in the lumen. (B) Irregular atheromatous plaque in the lumen.
2.4.2. Circumstances that Can Change the Measurement of Flow Velocities and Anatomic Evaluation
Velocity evaluation can be compromised in some situations that affect measurements of spectral analysis. They can be located in the carotid bifurcation - distal or proximal - or even, in the contralateral carotid. Among the conditions proximal to the bifurcation, we underline aortic valve diseases (stenosis or insufficiency), atherosclerotic stenosis, or arteritis with involvement of the aortic arch, branches, and common carotid1 (Table 7).
Table 7.
Circumstances that can change the measurement of flow velocities
| Pathology | Abnormalities in VUS | Assessment alternatives |
|---|---|---|
| Stenosis proximal to the common carotid artery or brachiocephalic artery | Reduced absolute flow velocities (PSV and EDV) | Using the velocity ratio and evaluation by the anatomical criterion |
| Significant stenosis or contralateral carotid occlusion | Compensatory increase in flow velocities | Using the velocity ratio and evaluation by the anatomical criterion |
| Arrhythmias (atrial fibrillation) | Variable velocity peaks | Waiting for the most regular period, or using an average of five beats and anatomical criterion |
| Aortic valve stenosis | Reduced absolute flow velocities (PSV and EDV) | Using the velocity ratio and evaluation by the anatomical criterion |
| Aortic valve insufficiency | Increase in PSV flow, with the possibility of retrograde diastolic flow | Using anatomical criterion or velocity ratio that does not involve EDV |
VUS: Vascular Ultrasound; EDV: end-diastolic velocity; PSV: peak systolic velocity.
Anatomic evaluation can be affected in circumstances such as arterial calcification with acoustic shadowing, improper adjustment of equipment, among others.
2.4.3. Report Description
Relevant information for the report:
Specify the type of transducer used.
Inform the technical quality of the examination (report situations that can lower its quality - e.g., presence of catheters).
Describe the presence of atherosclerotic plaques, their location, extension, morphological characteristics, and degree of stenosis - quantified in deciles according to the DCI-BSC recommendation.1
Report other findings of or related to carotid arteries (e.g., tortuosities, dissections, tumors, arteritis).
2.5. Ultrasound Assessment After Carotid Intervention
Treatment of symptomatic and asymptomatic carotid atherosclerotic disease has been the subject of multidisciplinary debate. Interventional treatment can be done by carotid endarterectomy or carotid stenting.
Ultrasound is the examination of choice for the follow-up after carotid intervention, and its protocol has the same sequence of the examination of carotid arteries without intervention, with some peculiarities in the intervention site. For more information about what to report on the vascular intervention site, the basic protocol of ultrasound follow-up, and velocity parameter tables, we suggest consulting the DCI recommendations recently published.1
2.6. Ultrasound Evaluation of Vertebral Arteries
The VUS evaluation of extracranial vertebral arteries contributes to the carotid study. It is divided into four segments: three extracranial and one intracranial (Figure 7).27,28
Figure 7.

Extracranial segments of the vertebral artery (V0-V3).
2.6.1. Methodology to Perform the Examination
The patient’s position is the same as that adopted for the carotid study.
To evaluate the extracranial part of vertebral arteries, start the examination by the V2 segment. At this point, with the aid of color Doppler and small angulation movements, try to identify the artery (as well as its vein) and record the spectral curves, adapting the scale and insonation angle of the vessel. Past this point, the artery is displayed toward its origin. The V3 segment of the vertebral artery lies below the mastoid process of the temporal bone (anatomic mark for the study). This region presents the vessel end of the transverse foramen and its course around the mastoid process (also called “atlas loop” due to its anatomical relationship with this vertebral body).3 The typical parameters expected are:
Diameter: ranges from 2 to 4 mm. Caliber asymmetry among vertebral arteries is common (73% of cases), and the left one has a more dilated caliber in 50% of cases.28,29 The normal standard with pulsed wave Doppler is waveforms with laminar antegrade flow of low-resistance, PSV between 20 and 60 cm/s in the V2 segment, and that can range from 30 to 100 cm/s in the origin of the vertebral artery. Due to the frequent diameter asymmetry, there is a considerable difference in PSV and resistance index (RI) among the normal vertebral arteries of an individual.27
Vertebral artery hypoplasia is defined as a vessel diameter equal to or lower than 2.0 mm (or caliber asymmetry among vertebral arteries with ratio > 1:1.7).28
2.6.2. Quantification of Stenosis
Proximal stenosis (V0-V1) diagnosis results from the increase in flow velocities at the lesion site. The DCI-BSC standardization3 suggests the values presented in table 8, adapted from the study by Hua et al.30 Evaluate stenosis in the remaining segments with VUS based on multi-parameter analysis, such as turbulent flow with color Doppler, local increase in flow velocities, increase in velocity rates, and distal flow damping, since there are no tables of quantification of stenosis for these segments.
Table 8.
Cut-off velocity values for proximal vertebral artery stenosis
| Stenosis | < 50% | 50 to 69% | 70 to 99% |
|---|---|---|---|
| Vmax | ≥ 85 cm/s | ≥ 140 cm/s | ≥ 210 cm/s |
| VVR | ≥ 1.3 | ≥ 2.1 | ≥ 4 |
| EDV | ≥ 27 cm/s | ≥ 35 cm/s | ≥ 55 cm/s |
VVR: maximum velocity rate at the stenosis site and the V2 segment; EDV: end-diastolic velocity.
3. Abdominal Aorta and Branches
3.1. Abdominal Aortic Aneurysm
3.1.1. General Considerations
Aneurysms are defined as a local dilation equal to or greater than 50% of the proximal or normal arterial diameter, necessarily involving all vessel layers. Even though the diameter of the abdominal aorta changes with age, gender, and biotype, the mean diameter of the infrarenal aorta is approximately 2.0 cm, with upper normal limit < 3.0 cm. Thus, abdominal aortic aneurysm (AAA) is defined as an aorta that measures > 3.0 cm. AAAs are located between the diaphragm and the aortic bifurcation and can be classified as suprarenal, juxtarenal, and infrarenal. Approximately 85% of AAAs are infrarenal, and 5% involve the suprarenal aorta.31 About 25% of patients with AAA have associated iliac artery aneurysm.2
Aneurysms can be fusiform, saccular, or with eccentric shapes. The type of asymmetry can significantly influence the risk of rupture and, as aneurysms grow, they can form laminated thrombi that preserve the arterial lumen.2
VUS is the most used examination to screen and diagnose asymptomatic patients in emergency units without a prior diagnosis and symptomatic ones. Computed tomography angiography (CTA) is the examination of choice for pre- and postoperative assessment; however, VUS does not lose its value for being more accessible, costing less, and not using nephrotoxic contrast. The current availability of microbubble contrast makes VUS quite attractive, particularly in postoperative assessments.32
3.1.2. Clinical Indications 2
Screening (Table 9).
Table 9.
Recommendation from the Department of Cardiovascular Imaging for screening and follow-up of abdominal aortic aneurysm
| Screening |
|---|
| • Men aged 65 to 75 years |
| • Men aged 55 to 75 years with a family history of AAA and/or who smokes |
| • Women aged 55 to 75 years with a family history of AAA and/or who smokes |
| Follow-up interval |
| • 2.6 to 2.9 cm – reevaluate in 5 years (sub-aneurysmal dilation) |
| • 3.0 to 3.9 cm – 24 months |
| • 4.0 to 4.5 cm – 12 months |
| • 4.6 to 5.0 cm – 6 months |
| • > 5.0 cm – 3 months |
| Indication for intervention |
| • ≥ 5.5 cm |
| • AAA-related symptoms |
| • Growth rate > 1.0 cm per year |
AAA: abdominal aortic aneurysm.
Follow-up: monitor the growth and determine the appropriate time for surgery.33
Evaluation of pulsating abdominal mass, signs of rupture, or growth.
Preoperative AAA examination: report data on the access route, abnormalities in iliac arteries, fixation site of the endoprosthesis, aspect and measurements of the aneurysmal sac, and presence of parietal thrombi.
Postoperative AAA examination.
3.1.3. Examination Instructions and Protocols (Table 10)
Table 10.
Examination instructions and protocols for the study of abdominal aorta and branches
| Examination instructions | Abdominal aorta | Aortoiliac segment | Mesenteric arteries and celiac trunk | Renal arteries |
|---|---|---|---|---|
| Low-frequency convex or sector transducers (2 to 5 MHz) | x | x | x | x |
| Preferentially in the morning with 6- to 8-h fasting | x | x | x | x |
| The patient should not smoke, chew gums, or consume carbonated beverages | x | x | x | x |
| Optional antiflatulent | x | x | x | x |
| Supine position with head raised at 30o | x | x | x | x |
| Lateral position | x | x | – | x |
| Transverse, coronal, and longitudinal planes | x | x | x | x |
| What to evaluate: | ||||
| B-scan: | ||||
| Dimensions | x | x | x | x |
| Anatomic changes | x | x | x | x |
| Morphology of walls and plaques | x | x | x | x |
| Presence of thrombi | x | x | – | – |
| Color Doppler: | ||||
| Aliasing | x | x | x | x |
| Lack of flow (occlusion) | x | x | x | x |
| Spectral Doppler: | ||||
| PSV | – | x | x | x |
| PSV ratio (V2/V1) | – | x | – | – |
| EDV | – | – | x | x |
| Renal aortic ratio | – | – | – | x |
EDV: end-diastolic velocity; PSV: peak systolic velocity.
3.1.4. Examination Protocol for Abdominal Aortic Aneurysm According to Recommendations from the Department of Cardiovascular Imaging 2
The examination must be conducted from the subxiphoid region to the aortic bifurcation, followed by the study of right and left common iliac arteries and their external and internal branches.
The evaluation uses B-scan, with transverse, coronal, and longitudinal planes to detect atheroma plaques and measure the diameters, especially if dilations are found. Take the anteroposterior (AP) measurement of the aneurysm during the peak systolic expansion, reporting if it was made from outer wall to outer wall (OTO) or inner wall to inner wall (ITI).
• Screening: use the B-scan during the subxiphoid part of the echocardiogram or in routine abdominal ultrasound.
• Diagnosis and follow-up: screen the aorta from the subxiphoid region to its bifurcation, followed by the study of iliac arteries and branches.
• Preoperative assessment: descriptions, necessary measurements, and relevant data are described in figure 8.
Figure 8.

Preoperative assessment of abdominal aortic aneurysm (AAA).
• Postoperative assessment: inform the surgical techniques used. They are described in detail in the DCI recommendations.2
Essential information to include in the medical report (Figure 8):
• Diagnostic examination:
- Report technical difficulties.
- Measure the largest diameter of the aorta.
- Inform the presence of tortuosities or enlargement of the aorta.
- Define the location of the aneurysm: supra-, juxta-, or infrarenal.
- Describe the anatomical shape of the aneurysm: saccular, fusiform, or other.
- Inform the presence or absence of wall thrombi, the intraluminal diameter, and signs of rupture.
• Additional information for the preoperative examination:
- Diameters:
○ Neck in the lowest renal artery plane.
○ Neck 15 mm below the origin of the lowest renal artery.
○ Maximum AAA - AP transverse plane (ITI or OTO).
○ Bifurcation plane (when present).
○ Both common iliac arteries.
○ Iliac artery bifurcation.
- Longitudinal extension of the proximal neck.
- Neck angle with aneurysm axis.
- Longitudinal extension of AAA.
3.2. Aortoiliac Atherosclerotic Disease
VUS allows the identification, localization, and anatomic extension of atherosclerotic lesions, and evaluates the aortic wall to register not only the presence of atherosclerotic lesion but of ulceration, calcification, thrombus, dissection, and dilation. When performed by trained and experienced professionals, this technique has good diagnostic accuracy for aortoiliac atherosclerotic disease, with 86% sensitivity and 97% specificity for lesions > 50% stenosis.34
3.2.1. Clinical Indications for Venous Ultrasound in Cases of Aortoiliac Atherosclerotic Disease
Symptoms of acute ischemia (distal embolism) and intermittent claudication with decreased or absent femoral pulse, gluteal claudication, erectile dysfunction, and pain at rest.
Clinical signs such as abdominal bruit and reduced ankle-brachial index.
Prior VUS showing abnormalities in the velocity curve pattern of femoral arteries.
Follow-up of grafts and endoprostheses for the treatment of aortoiliac obstruction.
Suspected diagnosis of aortic dissection.
Suspected diagnosis of arteritis.
3.2.2. Examination Protocol for Aortoiliac Atherosclerotic Disease According to DCI Recommendations (Table 10)
3.2.2.1. Diagnostic Criteria
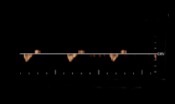
• Stenosis: measure PSV at the lesion site (V2) and 1 to 2 cm proximal to the lesion (V1) and calculate the velocity ratio (V2/V1). Determine the spectral curve with an angle ≤ 60º parallel to the turbulent flow axis (Figure 9). The degree of stenosis should be classified according to table 11.
Figure 9.

Color flow imaging showing the flow proximal to the lesion in red and the turbulent flow at the lesion site (arrow). The diagrams A and C demonstrate the velocity spectrum with Doppler. (A) Cursor proximal to the lesion to measure V1. (B) Cursor at the lesion site to measure V2. (C) Cursor distal to the lesion with damped waveform.
Table 11.
Classification of the degree of stenosis with pulsed wave Doppler
| Classification | Systolic velocity ratio |
|---|---|
| Stenosis < 50% | V2/V1 < 2.0 |
| Stenosis ≥ 50% | V2/V1 ≥ 2.0 |
| Stenosis ≥ 70% | V2/V1 ≥ 4.0 |
| Occlusion | Lack of flow |
• Occlusion: lack of flow in any aortoiliac segment, even with scan parameters that detect low-velocity flows. Presence of typical preocclusive waveform (high peripheral resistance, low peak systolic velocity, and lack of diastolic flow). Collateral vessels can be found in occluded pre- and post-segment (re-entry point). The post-occlusive spectrum is characterized by monophasic waveform, with reduced PSV and prolonged acceleration time - parvus/tardus (Figure 9). Hypoechoic image with a concave interface in colored flow and spectrum in preocclusive staccato pattern suggests thromboembolic occlusion.
• Essential information to include in the medical report:
- Diagnostic examination:
○ Report if there were technical difficulties during the examination.
○ In case of dilations, inform the largest diameter of the aorta and/or iliac arteries.
- Additional information for the preoperative examination:
• Inform the presence, aspect, and location of atherosclerotic plaques, as well as the degree of stenosis of lesions. Table 12 lists the general limitations of VUS examination.
Table 12.
General limitations of vascular ultrasound in the evaluation of abdominal aorta and branches
| Aorta and iliacs | Mesenteric arteries/Celiac trunk | Renal arteries |
|---|---|---|
| ● Hostile abdomen | ● Hostile abdomen | ● Hostile abdomen |
| ● Obesity | ● Obesity | ● Obesity |
| ● Intestinal meteorism | ● Intestinal meteorism | ● Intestinal meteorism |
| ● Examiner-dependent | ● Patient with severe abdominal pain – in acute ischemia | ● Anatomic changes |
| ● Low-quality equipment | ● Examiner-dependent | ● Examiner-dependent |
| ● Low-quality equipment | ● Low-quality equipment |
3.3. Mesenteric Arteries
3.3.1. General Considerations
Mesenteric vessels are represented by the celiac trunk (CT) and superior and inferior mesenteric arteries (SMA and IMA, respectively). Anatomically, CT starts just below the aortic hiatus of the diaphragm and originates the splenic and hepatic arteries.
SMA and IMA begin approximately 0.5 to 2 cm below CT and 4 to 5 cm above the aortic bifurcation, respectively (Figure 10).35
Figure 10.

Abdominal aorta and branches. SA: splenic artery; HA: hepatic artery; RCIA: right common iliac artery; LCIA: left common iliac artery; IMA: inferior mesenteric artery; RRA: right renal artery; LRA: left renal artery; SMA: superior mesenteric artery; CT: celiac trunk.
Mesenteric artery obstructive disease progresses chronically and asymptomatically. The clinical manifestation represented by postprandial abdominal pain (mesenteric angina) and/or progressive weight loss occurs when two or more mesenteric vessels are involved. Older men are more frequently affected. Atherosclerosis is responsible for more than 90% of diseases that strike mesenteric arteries and is usually dissemination of the atheromatous process that involves the entire aorta.36
Arteriography is the standard diagnostic method; however, VUS is the first examination indicated for the study of symptomatic chronic intestinal ischemia for being non-invasive and risk-free.37
The objective of VUS is to determine the presence, location, extension, and severity of the stenotic lesion. The study must include the SMA, CT, and IMA, with the evaluation of SMA and CT being more important.38
3.3.2. Clinical Indications
Recurrent postprandial abdominal pain (mesenteric angina).
Weight loss without a known cause.
Abdominal bruit.
The DCI recommendations describe in detail the protocols of follow-up after surgical or endovascular treatment and assessment of compression syndromes.2
3.3.3. Examination Preparation and General Protocol (Table 10)
• Specific examination protocol:39,40
- Place the transducer in the epigastric region; using the transverse plane, identify the SMA anteriorly, the aorta posteriorly, and the right renal vein between these two vessels (Figure 11A). In this same location, using the longitudinal plane of the aorta, find the CT and SMA (Figure 11B).
Figure 11.

Mesenteric vessels and abdominal aorta. (A) Transverse plane with B-scan showing the superior mesenteric artery (SMA) anteriorly and the abdominal aorta (AA) posteriorly. (B) Longitudinal plane of the abdominal aorta and emergence of the celiac trunk and SMA.
- B-scan: evaluates the presence of atherosclerotic or aneurysmal disease.
- Color flow imaging: assesses vessel patency and indicates flow turbulence, suggesting the probable stenosis site.
- Spectral analysis: used to analyze PSV and EDV. Measure these velocities in the origin of the vessel and/or in places with suspicion of stenosis. Position the insonation angle toward the blood flow.
- Velocities of mesenteric vessels are influenced by respiration; therefore, patients should hold their breath during the measurement.
• Table 13 presents the ultrasonographic criteria to assess flow in CT and SMA.2,41-43
Table 13.
Ultrasonographic criteria to assess the native celiac trunk and superior mesenteric artery
| Artery | Normal Doppler | Stenosis ≥ 50% | Stenosis ≥ 70% | Occlusion |
|---|---|---|---|---|
| CT | Low-resistance | PSV > 240 cm/s EDV > 40 cm/s | PSV > 320 cm/s EDV > 100 cm/s | Lack of flow Retrograde CHA flow |
| SMA Fasting | High-resistance | PSV > 295 cm/s EDV > 45 cm/s | PSV > 400 cm/s EDV > 70 cm/s | Lack of flow |
| SMA Postprandial | Low-resistance | PSV > 295 cm/s EDV > 45 cm/s | PSV > 400 cm/s EDV > 70 cm/s | Lack of flow |
CHA: common hepatic artery; SMA: superior mesenteric artery; CT: celiac trunk; EDV: end-diastolic velocity; PSV: peak systolic velocity.
3.3.4. Essential Information to Include in the Medical Report
Report if there were technical difficulties during the examination.
Presence or absence of atherosclerotic disease.
Lesion site.
Measurement of stenosis.
Measurement of PSV and EDV.
3.3.5. Examination Limitations
Table 12 lists the examination limitations.
3.4. Renal Arteries
3.4.1. General Considerations
Prevalence of renal artery stenosis (RAS) changes according to the population studied. RAS is the most common cause of secondary hypertension among the general population of hypertensive patients, representing approximately 1 to 6% of cases.44,45
The most frequent cause of RAS is atherosclerosis (85% to 90% of cases), which often strikes the origin of and/or the segment proximal to the renal artery and can be unilateral or bilateral. Its prevalence increases with age, diabetes, and atherosclerosis in other arterial sites. It is considered an independent predictor of adverse events such as acute myocardial infarction, CVA, and death due to cardiovascular causes.45,46
Fibromuscular dysplasia - a non-inflammatory disease - is responsible for 10% of RAS cases. Its frequency among the general population is unknown, but it is more usually reported in young women. Renal artery involvement occurs in its mid-distal segment and is often bilateral.47
With the quality improvement of imaging methods, RAS diagnosis became feasible and of great interest, aiming to identify patients who would benefit not only from drug therapy but also from renal revascularization procedures. Among the imaging examinations, VUS is the initial method of choice to investigate RAS due to its advantages, such as being non-invasive, low-cost, having no risk of radiation, and, mainly, the lack of contraindications related to the use of nephrotoxic contrast. Ultrasound evaluation of renal arteries has high specificity in competent laboratories, demonstrating that, when the vessels are correctly assessed, its results rarely differ from those obtained by arteriography.45,48-50
Table 14 shows the main indications to investigate RAS, according to the principal American guidelines.51,52
Table 14.
Clinical indications to investigate renal artery stenosis
| ● Onset of hypertension in patients aged ≤ 30 years |
| ● Onset of severe hypertension in patients aged ≥ 55 years |
| ● Patients with accelerated hypertension (sudden or persistent worsening of previously controlled hypertension) |
| ● Patients with resistant hypertension (treatment failure with full doses of three antihypertensive drug classes, including diuretics) |
| ● Patients with malignant hypertension (with target-organ damage: acute renal failure, acute congestive heart failure, new visual or neurological disorder, and/or advanced retinopathy) |
| ● Patients with worsening of renal function after administration of angiotensin-converting enzyme inhibitor or angiotensin-receptor blocker |
| ● Patients with unexplained renal atrophy or discrepancy > 1.5 cm from kidney sizes |
| ● Patients with sudden and unexplained pulmonary edema (flash pulmonary edema) |
| ● Patients with renal failure or unexplained congestive heart failure |
| ● Patients with refractory angina |
| ● Patients with multiple vessel coronary artery disease |
| ● Patients with abdominal aortic aneurysm |
The principal objectives of the study of renal arteries are:
Identify the main renal arteries and, if possible, the accessory ones.
Locate and grade stenotic lesions resulting from atherosclerotic disease or not.
Monitor the progression of RAS.
Follow-up after renal artery revascularization.
3.4.2. Examination Protocol (Table 10)
Patient’s position: Supine, using transverse and longitudinal ultrasound planes to analyze the abdominal aorta and origin of renal arteries.
Lateral, using the coronal plane to assess all middle and distal segments of renal arteries. Use this plane to measure the longitudinal diameter of the kidney and analyze the intrarenal flow in segmental or interlobular arteries.2
B-scan: used to identify atheroma plaques in the renal artery and evaluate the echogenicity and size of the kidney.
Color flow imaging and/or power Doppler: evaluate artery patency. Power Doppler indicates possible stenosis sites through flow turbulence or reduction in the vessel lumen.
Spectral analysis: Essential to measure systolic and diastolic velocities (PSV and EDV). Use the transverse or coronal plane, keeping the cursor directed at the flow jet, with an insonation angle < 60° in the renal artery and 0° in intraparenchymatous arteries.53
Measure PSV and EDV at the origin of the renal artery or in any segment with suspicion of stenosis.
Use the longitudinal plane of the aorta, near the origin of the SMA, to measure its PSV and calculate the renal aortic ratio (RAR).
3.4.3. Diagnostic Criteria for Renal Artery Stenosis
Diagnostic criteria for RAS are classified as direct and indirect. The first consists of evaluating the renal artery from its origin in the aorta and, if possible, in all its extension. The second analyzes the hemodynamic repercussion of the proximal lesion of the renal artery on intraparenchymatous arteries.
The direct criterion comprises renal artery PSV and EDV and aortic PSV to calculate RAR (renal artery PSV/aortic PSV). The low-resistance waveform is considered normal for the renal artery. PSV is the most accurate parameter to grade RAS, with values that range between 180 and 250 m/s from study to study. EDV and RAR are used to aid the RAS evaluation. According to several studies, RAR ranges from 3.2 to 3.7 to estimate hemodynamically significant stenosis. Situations such as aortic coarctation, severe left ventricular dysfunction, aortic dissection or aneurysm, and systolic aortic velocities > 100 cm/s or < 40 cm/s can change the velocities in renal arteries and their relationships.2
Indirect criteria, represented by the measurement of the kidney size and analysis of intraparenchymatous artery flow, should be combined with direct criteria to optimize the results. A difference of 1.5 cm in kidney size can result from hemodynamically significant stenosis or even renal artery occlusion. Regarding the analysis of intraparenchymatous artery flow, initially, there is a reduction in the first systolic peak (FSP), prolonged acceleration time (AT) with decreased acceleration rate (AR), and flattening of the systolic wave until the parvus/tardus pattern is found. AT > 70 ms is associated with 60% RAS, while the parvus/tardus flow is present in more severe stenosis (80%).2
Table 15 summarizes the criteria recommended by DCI-BSC for hemodynamically significant RAS (> 60%). All references to these criteria are detailed in the guideline.2
Table 15.
Velocity criteria to quantify renal artery stenosis both native and after stenting
| Degree of stenosis | Renal artery PSV | Renal aortic ratio | Renal artery EDV | Intrarenal flow | Renal artery PSV after stenting | Renal aortic ratio after stenting |
|---|---|---|---|---|---|---|
| Normal | < 200 cm/s | < 3.5 | < 150 cm/s | AT < 70 ms | < 390 cm/s | < 5 |
| < 60% | ≥ 200 cm/s | < 3.5 | < 150 cm/s | AT < 70 ms | < 390 cm/s | < 5 |
| ≥ 60% | ≥ 200 cm/s | ≥ 3.5 | < 150 cm/s | AT < or ≥ 70ms | > 390 cm/s | ≥ 5 |
| ≥ 80% | ≥ 200 cm/s | ≥ 3.5 | ≥ 150 cm/s | AT ≥ 70 ms tardus/parvus flow | ≥ 390 cm/s | ≥ 5 |
| Occlusion | - | - | - | Might have tardus/parvus flow | - | - |
AT: acceleration time; EDV: end-diastolic velocity; PSV: peak systolic velocity.
Renal artery occlusion might be suggested if the vessel flow is not seen during color flow imaging and/or power Doppler, and not detected with pulsed wave Doppler, associated with a longitudinal diameter of the ipsilateral kidney < 8.5 cm.
Follow-up after renal revascularization is not part of the scope of this publication and can be found in the DCI guidelines.2
3.4.4. Limitations of the Renal Artery Study
Listed on table 12.
3.4.5. Essential Information to Include in the Medical Report
Report if there were technical difficulties during the examination.
Inform the presence or absence of atherosclerotic disease or signs of fibromuscular dysplasia.
Lesion site.
Measurement of stenosis.
Measurement of renal artery PSV and EDV.
Measurement of aortic PSV.
Measurement of pulsatility index (PI) and RI in intraparenchymatous arteries (preferably the segmental artery).
Measurement of kidney size.
4. Lower-Limb Arteries
VUS can evaluate peripheral arterial diseases (PADs) with high accuracy, enabling the anatomical and functional assessment of arterial lesions, in addition to identifying the location, extension, and hemodynamic repercussion of stenosis or occlusion.54,55
4.1. Clinical Indications
Anatomic diagnosis of stenosis or occlusion in the stenotic PAD in symptomatic patients considered for revascularization.56-59
Follow-up of the progression of stenotic disease previously diagnosed.
Surgical therapeutic planning for patients diagnosed with PAD.60,61
Diagnosis and follow-up of peripheral arterial aneurysms.62
Diagnosis, follow-up, and treatment of pseudoaneurysms.63,64
Evaluation of autogenous or synthetic vascular grafts, with follow-up and diagnosis of complications.65-67
Monitoring of arterial sites submitted to percutaneous intervention, such as angioplasty, thrombolysis, thrombectomy, atherectomy, and stenting.68-71
Confirmation of significant arterial abnormalities detected by another imaging method.
Evaluation of vascular and perivascular abnormalities, such as masses, aneurysms, pseudoaneurysms, dissections, thrombosis, embolism, vascular malformation, and arteriovenous fistula (AVF).
Evaluation of arterial integrity in trauma.
Evaluation of artery compression syndromes, such as popliteal artery entrapment.
4.2. Examination Protocol (Table 16)
Table 16.
Protocol for diagnostic examination and preoperative mapping
| Artery | B-scan | Pulsed Wave Doppler | Color Imaging | ||
|---|---|---|---|---|---|
| Normal | Abnormal | Normal | Abnormal | ||
| CFA | Transverse: evaluate the diameter and
aspect of the wall Longitudinal: evaluate the aspect of the wall and intraluminal diameter |
Transverse: measure the dilations
and, if possible, the intraluminal stenosis Longitudinal: measure the lesion extent |
Longitudinal: use an angle ≤ 60 degrees, laminar flow, and multiphase curve (triphase) | Longitudinal: evaluate the flow in
the stenosis, and proximal and distal to the stenosis Use the peak systolic velocity in the site of highest velocity (V2), with angle ≤ 60 degrees, and 1 to 4 cm proximal to the lesion (V1) to calculate the velocity ratio (V2/V1) Flow in the post-stenotic segment: velocity turbulence or decrease Post-stenotic velocity curve of the parvus/tardus type indicates hemodynamic repercussion |
Assess vessel patency with
intraluminal color filling Occlusion: lack of color filling Shows flow turbulence – mosaic aspect (aliasing) Guide the volume scan of the sample to detect the point of highest velocity |
| Proximal SFA | |||||
| Mid SFA | |||||
| Distal SFA | |||||
| PA | |||||
| PTA | |||||
| ATA | |||||
| FA | |||||
| TFT | |||||
FA: fibular artery; CFA: common femoral artery; DFA: deep femoral artery; SFA: superficial femoral artery; PA: popliteal artery; ATA: anterior tibial artery; PTA: posterior tibial artery; TFT: tibial-fibular trunk.
4.3. Diagnostic Criteria
Stenosis: measure PSV at the lesion site (V2) and 1 to 4 cm proximal to the lesion (V1) and calculate the velocity ratio (V2/V1). Obtain the spectral curve with an angle ≤ 60º parallel to the turbulent flow axis (Figure 9). The degree of stenosis should be classified according to table 17.60,61 Other criteria that can assist in grading stenosis are: prolonged AT in distal arteries, which could indicate hemodynamically significant lesions in proximal segments.
Table 17.
Classification of the degree of stenosis in native arteries with pulsed wave Doppler
| Classification | Systolic velocity ratio |
|---|---|
| Stenosis < 50% | V2/V1 < 2.0 |
| Stenosis ≥ 50% | V2/V1 ≥ 2.0 |
| Stenosis ≥ 70% | V2/V1 ≥ 4.0 |
| Occlusion | Lack of flow |
Occlusion: lack of flow in any lower-limb arterial segment, even with scan parameters that detect low-velocity flows. Presence of typical preocclusive waveform (high peripheral resistance, low peak systolic velocity, and lack of diastolic flow). Collateral vessels can be found in occluded pre- and post-segment (refilling point). The post-occlusive spectrum is characterized by monophasic waveform, with reduced PSV and prolonged AT (parvus/tardus pattern). Hypoechoic image with concave interface in colored flow and spectrum in standard pre-occlusive staccato suggests thromboembolism (Table 18).
Table 18.
Arterial flow patterns in various situations
| ; | Name | Clinical meaning | Occurrence situation |
|---|---|---|---|
 |
Triphasic | Found in young and normal individuals | Normal |
 |
Triphasic without the elastic component | Found in old adults with reduced vessel elasticity | ● Normal old adults ● Bad US beam alignment |
 |
Biphasic hyperemic | Without retrograde component, but reaches the baseline. Increased velocities | ● Inflammatory process ● Normal reactive vasodilation |
 |
Biphasic post-obstructive | Without retrograde component, but reaches the baseline. Low velocities | After moderate obstructions |
 |
Biphasic with retrograde pandiastolic component | Retrograde pandiastolic component. Usually with normal velocities | Vessels that provide collateral to other stenotic arteries. In most cases, vessels without proximal lesions |
 |
Biphasic "to-and-fro" | Pronounced retrograde pandiastolic component | ● Pseudoaneurysm ● Type II endoleak |
 |
Acute monophasic | Low velocity, with little increase in acceleration time | Moderate and moderate to severe post-stenosis, WITH vasodilation reserve |
 |
Damped monophasic | Low velocity, with increased acceleration time | Severe post-stenosis or post-occlusion, WITH vasodilation reserve |
 |
Extremely damped monophasic | Very low velocity, with high increase in acceleration time | Post-occlusion, WITH vasodilation reserve |
 |
Monophasic without diastole | Extremely low velocity, with increased acceleration time, without diastole flow | Post-occlusion, WITHOUT vasodilation reserve. Severe multisegmental lesions |
 |
Continuous | Extremely low velocity, with acceleration time so increased that it is not possible to differentiate PSV from EDV | Post-occlusion, WITH vasodilation reserve. Severe multisegmental lesions |
 |
Retrograde | Low velocity, can be damped or not, and can even have a retrograde component | Retrograde filling of a vessel with proximal occlusion |
EDV: end-diastolic velocity; PSV: peak systolic velocity.
Aneurysm: report the identification and location of the aneurysm. Measure the largest diameter including the adventitial layer (out-out) with two-dimensional image in transverse plane. Investigate and document the presence of intraluminal thrombus with color flow imaging.
Pseudoaneurysm: characterized by dilation that does not compromise all arterial layers and having a connecting channel with the arterial lumen. Evaluate all of these structures with two-dimensional image and color imaging, measuring the calibers. Use spectral Doppler in the connecting channel, where the typical “to-and-fro” flow can be found (Table 18). Therapeutic interventions should use color imaging and pulsed wave Doppler as a guide, evaluating blood flow in the native artery, aiding in the puncture - in cases of thrombin treatment -, and verifying the thrombosis of the pseudoaneurysm in all treatment modalities.63
Table 18 presents the different patterns of arterial flow, with their names, clinical meanings, and main occurrence situations.
4.4. Essential Information to Include in the Medical Report
Report if there were technical difficulties during the examination.
Wall aspect and diameter of all arteries studied, when necessary.
Presence, aspect, location, and degree of stenosis of atherosclerotic plaques.
Stenosis velocity and characteristics of velocity curves in the post-stenotic segment.
Signs of segmental or complete arterial occlusion.
4.5. General Limitations of the Peripheral Artery Ultrasound
Examiner-dependent.
Equipment of low technical quality.
Lower-limb edema.
Unhealed ulcer.
5. Arteriovenous Fistulas for Hemodialysis
5.1. Introduction
AVFs can be congenital, traumatic, or specifically created for hemodialysis. This guideline will cover only the technical aspects of VUS evaluation of AVF for hemodialysis (AVFH), which can be of two types:
1. Autogenous - radiocephalic or brachiocephalic (Brescia-Cimino) fistula. Figure 12 shows the latero-lateral connection between artery and vein in A; the terminal connection between the artery and lateral of the vein in B; the terminal connection between the vein and lateral of the artery in C; and the termino-terminal connection between artery and vein in D.72
Figure 12.

Types of brachiocephalic fistulas (Brescia-Cimino). (A) Latero-lateral between artery and vein. (B) Terminal artery – lateral vein. (C) Terminal vein – lateral artery. (D) Termino-terminal between artery and vein.
2. Polytetrafluorethylene (PTFE) grafts. Figure 13 shows an example of a straight PTFE graft between the basilic vein and radial artery in A; a loop PTFE graft between the basilic vein and radial artery in B; a curved PTFE graft between the artery and brachial vein in C; and a loop PTFE graft between the great saphenous vein and femoral artery in the lower limb in D.73
Figure 13.

Types of polytetrafluoroethylene (PTFE) grafts. (A) Straight PTFE graft between the basilic vein and radial artery. (B) Loop PTFE graft between the basilic vein and radial artery. (C) Curved PTFE graft between the brachial artery and vein. (D) Loop PTFE graft between the great saphenous vein and femoral artery.
The most common AVFH types are the radiocephalic and brachiocephalic;73 however, as an alternative, they can be created between other vessels, such as the ulnar artery and basilic vein, or the brachial artery and basilic vein, but they must be superficialized.
5.2. Examination Indications
The main indications for VUS in cases of AVFH are:
Preoperative vascular mapping, with planning for the procedure, including evaluation of central vessels.74,75
Maturation assessment, especially in obese patients. Maturation occurs when AVFH can withstand repeated venous punctures with large-caliber needles. This process can fail in up to 60% of cases.74,76,77
Functional follow-up of AVFH to detect complications early.
Recommendation: perform an examination before the procedure for planning and two after to reduce its failure rate.74,78
Contraindications for the procedure: Paget-Schroetter syndrome and deep venous thrombosis (DVT).
5.3. Technique 79
High-tech equipment - with high-frequency and/or variable frequency linear probe.
Patient at rest in a room at ambient temperature, with the upper limb extended parallel to the body.
Measure the anteroposterior diameters of vessels in transverse planes.
Possible sites to measure flow volume: afferent - in the artery, 1 to 2 cm before the anastomosis; and efferent - in the vein, 1 to 2 cm after the anastomosis.
Observe the abnormalities in two-dimensional planes and analyze turbulent flows with color flow imaging
The Doppler angulation should be parallel to the blood flow (closer to 60°).79
Spectral Doppler characteristics: artery - low-resistance flow; vein - arterialized flow pattern.
5.4. Diagnostic Criteria
5.4.1. Protocol to Create Arteriovenous Fistulas for Hemodialysis
• Choose the non-dominant member, if possible.
• Follow the order: 1st option - wrist; 2nd option - elbow; 3rd option - prosthesis.
• Measure the arterial and venous diameter (a tourniquet can be used in the member to evaluate venous distensibility).80,81
- Ideal venous or arterial diameter: elbow - 4 mm; wrist - 3 mm.
- Minimum functional diameter: elbow - 2 mm; wrist - 1.8 mm.72
• Measure the depth between vessels and skin surface; the ideal for puncture is < 5 mm. 79
• Measure the distance between artery and vein to be used (Figure 14).
Figure 14.

Measurement of the distance between the brachial artery and basilic vein before the creation of alternative arteriovenous fistulas.
5.4.2. Protocol after Procedure77,79,81
• Measurements of artery, vein, and anastomosis;
- Ideal venous or arterial diameter: elbow - 4 mm; wrist - 3 mm
- Minimum functional diameter: 2 mm
• Flow volume: to obtain the effective flow volume through an AVFH, measure the diameter of the drainage vein by its inner edges (in cm), preferably with a transverse plane, to calculate its radius (R) and, consequently, its area (in cm²). Take this measurement farther from the anastomosis site of the fistula, where the color flow imaging shows no flow turbulence, usually 2 to 5 cm from the anastomosis. Find the flow in the same place of the vein where the diameter was assessed with pulsed wave Doppler. Locate the sample volume in the center of the vessel and correct the Doppler flow angle to up to 60°. Determine the mean flow velocity (VMEAN) in cm/s with pulsed wave Doppler. Calculate the mean of 3 to 5 cardiac cycles. Apply the following formula:
The values below are used for normal flow volume of homologous and heterologous AVFH:
Brescia-Cimino fistula (radiocephalic) = 614 ± 242 ml/min.
PTFE = 464 ± 199 ml/min.
Mean normal value = 514 ml/min.
Fistulas with flow volume < 450 ml/min have a high risk of thrombosis in 2 to 6 weeks.
The minimum functional flow volume for AVFH in the elbow is ≥ 200 ml/min, and in the wrist is ≥ 150 ml/min.
Hyperflow is considered when the flow volume is > 3,000 ml/min.
Maturation protocol:73,74,77 AVFH maturation consists of an increase in caliber and flow of the vessels used.
Assess vessel diameter and structure (≥ 6 mm), flow volume (≥ 600 ml/min), and the distance between the vein and skin surface ≤ 6 mm.
Wait at least 14 days; the ideal scenario is individualization with follow-up for each patient and interval superior to 30 days. If possible, wait 60 or even 90 days before the first canalization.
Table 19 summarizes the main objectives of VUS findings.
Table 19.
Objectives of arteriovenous fistulas for proper hemodialysis (95%)77
| ● Vascular diameter: > 4 mm |
|---|
| ● Flow volume: > 500 ml/min |
| ● Maturation time: > 30 days |
| ● Diameters < 3mm and flow volume < 400 ml/min = high probability of failure |
| ● Vessel diameter should increase with time |
5.4.3. Causes and Types of Failures (Autogenous and Prosthetic)74,76,79,82
Arterial: diabetes mellitus and significant atheromatosis.
Venous: fibrosis.
Anastomosis site: turbulence and intimal hyperplasia.
Significant escape through tributary veins.
Steal phenomenon, in which retrograde flow is found in the radial artery distal to AVFH (Figure 15).
Figure 15.

Steal phenomenon with retrograde flow in the radial artery (in blue), in the segment distal to the anastomosis of arteriovenous fistulas for hemodialysis.
Pronounced tortuosities.
Intimal hyperplasia (valves).
Thrombosis (dissection by puncture).
Idiopathic: puncture and surgical technique.
Significant stenosis with V2/V1 ≥ 4 (if ≥ 2 indicates stenosis > 50%; angioplasty is recommended in case of clinical and/or hemodynamic abnormalities associated).
Occlusion.
Aneurysm, dilation due to prosthesis degeneration and pseudoaneurysm.
Infection.
Hematoma, seroma, and lymphocele.
5.4.4. Examination Limitations
Inexistent, with rare exceptions in highly significant edemas, fibrotic scars, and presence of orthopedic devices.
5.4.5. Suggestions to Elaborate the Report and Conclusion
1. Examination before the procedure (Table 20):
Table 20.
Mapping of arteriovenous fistulas for hemodialysis before the procedure
| Arterial diameter – mm | Venous diameter – mm | |||||||
|---|---|---|---|---|---|---|---|---|
| Axillary | Brachial | Radial | Ulnar | Brachial | Radial | Ulnar | Cephalic | Basilic |
| Proximal arm/forearm | ||||||||
| Mid arm/forearm | ||||||||
| Distal arm/forearm | ||||||||
| Elbow/wrist | ||||||||
| Skin-vessel depth | ||||||||
| Distance A-V | ||||||||
Report deep and superficial venous thrombosis; abnormalities in the arterial system; and anomalous anatomic changes, such as the number of vessels, paths, and forearm vessels that continue in the arm
Inform the measurements of calibers and proper flows.
2. Examination after the procedure (Table 21):
Table 21.
Mapping of arteriovenous fistulas for hemodialysis after the procedure
| Anastomosis: | Arterial diameter – mm | Venous diameter – mm | ||||||
|---|---|---|---|---|---|---|---|---|
| Axillary: | Brachial | Radial | Ulnar | Brachial | Radial | Ulnar | Cephalic | Basilic |
| Proximal arm/forearm | ||||||||
| Mid arm/forearm | ||||||||
| Distal arm/forearm | ||||||||
| Elbow/wrist | ||||||||
| Skin-vessel depth | ||||||||
Describe the type of AVFH and its location; inform if it is functional, dysfunctional, or non-functional, mentioning the cause, location, and extension of the involvement
Report the afferent and efferent volumes (ml/min).
6. Deep Venous Thrombosis
6.1. Introduction
DVT and pulmonary embolism (PE) are part of the same disease spectrum: venous thromboembolism (VTE). DVT represents approximately two-thirds of the cases and PE, one-third. Between 85% and 90% of DVT cases occur in the lower limbs.83
VTE is a severe, preventable, and high-incidence disease - the third most common CVD, after acute myocardial infarction and CVA. Therefore, VTE is a serious and potentially lethal condition that can affect both inpatients and outpatients. After the first VTE episode, the chance of recurrence is high.84,85
The venous thrombus often begins at the venous cuspid level (Figure 16) - either superficial or deep veins - and extends proximally in 13% of cases, retrogradely in 4%, and in both directions in 10%.86-88 It can be partial - when occupying part of the lumen of the vein involved - or total. Thrombus located in the superficial system indicates superficial venous thrombosis, while DVT involves the deep venous system, and can strike one or more veins.89 DVT in lower limbs is considered proximal if it affects the popliteal vein and/or proximal veins, with or without the involvement of other leg veins, and distal if it affects deep infrapatellar veins.87,90
Figure 16.

Two-dimensional image of a recent partial thrombus (acute) located in the valve sinus of the common femoral vein, shown through longitudinal (A) and transverse (B) planes. There is no complete collapse of the vein during compression (C).
The objective examination is crucial as the clinical diagnosis alone is not reliable. The consequences of diagnostic error are severe. At an early stage, it can result in death and, at a later stage, depending on the pathophysiology (obstruction, reflux, or both), it can cause chronic venous hypertension, leading to debilitating conditions, such as post-thrombotic syndrome (PTS) and, in case of pulmonary involvement, pulmonary hypertension.83,85,91 Furthermore, although effective, the unnecessary use of anticoagulant therapy results in higher costs and risk of hemorrhage.92
6.2. Post-Thrombotic Syndrome
PTS is defined as a combination of symptoms and objective findings in patients with DVT in lower or upper limbs. PTS is a debilitating disease and the most common and less known consequence of DVT.93,94 One to five years after the DVT episode, approximately 30% to 50% of patients develop PTS, with 5% to 10% of them being severe cases, even when treated correctly.94,95
PTS is a combination of venous hypertension secondary to flow obstruction or valvular incompetence and microcirculation and lymphatic abnormalities.
6.2.1. Deep Venous Thrombosis Diagnosis
As the accuracy of the clinical diagnosis of DVT is low (< 50%), few patients with suspicion of DVT effectively have the disease (12% to 31%). Therefore, the recommendation is to perform an accurate and objective examination that can confirm or rule out DVT.87,92,96 The current gold standard examination to diagnose DVT is compression VUS.92,97
Three categories of examinations are used to determine the probability of DVT:92,98
Clinical probability based on anamnesis and clinical examination
D-dimer levels
Imaging studies - the most commonly used is venous VUS, and the less used are venography, CTA, and venous magnetic resonance angiography. This guideline will cover only VUS.
6.2.2. Vascular Ultrasound
VUS is considered the current gold standard examination to diagnose acute DVT.99 The PIOPED II study showed 95.5% agreement between CTA and ultrasound in diagnosing or ruling out DVT. In addition, we must remember that VUS is useful not only in diagnosing DVT in symptomatic or asymptomatic (with a high risk of DVT) patients but also in identifying other conditions that cause signs and symptoms indistinguishable from DVT.
Knowledge about vascular anatomy and its variations is crucial since the frequency of variability in the number of veins is high, with the possibility of only one of them being involved, in addition to the different levels of confluences and paths.
To diagnose thrombosis, we adopt several criteria, listed below.
1. Venous compression: the normal vein has thin, smooth, and regular walls, and is completely collapsible with transducer compression (Figure 17).
Figure 17.

Venous compression maneuver. (A) Artery and vein without compression. (B) Normal vein with total compression. (C) Dilated and incompressible vein, with recent thrombus. (D) Incompressible vein, with old thrombus (chronic). (E) Rethrombosis.
Incompressibility is the main criterion for DVT diagnosis (Figure 16).
A few conditions might hinder this compressibility, and sometimes special maneuvers are necessary. They are:
Presence of a strong muscle group in the path to be compressed; for instance, the adductor canal requires compression in the external side of the thigh.
Neurogenic bladder needs draining through urinary catheterization.
Proximity to bone structures; for example, compression is limited in infrapatellar veins due to the size of the transducer.
2. Vein caliber: usually the vein has twice the caliber of the adjacent artery. Acute venous thrombosis presents great distension of the vessel wall, with an increase in vein caliber and loss of this relationship. Over time, with the process of recanalization, the vein caliber decreases disorderly in some segments, losing the uniformity usually observed along the vessels. In the most chronic stage, a complete vein retraction might occur, with calibers becoming smaller than those of arteries, at times, hindering their recognition during the examination.
3. Characteristics of the venous wall: parietal irregularities or diffuse parietal thickening, intraluminal trabeculations or synechia, structural valve abnormalities, loss of anatomical relationship with adjacent structures, even if tenuous, which can mean a previous DVT already recanalized.
Intraluminal echoes indicate presence of thrombus and its echogenicity can characterize or not its age.
4. Color imaging: color flow imaging is an important tool for venous thrombosis.
While color flow filling all lumen in longitudinal and transverse planes indicates normality, the lack of color or flaws in filling the vessel can point to partial or complete thrombosis, particularly in recent partial thrombi with low echogenicity.
Flow around the vessel strongly suggests acute DVT. Flow permeating the thrombus indicates recanalization and chronicity of the process.
Take precautions regarding the scale and gain of the equipment, and the proper performance of maneuvers that increase venous flow, generating a color signal.
5. Spectral analysis: the normal venous flow with spectral Doppler is spontaneous and phasic with respiration, increases with distal compression maneuvers, and ceases with Valsalva maneuvers (proximal veins) or proximal compression.85 The spontaneity of the flow might not be observed in distal veins of patients in the supine position, and distal compression maneuvers and/or mobilization of the limb to displace the blood column become necessary. Loss of phasicity, with continuous flow pattern, is an indirect sign of occlusion or proximal compression. Damped response to distal compression indicates obstruction between the compression site and the location of the sample flow.
Retrograde flow occurs when there is valve damage. Thus, valve regurgitation is a pathological sign, which can warn to the presence of previous thrombosis, and valve agenesia or venous reflux secondary to hyperflow should be ruled out.
Table 22 describes VUS characteristics that assist in the identification of stages of venous thrombosis.
Table 22.
Characteristics of different stages of deep venous thrombosis observed in vascular ultrasound
| Stage | Acute | Intermediate (subacute) | Chronic |
|---|---|---|---|
| Event time | Up to 14 days | 14 to 28 days | > 28 days |
| Vessel caliber | Dilated | Still dilated, normal, or slightly reduced | Usually reduced |
| Incompressibility | Total or partial | Total or partial | Partial or absent |
| Thrombus aspect | Hypoechoic | Isoechoic | Hyperechoic Parietal irregularities Fibrotic residues Residual thrombus: caliber > 2 mm after maximum compression in 6 months or > 3 mm in two consecutive examinations |
| Flow | Absent or partial | Flow channels permeating the thrombotic mass Can have microfistula | Multiple flow channels permeating the
thrombus Complete lumen filling Presence of collaterals Continuous flow or reduced amplitude spectrum Can have orthostatic reflux |
Valsalva and inspiration and expiration maneuvers help and add information (Table 23).
Table 23.
Venous flow variation according to the phase of the respiratory cycle
| Flow | Inspiration | Expiration |
|---|---|---|
| Lower limbs | ↓ | ↑ |
| Upper limbs | ↑ | ↓ |
| Subclavians | ↑ | ↓ |
6.3. Rethrombosis
High risk of recurrent venous thromboembolic disease persists after DVT treatment, with a cumulative incidence of these complications close to 30% in eight years of follow-up; among them, mortality reaches 30%, mainly due to malignant diseases.100,101 Relevant predictive factors for risk of recurrence are male gender, thrombus location, and D-dimer.102 Other less known risk factors are residual thrombus occupying 50% of the vessel lumen diameter after treatment and failure in normalization of compression with VUS.101
As the non-invasive diagnosis of recurrence is difficult, some ultrasound criteria can be used, such as:
Measurement of the residual thrombus mass.
Abnormalities in the thrombus extension.
Ultrasound characteristics of the thrombus - low echogenicity, slight compressibility, presence of tail, adhesion to the wall, and increase in venous diameter (≥ 2 times the contralateral vein, or compared to the diameter of the adjacent artery).100,101,103
6.4. Examination Technique
Some protocols assess only the proximal segment (femoropopliteal) or the compression VUS of two points (common femoral vein and popliteal vein). These protocols, known as point of care, facilitate the examination by emergency physicians and are proving to be an alternative in the emergency room.106 However, evaluating the entire venous system is important for a proper DVT diagnosis, better assessment in case of recurrence, and to assist in the differential diagnosis with other pathologies. This guideline recommends always performing a full examination.107,108
In lower limbs, the patient should be in a comfortable supine position with the torso and head elevated up to 30°, close to the edge of the bed, on the same side of the examiner, with a slight lateral rotation of the hip and slight knee flexion.
In upper limbs, the patient should be in the supine position, with the limb stretched alongside and slightly away from the body.
Examine the deep venous system starting with the inguinal fold, gently compressing the veins with the transducer, using transverse planes.85,104,105 The goal is to confirm the absence or presence of recent or residual thrombi, every 5 cm, throughout the venous trunk in the femoropopliteal segment by the medial thigh, the infrapatellar segment for the popliteal and trifurcation, the posteromedial leg for calf muscle veins (gastrocnemius, soleus, intergemellar), posterior tibial and fibular veins up to the ankle, as well as superficial veins (great and small saphenous veins along its entire extension).
The fibular and soleus veins can be seen in the lateral leg, using the fibula as an anatomical reference. In this case, fibular veins are more superficial in relation to the transducer and posterior tibial veins, deeper. To that end, the patient should change positions, flexing the knee and placing the foot on the bed. Do not neglect this maneuver even in hospitalized patients due to the high prevalence of DVT in segments proximal to fibular veins in this group of individuals.
Anterior tibial and foot veins are rarely studied unless there is a sign of local involvement.
Investigate iliac veins when the patient has DVT in common femoral veins, and it is not possible to identify the end of the thrombus, or when the flow detected in these veins is continuous or has low amplitude.
Alternate between transverse and longitudinal images using color imaging to evaluate flow and, when necessary, spectral Doppler.
Save all stages of the examination (videos and still images) digitally. Currently, clinical research protocols of international multicenter studies recommend recording the maneuver of compressing the vein - with and without compression - in the same picture (dual image). In case of thrombus, measure the venous diameter, in determined sites, to evaluate the residual thrombotic mass.107
Follow the same evaluation protocol for deep and superficial venous systems in upper limbs, middle and distal segments of subclavian veins, and jugular veins.
During the follow-up of patients with DVT and recanalization, they preferably should stay in the orthostatic position or, when not possible, sitting for the study of venous reflux.
Do not forget that the temperature in the room can significantly influence the performance of these examinations. Cold induces vasoconstriction and should be avoided. The ideal temperature is 22 to 25°C.
6.4.1. Transducers
In general, high-frequency (5 to 12 MHz) linear transducers are used for normal-weight and thin patients. In overweight/obese patients, the study of the adductor canal and even of leg veins in individuals with moderate/severe edema can use transducers of greater depth range, such as convex abdominal ones, whose frequency varies from 3 to 5 MHz.108
6.4.2. Information for the Report
Presence or lack of signs of deep and/or superficial venous thrombosis.
Information about the characteristics of the thrombus.
Extension of thrombosis: essential and, if possible, with approximate measurements of anatomical reference points, such as the anterior-superior iliac spine, inguinal fold, knee, malleolar or plantar region, axillary fold, elbow fold, and wrist fold.
In case of chronic thrombosis:
- Measurements of residual thrombotic masses can be included in the report and/or images, with their locations so that they can be compared later.
- Presence of orthostatic reflux.
7. Transcranial Doppler
The main purpose of the study called transcranial Doppler (TCD) is to gather hemodynamic information from intracranial trunk arteries non-invasively, using flow insonation with pulsed wave Doppler.109,110 The skull has always represented a barrier to reach the vessels since US does not penetrate the calcium in bone tissue and there are limited areas (transorbital and transtemporal windows, and foramen magnum) for examination. Also, arteries are located in deeper parts of the brain, making it difficult to obtain proper images and safely collect a sample capable of providing the spectral curves needed to interpret the hemodynamic status registered at a given moment. These unfavorable characteristics determine that a transducer capable of insonating flow in all trunk arteries of anterior and posterior circulations needs to be small and have a low frequency (2.0 MHz or less). CFI safely identifies vessels and analyzes flows.
7.1. Types of Transcranial Doppler
“Blind” TCD: only uses transducer with pulsed wave Doppler, without B-scan image (Table 24).
Table 24.
Identification of intracranial trunk arteries with "blind" transcranial Doppler114
| Artery | Depth | Flow Vm | Flow direction in relation to the transducer |
|---|---|---|---|
| Carotid siphon | 55 to 70 mm | 40 to 50 cm/s | Positive or negative |
| Ophthalmic | 40 to 60 mm | 20 cm/s | Positive |
| Distal internal carotid | 55 to 70 mm | 45 cm/s | Positive |
| Anterior cerebral | 60 to 70 mm | 60 cm/s | Negative |
| Middle cerebral | 35 to 60 mm | 70 cm/s | Positive |
| Posterior cerebral | 55 to 70 mm | 40 cm/s | Positive (P1), negative (P2) |
| Vertebral | 55 to 70 mm | 40 cm/s | Negative |
| Basilar | 70 to 120 mm | 45 cm/s | Negative |
TCD with color Doppler: transducer with image from B-scan, pulsed wave Doppler, and CFI associated.
TCD with microbubble contrast: color TCD associated with intravenous infusion of microbubble contrast.
TCD with macrobubbles: color TCD associated with peripheral intravenous infusion of saline or glucose solution mixed with ambient air and shaken (macrobubbles).
7.2. Examination Technique and Protocol
The main focus of any TCD examination must be identifying all trunk arteries safely and recording the spectral flow curve of each vessel. Therefore, the usefulness of CFI is indisputable. Currently, using devices exclusively dedicated to “blind” Doppler is warranted in the monitoring of continuous flow during surgeries and in neurointensive units.
The basic TCD protocol should include the use of all possible windows to transmit US to intracranial arteries:109a) transorbital (right and left), to insonate carotid siphons and ophthalmic arteries; b) transtemporal (right and left), to visualize distal internal carotids, anterior cerebral (A1 and A2 segments), middle cerebral (throughout M1 segments and at the beginning of M2), top basilar, and posterior cerebral arteries (throughout P1 and P2 segments); c) transforaminal, to study V4 segments of vertebral and basilar arteries (proximal and middle segments), with the possibility of insonating posterior-inferior cerebellar branches of vertebral arteries.
The patient can be in a supine position or sitting. The head should be turned according to the window used at the time. The examiner can follow any sequence and must record images of spectral flow curves of each vessel examined - with identification -, according to the international standard. Including pictures or videos done with CFI ensures safety in confirming identification and possible anatomical variants (very common) or technical difficulties during the examination.
Visualizing brain structures with B-scan determines the ability of the US in penetrating the bone wall in the window chosen and its usability for the examination. CFI will show (or not) flow in lumens of regional arteries, guiding the sample volume of pulsed wave Doppler with precision up to the lumen segment to be insonated to obtain the spectral flow curve. In addition to flow waveform morphology of each vessel, the routine of integral measurement of velocities has to be followed to ensure the collection of essential data to the hemodynamic analysis required in various pathologies with suspicion of DTC: PSV, EDV, mean velocity, RI, and PI (make sure that the equipment preset includes these calculations).
Table 25 lists the clinical indications for TCD.
Table 25.
Clinical indications for transcranial Doppler115,116
| Pathology | Objective | Observation | Findings |
|---|---|---|---|
| Brain death* | Additional examination judicially valid to confirm cerebral circulatory arrest | Standard study of anterior and posterior circulation arteries is mandatory. In case of residual blood flow, repeat after 12 hours | Spectral curve with short peak systolic (< 50 cm/s) pattern and lack of diastolic flow; or "alternating" pattern (antegrade systolic and retrograde diastolic flow) |
| Intracranial hypertension111 | Adjuvant indirect monitoring, including after decompressive craniectomy | Qualitative analysis of the curve pattern, which can vary dynamically (inversion of the diastolic component delimits the irreversible stage) | Progressive reduction of the diastolic component of the spectral flow curve according to the severity of hypertension |
| Ischemic CVA (acute phase)112,113 | Monitoring of vessel reperfusion in case of thrombolysis (up to 4.5 hours after the start of the event), which lasts approximately 40 minutes (but can take more than 1 hour) | Monitoring can be intermittent (conventional equipment) or continuous (transducer with "blind" Doppler fixed to a helmet adjustable to the patient's head) | Reappearance of gradual flow according to the degree of reperfusion (TIBI scale of spectral curve pattern) |
| Subarachnoid hemorrhage** 114 (Table 26) | Diagnosis, assessment of severity, and monitoring of vasospasm, recommending early intervention | Perform the examination at hospital admission and repeat it daily in case of vasospasm (critical period: 4 to 14 days after the event). Insonate all arteries at each examination | Increase in mean flow velocity, according to the severity. Lindegaard ratio (velocity ratio between the middle cerebral artery and ipsilateral internal carotid) differentiates true spasm from hyperemia |
| Patent foramen ovale*** 115 | Shunt study in patients with ischemic CVA (transient or permanent) | Intravenous infusion of shaken saline solution ("macrobubbles") associated with the Valsalva maneuver | HITS (gaseous emboli) recorded in spectral curves are counted and classified according to the Spencer scale |
| Sickle cell disease**** 116-118 (Table 27) | Diagnosis and grading of intraluminal stenosis to stratify the risk of ischemic CVA and define the therapeutic approach. Monitoring of therapeutic response | Mandatory in patients aged 2 to 16 years | Mean flow velocity defines the periodicity of follow-up and approach (blood exchange) |
| Migraine119 | Support for clinical diagnosis and differentiation from other headaches | It can be performed in the intercritical period or during a painful crisis (different results) | Measurement of pulsatility index and mean flow velocity in all vessels |
| Transoperative monitoring120,121 | Preoperative assessment of CVA risk (monitoring of spontaneous microemboli; study of cerebral flow reserve) and peroperative monitoring of emboli and cerebral flow reduction during neurological and cardiovascular surgeries | Continuous flow monitoring of middle cerebral arteries using two transducers with "blind" Doppler fixed to a helmet adjustable to the patient's head. Monitoring should continue in the postoperative (due to microemboli during this period) | Report of emboli rate (solid and/or gaseous) and reduction in mean flow velocity compared to the baseline value (> 15%) determine the risk of ischemic CVA in the immediate postoperative period***** |
CVA: cerebrovascular accident; HITS: high-intensity transient signals; TIBI: thrombolysis in brain ischemia (scale). Information followed by asterisks (*) have additional data, presented in the text below.
*Table 26.
Vasospasm classification
| Artery: MCA | MFV (cm/s) | Lindegaard ratio |
|---|---|---|
| Mild | 120 to 130 | 3 to 6 |
| Moderate | 130 to 200 | 3 to 6 |
| Severe | > 200 | > 6 |
| Artery: ACA | > 50% of MFV in 24h | – |
| Artery: PCA | > 110 | – |
| Artery: VA | > 80 | – |
| Artery: basilar | Soustiel ratio | |
| Mild | 80 to 95 | 2 to 2.49 |
| Moderate | > 85 | 2.5 to 2.99 |
| Severe | > 115 | > 3 |
MCA: middle cerebral artery; ACA: anterior cerebral artery; PCA: posterior cerebral artery; VA: vertebral artery. Note: Lindegaard ratio is the ratio between the highest mean flow velocity (MFV) in the middle cerebral artery (M1) and MFV in the ipsilateral extracranial internal carotid. Soustiel ratio is the ratio between vertebral MFV and basilar MFV.
****Table 27.
Recommendations of the Brazilian Guidelines for Transcranial Doppler in Children and adolescents with Sickle Cell Disease (2010)123
| Mean flow velocity | CVA risk group | Approach |
|---|---|---|
| Inadequate ultrasonic windows | Inconclusive | Use another imaging method to assess cerebrovascular events |
| Difficult execution: uncooperative patient | Inconclusive | Repeat in 3 months, with a different examiner if possible |
| < 70 cm/s | Low flow | Repeat the examination in 30 days |
| < 170 cm/s | Normal | Repeat the examination in 12 months |
| 170 to 184 cm/s | "Low conditional" | Repeat the examination in 3 months: if < 170 cm/s, repeat in 12 months |
| 184 to 199 cm/s | "High conditional" | Repeat the examination in 30 days: if < 170 cm/s, repeat TCD every 3 months; if two consecutive examinations are abnormal, consider long-term blood exchange |
| 200 to 220 cm/s | Abnormal | Repeat the examination in 30 days: if > 200 cm/s, blood exchange; if "high conditional", repeat TCD in 3 months; if "low conditional", repeat it in 6 months |
| > 220 cm/s | Abnormal | Imminent risk of CVA, consider long-term blood exchange |
CVA: cerebrovascular accident; TCD: transcranial Doppler.
*According to the Brazilian Guidelines for the Application of Transcranial Ultrasound as a Diagnostic Test for the Confirmation of Brain Death (defined by a group of experts from the Department of Neurosonology of the Brazilian Academy of Neurology in 2012), the criteria122 are:
• A single TCD is enough to confirm brain death.
• TCD should be performed only in patients with previously established clinical diagnosis, in accordance with the current Brazilian regulations; moreover, the patient needs to have stable hemodynamic conditions (with or without the use of drugs), and minimum systemic systolic blood pressure of 90 mmHg (below this value, the examination will not have diagnostic validity).
• A full standard TCD study is mandatory, with images in B-scan and color flow imaging (if available), and spectral flow curves of all intracranial trunk arteries.
• Characteristic TCD findings in cerebral circulatory arrest: spectral flow curves with low-amplitude systolic wave (velocity < 50 cm/s) or curves with an alternating flow pattern (waves with antegrade systolic component followed by retrograde diastolic component).
• Lack of flow in intracranial trunk arteries is not a criterion for brain death, except in cases in which a prior TCD was performed during the same hospitalization, with a record of flow in the arteries analyzed.
• Anterior circulation: in case of inadequate transtemporal windows, reporting criteria for “vascular collapse” in both carotid siphons becomes mandatory to diagnose brain death.
• Posterior circulation: if it is not possible to detect flow in the basilar artery, findings of “vascular collapse” in both intracranial vertebral arteries are crucial to diagnosing brain death; on the other hand, findings related to basilar “vascular collapse” in the presence of residual blood flow in at least one vertebral artery will invalidate the conclusive diagnosis of the examination as an indication of brain death in this region.
• Residual blood flow can be detected in almost 20% of patients, especially in intracranial carotid arteries and in patients who underwent craniotomy (but this finding tends to disappear in a few hours).
• The examination report must have a detailed account of the findings in each anterior and posterior circulation artery and be conclusive regarding the presence or lack of criteria for cerebral circulatory arrest that corroborate the clinical diagnosis of brain death.
***Spencer scale
The number of embolic spikes shown in the device screen is also useful information since the greater the number of macrobubbles, more significant the size of the shunt(s) through the foramen ovale (Spencer scale): grade 0 - lack of HITS; grade 1 - 1 to 10 HITS; grade 2 - 11 to 30 HITS; grade 3 - 31 to 100 HITS; grade 4 - 101 to 300; grade 5 - > 300 HITS (“curtain effect”). Above grade 2, the right-left cardiac shunt is significant. In case of countless spikes (“curtain effect”), consider the possibility of pulmonary AVF.
Examination protocol: peripheral intravenous infusion of solution with “macrobubbles” (8 ml of saline or glucose solution mixed with 2 ml of ambient air and shaken until it becomes homogeneous), followed immediately by vigorous Valsalva maneuver performed by the patient for 5 seconds and simultaneous insonation of spectral flow curves (pulsed wave Doppler) in cerebral and basilar arteries. The examination must be conducted in basal conditions (flow record with Valsalva maneuver in the right and left middle cerebral arteries and basilar arteries) and after the infusion of macrobubbles (that is, six times in total). In the event of a record with “curtain” pattern, stop the study (which will be considered positive).
*****Microembolic signals are detected in up to 70% of cases during the first hour after endarterectomy. A rate of 50 “microembolic signals”/hour occurs in up to 10% of cases and is predictive of ipsilateral focal ischemia.121
7.3. Limitations of Transcranial Color Doppler
Limitations of TCD basically result from the barrier the cranial bone represents to US. The use of contrast agents (“microbubbles”) greatly reduced the cases of inconclusive examinations due to a “lack of adequate windows.” The inexperience of the examining physician is also a crucial limiting factor; the learning curve is relatively long and requires dedication.
7.3.1. Essential Information to Include in Transcranial Doppler Reports
The basic structure of any additional examination must have:
• Patient’s identification (full name and age).
• Clinical indication (the purpose of the examination will determine the type of TCD needed).
• Technical quality of the examination (reporting possible issues that interfere in obtaining the necessary images for the study).
• Record of all ultrasound windows used, and vessels examined (justifying the cases that were impossible to study).
• Description of specific characteristics found in each technical resource used:
- Color flow imaging - lumen patency or occlusion, laminar or turbulent (“mosaic”) pattern, direction (antegrade or retrograde).
- Pulsed wave Doppler - laminar or turbulent pattern, direction (antegrade or retrograde), velocities of spectral flow curves (peak systolic, end-diastolic, and mean), and PI and resistance according to the clinical indication of the examination (e.g., sickle cell disease requires mean velocity).
- Contrast solution with “macrobubbles” - record and count of HITS in the study of patent foramen ovale and paradoxical embolism.
- Use of contrast agent with “microbubbles” (SonoVue®).
- In the intraoperative monitoring, report the occurrence and count of HITS/hour and variations in flow velocities with potential risk for ischemic CVA in the postoperative period.
Conclusion: avoid etiological diagnosis (TCD is a study of cerebral hemodynamics and findings should be correlated to the clinical indication of examination: for instance, the presence or lack of criteria for vasospasm, with grade classification and time reference to the onset of symptoms of subarachnoid hemorrhage).
Note: in cases of sickle cell disease, it is mandatory to specify, after the conclusion, the recommended date to repeat the reassessment examination (following the Brazilian Guidelines for Transcranial Doppler in Children and Adolescents with Sickle Cell Disease, 2010).123 In other pathologies, this suggestion is prohibited due to professional ethics.
8. Contrast in Vascular Ultrasound
The introduction of contrast agents in ultrasound examinations considerably expanded the clinical value of this method. B-scan ultrasound is an excellent method to demonstrate the anatomical and morphological characteristics of parenchymal tissue but does not provide any information about the viability and integrity of microcirculation. Color Doppler ultrasound (CDUS) added data about blood flow velocity but is not able to quantify the volume and show with enough sensitivity the blood flow in microcirculation,124-126 where velocity is too low to be detected without artifacts created by tissue and transducer maneuvers. Also, the spatial resolution of CDUS is limited, the representation of velocity is angle-dependent, and numerous artifacts can influence the diagnostic interpretation of images. Contrast-enhanced Doppler ultrasound substantially increased the sensitivity of CDUS and reduced some limitations.
The technical innovation was the introduction of specific image components for contrast in US equipment, allowing direct visualization of signals emitted by microbubble contrast agents, regardless of their velocities. Due to typical characteristics of microbubble signals (which are fundamentally different from those originating in tissues), “specific microbubble” images (contrast only) are created, which can show volume and perfusion of the parenchymal tissue with extremely high sensitivity and spatial resolution.124 The creation of each “specific microbubble” signal requires proper interaction between signals of the microbubble contrast agent and the insonated US beam.
8.1. Properties of Ultrasound Contrast Agents
Unlike contrasts for magnetic resonance imaging (MRI) and computed tomography, which use physical and chemical characteristics of cells to generate their effect, microbubble contrast uses the physical attributes of US, that is, the higher the density difference between media, the greater the reflection of energy emitted and larger the amplitude of US signal. Unquestionably, the gaseous medium provides the greatest difference, corresponding to a signal increase of approximately 30 decibels.
US contrast agents are microbubbles of gas inside capsules with flexible and stable phospholipid membranes and a defined size. The SonoVue®127 agent (produced by Bracco Imaging S.p.A., Milan, Italy), sold in Europe, the United States, parts of Asia, and South America, is the only product currently authorized in Brazil by the Brazilian Health Regulatory Agency (Agência Nacional de Vigilância Sanitária - Anvisa) and members of the National Regulatory Agency for Private Health Insurance and Plans (Agência Nacional de Saúde Suplementar - ANS). SonoVue® consists of encapsulated microspheres of sulfur hexafluoride gas. Microbubbles have an average diameter of 2.3 µm (a size that prevents them from crossing blood vessel walls and reaching the interstitial space). As a lipophilic gas, its solubility in blood is low, and it does not spread outside the capsule. This protein shell composed of a single layer of phospholipids acts as a surfactant, giving it stability and flexibility along its path in the blood macro- and microcirculation. Therefore, SonoVue® is considered an integral agent of the blood pool and a marker of blood circulation (property that distinguishes it from contrasts used in MRI and computed tomography, which can cross into the extracellular space).
After the microbubble bursts, the gas is almost entirely exhaled through the lungs during respiration, without undergoing liver metabolism or renal excretion.124 Thus, there is no contraindication to its use in patients with renal failure.
8.2. Technical Aspects that Influence the Acquisition of Contrast Images
Currently, most US manufacturers have exclusive software for studies with contrast, which can be included in the original configuration of the machine or purchased separately. However, even equipment without a specific image component for contrast has some parameters the operator can configure. The following concepts and adjustments of the equipment must be known to get the best result during the contrast study:
8.2.1. Mechanical Index
A unique characteristic of contrast agents for US (non-existent in those used for MRI and computed tomography) is that they are modified by the waves used to detect them. When exposed to US, microbubble behavior changes according to the US power emitted, that is, the amplitude of the acoustic wave [called mechanical index (MI) in the equipment]. In non-contrast studies, MI ranges from 1.6 to 1.9; under this acoustic power, the microbubble always oscillates vigorously and bursts, causing two unwanted effects: a sudden increase in signal intensity with an excessive blurring of the image, and a significant reduction in contrast concentration, consequently shortening the examination time. This image mode, called “image by acoustic stimulation,” does not require equipment with contrast technology (but, on the other hand, it does not use the full potential of the contrast agent, limiting it to its echo-enhancer function).
After reducing MI to ≤ 0.1, we can not only keep the integrity of microbubbles but also make them oscillate non-linearly (initial compression followed by expansion) and resonate, emitting different frequencies (known as “harmonic frequencies”) from the fundamental one emitted by the transducer. Equipment with this technology can filter signals emitted specifically by microbubbles, leading to a more lasting study that highlights microbubble over tissue signal (virtually nulled in the image, appearing as a dark background).
This type of study, also called “contrast study with low MI”, allows the examiner to evaluate the contrast wash-in continuously in the local studied, the enhancement period, and the concentration of microbubbles in the target structure [essential for situations such as the study of vessels of vessels (vasa vasorum), carotid plaques, renal capillary (perfusion) distribution, and masses].124
An undesired effect of the contrast study with low MI is the depth limitation of the pulse wave, which undergoes greater attenuation as it moves through tissues. Some ways to minimize this effect are: adopting alternative acoustic windows that allow closer proximity with the structure of interest, using broadband transducers with lower frequencies, and, as a last resort, increasing the MI and consequently destroying more bubbles in the proximal field.128
8.2.2. Image Gain
A noteworthy equipment control in the contrast study is the image gain, which amplifies the signal received during the post-processing in the equipment. High gain produces a bright image and widespread increase in background noise, obscuring the contrast signal (once the saturation level of the equipment has been reached, there will be no margin to amplify the signal caused by contrast). Therefore, during the contrast study, the equipment gain should be reduced until the image is virtually black, except for highly echogenic structures. Some manufacturers have gain adjustment controls for contrast studies that can easily be turned on and off during the examination.
When performing a manual adjustment, make sure to have the least amount of acoustic signals before contrast injection and understand if this signal results from an increase in MI (when specific structures are seen in the image) or gain (which causes a widespread rise in noise across the image).6
8.2.3. Contrast Level
A last technical aspect worth mentioning is the dose of contrast injected. High doses initially blur (saturation) the signal and attenuate (acoustic shadowing) structures in the distal field until contrast concentrations drop to a proper level. In addition, distinguishing small enhancing differences between structures is not possible, given that the upper limit of dynamic range (grayscale) of the equipment has been exceeded.128 One way of highlighting different enhancing levels caused by contrast in a structure is to adjust the dose of contrast to allow adequate opacification, without blurring or attenuation, and increase the dynamic range of the equipment. In turn, low doses will not reach the opacification level desired.
8.3. Indications for Contrast in Vascular Ultrasound
Table 28 lists the main indications for microbubble contrast agents in US studies of different vascular systems (consensus of the European Federation of Societies for Ultrasound in Medicine and Biology, published in 2011).129 The levels of evidence, based on multicenter and/or single-center studies, were classified as A (good), B (moderate), and C (recommended by expert consensus).
Table 28.
Indications for contrast agents in vascular ultrasound
| System | Application | Level of evidence | Probe |
|---|---|---|---|
| Carotids | Occlusion or subocclusion In-stent stenosis Dissection Plaque neovascularization |
B B C B |
Linear |
| Aorta | Dissection, extension of the flap to branches, false lumen patency, re-entry points, and perfusion level of branches that originate from false lumen | C | Convex abdominal or sector cardiac |
| Differentiation between an inflammatory aneurysm
and contained rupture Endoleak |
B A |
||
| Intracerebral vessels | Signal increase in unsatisfactory basal
study Perfusion in ischemic CVA |
A C |
Sector cardiac |
| Complications in vascular accesses | Arteriovenous fistulas Pseudoaneurysms, hematomas |
C C |
Linear or convex abdominal or sector cardiac |
| Kidney | Signal increase in the renal artery Renal perfusion |
C C |
Convex abdominal or sector cardiac |
| Lower limbs | Obstructive atherosclerotic disease (assessment
of collateral circulation and microcirculation) Deep venous thrombosis (signal improvement and inflammatory reaction in perithrombus) |
C C |
Linear or convex abdominal |
CVA: cerebrovascular accident.
8.4. Preparation, Application, and Dose of Microbubble Contrast
SonoVue® is a kit that includes: a vial with 25 mg of lyophilized powder in an atmosphere of sulfur hexafluoride; a syringe filled with 5 ml of sodium chloride 9 mg/ml (0.9%) solution; a transfer system. The contrast is easy to prepare at the bedside, following the manufacturer’s instructions. After transferring the content of the syringe to the vial with powder, shake it for 20 seconds to create microbubbles and transform the saline solution into a milky suspension (indicating homogeneous microbubble distribution). In this state, the suspension can be stored for up to 6 hours. If microbubbles accumulate on the surface during rest, shake the solution again, so the microbubbles regain homogeneous distribution before use.
The usual route of administration is by intravenous bolus injection in a vessel with caliber suitable for puncture with a needle of 20G in diameter (preferably in the antecubital fossa). Administer a small initial volume, followed by a flush of 5 ml of saline solution at 0.9% to push the contrast agent into the central vein (which happens in seconds).
In most publications, the recommended dose for a single injection in VUS studies is 2.4 ml, ranging from 1 to 4.8 ml, according to the organ studied, the probe used, and the sensitivity of the equipment available (always remembering that probes with higher frequencies need higher doses, in this case, 4.8 ml).7 The first 10 to 40 seconds after bolus injection correspond to the contrast enhancement curve (wash-in and wash-out) and should be continuously recorded for later analysis. In some specific situations, such as the study of late endoleaks, the period of evaluation can reach 5 minutes; in these cases, shorter videos can be recorded. Bear in mind that the higher the MI, the greater the destruction of bubbles, and shorter the duration of contrast. After the bubbles burst, the lungs quickly (2 minutes) and fully eliminate the sulfur hexafluoride (Anvisa).
SonoVue® is a safe agent, with a low complication rate. Reports of anaphylactic reaction correspond to < 0.002% of cases.
8.5. Basic Protocol for Vascular Ultrasound with Microbubble Contrast
After defining the indication for microbubble contrast in VUS examination, follow the mandatory basic routine:
• Repeat and record the standard CDUS examination of the organ of interest
• Secure venous access for injection of contrast solution with microbubbles (peripheral vein puncture or deep vein already in use)
• Prepare the contrast solution with microbubbles (SonoVue®) following the manufacturer’s instructions
• Activate the specific image component for contrast in US equipment; if there is no specific software, adjust MI (< 0.6 and the closest possible to 0.1), image gain (darken the background), and choose the appropriate windows to reduce the depth of the target-organ under study
• Administer the contrast solution, make adjustments to reduce excessive enhancement, and record digital images (videos) for 10 to 40 seconds after the initial bolus injection; in specific longer examinations, record the necessary videos during the procedure (which can reach 5 to 8 minutes) for later analysis.
Note: analysis of examination with microbubble contrast is fundamentally dynamic and the duration of the study is short due to the fast destruction of microbubbles by US waves, even when using very low MI. Thus, recording it in digital media is essential for later processing and careful review of images, ensuring a safe diagnosis and permanent storage of results.
8.6. Limitations of the Use of Contrast in Vascular Ultrasound
• Inexperience of the examiner (proper training in ultrasound with contrast is crucial for an effective and safe diagnosis).
• Equipment without a specific software for image with contrast makes it difficult (but not impossible) to conduct a conclusive examination.
• Access to microbubble contrast in units of the Brazilian public health system.
• Complete lack of “window” that allows US transmission to the organ of interest (rare).
• Hypersensitivity to microbubble contrast (rare).
Table 4.
CAPS table:14 individuals of both genders, aged 25 to 45 years. There is no ethnic classification
| Man | Percentile | Age | Woman | Percentile | Age | |||||||||||||
| 25 | 35 | 45 | 55 | 65 | 75 | 85 | 25 | 35 | 45 | 55 | 65 | 75 | 85 | |||||
| %25 | 0.515 | 0.585 | 0.634 | 0.68 | 0.745 | 0.814 | 0.83 | %25 | 0.524 | 0.575 | 0.619 | 0.665 | 0.718 | 0.771 | 0.807 | |||
| %50 | 0.567 | 0.633 | 0.686 | 0.746 | 0.83 | 0.914 | 0.937 | %50 | 0.567 | 0.615 | 0.665 | 0.719 | 0.778 | 0.837 | 0.880 | |||
| %75 | 0.633 | 0.682 | 0.756 | 0.837 | 0.921 | 1.028 | 1.208 | %75 | 0.612 | 0.66 | 0.713 | 0.776 | 0.852 | 0.921 | 0.935 | |||
Acknowledgments
To the authors and the US Doppler Escola de Ensino Presencial e a Distância for the images. To Rodrigo Tonan for the medical ilustrations.
Footnotes
Development: Department of Cardiovascular Imaging (Departamento de Imagem Cardiovascular - DIC) of the Brazilian Society of Cardiology (Sociedade Brasileira de Cardiologia - SBC)
Norms and Guidelines Council: Fernando Bacal, Leandro Ioschpe Zimerman, Paulo Ricardo Avancini Caramori and Pedro A. Lemos
Norms and Guidelines Coordinator: Ludhmila Abrahão Hajjar
President of the Department of Cardiovascular Imaging: Marcelo Luiz Campos Vieira
Coordinators: Simone Nascimento dos Santos, Monica Luiza de Alcantara, Cláudia Maria Vilas Freire
This statement shall be referred to as:
Santos SN, Alcantara ML, Freire CMV, Cantisano AL, Teodoro JAR, Carmen CLL, et al. Vascular Ultrasound Statement from the Department of Cardiovascular Imaging of the Brazilian Society of Cardiology - 2019 Arq Bras Cardiol. 2019; 112(6):809-849.
Note: These Guidelines are for information purposes and are not to replace the clinical judgment of a physician, who must ultimately determine the appropriate treatment for each patient.
References
- 1.Freire CM, Alcântara ML, Santos SN, Amaral SI, Veloso O, Porto CLL, et al. Recomendações para quantificação pelo US da doença aterosclerótica das artérias carótidas e vertebrais: grupo de trabalho do departamento de imagem cardiovascular da Sociedade Brasileira de Cardiologia - DIC - SBC. Arq Bras Cardiol: Imagem cardiovasc. 2015;28(número especial):e1–64. [Google Scholar]
- 2.Alcântara ML, Santos SN, Freire CM, Amaral SI, Veloso O, Porto CL, et al. Recomendações para avaliação ultrassonográfica da aorta abdominal e ramos: grupo de trabalho do departamento de imagem cardiovascular da Sociedade Brasileira de Cardiologia - DIC - SBC. Arq Bras Cardiol: Imagem cardiovasc. 2016;29(nº especial):e1–68. [Google Scholar]
- 3.Grant EG, Benson CB, Moneta GL, Alexandrov AV, Baker JD, Bluth EI, et al. Carotid artery stenosis: gray-scale and Doppler US diagnosis--Society of Radiologists in Ultrasound Consensus Conference. Radiology. 2003;229(2):340–346. doi: 10.1148/radiol.2292030516. [DOI] [PubMed] [Google Scholar]
- 4.Oates CP, Naylor AR, Hartshorne T, Charles SM, Fail T, Humphries K, et al. Joint recommendations for reporting carotid ultrasound investigations in the United Kingdom. Eur J Vasc Endovasc Surg. 2009;37(3):251–261. doi: 10.1016/j.ejvs.2008.10.015. [DOI] [PubMed] [Google Scholar]
- 5.World Health Organization Noncommunicable diseases. [2018 Jun 1]. Available in: http://www.who.int/mediacentre/factsheets/fs355/en.
- 6.Sposito AC, Caramelli B, Fonseca FA, Bertolami MC, Afiune Neto A, Souza AD, et al. Sociedade Brasileira de Cardiologia IV Brazilian Guideline for Dyslipidemia and Atherosclerosis prevention: Department of Atherosclerosis of Brazilian Society of Cardiology. Arq Bras Cardiol. 2007;88(Suppl 1):2–19. doi: 10.1590/s0066-782x2007000700002. [DOI] [PubMed] [Google Scholar]
- 7.Xavier HT, Izar MC, Faria Neto Jr, Assad MH, Rocha VZ, Sposito AC, et al. Sociedade Brasileira de Cradiologia V Brazilian Guidelines on Dyslipidemias and Prevention of Atherosclerosis. Arq Bras Cardiol. 2013;101(4 Suppl 1):1–20. doi: 10.5935/abc.2013S010. [DOI] [PubMed] [Google Scholar]
- 8.Faludi AA, Izar MC, Saraiva JF, Chacra AP, Bianco HT, Afiune AN, et al. Sociedade Brasileira de Cardiologia: Atualização da Diretriz Brasileira de Dislipidemias e Prevenção da Aterosclerose - 2017. Arq Bras Cardiol. 2017;109(2 Suppl 1):1–76. doi: 10.5935/abc.20170121. [DOI] [PubMed] [Google Scholar]
- 9.Touboul PJ, Hennerici MG, Meairs S, Adams H, Amarenco P, Bornstein N, et al. Mannheim carotid intima-media thickness and plaque consensus (2004-2006-2011): An update on behalf of the advisory board of the 3rd, 4th and 5th watching the risk symposia, at the 13th, 15th and 20th European Stroke Conferences, Mannheim, Germany, 2004, Brussels, Belgium, 2006, and Hamburg, Germany, 2011. Cerebrovasc Dis. 2012;34(4):290–296. doi: 10.1159/000343145. [DOI] [PMC free article] [PubMed] [Google Scholar]
- 10.Stein JH, Korcarz CE, Hurst RT, Lonn E, Kendall CB, Mohler ER, et al. American Society of Echocardiography Carotid Intima-Media Thickness Task Force. Use of carotid ultrasound to identify subclinical vascular disease and evaluate cardiovascular disease risk: a consensus statement from the American Society of Echocardiography Carotid Intima-Media Thickness Task Force. Endorsed by the Society for Vascular Medicine. J Am Soc Echocardiogr. 2008;21(2):93–111. doi: 10.1016/j.echo.2007.11.011. quiz 89-90. [DOI] [PubMed] [Google Scholar]
- 11.Santos RD, Gagliardi AC, Xavier HT, Casella Filho A, Araujo DB, Cesena FY, et al. Sociedade Brasileira de Cardiologia First Brazilian guidelines for familial hypercholesterolemia. Arq Bras Cardiol. 2012;99(2 Suppl 2):1–28. doi: 10.5935/abc.20120202. [DOI] [PubMed] [Google Scholar]
- 12.Simao AF, Precoma DB, Andrade JP, Correa FH, Saraiva JF, Oliveira GM, et al. Sociedade Brasileira de Cardiologia I Brazilian Guidelines for cardiovascular prevention. Arq Bras Cardiol. 2013;101(6 Suppl 2):1–63. doi: 10.5935/abc.2013S012. [DOI] [PubMed] [Google Scholar]
- 13.Santos IS, Bittencourt MS, Oliveira IR, Souza AG, Meireles DP, Rundek T, et al. Carotid intima-media thickness value distributions in The Brazilian Longitudinal Study of Adult Health (ELSA-Brasil) Atherosclerosis. 2014;237(1):227–235. doi: 10.1016/j.atherosclerosis.2014.09.004. [DOI] [PubMed] [Google Scholar]
- 14.Lorenz MW, von Kegler S, Steinmetz H, Markus HS, Sitzer M. Carotid intima-media thickening indicates a higher vascular risk across a wide age range: prospective data from the Carotid Atherosclerosis Progression Study (CAPS) Stroke. 2006;37(1):87–92. doi: 10.1161/01.STR.0000196964.24024.ea. [DOI] [PubMed] [Google Scholar]
- 15.Folsom AR, Kronmal RA, Detrano RC, O'Leary DH, Bild DE, Bluemke DA, et al. Coronary artery calcification compared with carotid intima-media thickness in the prediction of cardiovascular disease incidence: the Multi-Ethnic Study of Atherosclerosis (MESA) Arch Int Med. 2008;168(12):1333–1339. doi: 10.1001/archinte.168.12.1333. [DOI] [PMC free article] [PubMed] [Google Scholar]
- 16.Freire CM, Ribeiro AL, Barbosa FB, Nogueira AI, de Almeida MC, Barbosa MM, et al. Comparison between automated and manual measurements of carotid intima-media thickness in clinical practice. Vasc Health Risk Manag. 2009 Sep;5:811–817. [PMC free article] [PubMed] [Google Scholar]
- 17.Davies MJ, Richardson PD, Woolf N, Katz DR, Mann J. Risk of thrombosis in human atherosclerotic plaques: role of extracellular lipid, macrophage, and smooth muscle cell content. Br Heart J. 1993;69(5):377–381. doi: 10.1136/hrt.69.5.377. [DOI] [PMC free article] [PubMed] [Google Scholar]
- 18.Widder B, Paulat K, Hackspacher J, Hamann H, Hutschenreiter S, Kreutzer C, et al. Morphological characterization of carotid artery stenoses by ultrasound duplex scanning. Ultrasound Med Biol. 1990;16(4):349–354. doi: 10.1016/0301-5629(90)90064-j. [DOI] [PubMed] [Google Scholar]
- 19.Wain RA, Lyon RT, Veith FJ, Berdejo GL, Yuan JG, Suggs WD, et al. Accuracy of duplex ultrasound in evaluating carotid artery anatomy before endarterectomy. J Vasc Surg. 1998;27(2):235–242. doi: 10.1016/s0741-5214(98)70354-4. [DOI] [PubMed] [Google Scholar]
- 20.de Bray JM, Baud JM, Dauzat M. Consensus concerning the morphology and the risk of carotid plaques. Cerebrovasc Dis. 1997;7:289–296. [Google Scholar]
- 21.Reilly LM, Lusby RJ, Hughes L, Ferrell LD, Stoney RJ, Ehrenfeld WK. Carotid plaque histology using real-time ultrasonography: Clinical and therapeutic implications. Am J Surg. 1983;146(2):188–193. doi: 10.1016/0002-9610(83)90370-7. [DOI] [PubMed] [Google Scholar]
- 22.Muraki M, Mikami T, Yoshimoto T, Fujimoto S, Tokuda K, Kaneko S, et al. New criteria for the sonographic diagnosis of a plaque ulcer in the extracranial carotid artery. AJR Am J Roentgenol. 2012;198(5):1161–1166. doi: 10.2214/AJR.11.7018. [DOI] [PubMed] [Google Scholar]
- 23.Huston J, James EM, Brown RD Jr, Lefsrud RD, Ilstrup DM, Robertson EF, et al. Redefined duplex ultrasonographic criteria for diagnosis of carotid artery stenosis. Mayo Clinic Proceedings. 2000;75(11):1133–1140. doi: 10.4065/75.11.1133. [DOI] [PubMed] [Google Scholar]
- 24.Strandness DE Jr. Duplex scanning in vascular disorders. 3rd ed. Philadelphia: Lippincott Williams & Wilkins; 2002. [Google Scholar]
- 25.AbuRahma AF, Robinson PA, Strickler DL, Alberts S, Young L. Proposed new duplex classification for threshold stenoses used in various symptomatic and asymptomatic carotid endarterectomy trials. Ann Vasc Surg. 1998;12(4):349–358. doi: 10.1007/s100169900166. [DOI] [PubMed] [Google Scholar]
- 26.von Reutern GM, Goertler MW, Bornstein NM, Del Sette M, Evans DH, Hetzel A, et al. Grading carotid stenosis using ultrasonic methods. Stroke. 2012;43(3):916–921. doi: 10.1161/STROKEAHA.111.636084. [DOI] [PubMed] [Google Scholar]
- 27.Buckenham TM, Wright IA. Ultrasound of the extracranial vertebral artery. Br J Radiol. 2004;77(913):15–20. doi: 10.1259/bjr/70447093. [DOI] [PubMed] [Google Scholar]
- 28.Vicenzini E, Ricciardi MC, Sirimarco G, Di Piero V, Lenzi GL. Extracranial and intracranial sonographic findings in vertebral artery diseases. J Ultrasound Med. 2010;29(12):1811–1823. doi: 10.7863/jum.2010.29.12.1811. [DOI] [PubMed] [Google Scholar]
- 29.Cloud GC, Markus HS. Diagnosis and management of vertebral artery stenosis. QJM. 2003;96(1):27–54. doi: 10.1093/qjmed/hcg003. [DOI] [PubMed] [Google Scholar]
- 30.Hua Y, Meng XF, Jia LY, Ling C, Miao ZR, Ling F, et al. Color Doppler imaging evaluation of proximal vertebral artery stenosis. AJR Am J Roentgenol. 2009;193(5):1434–1438. doi: 10.2214/AJR.09.2624. [DOI] [PubMed] [Google Scholar]
- 31.Kent KC. Clinical practice: Abdominal aortic aneurysms. N Engl J Med. 2014;371(22):2101–2108. doi: 10.1056/NEJMcp1401430. [DOI] [PubMed] [Google Scholar]
- 32.LaRoy LL, Cormier PJ, Matalon TA, Patel SK, Turner DA, Silver B. Imaging of abdominal aortic aneurysms. AJR Am J Roentgenol. 1989;152(4):785–792. doi: 10.2214/ajr.152.4.785. [DOI] [PubMed] [Google Scholar]
- 33.Wild JB, Stather PW, Biancari F, Choke EC, Earnshaw JJ, Grant SW, et al. A multicentre observational study of the outcomes of screening detected sub-aneurysmal aortic dilatation. Eur J Vasc Endovasc Surg. 2013;45(2):128–134. doi: 10.1016/j.ejvs.2012.11.024. [DOI] [PubMed] [Google Scholar]
- 34.Koelemay MJ, den Hartog D, Prins MH, Kromhout JG, Legemate DA, Jacobs MJ. Diagnosis of arterial disease of the lower extremities with duplex ultrasonography. Br J Surg. 1996;83(3):404–409. doi: 10.1002/bjs.1800830336. [DOI] [PubMed] [Google Scholar]
- 35.Uflaker R. Atlas da Anatomia Vascular. Rio de Janeiro: Revinter; 2003. [Google Scholar]
- 36.Taylor LM Jr, Moneta GL, Porter JM. Rutherford RB. Vascular surgery. Philadelphia: WB Saunders; 2000. Treatment of chronic visceral ischemia. 5th ed; pp. 1532–1541. [Google Scholar]
- 37.European Stroke O, Tendera M, Aboyans V, Bartelink ML, Baumgartner I, Clement D, et al. ESC Committee for Practice Guidelines ESC Guidelines on the diagnosis and treatment of peripheral artery diseases: Document covering atherosclerotic disease of extracranial carotid and vertebral, mesenteric, renal, upper and lower extremity arteries: the Task Force on the Diagnosis and Treatment of Peripheral Artery Diseases of the European Society of Cardiology (ESC) Eur Heart J. 2011;32(22):2851–2906. doi: 10.1093/eurheartj/ehr211. [DOI] [PubMed] [Google Scholar]
- 38.Pellerito JS, Revzin MV, Tsang JC, Greben CR, Naidich JB. Doppler sonographic criteria for the diagnosis of inferior mesenteric artery stenosis. J Ultrasound Med. 2009;28(5):641–650. doi: 10.7863/jum.2009.28.5.641. [DOI] [PubMed] [Google Scholar]
- 39.van Petersen AS, Meerwaldt R, Kolkman JJ, Huisman AB, van der Palen J, van Bockel JH, et al. The influence of respiration on criteria for transabdominal duplex examination of the splanchnic arteries in patients with suspected chronic splanchnic ischemia. J Vasc Surg. 2013;57(6):1603–1611. doi: 10.1016/j.jvs.2012.11.120. e1-10. [DOI] [PubMed] [Google Scholar]
- 40.Morais Filho DB, Barros FS. Engelhorn CA, Moraes Filho D, Barros FS, Coelho NA. Guia prático de ultrassonografia. Rio de Janeiro: Di Livros; 2015. Exame ultrassonográfico das artérias mesentéricas. [Google Scholar]
- 41.Gentile AT, Moneta GL, Lee RW, Masser PA, Taylor LM Jr, Porter JM. Usefulness of fasting and postprandial duplex ultrasound examinations for predicting high-grade superior mesenteric artery stenosis. Am J Surg. 1995;169(5):476–479. doi: 10.1016/S0002-9610(99)80198-6. [DOI] [PubMed] [Google Scholar]
- 42.AbuRahma AF, Scott Dean L. Duplex ultrasound interpretation criteria for inferior mesenteric arteries. Vascular. 2012;20(3):145–149. doi: 10.1258/vasc.2011.oa0349. [DOI] [PubMed] [Google Scholar]
- 43.Bowersox JC, Zwolak RM, Walsh DB, Schneider JR, Musson A, LaBombard FE, et al. Duplex ultrasonography in the diagnosis of celiac and mesenteric artery occlusive disease. J Vasc Surg. 1991;14(6):780–786. doi: 10.1067/mva.1991.33215. [DOI] [PubMed] [Google Scholar]
- 44.Simon N, Franklin SS, Bleifer KH, Maxwell MH. Clinical characteristics of renovascular hypertension. JAMA. 1972;220(9):1209–1218. [PubMed] [Google Scholar]
- 45.Lao D, Parasher PS, Cho KC, Yeghiazarians Y. Atherosclerotic renal artery stenosis--diagnosis and treatment. Mayo Clin Proc. 2011;86(7):649–657. doi: 10.4065/mcp.2011.0181. [DOI] [PMC free article] [PubMed] [Google Scholar]
- 46.Liang F, Hu DY, Wu MY, Li TC, Tang CZ, Wang JY, et al. The incidence of renal artery stenosis in the patients referred for coronary artery bypass grafting. Indian J Nephrol. 2012;22(1):13–17. doi: 10.4103/0971-4065.91181. [DOI] [PMC free article] [PubMed] [Google Scholar]
- 47.Olin JW, Froehlich J, Gu X, Bacharach JM, Eagle K, Gray BH, et al. The United States Registry for Fibromuscular Dysplasia: results in the first 447 patients. Circulation. 2012;125(25):3182–3190. doi: 10.1161/CIRCULATIONAHA.112.091223. [DOI] [PubMed] [Google Scholar]
- 48.Zierler RE. Is duplex scanning the best screening test for renal artery stenosis. Semin Vasc Surg. 2001;14(3):177–185. doi: 10.1053/svas.2001.25488. [DOI] [PubMed] [Google Scholar]
- 49.Dworkin LD, Cooper CJ. Clinical practice: Renal-artery stenosis. N Engl J Med. 2009;361(20):1972–1978. doi: 10.1056/NEJMcp0809200. [DOI] [PMC free article] [PubMed] [Google Scholar]
- 50.Borelli FA, Pinto IM, Amodeo C, Smanio PE, Kambara AM, Petisco AC, et al. Analysis of the sensitivity and specificity of noninvasive imaging tests for the diagnosis of renal artery stenosis. Arq Bras Cardiol. 2013;101(5):423–433. doi: 10.5935/abc.20130191. [DOI] [PMC free article] [PubMed] [Google Scholar]
- 51.Rooke TW, Hirsch AT, Misra S, Sidawy AN, Beckman JA, Findeiss LK, et al. 2011 ACCF/AHA Focused Update of the Guideline for the Management of Patients With Peripheral Artery Disease (updating the 2005 guideline): a report of the American College of Cardiology Foundation/American Heart Association Task Force on Practice Guidelines. J Am Coll Cardiol. 2011;58(19):2020–2045. doi: 10.1016/j.jacc.2011.08.023. [DOI] [PMC free article] [PubMed] [Google Scholar]
- 52.Hirsch AT, Haskal ZJ, Hertzer NR, Bakal CW, Creager MA, Halperin JL, et al. ACC/AHA 2005 guidelines for the management of patients with peripheral arterial disease (lower extremity, renal, mesenteric, and abdominal aortic): executive summary a collaborative report from the American Association for Vascular Surgery/Society for Vascular Surgery, Society for Cardiovascular Angiography and Interventions, Society for Vascular Medicine and Biology, Society of Interventional Radiology, and the ACC/AHA Task Force on Practice Guidelines (Writing Committee to Develop Guidelines for the Management of Patients With Peripheral Arterial Disease) endorsed by the American Association of Cardiovascular and Pulmonary Rehabilitation; National Heart, Lung, and Blood Institute; Society for Vascular Nursing; TransAtlantic Inter-Society Consensus; and Vascular Disease Foundation. J Am Coll Cardiol. 2006;47(6):1239–1312. doi: 10.1016/j.jacc.2005.10.009. [DOI] [PubMed] [Google Scholar]
- 53.Radermacher J, Chavan A, Schaffer J, Stoess B, Vitzthum A, Kliem V, et al. Detection of significant renal artery stenosis with color Doppler sonography: combining extrarenal and intrarenal approaches to minimize technical failure. Clin Nephrol. 2000;53(5):333–343. [PubMed] [Google Scholar]
- 54.Collins R, Cranny G, Burch J, Aguiar-Ibanez R, Craig D, Wright K, et al. A systematic review of duplex ultrasound, magnetic resonance angiography and computed tomography angiography for the diagnosis and assessment of symptomatic, lower limb peripheral arterial disease. Health Technol Assess. 2007;11(20):iii–iiv. doi: 10.3310/hta11200. xi-xiii,1-184. [DOI] [PubMed] [Google Scholar]
- 55.Aboyans V, Ricco JB, Bartelink ME, Bjorck M, Brodmann M, Cohnert T, et al. ESC Scientific Document Group 2017 ESC Guidelines on the Diagnosis and Treatment of Peripheral Arterial Diseases, in collaboration with the European Society for Vascular Surgery (ESVS): Document covering atherosclerotic disease of extracranial carotid and vertebral, mesenteric, renal, upper and lower extremity arteriesEndorsed by: the European Stroke Organization (ESO)The Task Force for the Diagnosis and Treatment of Peripheral Arterial Diseases of the European Society of Cardiology (ESC) and of the European Society for Vascular Surgery (ESVS) Eur Heart J. 2018;39(9):763–816. doi: 10.1093/eurheartj/ehx095. [DOI] [PubMed] [Google Scholar]
- 56.Bradbury AW, Adam DJ. Diagnosis of peripheral arterial disease of the lower limb. BMJ. 2007;334(7606):1229–1230. doi: 10.1136/bmj.39244.344664.80. [DOI] [PMC free article] [PubMed] [Google Scholar]
- 57.Collins R, Burch J, Cranny G, Aguiar-Ibanez R, Craig D, Wright K, et al. Duplex ultrasonography, magnetic resonance angiography, and computed tomography angiography for diagnosis and assessment of symptomatic, lower limb peripheral arterial disease: systematic review. BMJ. 2007;334(7606):1257–1257. doi: 10.1136/bmj.39217.473275.55. [DOI] [PMC free article] [PubMed] [Google Scholar]
- 58.de Vries SO, Hunink MG, Polak JF. Summary receiver operating characteristic curves as a technique for meta-analysis of the diagnostic performance of duplex ultrasonography in peripheral arterial disease. Acad Radiol. 1996;3(4):361–369. doi: 10.1016/s1076-6332(96)80257-1. [DOI] [PubMed] [Google Scholar]
- 59.Eiberg JP, Gronvall Rasmussen JB, Hansen MA, Schroeder TV. Duplex ultrasound scanning of peripheral arterial disease of the lower limb. Eur J Vasc Endovasc Surg. 2010;40(4):507–512. doi: 10.1016/j.ejvs.2010.06.002. [DOI] [PubMed] [Google Scholar]
- 60.Ascher E, Hingorani A, Markevich N, Yorkovich W, Schutzer R, Hou A, et al. Role of duplex arteriography as the sole preoperative imaging modality prior to lower extremity revascularization surgery in diabetic and renal patients. Ann Vasc Surg. 2004;18(4):433–439. doi: 10.1007/s10016-004-0058-x. [DOI] [PubMed] [Google Scholar]
- 61.Wain RA, Berdejo GL, Delvalle WN, Lyon RT, Sanchez LA, Suggs WD, et al. Can duplex scan arterial mapping replace contrast arteriography as the test of choice before infrainguinal revascularization. J Vasc Surg. 1999;29(1):100–107. doi: 10.1016/s0741-5214(99)70352-6. [DOI] [PubMed] [Google Scholar]
- 62.Burke CW, Suk JS, Kim AJ, Hsiang YH, Klibanov AL, Hanes J, et al. Markedly enhanced skeletal muscle transfection achieved by the ultrasound-targeted delivery of non-viral gene nanocarriers with microbubbles. J Control Release. 2012;162(2):414–421. doi: 10.1016/j.jconrel.2012.07.005. [DOI] [PMC free article] [PubMed] [Google Scholar]
- 63.Mitchell DG, Needleman L, Bezzi M, Goldberg BB, Kurtz AB, Pennell RG, et al. Femoral artery pseudoaneurysm: diagnosis with conventional duplex and color Doppler US. Radiology. 1987;165(3):687–690. doi: 10.1148/radiology.165.3.3317501. [DOI] [PubMed] [Google Scholar]
- 64.Paulson EK, Kliewer MA, Hertzberg BS, O'Malley CM, Washington R, Carroll BA. Color Doppler sonography of groin complications following femoral artery catheterization. AJR Am J Roentgenol. 1995;165(2):439–444. doi: 10.2214/ajr.165.2.7618573. [DOI] [PubMed] [Google Scholar]
- 65.Fasih T, Rudol G, Ashour H, Mudawi A, Bhattacharya V. Surveillance versus nonsurveillance for femoro-popliteal bypass grafts. Angiology. 2004;55(3):251–256. doi: 10.1177/000331970405500303. [DOI] [PubMed] [Google Scholar]
- 66.Ferris BL, Mills JL Sr, Hughes JD, Durrani T, Knox R. Is early postoperative duplex scan surveillance of leg bypass grafts clinically important. J Vasc Surg. 2003;37(3):495–500. doi: 10.1067/mva.2003.115. [DOI] [PubMed] [Google Scholar]
- 67.Gerhard-Herman M, Gardin JM, Jaff M, Mohler E, Roman M, Naqvi TZ, et al. American Society of EchocardiographySociety for Vascular Medicine and Biology Guidelines for noninvasive vascular laboratory testing: a report from the American Society of Echocardiography and the Society for Vascular Medicine and Biology. Vasc Med. 2006;11(3):183–200. doi: 10.1177/1358863x06070516. [DOI] [PubMed] [Google Scholar]
- 68.Back MR, Novotney M, Roth SM, Elkins D, Farber S, Cuthbertson D, et al. Utility of duplex surveillance following iliac artery angioplasty and primary stenting. J Endovasc Ther. 2001;8(6):629–637. doi: 10.1177/152660280100800617. [DOI] [PubMed] [Google Scholar]
- 69.Baril DT, Rhee RY, Kim J, Makaroun MS, Chaer RA, Marone LK. Duplex criteria for determination of in-stent stenosis after angioplasty and stenting of the superficial femoral artery. J Vasc Surg. 2009;49(1):133–138. doi: 10.1016/j.jvs.2008.09.046. [DOI] [PubMed] [Google Scholar]
- 70.Kawarada O, Higashimori A, Noguchi M, Waratani N, Yoshida M, Fujihara M, et al. Duplex criteria for in-stent restenosis in the superficial femoral artery. Catheter Cardiovasc Interv. 2013;81(4):E199–E205. doi: 10.1002/ccd.24509. [DOI] [PubMed] [Google Scholar]
- 71.Langenberger H, Schillinger M, Plank C, Sabeti S, Dick P, Cejna M, et al. Agreement of duplex ultrasonography vs: computed tomography angiography for evaluation of native and in-stent SFA re-stenosis--findings from a randomized controlled trial. Eur J Radiol. 2012;81(9):2265–2269. doi: 10.1016/j.ejrad.2011.05.035. [DOI] [PubMed] [Google Scholar]
- 72.Wiese P, Nonnast-Daniel B. Colour Doppler ultrasound in dialysis access. Nephrol Dial Transplant. 2004;19(8):1956–1963. doi: 10.1093/ndt/gfh244. [DOI] [PubMed] [Google Scholar]
- 73.National Kidney Foundation NKF-K/DOQI Clinical Practice Guidelines for Vascular Access: update 2000. Am J Kidney Dis. 2001;37(1 Suppl 1):S137–S181. doi: 10.1016/s0272-6386(01)70007-8. [DOI] [PubMed] [Google Scholar]
- 74.Toregiani JF, Kimura CJ, Rocha AS, Volpiani GG, Bortoncello A, Shirasu K, et al. Avaliação da maturação das fístulas arteriovenosas para hemodiálise pelo eco-Doppler colorido. J Vasc Bras. 2008;7(3):203–213. [Google Scholar]
- 75.Allon M, Lockhart ME, Lilly RZ, Gallichio MH, Young CJ, Barker J, et al. Effect of preoperative sonographic mapping on vascular access outcomes in hemodialysis patients. Kidney Int. 2001;60(5):2013–2020. doi: 10.1046/j.1523-1755.2001.00031.x. [DOI] [PubMed] [Google Scholar]
- 76.Nogueira AI, Leite PL, Mathias ML, Rabischoffsky A, Belem LHJ, Amaral SI, et al. Importância do Eco color Doppler no mapeamento arterial e venoso para confecção de fistulas arteriovenosas. Rev Bras Ecocardiogr Imagem Cardiovasc. 2010;23(3):33–39. [Google Scholar]
- 77.Robbin ML, Chamberlain NE, Lockhart ME, Gallichio MH, Young CJ, Deierhoi MH, et al. Hemodialysis arteriovenous fistula maturity: US evaluation. Radiology. 2002;225(1):59–64. doi: 10.1148/radiol.2251011367. [DOI] [PubMed] [Google Scholar]
- 78.Grogan J, Castilla M, Lozanski L, Griffin A, Loth F, Bassiouny H. Frequency of critical stenosis in primary arteriovenous fistulae before hemodialysis access: should duplex ultrasound surveillance be the standard of care? J Vasc Surg. 2005;41(6):1000–1006. doi: 10.1016/j.jvs.2005.02.019. [DOI] [PubMed] [Google Scholar]
- 79.Teodorescu V, Gustavson S, Schanzer H. Duplex ultrasound evaluation of hemodialysis access: a detailed protocol. Int J Nephrol. 2012 Jan;2012:508956–508956. doi: 10.1155/2012/508956. [DOI] [PMC free article] [PubMed] [Google Scholar]
- 80.Planken RN, Keuter XH, Hoeks AP, Kooman JP, van der Sande FM, Kessels AG, et al. Diameter measurements of the forearm cephalic vein prior to vascular access creation in end-stage renal disease patients: graduated pressure cuff versus tourniquet vessel dilatation. Nephrol Dial Transplant. 2006;21(3):802–806. doi: 10.1093/ndt/gfi340. [DOI] [PubMed] [Google Scholar]
- 81.Corpataux JM, Haesler E, Silacci P, Ris HB, Hayoz D. Low-pressure environment and remodelling of the forearm vein in Brescia-Cimino haemodialysis access. Nephrol Dial Transplant. 2002;17(6):1057–1062. doi: 10.1093/ndt/17.6.1057. [DOI] [PubMed] [Google Scholar]
- 82.Lin SL, Huang CH, Chen HS, Hsu WA, Yen CJ, Yen TS. Effects of age and diabetes on blood flow rate and primary outcome of newly created hemodialysis arteriovenous fistulas. Am J Nephrol. 1998;18(2):96–100. doi: 10.1159/000013315. [DOI] [PubMed] [Google Scholar]
- 83.Bates SM, Jaeschke R, Stevens SM, Goodacre S, Wells PS, Stevenson MD, et al. Diagnosis of DVT: Antithrombotic therapy and prevention of thrombosis, 9th ed: American College of chest physicians evidence-based clinical practice guidelines. Chest. 2012;141(2 Suppl):e351S–e3418. doi: 10.1378/chest.11-2299. [DOI] [PMC free article] [PubMed] [Google Scholar]
- 84.Hirsh J, Hull RD, Raskob GE. Epidemiology and pathogenesis of venous thrombosis. J Am Coll Cardiol. 1986;8(6 Suppl B):104B–1013. doi: 10.1016/s0735-1097(86)80012-2. [DOI] [PubMed] [Google Scholar]
- 85.Andrews EJ Jr, Fleischer AC. Sonography for deep venous thrombosis: current and future applications. Ultrasound Q. 2005;21(4):213–225. doi: 10.1097/01.ruq.0000187024.54319.19. [DOI] [PubMed] [Google Scholar]
- 86.Kesieme E, Kesieme C, Jebbin N, Irekpita E, Dongo A. Deep vein thrombosis: a clinical review. J Blood Med. 2011 Apr;2:59–69. doi: 10.2147/JBM.S19009. [DOI] [PMC free article] [PubMed] [Google Scholar]
- 87.Meissner MH, Wakefield TW, Ascher E, Caprini JA, Comerota AJ, Eklof B, et al. Acute venous disease: venous thrombosis and venous trauma. J Vasc Surg. 2007;46(Suppl S):25S–253. doi: 10.1016/j.jvs.2007.08.037. [DOI] [PubMed] [Google Scholar]
- 88.Labropoulos N, Kang SS, Mansour MA, Giannoukas AD, Moutzouros V, Baker WH. Early thrombus remodelling of isolated calf deep vein thrombosis. Eur J Vasc Endovasc Surg. 2002;23(4):344–348. doi: 10.1053/ejvs.2002.1608. [DOI] [PubMed] [Google Scholar]
- 89.Kahn SR, Comerota AJ, Cushman M, Evans NS, Ginsberg JS, Goldenberg NA, et al. The postthrombotic syndrome: evidence-based prevention, diagnosis, and treatment strategies: a scientific statement from the American Heart Association. Circulation. 2014;130(18):1636–1661. doi: 10.1161/CIR.0000000000000130. [DOI] [PubMed] [Google Scholar]
- 90.De Maeseneer MG, Bochanen N, van Rooijen G, Neglen P. Analysis of 1,338 patients with acute lower limb Deep Venous Thrombosis (DVT) supports the inadequacy of the term "Proximal DVT". Eur J Vasc Endovasc Surg. 2016;51(3):415–420. doi: 10.1016/j.ejvs.2015.11.001. [DOI] [PubMed] [Google Scholar]
- 91.Langford N, Stansby G, Avital L. The management of venous thromboembolic diseases and the role of thrombophilia testing: summary of NICE Guideline CG144. Acute Med. 2012;11(3):138–142. [PubMed] [Google Scholar]
- 92.Caprini JA. Risk assessment as a guide to thrombosis prophylaxis. Curr Opin Pulm Med. 2010;16(5):448–452. doi: 10.1097/MCP.0b013e32833c3d3e. [DOI] [PubMed] [Google Scholar]
- 93.Fitzgerald SJ, McAndrew CM, Kraay MJ, Goldberg VM. Incidence of postthrombotic syndrome in patients undergoing primary total hip arthroplasty for osteoarthritis. Clin Orthop Relat Res. 2011;469(2):530–534. doi: 10.1007/s11999-010-1572-5. [DOI] [PMC free article] [PubMed] [Google Scholar]
- 94.Pesavento R, Villalta S, Prandoni P. The postthrombotic syndrome. Intern Emerg Med. 2010;5(3):185–192. doi: 10.1007/s11739-009-0336-2. [DOI] [PubMed] [Google Scholar]
- 95.Kahn SR, Desmarais S, Ducruet T, Arsenault L, Ginsberg JS. Comparison of the Villalta and Ginsberg clinical scales to diagnose the post-thrombotic syndrome: correlation with patient-reported disease burden and venous valvular reflux. J Thromb Haemost. 2006;4(4):907–908. doi: 10.1111/j.1538-7836.2006.01824.x. [DOI] [PubMed] [Google Scholar]
- 96.Wakefield TW, Caprini J, Comerota AJ. Thromboembolic diseases. Curr Probl Surg. 2008;45(12):844–899. doi: 10.1067/j.cpsurg.2008.08.002. [DOI] [PubMed] [Google Scholar]
- 97.Lee JJ, Pope JE. A meta-analysis of the risk of venous thromboembolism in inflammatory rheumatic diseases. Arthritis Res Ther. 2014;16(5):435–435. doi: 10.1186/s13075-014-0435-y. [DOI] [PMC free article] [PubMed] [Google Scholar]
- 98.Bounameaux H, Perrier A, Righini M. Diagnosis of venous thromboembolism: an update. Vasc Med. 2010;15(5):399–406. doi: 10.1177/1358863X10378788. [DOI] [PubMed] [Google Scholar]
- 99.Meissner MH, Gloviczki P, Comerota AJ, Dalsing MC, Eklof BG, Gillespie DL, et al. Early thrombus removal strategies for acute deep venous thrombosis: clinical practice guidelines of the Society for Vascular Surgery and the American Venous Forum. J Vasc Surg. 2012;55(5):1449–1462. doi: 10.1016/j.jvs.2011.12.081. [DOI] [PubMed] [Google Scholar]
- 100.Prandoni P, Villalta S, Bagatella P, Rossi L, Marchiori A, Piccioli A, et al. The clinical course of deep-vein thrombosis: Prospective long-term follow-up of 528 symptomatic patients. Haematologica. 1997;82(4):423–428. [PubMed] [Google Scholar]
- 101.Prandoni P, Lensing AW, Bernardi E, Villalta S, Bagatella P, Girolami A, et al. The diagnostic value of compression ultrasonography in patients with suspected recurrent deep vein thrombosis. Thromb Haemost. 2002;88(3):402–406. [PubMed] [Google Scholar]
- 102.Eichinger S, Heinze G, Kyrle PA. D-dimer levels over time and the risk of recurrent venous thromboembolism: an update of the Vienna prediction model. J Am Heart Assoc. 2014;3(1):e000467. doi: 10.1161/JAHA.113.000467. [DOI] [PMC free article] [PubMed] [Google Scholar]
- 103.Linkins LA, Pasquale P, Paterson S, Kearon C. Change in thrombus length on venous ultrasound and recurrent deep vein thrombosis. Arch Intern Med. 2004;164(16):1793–1796. doi: 10.1001/archinte.164.16.1793. [DOI] [PubMed] [Google Scholar]
- 104.Porto CL, Milhomens AL, Pires CE, Xavier SS, Sicuro F, Bottino DA, et al. Changes on venous diameter and leg perimeter with different clinical treatments for moderate chronic venous disease: evaluation using Duplex scanning and perimeter measurements. Int Angiol. 2009;28(3):222–231. [PubMed] [Google Scholar]
- 105.Sivananthan G, Halin NJ, Estes JM, Alessi-Chinetti JM, Polak JF. Value of complete full-length lower extremity sonography in patients undergoing computed tomographic pulmonary angiography. J Ultrasound Med. 2014;33(12):2137–2143. doi: 10.7863/ultra.33.12.2137. [DOI] [PubMed] [Google Scholar]
- 106.Bernardi E, Camporese G, Buller HR, Siragusa S, Imberti D, Berchio A, et al. Serial 2-point ultrasonography plus D-dimer vs whole-leg color-coded Doppler ultrasonography for diagnosing suspected symptomatic deep vein thrombosis: a randomized controlled trial. JAMA. 2008;300(14):1653–1659. doi: 10.1001/jama.300.14.1653. [DOI] [PubMed] [Google Scholar]
- 107.Mumoli N, Vitale J, Giorgi-Pierfranceschi M, Sabatini S, Tulino R, Cei M, et al. General practitioner-performed compression ultrasonography for diagnosis of deep vein thrombosis of the leg: a multicenter, prospective cohort study. Ann Fam Med. 2017;15(6):535–539. doi: 10.1370/afm.2109. [DOI] [PMC free article] [PubMed] [Google Scholar]
- 108.Coleridge-Smith P, Labropoulos N, Partsch H, Myers K, Nicolaides A, Cavezzi A, et al. Duplex ultrasound investigation of the veins in chronic venous disease of the lower limbs--UIP consensus document: Part I. Basic principles. Vasa. 2007;36(1):53–61. doi: 10.1024/0301-1526.36.1.53. [DOI] [PubMed] [Google Scholar]
- 109.Aaslid R, Markwalder TM, Nornes H. Noninvasive transcranial Doppler ultrasound recording of flow velocity in basal cerebral arteries. J Neurosurg. 1982;57(6):769–774. doi: 10.3171/jns.1982.57.6.0769. [DOI] [PubMed] [Google Scholar]
- 110.Lindegaard KF, Bakke SJ, Grolimund P, Aaslid R, Huber P, Nornes H. Assessment of intracranial hemodynamics in carotid artery disease by transcranial Doppler ultrasound. J Neurosurg. 1985;63(6):890–898. doi: 10.3171/jns.1985.63.6.0890. [DOI] [PubMed] [Google Scholar]
- 111.Hassler W, Steinmetz H, Pirschel J. Transcranial Doppler study of intracranial circulatory arrest. J Neurosurg. 1989;71(2):195–201. doi: 10.3171/jns.1989.71.2.0195. [DOI] [PubMed] [Google Scholar]
- 112.Biniek R, Ringelstein EB, Brückmann H, Leonhardt G, Ammeling B, Nolte P. Hacke W, del Zoppo GJ, Hirschberg M. Thrombolytic therapy in acute ischemic stroke. Berlin: Springer-Heidelberg; 1991. Recanalization of acute middle cerebral artery occlusion monitored by transcranial doppler sonography; pp. 221–223. [Google Scholar]
- 113.Labiche LA, Malkoff M, Alexandrov AV. Residual flow signals predict complete recanalization in stroke patients treated with TPA. J Neuroimaging. 2003;13:28–33. [PubMed] [Google Scholar]
- 114.Aaslid R, Huber P, Nornes H. Evaluation of cerebrovascular spasm with transcranial Doppler ultrasound. J Neurosurg. 1984;60(1):37–41. doi: 10.3171/jns.1984.60.1.0037. [DOI] [PubMed] [Google Scholar]
- 115.Angeli S, Del Sette M, Beelke M, Anzola GP, Zanette E. Transcranial Doppler in the diagnosis of cardiac patent foramen ovale. Neurol Sci. 2001;22(5):353–356. doi: 10.1007/s100720100064. [DOI] [PubMed] [Google Scholar]
- 116.Adams RJ, McKie VC, Carl EM, Nichols FT, Perry R, Brock K, et al. Long-term stroke risk in children with sickle cell disease screened with transcranial Doppler. Ann Neurol. 1997;42(5):699–704. doi: 10.1002/ana.410420505. [DOI] [PubMed] [Google Scholar]
- 117.Adams RJ, McKie VC, Hsu L, Files B, Vichinsky E, Pegelow C, et al. Prevention of a first stroke by transfusions in children with sickle cell anemia and abnormal results on transcranial Doppler ultrasonography. N Engl J Med. 1998;339(1):5–11. doi: 10.1056/NEJM199807023390102. [DOI] [PubMed] [Google Scholar]
- 118.Adams RJ, Brambilla DJ, Granger S, Gallagher D, Vichinsky E, Abboud MR, et al. Stroke and conversion to high risk in children screened with transcranial Doppler ultrasound during the STOP study. Blood. 2004;103(10):3689–3694. doi: 10.1182/blood-2003-08-2733. [DOI] [PubMed] [Google Scholar]
- 119.Chernyshev OY, Vein AM, Mathew NT, Kolosova OA, Kailasam J, Frolov A, et al. Blood flow velocity and pulsatility index differences in patients with unilateral migraine. Headache. 2001;41(7):704–709. doi: 10.1046/j.1526-4610.2001.041007704.x. [DOI] [PubMed] [Google Scholar]
- 120.Spencer MP, Thomas GI, Nicholls SC, Sauvage LR. Detection of middle cerebral artery emboli during carotid endarterectomy using transcranial Doppler ultrasonography. Stroke. 1990;21(3):415–423. doi: 10.1161/01.str.21.3.415. [DOI] [PubMed] [Google Scholar]
- 121.Ringelstein EB, Droste DW, Babikian VL, Evans DH, Grosset DG, Kaps M, et al. Consensus on microembolus detection by TCD: International consensus group on microembolus detection. Stroke. 1998;29(3):725–729. doi: 10.1161/01.str.29.3.725. [DOI] [PubMed] [Google Scholar]
- 122.Lange MC, Zetola VH, Miranda-Alves M, Moro CH, Silvado CE, Rodrigues DL, et al. Brazilian guidelines for the application of transcranial ultrasound as a diagnostic test for the confirmation of brain death. Arq Neuropsiquiatr. 2012;70(5):373–380. doi: 10.1590/s0004-282x2012000500012. [DOI] [PubMed] [Google Scholar]
- 123.Lobo CL, Cancado RD, Leite AC, Dos Anjos AC, Pinto AC, Matta AP, et al. Brazilian Guidelines for transcranial doppler in children and adolescents with sickle cell disease. Rev Bras Hematol Hemoter. 2011;33(1):43–48. doi: 10.5581/1516-8484.20110014. [DOI] [PMC free article] [PubMed] [Google Scholar]
- 124.Greis C. Ultrasound contrast agents as markers of vascularity and microcirculation. Clin Hemorheol Microcirc. 2009;43(1-2):1–9. doi: 10.3233/CH-2009-1216. [DOI] [PubMed] [Google Scholar]
- 125.Jung EM, Wiggermann P, Greis C, Eder F, Ehrich J, Jung W, et al. First results of endocavity evaluation of the microvascularization of malignant prostate tumors using contrast enhanced ultrasound (CEUS) including perfusion analysis: first results. Clin Hemorheol Microcirc. 2012;52(2-4):167–177. doi: 10.3233/CH-2012-1594. [DOI] [PubMed] [Google Scholar]
- 126.Jung EM, Clevert DA, Schreyer AG, Schmitt S, Rennert J, Kubale R, et al. Evaluation of quantitative contrast harmonic imaging to assess malignancy of liver tumors: a prospective controlled two-center study. World J Gastroenterol. 2007;13(47):6356–6364. doi: 10.3748/wjg.v13.i47.6356. [DOI] [PMC free article] [PubMed] [Google Scholar]
- 127.Schneider M. SonoVue, a new ultrasound contrast agent. Eur Radiol. 1999;9(Suppl 3):S347–S348. doi: 10.1007/pl00014071. [DOI] [PubMed] [Google Scholar]
- 128.Greis C. Technical aspects of contrast-enhanced ultrasound (CEUS) examinations: tips and tricks. Clin Hemorheol Microcirc. 2014;58(1):89–95. doi: 10.3233/CH-141873. [DOI] [PubMed] [Google Scholar]
- 129.Piscaglia F, Nolsoe C, Dietrich CF, Cosgrove DO, Gilja OH, Bachmann Nielsen M, et al. The EFSUMB guidelines and recommendations on the clinical practice of contrast enhanced ultrasound (CEUS): update 2011 on non-hepatic applications. Ultraschall Med. 2012;33(1):33–59. doi: 10.1055/s-0031-1281676. [DOI] [PubMed] [Google Scholar]