

Abstract
Objective:
The goal of this study is to use adjunctive classes to improve a predictive model whose performance is limited by the common problems of small numbers of primary cases, high feature dimensionality, and poor class separability. Specifically, our clinical task is to use mammographic features to predict whether ductal carcinoma in situ (DCIS) identified at needle core biopsy will be later upstaged or shown to contain invasive breast cancer.
Methods:
To improve the prediction of pure DCIS (negative) versus upstaged DCIS (positive) cases, this study considers the adjunctive roles of two related classes: atypical ductal hyperplasia (ADH), a non-cancer type of breast abnormity, and invasive ductal carcinoma (IDC), with 113 computer vision based mammographic features extracted from each case. To improve the baseline Model A’s classification of pure vs. upstaged DCIS, we designed three different strategies (Models B, C, D) with different ways of embedding features or inputs.
Results:
Based on ROC analysis, the baseline Model A performed with AUC of 0.614 (95% CI, 0.496-0.733). All three new models performed better than the baseline, with domain adaptation (Model D) performing the best with an AUC of 0.697 (95% CI, 0.595-0.797).
Conclusion:
We improved the prediction performance of DCIS upstaging by embedding two related pathology classes in different training phases.
Significance:
The three new strategies of embedding related class data all outperformed the baseline model, thus demonstrating not only feature similarities among these different classes, but also the potential for improving classification by using other related classes.
Keywords: Breast cancer, domain adaptation, forced labeling, ductal carcinoma in situ, mammographic features
I. INTRODUCTION
Ductal carcinoma in situ (DCIS) refers to breast cancers that are entirely confined inside a milk duct without invasion through the basement membrane. It is the most common type of in situ breast cancer, accounting for the majority of in situ cases [1]. DCIS is not life threatening, because the abnormal cells have not grown out of the breast ducts. However, it has potential to progress into invasive ductal carcinoma (IDC). Among biopsy-proven DCIS patients, approximately 20%-25% are upstaged to invasive carcinoma when they undergo definitive surgery such as lumpectomy or mastectomy [2, 3]. Distinguishing upstaged cases from pure DCIS can avoid delays in definitive diagnosis, and could also affect treatment planning. Improved stratification of DCIS cases may also facilitate active surveillance protocols, as follow-up studies on untreated DCIS cases show that 14-53% may progress to invasive disease later on, and the time for progression varies through years or decades [4-10]. Consequently, accurate discrimination between DCIS and invasive cancer at the time of biopsy can assist decision and potentially reduce over-treatment of DCIS.
In this study, we aim to improve classification of DCIS using computer-vision based mammographic features. Previous machine learning methods for classification of pure and upstaged DCIS were trained from those two classes only [11]. Performance for this difficult task was limited by the small sample size relative to the large feature dimensions. These two classes may be seen in the greater context of five dynamic, breast pathology classes, as illustrated in Fig. 1. Hyperplasia, with the lowest breast cancer risk, is an overgrowth of cells lining the milk ducts and implies some irregularity compared to normal cells. In atypical Ductal Hyperplasia (ADH) the cells have abnormal sizes and shapes, and ADH has an increased cancer risk [12, 13]. Hyperplasia and ADH are considered high-risk or pre-cancerous lesions but not cancer. DCIS, classified as Stage 0 breast cancer, is a non-invasive cancer that is confined within the milk ducts. With invasive ductal carcinoma (IDC), the cancer cells have broken through the ducts and grown into the surrounding breast tissues, and over time they can metastasize to other parts of the body. Our study targets, pure and upstaged DCIS, exist in between ADH and IDC along the breast cancer spectrum. Specifically, pure DCIS is defined as patients who are diagnosed with DCIS both at initial needle core biopsy and during definitive surgery. Upstaging is defined as DCIS diagnosed at initial core needle biopsy, but IDC is then identified at definitive surgery. Given that pure and upstaged DCIS are differentiated by the existence of occult invasive cancer, pure DCIS may share certain characteristics with ADH, while upstaged DCIS may share characteristics with IDC.
Fig. 1.

Illustration of different pathology classes associated with breast cancer. ADH is benign but at high risk for being associated with cancer, DCIS is stage-0 cancer still confined within the milk duct, while IDC has invaded beyond the duct and can metastasize to lymph nodes or further.
The hypothesis of this study is that embedding the two “outer” classes of ADH and frank IDC into classifiers during training will improve prediction of the two “inner” classes of pure versus upstaged DCIS. However, this is not a trivial problem given that there are many different approaches of embedding these “outer” classes, especially when these “inner” classes are noisy and have a limited number. With very little previous work and no established methods on this, several previous studies in predicting mild cognitive impairment proposed related hypothesis by applying classification of normal controls and Alzheimer’s disease’s classes to classify MCI converters versus non-converters [14-17] In this study, we are intended to be the first to rigorously evaluate different strategies on how to use “outer” or adjacent classes. We designed and tested three methodologies to improve classifications of DCIS upstaging based on dynamic process analysis. The first method employed transfer feature selection, where features selected from ADH and IDC are transferred to train the classifier to predict upstaging. Given the similarities between the two DCIS classes, transferred features from the more dissimilar classes may provide better differentiation. The second model used forced labeling, where ADH cases are labeled as pure DCIS, and IDC are labeled as upstaged DCIS during training. This process increases the number of cases and may strengthen the definition within each set of mixed data, and thus better differentiate the class boundaries. The last model we tested was a domain adaptation strategy, training a classifier on ADH and IDC and applying the resulting classifier to DCIS. We have reported some preliminary results in [18].
II. Materials and Methods
A. Study Population and Data Preprocessing
Digital mammography magnification views from 335 patients were collected in the Department of Radiology at Duke University Medical Center following Institutional Review Board (IRB) approval. Subjects were women aged 40 or older who were diagnosed with ADH, DCIS, or IDC on stereotactic core needle biopsy. The age range of women with DCIS was 40-86 years with an average age of 60 and median age of 59 years. Imaging findings included microcalcifications only; patients with masses, asymmetries, or architectural distortion were excluded. All images were acquired by a GE Senographe Essential system. Specifically, cases were comprised of 130 ADH, 140 DCIS, and 65 IDC. DCIS cases were further divided into 35 upstaged and 105 pure DCIS based on whether invasive disease was found during definitive surgery.
The lesion area or ROI of each case was masked by a breast radiologist. Then 113 features were extracted from each masked lesion using traditional computer-vision algorithms following the pipeline in a previous study [11], as illustrated in Fig. 2. This procedure contained three main steps. First, the detectability of MCs was enhanced with a combination of three operations: contrast-limited adaptive histogram equalization (CLAHE), a dual-structural element-based morphology operation, and a top-hat transform. Specifically, CLAHE increased the contrast between MCs and surrounding background, and dual-structural element-based morphology operation was applied to enhance the microcalcifications, followed by the top-hat transform to further suppress background noise [19]. Then, given that MCs appear as bright white dots on top of a heterogeneous and complex background, a locally adaptive, triple-threshold technique was applied to detect potential MCs. We further removed MCs beyond certain threshold of their size and long axes length. By taking MC sizes and shapes into consideration, some false positive regions could be removed, and a refined final individual MCs’ segmentation was obtained. Finally, a weighted graph was applied to connect all MCs within the MC cluster, and the cluster boundary was defined using a convex hull. Based on the MC segmentation, a computer-vision based algorithm was built to extract mammographic features into three types: shape, topological and texture features. Within each cluster, 25 individual MCs’ features were computed, which were pooled using four global statistical measures including mean, standard deviation, minimum, and maximum, thus resulting in 100 features based on the individual MCs [20]. In addition, 13 features describe characteristics of the cluster as a whole. In total, we extracted 113 features. Those features are shown in Table 1.
Fig. 2.

Illustration of the Pipeline in Extraction MCs from Mammograms. First, the lesion ROI from original mammogram was annotated by a breast radiologist; Second, we applied some image enhancement algorithms to enhance the detectability of MCs; Third, MCs within the lesion ROI was detected; Last 113 features were extracted from both individual MCs and MC clusters.
Table 1.
Features list extracted from individual MCs and MC clusters.
| Category | Feature Description | |
|---|---|---|
| Individual MCs | Shape | MC Perimeter Length |
| MC Area (mm) | ||
| MC Circularity | ||
| MC Eccentricity | ||
| MC’s Major Axis Length | ||
| MC’s Minor Axis Length | ||
| MC Hu’s Moments (#7): Weighted Averages of Intensities | ||
| Topology | Distance to MC Cluster Centroid | |
| Distance to Closest MC neighbor | ||
| MC Polygon’s Degree | ||
| Sum of Normalized MC Degrees | ||
| Texture | Mean and STD of MC’s Surrounded Background’s Intensities | |
| Mean and STD of MC’s Intensities | ||
| MC Gray Level Co-occurrence Matrices (GLCM) (#4) | ||
| MC Clusters | Shape | MC Cluster Area |
| MC Cluster Eccentricity | ||
| Topology | Number of MCs in Cluster | |
| MC Clusters density: , (E: number of graph edges). | ||
| MC Clusters Coverage: | ||
| Texture | Mean and STD of Background Intensities in Cluster | |
| Mean and STD of All MCs Intensities in Cluster | ||
| MC Cluster GLCM (#4) |
B. Evaluation methods
Logistic regression was used as the classifier for all studies as an intentionally conservative choice given that the number of features is relatively large compared to our available dataset. Furthermore, considering the high dimensionality of features, the classifier was preceded by stabilized feature selection [21]. Performance was assessed by ROC (Receiver Operating Characteristic) Area Under the Curve (AUC). For each model, 5-fold cross-validation was repeated 200 times to reduce sampling bias. Specifically, during each repeat the dataset was first shuffled, and the positive and negative classes were separately split into five folds to preserve the label proportion of each fold. Then in turn, each fold was set as validation data and the four remaining folds were set as training data where an inner 4-fold cross-validation with logistic regression classifier was utilized to grid-search for the optimal L2 norm loss function parameter C. The average AUC of five folds was assigned as the performance for one repeat, which was then averaged over the 200 repeats to yield the performance for that model. Note that during each repeat for different models, the dataset is shuffled the same way where DCIS case orders were the same across different models.
After all the repeats, there were 200 sets of outputs for the N different types of models. In order to conduct paired comparisons between models, only one set of outputs from a single repeat was needed. To representative performance fairly across all models, that repeat was chosen by minimizing the mean squared error over N models between the individual repeat AUC vs. average AUC. In other words, that repeat was a random shuffling of cases that reduced sample bias and delivered the reported performance across all models. Afterwards, DeLong’s algorithm [22] was used for comparing each paired ROC curves to measure significance between different experiments. Their PR-AUC results are also evaluated as well.
C. Classification Strategy
First, we implemented a baseline classification model (Model A) based on our previous work [11]. We then designed three new models by varying the contributions of the four classes. The new models were transfer feature selection (Model B), forced labeling (Model C), and domain adaptation (Model D). All models are illustrated in Fig. 3 and described in detail below.
Fig. 3.
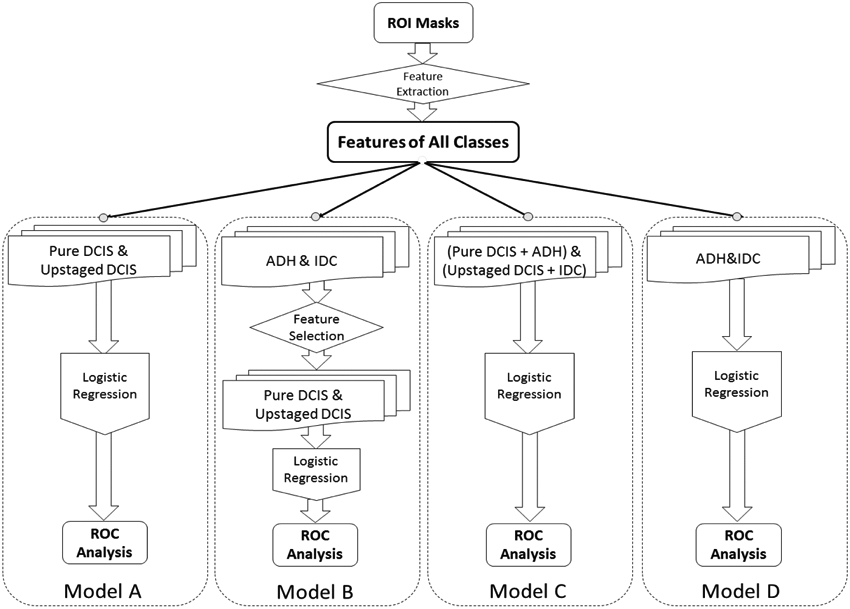
Illustration of Four Models Designed with Traditional Way and Embedding ADH and IDC in Training
1). Baseline (Model A)
The same procedure was followed as our previous study [11] except for increasing from 99 to the larger number of 140 cases currently available, and changing model evaluation method from Leave-one-out cross validation to 5-fold cross validation. The targeted “inner” classes of pure DCIS (negative) and upstaged (positive) were used to train a logistic regression classifier. In other words, during each repeat, only those two classes of cases were trained with repeated 5-fold Cross-Validation. A stabilized feature selection was also proceeded within the training set.
2). Transfer Feature Selection (Model B)
Features selected from the non-targeted “outer” classes of ADH and IDC were transferred to train the classifier for DCIS upstaging. Since the targeted classes of pure and DCIS upstaged started out together as a single class of DCIS at the time of biopsy, those cases shared considerable similarities. Thus, features selected only on DCIS might limit performance of the classifier, while transferred features extracted from the “outer” classes that are distributed farther apart could better strengthen differences. Specifically, each time, logistic regression along with stabilized feature selection was first performed on classifications of ADH and IDC cases, resulting in a subset of features. Then, instead of using all 113 features like Model A, only these selected features were “transferred” to classify pure DCIS and upstaged classes. The rest of the training and testing procedure was identical to the baseline model’s strategy. For additional robustness, the initial ADH and IDC case order was shuffled and the whole feature selection and transfer procedure was repeated 100 times, resulting in two embedded iterations of two classification tasks.
3). Forced Labeling (Model C)
Forced labeling refers to the intentional re-labeling of cases from one category into another during the training process. In this model, ADH were force labeled as pure DCIS (negative) and IDC were force labeled as upstaged (positive) during training. Consequently, the size of the data set is increased on both sides and presumably the separation between those classes as well. During each repeat of the k-fold validation, while keeping the validation fold the same as the original DCIS data, the re-labeled ADH and IDC data were mixed with the remaining four folds of DCIS cases to form a new and larger training data set. The number of ADH or IDC cases added were varied to assess the effect of the total number and the ratio of the two added classes.
4). Domain Adaptation (Model D)
Domain adaptation is associated with transfer learning which refers to models where source versus target domain data are related but different [23, 24]. ADH and IDC were heated as source data and DCIS as target data. In a 5-fold cross-validation loop, training was only on ADH and IDC where ADH were labeled as negative (same as pure DCIS) and IDC were labeled positive (same as DCIS upstaging). Then the resulting classifier was applied to each DCIS validation fold. In this model, variation only occurred in the classifier from shuffling of ADH and IDC. Thus, during training, cross-validation is not involved, in turn, testing DCIS by each fold is applied only for picking the representative repeat so that its performance can be pairwise compared with other models. The hypothesis that would justify this approach was that pure DCIS cases are more stable and ADH-like while upstaged cases with occult invasion are more IDC-like. Stabilized feature selection was applied during training as well. Compared to transfer feature selection (Model B), this classifier used ADH and IDC without feature transferring.
III. Results
The baseline model A, which used only the 140 DCIS cases, performed with AUC of 0.590 (95% CI, 0.485-0.696). After implementing stabilized feature selection, the AUC improved to 0.614 (95% CI, 0.511-0.717). The transfer feature selection model B, which used stabilized feature selection as a feature selection method for ADH versus IDC prediction, selected 34 features (shown in table 2), and achieved an AUC of 0.630 (95% CI, 0.527-0.733) which was significantly higher than random chance with AUC of 0.5 (p<0.05) but not significantly higher than the baseline model A with feature selection (p=0.856).
Table 2.
Selected features with order from one repeat’s training and feature selection of ADH vs. IDC (Black font: Individual MC features; Blue font: MC Clusters’ features).
| Order | 1 | 2 | 3 | 4 | 5 | 6 |
|---|---|---|---|---|---|---|
| Feature Name | Mean GLCM Correlation | Max Degree | Mean Minor Axis | Std Degree | Mean GLCM - Homogeneity | Mean Degree |
| Order | 7 | 8 | 9 | 10 | 11 | 12 |
| Feature Name | Max of Background Mean Intensities | Mean GLCM - Contrast | Max Area | Max of Mean GLCM-Correlation | Std of Normalized Degree | Std of Background Mean Intensities |
| Order | 13 | 14 | 15 | 16 | 17 | 18 |
| Feature Name | Mean Area | Max of Mean GLCM-Homogeneity | Std Background Intensities | Max Normalized Degree | Number of MCs | Std Distance to Centroid |
| Order | 19 | 20 | 21 | 22 | 23 | 24 |
| Feature Name | Mean Major Axis | Min Eccentricity | Min of GLCM-Contrast | Std of Foreground Mean Intensities | Max Distance to Centroid | Max Minor Axis |
| Order | 25 | 26 | 27 | 28 | 29 | 30 |
| Feature Name | Min of Hu’s Moments 1st Invariant | Max of Foreground Mean Intensities | Max Major Axis | Mean Distance to Centroid | Std Circularity | Std Foreground Intensities |
| Order | 31 | 32 | 33 | 34 | ||
| Cluster’s Density | Mean Perimeter | Mean of Mean GLCM-Homogeneity | Cluster’s Area |
For the forced labeling model C, ADH were labeled as pure DCIS and IDC were labeled as upstaged in each training phase. Fig. 4 shows the effect on AUC performance by adding different number of IDC or ADH cases with several fixed ratios. The blue curve shows that adding only IDC cases did not improve AUC performance and the red curve shows that adding only ADH cases slightly improved performance. The other four curves add both ADH and IDC with different ratios. The trend shows that adding both cases at the same time improves the predictive performance, but ADH:IDC ratios of up to 3:1 did not have much difference. When the ADH:IDC ratio reaches 4, the performance drops (cyan curve). The heat-map in Fig. 5 illustrates the performance of different numbers of added cases in more detail. Without feature selection, by adding 130 ADH and 65 IDC cases, an AUC with 0.668 (95% CI, 0.566-0.770) was achieved with no significant difference from baseline model A with feature selection (p=0.111).
Fig. 4.

AUC of adding either ADH or IDC cases for training the classifier.
Fig. 5.

Heat-map of adding different number of ADH and IDC to training phase.
Finally, the domain adaptation model was trained on only ADH and IDC cases and the resulting classifier was then applied to DCIS. This model achieved an AUC of 0.698 (95% CI, 0.598-0.798) significantly outperforming the baseline model with feature selection classifier (p=0.017). Averaged ROC curves of four models across all 200 repeats are shown in Fig. 6. We also analyzed the PR-AUC performance with selected repeat’s models based on minimum error rule, which showed similar trend with ROC analysis, where Model D outperformed the other three models. This repeat’s four models’ PR Curves are shown in Fig. 7.
Fig. 6.

ROC Curves showing classification performances of different models: traditional classifier, forced labeling and domain adaptation.
Fig. 7.

Precision-Recall Curves showing classification performances of different models: traditional classifier, forced labeling and domain adaptation.
To demonstrate the inherent separability between all four types of cases, Table 3 shows the confusion matrix for classifications between each pair of four classes. Each performance is the median AUC from 200 repeated cross-validation without feature selection. Finally, as a graphical illustration of the class distributions, we selected the top ranked feature, (the standard of each individual MC’s distance to its closet neighbor MC) from classifications of ADH and IDC and plotted the univariate feature values for all four classes in Fig. 8. The classes show considerable overlap throughout the entire range, but the modes of the distributions are approximately ordered as ADH, pure DCIS, upstaged DCIS, and IDC.
Table 3.
Confusion Matrix of AUC performance between classes.
 |
Fig. 8.

The Top Ranked Feature’s Distributions of Four Classes.
IV. DISCUSSION
Our clinical application was to predict upstaging of breast cancer (the presence of invasive disease in the context of a needle biopsy that only shows DCIS) using mammographic features. Beyond this specific application, however, this study shares many challenges in common with other difficult biomedical classification tasks where available datasets are small relative to the high-dimensional features. Under these constraints, feature selection could lead to overfitting, since the dataset is a small sample that may not represent the overall feature performance. In addition, the intended task is known to be quite difficult, in fact under the initial biopsy diagnosis, the two classes are actually the same! To address these challenges, we considered using two other related classes in the training session to improve the model’s performance. These other classes are ADH, which is benign but suspicious and managed with surgical excision like DCIS, and IDC, when invasive cancer is already apparent at the initial core biopsy. We first showed that features that optimized the classification of ADH and IDC can improve classification of pure versus upstaged DCIS as well. We have also shown improved prediction of upstaging with a forced labeling method where both ADH and IDC cases were added to training sessions. Furthermore, we demonstrated that our domain adaptation method where transfer of ADH and IDC classifier directly to upstaging predictions outperformed all the other methods. In our previous work [18], we implemented Model C with 230 cases, including 74 pure DCIS, 25 upstaged DCIS, 66 ADH and 65 IDC, and achieved some improvement compared to results from the Baseline Model. In this study, as initial work showed promising potential results, with also an increased number of dataset, we designed other different approaches to fully evaluate how these associated classes could help in the target classes’ classification.
In our group’s previous study [11], 99 cases including 74 pure and 25 upstaged DCIS cases were used to create the baseline Model A with leave-one-out cross validation and achieved an AUC result of 0.70 (95% CI: 0.59-0.81). Keeping the same model design but changing the sampling to 5-fold cross validation and adding 41 more cases, our performance dropped to AUC of 0.61 which indicated there was overfitting from using a small number of cases, unbalanced dataset, and relatively high dimensional features. Specifically, with leave-one-out cross validation, we got only one estimate for each classifier, and given that it is a noisy dataset, the performance would not be robust. Therefore, we switched over to use repeated 5-fold cross validation to get a more robust estimate of this effect, which did bring the performance down to the current level. Physician-interpreted features were also analyzed and demonstrated that major axis length of the lesion and overall BI-RADS final assessment category had significant differences between pure and upstaged DCIS. However, other demographic and calcification features including patient age, nuclear grade, DCIS subtype, calcification morphology, or calcification distribution did not show any significant difference. A classifier combining these physician-interpreted features yielded AUC of 0.52, which was not significantly different from random chance. In a recent study [25], compared to our baseline model A, those 113 handcrafted CV features were replaced by deep features extracted from VGG16 [26] convolutional layers’ output. This method achieved an AUC result of 0.70. It’s been known that deep features and traditional CV features are very complementary, therefore, combination of the two methods can potentially improve our performance. In the future, we will investigate the performance improvement by combining those two types of features, and also other type of deep learning techniques such as directly fine-tuning the network with our dataset.
In this study, we designed three new strategies to integrate information from the two other classes of breast disease in the continuous spectrum, ADH and IDC. Although these other classes are clinically different from DCIS, they share some similarities in feature spaces. For Model B, transfer feature selection was implemented where features were not learned from the DCIS data and the result slightly outperformed Model A’s traditional feature selection on the DCIS data. By re-labeling ADH and IDC as part of DCIS, Model C performed even better, likely due to the greater number of cases as well as better class separation during the training. Finally, in Model D a classifier was trained only on ADH and IDC and then transferred to the independent task of classifying pure vs. upstaged DCIS. This provided the best overall performance with AUC of 0.697 which was the only approach that significantly outperformed the baseline Model A. The overall trend suggested that increased incorporation of ADH and IDC into the training phase corresponded with further improvements in upstage prediction.
The three new approaches all used the related classes in an effort to improve performance without overfitting which is important for this difficult classification task with high feature dimensionality relative to a small data set. Although transfer feature selection only slightly improved prediction performance, those features were selected independently on ADH and IDC cases which should minimize over-fitting. On the other hand, feature selection applied on forced labeling and domain adaptation models failed to improve performances compared to these models without feature selection. Specifically, in model C and model D during each cross-validation training session, feature selection was implemented first before testing on the rest fold. In model C, features were selected from a mix of four classes considered as two classes to optimize the classification of the mixed two classes’ model, while in model D, features were selected from ADH and IDC to optimize the classification of these two classes. This implied that although ADH and IDC classes can potentially improve the classification of DCIS upstaging they were still different enough that using those data directly for model fitting as well as additional feature selection led to overfitting toward classifications of ADH and IDC and thus weakened generalization for our intended task of DCIS upstaging. The relationships among [27] these four classes were also explored by creating round robin classifiers to illustrate the separability between each pair of classes. As expected, it was easiest to separate the more obviously different classes of ADH (suspicious benign but with no apparent cancer) and IDC (obvious invasive cancer). Intended task of pure DCIS and upstaged, which are in fact identical at the time of core biopsy as DCIS, and differ only by upstaged cases having additional, hidden invasive cancer. Again, based on that separability, ADH is most similar to pure DCIS, just as IDC is most similar to upstaged DCIS. This ordering of the four classes (ADH, pure DCIS, upstaged DCIS, and finally IDC) was also supported by visualizing the top ranked feature’s distributions. Overall, these trends supported the feasibility of our strategy with transfer feature selection, forced labeling, and domain adaptation. Studies in Alzheimer's disease have applied similar models as Model D, where more obvious normal and serious disease cases were used to inform the difficult classification of those with mild cognitive impairment [15-17]. However, we are the first to conduct a thorough analysis in evaluating all different strategies, including the impact of feature selections, on those “adjacent” classes with limited and noisy data. This has potential implications for beyond this particular problem.
Our current study has several limitations. First, the data set is relatively small compared to the number of feature dimensions. DCIS cases are difficult to accrue because they represent a minority of cancer cases, which are in him a minority of biopsies. Due to limited size of the datasets, each class’s distribution may not represent their global distributions. Thus, designing a robust and complicated model is not trivial and the over-fitting problem is difficult to avoid. Furthermore, although adding ADH and IDC can help performance, our preliminary results suggest that distributions between each paired class differ substantially and cannot be accurately represented. So far, model D is the only one that is significantly better than our baseline. Although we didn’t correct for multiple hypothesis testing for these three comparisons, this level of significance would be very borderline if we had, which is another limitation of this study. Thus, as we progress further towards embedding ADH and IDC to better improve prediction performance of occult invasive disease in DCIS it is important to better understand the relationships of two classification problems; ADH versus IDC, and pure DCIS versus DCIS upstaging respectively. Third, although it’s important to have an independent testing dataset, given the limited number of cases and unbalanced dataset we have, it’s not practical to set aside a separate testing set, because that would greatly increase the variance in performance not only for the cross-validations but also the testing itself. Instead we implemented repeated 5-fold cross-validation to evaluate our models. We are currently collecting additional examples of each class to extend and validate this work.
V. CONCLUSION
In conclusion, this study addresses a common scenario in medical classification, where there are limited patient data and the data are poorly separable. We proposed several innovative strategies to incorporate different but related classes of data towards improving the performance. Specifically, by embedding those related classes into model training in different ways, either with feature selection or directly used as training data, we have shown an improvement compared to the baseline model trained without these additional classes. These enhanced training approaches may be generalizable to other classification tasks facing similar constraints. Although the performance is lower than other familiar radiology applications, trying to predict upstaging is similar to risk or survival, where current clinical practice is close to chance so even modest improvements may enable major paradigm shifts. The ROC AUC of 0.70 of this study is comparable to the best of our related studies using both mammography and MR [25, 27]. Since these approaches are largely independent, it should be possible to improve performance by combining multiple feature sources or building ensemble models. Even with small improvements such as to AUC of 0.75, it may be possible to provide clinically relevant improvements to current prospective trials where less suspicious DCIS cases avoid surgery and instead undergo active surveillance [28].
Acknowledgments
This work was supported in part by NIH/NCI R01-CQA185138, DOD Breast Cancer Research Program W81XWH-14-1-0473, Breast Cancer Research Foundation BCRF-16-183, and Cancer Research UK and Dutch Cancer Society C38317/A24043.
Contributor Information
Rui Hou, Department of Electrical and Computer Engineering and the Department of Radiology, Duke University, Durham, NC, USA, 27705.
Maciej A. Mazurowski, Department of Electrical and Computer Engineering and the Department of Radiology, Duke University.
Lars J. Grimm, Department of Radiology, Duke University
Jeffrey R. Marks, Department of Surgery, Duke University.
Lorraine M. King, Department of Surgery, Duke University.
Carlo C. Maley, School of Life Sciences, Arizona State University.
E. Shelley Hwang, Department of Surgery, Duke University..
Joseph Y. Lo, Department of Radiology and the Department of Electrical and Computer Engineering, Duke University, Durham, NC, USA, 27705
References
- 1.Ali SZ, Surveillance of BIRADS 3 lesions. Breast J, 2017. 23(5): p. 617. [DOI] [PubMed] [Google Scholar]
- 2.Brinton LA, et al. , Recent trends in breast cancer among younger women in the United States. J Natl Cancer Inst, 2008. 100(22): p. 1643–8. [DOI] [PMC free article] [PubMed] [Google Scholar]
- 3.Virnig BA, et al. , Ductal carcinoma in situ of the breast: a systematic review of incidence, treatment, and outcomes. Journal of the National Cancer Institute, 2010. 102(3): p. 170–178. [DOI] [PubMed] [Google Scholar]
- 4.Sanders ME, et al. , The natural history of low-grade ductal carcinoma in situ of the breast in women treated by biopsy only revealed over 30 years of long-term follow-up. Cancer, 2005. 103(12): p. 2481–4. [DOI] [PubMed] [Google Scholar]
- 5.Collins LC, et al. , Outcome of patients with ductal carcinoma in situ untreated after diagnostic biopsy: results from the Nurses' Health Study. Cancer, 2005. 103(9): p. 1778–84. [DOI] [PubMed] [Google Scholar]
- 6.Erbas B, et al. , The natural history of ductal carcinoma in situ of the breast: a review. Breast Cancer Res Treat, 2006. 97(2): p. 135–44. [DOI] [PubMed] [Google Scholar]
- 7.Allred DC, Ductal carcinoma in situ: terminology, classification, and natural history. J Natl Cancer Inst Monogr, 2010. 2010(41): p. 134–8. [DOI] [PMC free article] [PubMed] [Google Scholar]
- 8.Eusebi V, et al. , Long-term follow-up of in situ carcinoma of the breast. Semin Diagn Pathol, 1994. 11(3): p. 223–35. [PubMed] [Google Scholar]
- 9.Bagnall MJ, et al. , Predicting invasion in mammographically detected microcalcification. Clinical radiology, 2001. 56(10): p. 828–832. [DOI] [PubMed] [Google Scholar]
- 10.Grimm LJ. et al. , Imaging Features of Patients Undergoing Active Surveillance for Ductal Carcinoma in Situ. Acad Radiol, 2017. 24(11): p. 1364–1371. [DOI] [PubMed] [Google Scholar]
- 11.Shi B, et al. , Can Occult Invasive Disease in Ductal Carcinoma In Situ Be Predicted Using Computer-extracted Mammographic Features? Academic Radiology, 2017. [DOI] [PMC free article] [PubMed] [Google Scholar]
- 12.Dupont WD and Page DL, Risk factors for breast cancer in women with proliferative breast disease. N Engl J Med, 1985. 312(3): p. 146–51. [DOI] [PubMed] [Google Scholar]
- 13.Hartmann LC, et al. , Benign breast disease and the risk of breast cancer. New England Journal of Medicine, 2005. 353(3): p. 229–237. [DOI] [PubMed] [Google Scholar]
- 14.Cheng B, et al. , Domain transfer learning for MCI conversion prediction. IEEE Transactions on Biomedical Engineering, 2015. 62(7): p. 1805–1817. [DOI] [PMC free article] [PubMed] [Google Scholar]
- 15.Coupé P, et al. , Scoring by nonlocal image patch estimator for early detection of Alzheimer's disease. NeuroImage: clinical, 2012. 1(1): p. 141–152. [DOI] [PMC free article] [PubMed] [Google Scholar]
- 16.Da X, et al. , Integration and relative value of biomarkers for prediction of MCI to AD progression: spatial patterns of brain atrophy, cognitive scores, APOE genotype and CSF biomarkers. NeuroImage: Clinical, 2014. 4: p. 164–173. [DOI] [PMC free article] [PubMed] [Google Scholar]
- 17.Young J, et al. , Accurate multimodal probabilistic prediction of conversion to Alzheimer's disease in patients with mild cognitive impairment. NeuroImage: Clinical, 2013. 2: p. 735–745. [DOI] [PMC free article] [PubMed] [Google Scholar]
- 18.Hou R, et al. Improving classification with forced labeling of other related classes: application to prediction of upstaged ductal carcinoma in situ using mammographic features, in SPIE Medical Imaging. 2018. SPIE. [Google Scholar]
- 19.Zhang E, et al. , Automatic detection of microcalcifications using mathematical morphology and a support vector machine. Biomed Mater Eng, 2014. 24(1): p. 53–9. [DOI] [PubMed] [Google Scholar]
- 20.Bria A, Karssemeijer N, and Tortorella F, Learning from unbalanced data: a cascade-based approach for detecting clustered microcalcifications. Medical image analysis, 2014. 18(2): p. 241–252. [DOI] [PubMed] [Google Scholar]
- 21.Meinshausen N and Bühlmann P, Stability selection. Journal of the Royal Statistical Society: Series B (Statistical Methodology), 2010. 72(4): p. 417–473. [Google Scholar]
- 22.DeLong ER, DeLong DM, and Clarke-Pearson DL, Comparing the areas under two or more correlated receiver operating characteristic curves: a nonparametric approach. Biometrics, 1988. 44(3): p. 837–45. [PubMed] [Google Scholar]
- 23.Crammer K, Kearns M, and Wortman J, Learning from multiple sources. Journal of Machine Learning Research, 2008. 9(August): p. 1757–1774. [Google Scholar]
- 24.Pan SJ and Yang Q, A survey on transfer learning. IEEE Transactions on knowledge and data engineering, 2010. 22(10): p. 1345–1359. [Google Scholar]
- 25.Shi B, et al. , Prediction of occult invasive disease in ductal carcinoma in situ using deep learning features. Journal of the American College of Radiology, 201815(3): p. 527–534. [DOI] [PMC free article] [PubMed] [Google Scholar]
- 26.Simonyan K and Zisserman A, Very deep convolutional networks for large-scale image recognition. arXiv preprint arXiv:1409.1556, 2014. [Google Scholar]
- 27.Zhu Z, et al. , Deep learning analysis of breast MRIs for prediction of occult invasive disease in ductal carcinoma in situ. arXiv preprint arXiv:1711.10577, 2017. [DOI] [PubMed] [Google Scholar]
- 28.Ryser MD, et al. , Cancer Outcomes in DCIS Patients Without Locoregional Treatment. JNCI: Journal of the National Cancer Institute, 2019. [DOI] [PMC free article] [PubMed] [Google Scholar]