

Abstract
Response properties of MT neurons are often studied with “bikinetic” plaid stimuli, which consist of two superimposed sine wave gratings moving in different directions. Oculomotor studies using “unikinetic plaids” in which only one of the two superimposed gratings moves suggest that the eyes first move reflexively in the direction of the moving grating and only later converge on the perceived direction of the moving pattern. MT has been implicated as the source of visual signals that drives these responses. We wanted to know whether stationary gratings, which have little effect on MT cells when presented alone, would influence MT responses when paired with a moving grating. We recorded extracellularly from neurons in area MT and measured responses to stationary and moving gratings, and to their sums: bikinetic and unikinetic plaids. As expected, stationary gratings presented alone had a very modest influence on the activity of MT neurons. Responses to moving gratings and bikinetic plaids were similar to those previously reported and revealed cells selective for the motion of plaid patterns and of their components (pattern and component cells). When these neurons were probed with unikinetic plaids, pattern cells shifted their direction preferences in a way that revealed the influence of the static grating. Component cell preferences shifted little or not at all. These results support the notion that pattern-selective neurons in area MT integrate component motions that differ widely in speed, and that they do so in a way that is consistent with an intersection-of-constraints model.
NEW & NOTEWORTHY Human perceptual and eye movement responses to moving gratings are influenced by adding a second, static grating to create a “unikinetic” plaid. Cells in MT do not respond to static gratings, but those gratings still influence the direction selectivity of some MT cells. The cells influenced by static gratings are those tuned for the motion of global patterns, but not those tuned only for the individual components of moving targets.
Keywords: direction selectivity, electrophysiology, motion integration, motion perception, MT
INTRODUCTION
Neurons in area MT respond selectively to the direction of visual motion (Allman and Kaas 1971; Dubner and Zeki 1971) and integrate signals from direction-selective V1 neurons to compute the two-dimensional motion of objects (Movshon et al. 1985; Movshon and Newsome 1996; Simoncelli and Heeger 1998). The specificity of neuronal responses is limited by what is known as the “aperture problem”: if just a single oriented contour of a moving object is in the receptive field, the neuron can only signal motion orthogonal to the orientation of the contour. Because V1 neurons are orientation selective, they respond to contours of a particular orientation and therefore only measure the motion of individual oriented elements and not the true motion of an object containing elements with several orientations. Recovering the velocity of an object requires the integration of multiple moving contours, a process that seems to begin at the level of MT neurons (Movshon et al. 1985; Khawaja et al. 2009; Rodman and Albright 1987). Some MT neurons, component-direction-selective cells, respond to the individual contour components in the stimulus. Others, pattern-direction-selective cells, respond to the two-dimensional motion of the visual pattern (Movshon et al. 1985). Several models have been proposed to account for this behavior of pattern-selective neurons in response to two-dimensional motion signals. One early model proposes that MT neurons compute the “intersection of constraints” (IOC) established by local motion measurements (Adelson and Movshon 1982; Movshon et al. 1985). Each component of the moving pattern imposes a constraint on the coherent motion of a pattern which can be represented by a line in velocity space. The intersection of these constraint lines gives the motion of a coherent pattern and predicts the direction tuning of pattern cells to plaid stimuli (Fig. 1A). The IOC framework is not a model of the neural computation underlying pattern direction selectivity, but a neuronal model has been formulated by Simoncelli and Heeger (1998) and fit to data in a modified form by Rust et al. (2006) and by Nishimoto and Gallant (2011).
Fig. 1.
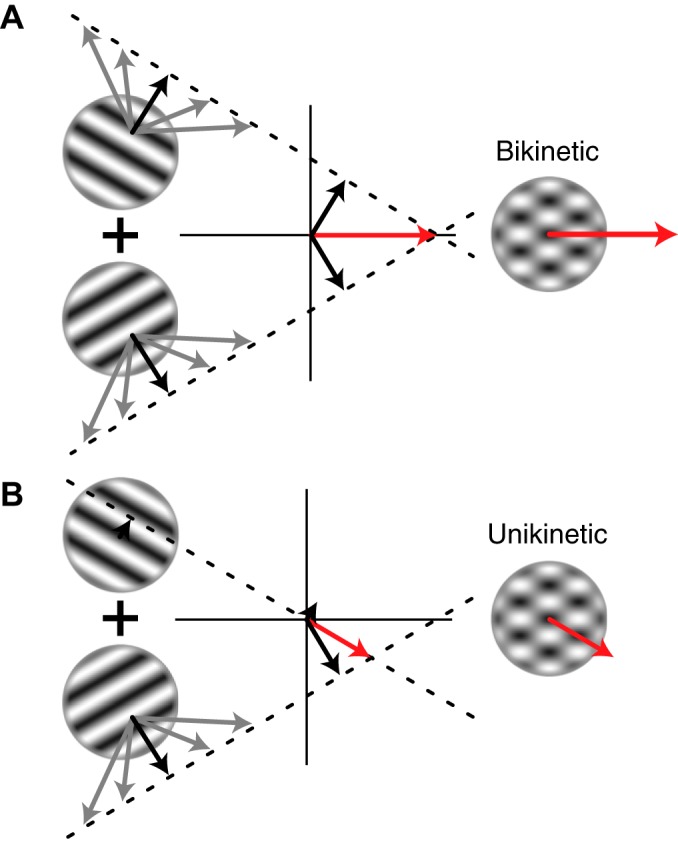
Intersection of constraints (IOC) in velocity space, illustrated for bikinetic and unikinetic plaid stimuli. The perceived motion of visual patterns can be understood within an IOC framework. An individual grating is perceived as moving orthogonal to its orientation, depicted by the black arrows, but this stimulus is also consistent with any number of faster-moving gratings that share the same orthogonal component, indicated by gray arrows. The end points of these arrows, taken together, form a constraint line in velocity space (dashed lines). Connecting the origin of this velocity space with the point where the constraint lines intersect yields the vector (red arrow) that corresponds to the true motion of the stimulus, and to the percept of an unbiased observer who sees the two gratings superimposed. In the case of bikinetic plaids (A), two moving gratings of equal speed are superimposed, so the constraint lines intersect on the horizontal axis, giving the percept of a stimulus moving to the right. In the unikinetic case (B), one moving and one static grating are superimposed. The constraint line imposed by the static grating goes through the origin, shifting the intersection point of the constraint lines 30° off the horizontal, toward the veridical motion vector of the moving grating. The lengths of the red arrows indicate that the unikinetic plaid appears to move more slowly than the bikinetic one.
Much work on the motion integration properties of MT neurons uses “bikinetic plaids,” made by adding two sinusoidal gratings with different orientations, each moving at the same speed (e.g., Khawaja et al. 2009; Movshon et al. 1985; Pack et al. 2001; Smith et al. 2005). In these stimuli, the direction of the plaid always bisects the direction of the two components, and so corresponds to the direction of their vector mean. By varying the relative speed of the two components, however, one can create plaids whose direction of motion deviates from this mean vector, and in the particular case where one component is stationary, the predicted motion of the resulting “unikinetic” plaid is parallel to the orientation of the stationary grating (Fig. 1B). This case is of interest for models of neuronal integration, because static gratings usually evoke only weak responses from motion-sensitive neurons, but both the perceptual experience of motion and the eye movements evoked by it correspond to this prediction (Barthélemy et al. 2008; Dobkins et al. 1998; Quaia et al. 2016), even though the underlying neuronal computation must integrate the motion of two distinct gratings, one moving and one static.
We wanted to know whether MT neuronal selectivity would be determined by the true motion of these unikinetic patterns, so we explored this case in single-neuron recordings from area MT of macaque monkeys, both awake and under opiate anesthesia. This question was explored by Khawaja et al. (2013), who compared responses to gratings and unikinetic plaids and found little effect using conventional measures of pattern selectivity. We found that the tuning of component cells in MT was unaffected by the static stimuli, but that of pattern cells was shifted. However, the observed shifts in direction tuning were usually less than expected, and not large enough to make the tuning invariant to the veridical motion of the stimulus. The shifts in direction tuning persisted even if the moving gratings were introduced after the transient responses to static gratings had ended, suggesting a modulatory influence from signals arising outside of MT.
MATERIALS AND METHODS
Electrophysiology.
We recorded from well-isolated direction-selective neurons in six opiate-anesthetized adult male macaque monkeys (Macaca fascicularis) (“acute preparation”) and one adult female rhesus monkey (Macaca mulatta) that was actively fixating (“awake preparation”). We first describe the methods for the acute preparation and then describe the differences that pertain to the awake preparation. Our general methods for the surgical preparation of animals, single-unit recording, and behavioral monitoring in these preparations correspond to those detailed previously (Cavanaugh et al. 2002; Chukoskie and Movshon 2009; Jazayeri et al. 2012). All procedures followed the National Institute of Health Guide for the Care and Use of Laboratory Animals, were approved and monitored by the New York University Animal Welfare Committee, and complied with the rules and regulations of the United States Department of Agriculture.
Visual stimuli were created on an Apple Mac Pro computer and displayed on a gamma-corrected Eizo T966 cathode-ray tube (CRT) monitor at a refresh rate of 120 Hz at a mean luminance of 30 cd/m2. Stimuli were sinusoidal gratings or plaids of a location, size, and spatial and temporal frequency optimized for each cell, presented within a circular aperture surrounded by mean luminance. We presented single sinusoidal gratings, both moving and static, as well as plaids consisting of two superimposed component gratings in 12 directions around the clock. Our plaids were either bikinetic, where two moving sinusoidal gratings oriented 120° apart were linearly superimposed (Movshon et al. 1985), or unikinetic, which correspond to the bikinetic stimuli in every way except that only one component moved. Stimuli were presented in pseudorandom order in rapid sequence, each for a duration of 330 ms followed by 170 ms of mean luminance. Gratings had a Michelson contrast of 0.5, whereas plaids had a contrast of 1.0. Each stimulus condition was repeated 10–30 times per cell.
Recording procedure and behavior.
Before recording, we determined that our electrode tip was in MT, both by monitoring the well-established landmarks and white/gray matter transitions as the electrode was advanced to MT, and by observing the classical physiological response characteristics of MT neurons: compact contralateral receptive fields, strong direction selectivity, and the expected range of receptive field sizes for the given eccentricity (Albright 1984; Gattass and Gross 1981; Maunsell and Van Essen 1983). In the acute preparation, we placed electrolytic lesions at the conclusion of each experiment, permitting us to verify our recording locations in the superior temporal sulcus. On encountering a neuron, we isolated the spike waveform using a digital window discriminator and mapped the location of the receptive field; most of our receptive field centers were located 3–10° from the fovea. We established the preferred eye and presented the stimuli monocularly, covering the nondominant eye. We then determined the neuron’s preferences for the direction of motion and for temporal and spatial frequency using full-contrast sinusoidal gratings and proceeded with data recording using uni- and bikinetic plaid stimuli. The distance to the monitor varied between 57 and 114 cm, and the screen therefore subtended between 39° and 20°. To estimate the baseline firing rate of a given neuron, 7.5% of the stimulus presentations were blanks consisting of 330 ms of mean luminance.
Quantification of neuronal responses to plaids.
We used standard methods (Movshon et al. 1985) to compute the partial correlation of the actual response to plaids with the predictions of idealized models of pattern and component direction selectivity (rp and rc, respectively). The predicted pattern model response was simply the measured grating tuning curve, suitably rotated. The predicted component model response was the sum of the two baseline-subtracted grating direction tuning curves, each shifted by an amount appropriate for the plaid angle. To stabilize the variance of these correlations, we converted the values to Z scores (Fisher 1915, 1921). For all cells, we computed Zp and Zc, the Z transforms of rp and rc, from the responses to gratings and plaids. Cells for which Zc reliably exceeded both Zp and 0 were classified as component cells, whereas cells for which Zp reliably exceeded Zc and 0 were classified as pattern cells. We computed a pattern index as Zp − Zc.
For bikinetic plaids, the difference between the peaks of the pattern prediction and each lobe of the component prediction is 60°. For unikinetic plaids, the difference between the pattern and component prediction is only 30° (Fig. 2A). Because most MT cells are broadly tuned for direction, the distinction between the responses of pattern and component cells to unikinetic plaids was often difficult to detect. We addressed this problem in two ways. First, we included two distinct sets of unikinetic plaids, “right-handed” and “left-handed,” in which one or the other grating was static. We then took the mean of two computations of Zc and Zp for each cell. Second, we took advantage of these two conditions to examine the rotation of the direction tuning curve that resulted when one plaid component was static. For component cells, the model predicts shifts of tuning 30° clockwise for one condition and 30° anticlockwise for the other. For pattern cells, the model predicts that direction tuning should be invariant to the choice of static grating (Fig. 2A). We measured the tuning curve shifts by rotating the responses to the left-handed and right-handed unikinetic plaids to determine the angle that maximized their correlation and took this value as the “direction tuning rotation,” a figure of merit for the pattern motion computation for unikinetic stimuli. We also computed this rotation by measuring the angular difference in the summed response vectors (O’Keefe and Movshon 1998) for the two unikinetic plaid cases; both measures correlated closely (r = 0.87).
Fig. 2.

Example responses of pattern and component cells to gratings and plaids. A: curves in the center of each stimulus family show the predicted responses of idealized pattern-selective (red) and component-selective (blue) neurons tuned for rightward motion when tested with the stimuli depicted in the ring. These correspond to the conditions used in our experiment. All conditions were tested in 12 directions, although for economy the full set is only shown for the static case. Each column shows responses to a different set of targets. Stationary gratings: MT neurons are generally not strongly responsive or selective for static patterns, so we expect only weak responses, not differing between pattern and component cells and indicated in black. Moving gratings: we expect both pattern and component cells to exhibit a robust unimodal response, represented by the black von Mises function in the center. The motion of each grating is indicated by black arrows. Bikinetic plaids: as in Fig. 1A, these consist of two moving component gratings (the motion of which is indicated by blue arrows) yielding one pattern motion (red arrows). We expect pattern and component cells to exhibit bimodal (component cell) and unimodal (pattern cell) tuning, represented by blue and red von Mises functions. Left- and right-handed unikinetic plaids: as in Fig. 1B, these consist of a moving grating and a stationary one; the left- and right-handed cases differ in which grating is moving. The color scheme is the same as for the bikinetic plaid. We expect both pattern and component cells to exhibit unimodal tuning. The component cells should respond to the moving grating essentially as if the static grating were absent. We therefore expect a difference in preferred direction of 60° between the two kinds of unikinetic plaid. Pattern cells’ tuning should be aligned with the pattern motion, and the difference in preferred directions should be roughly 0°. B–E: responses of 4 representative example cells. Color scheme is same as in A, but pattern and component predictions are depicted by dashed lines, whereas measured responses are solid lines. All cells responded weakly to static gratings and showed classical response characteristics to moving gratings and bikinetic plaids. The component cell (B) responded in a fashion consistent with the component prediction (direction tuning rotation was 52°). The pattern cells (D and E) obeyed the pattern prediction, although not perfectly (direction tuning rotation values of 7° and 16°, respectively). The mixed cell (C) showed classical behavior to moving gratings and bikinetic plaids and would be classified as a pattern cell when stimulated with bikinetic plaids, but when probed with unikinetic plaids, it showed component cell-like behavior (direction tuning rotation of 38°).
Dynamics.
We also included responses to two unikinetic plaids in which the static and moving component gratings were presented with asynchronous onsets. In one condition, the static grating was leading the moving one by 50 ms, and in the other condition, by 100 ms. We analyzed the data from these conditions in sliding 5-ms bins, calculating the vector mean and firing rate for each bin. We calculated the direction tuning rotation for each bin by comparing the vector mean for this bin with the mean tuning for a single moving grating. We then determined the average direction tuning rotation over neurons by calculating the vector mean, weighting the contribution of each neuron by the square root of its firing rate.
Recordings from the alert animal.
To accommodate the generally higher temporal frequency preferences in the awake preparation (Alitto et al. 2011), we used an Iiyama HM204DTA CRT monitor with a refresh rate of 200 Hz. The animal viewed the stimuli binocularly from a distance of 57 cm, at which the screen subtended 39°; we monitored eye movements with an infrared camera system (EyeLink 1000; SR Research). Each trial began with the presentation of a central white spot (diameter 0.2°) for the animal to fixate. Once fixation started, the stimulus sequence commenced, and the animal received periodic liquid rewards. If the animal moved its gaze more than 1° away from the fixation point, stimulus presentation and reward delivery ceased. Once the animal refixated, stimulus presentation resumed.
RESULTS
We recorded from 239 neurons. We used direction tuning rotation to detect and exclude 34 neurons with unreliable tuning (peak correlations of r < 0.82 or a bootstrap-derived standard deviation of more than 25°) from further analysis. Thus we analyzed the responses of 205 units in area MT: 84 from the 6 anesthetized monkeys and 121 from the awake monkey.
After determining the response preferences of each neuron, we measured its response to five stimulus families. Figure 2A shows schematics of the responses expected from idealized pattern and component cells to these five stimulus families. The first column shows response to static flashed gratings at different orientations. The second and third columns show the “standard” comparison of responses to moving gratings and bikinetic plaids (Movshon et al. 1985; Smith et al. 2005). The fourth and fifth columns show responses to the left- and right-handed unikinetic plaids (see materials and methods). The responses of four representative example neurons to these stimulus conditions are shown in Fig. 2, B–E. Figure 2B shows data from a component neuron, the shape of whose tuning for bikinetic plaids closely matches the component prediction. Figure 2C shows data from a neuron with mixed properties. Figure 2, D and E, shows data from pattern neurons, in which the shapes of the plaid tuning curves more closely match the pattern predictions.
The component predictions for bikinetic plaids are computed from sums of the data in the second column of Fig. 2, suitably rotated. Component predictions for unikinetic plaids are computed from sums of data in the first column (responses to static gratings, typically weak and poorly tuned) and the second column. The pattern predictions are simply 30° rotations of the tuning curves to moving gratings in the second column. Inspection of the data for the component cell (Fig. 2B) shows a good correspondence between the tuning for unikinetic plaids and the prediction from the summed responses. In other words, this cell responded to the unikinetic plaids more or less as if the static component were absent. The cell in Fig. 2C (“mixed cell”), which appeared to be pattern selective when tested with bikinetic plaids, shows component-selective-type responses to unikinetic plaids, similar to the cell whose data are shown in Fig. 2B. The remaining two pattern cells (Fig. 2, D and E) showed responses to unikinetic plaids that were closer to the pattern predictions than to the component predictions.
Figure 3 shows the distribution of the Z-transformed partial correlations Zp and Zc for the neurons in our sample for both bikinetic (Fig. 3A) and unikinetic plaids (Fig. 3B). Figure 3A shows that the distribution of neural response characteristics for bikinetic plaids was similar to those previously reported in MT (Khawaja et al. 2009; Movshon et al. 1985; Rust et al. 2006; Smith et al. 2005): 58 pattern cells (28%), 58 component cells (28%), and 89 unclassed cells (43%). The four example neurons whose data are shown in Fig. 2 are indicated, and the data from awake recordings and those from anesthetized animals are identified. Anesthesia had no effect on the distribution of pattern and component direction selectivity (Movshon et al. 2003).
Fig. 3.

Pattern/component classification for bikinetic and unikinetic plaids. A: bikinetic plaids. The ordinate represents the partial correlation of the neural response with the pattern prediction (Zp), and the abscissa represents the partial correlation of neural response with the component prediction (Zc). Black lines indicate the borders of significance that allow a statistical classification of cell behavior. Pattern cells (falling in upper region) are red, and component cells (falling in lower region) are blue; unclassed cells (falling between these regions) are black. Open circles indicate that the cell was recorded in the acute preparation, and closed circles indicate that the cell was recorded under awake conditions. Large black circles indicate the example cells from Fig. 2. B: unikinetic plaids (averaged over both left- and right-handed unikinetic conditions). The cells are colored based on their classification determined with bikinetic plaids.
Figure 3B shows the distribution of neuronal classifications based on data obtained from the same neurons with unikinetic plaids. The data are shifted wholesale down and to the right compared with compared with those in Fig. 3A. By this measure, only a few neurons were “truly” pattern selective, in that they retained their selectivity when unikinetic plaids were used. However, this classification method works poorly when the two predictions being distinguished are very similar. Consider Fig. 2, and note the small difference between the predictions for pattern and component cell responses to unikinetic plaids. In the face of normal response variability, differences of this magnitude can be difficult to distinguish, which makes classification challenging.
It is therefore not surprising that many neurons previously classified as either pattern or component direction selective with bikinetic plaids appear unclassed when tested with unikinetic plaids. This effect was more prominent in pattern cells, probably because their direction tuning tends to be broader than that of component cells (Smith et al. 2005). In quantitative terms, only 7 of the 205 cells (3%) of the total sample were pattern direction selective under conditions of unikinetic stimulation. Component cells under these conditions numbered 107, 52% of the total sample. Finally, the proportion of unclassed cells remained essentially unchanged at 44%. To summarize, there appear to be dramatic shifts away from the pattern category when responses are measured with unikinetic plaids. This observation is consistent with a report by Khawaja et al. (2013), who noted a qualitatively similar shift from pattern to component selectivity in MT neurons when probing them with unikinetic plaids. However, this analysis underestimates the true amount of pattern motion information in the responses of MT cells to unikinetic plaids.
We realized that the essential feature of pattern selectivity for unikinetic plaids is that the neuronal tuning should remain invariant to the composition of the plaid, whereas component-selective neurons’ tuning should shift 30° counterclockwise for the left-handed plaid and 30° clockwise for the right-handed plaid, 60° in all (Fig. 2A). We decided to use this doubled shift (hereafter “direction tuning rotation”) in preferred direction as a figure of merit by comparing the empirical response of MT neurons with these predictions.
Figure 4 shows this direction tuning rotation plotted against the pattern index measured with bikinetic plaids. An ideal component cell whose tuning curve shifted by the full 30° for each unikinetic plaid would have a direction tuning rotation of 60°, assuming that the response to static gratings was unselective, as was typical (Fig. 2); its directional preference would be determined by the moving component. An ideal pattern cell would show no shift and would have a direction tuning rotation of 0; its response would be determined by the true motion of the plaid. The data in Fig. 4 show the expected negative slope, and the correlation is highly significant (r = −0.39, n = 205, P < 0.0001). On closer examination, many component cells behave as expected, with direction tuning rotations near 60°. Few pattern cells have direction tuning rotations near 0°; instead, most (like the example cells whose data are presented in Fig. 2) show incomplete shifts in direction preference toward the direction defined by the static grating. It is as if the pattern-direction-selective ideal for these cells can only be imperfectly approximated when one of the component gratings is static.
Fig. 4.

Pattern index predicts the rotation of direction preference induced by static stimuli. The abscissa gives the pattern index (Zp − Zc) for bikinetic plaids, and the ordinate gives the direction preference difference between responses to left- and right-handed unikinetic plaids. Data from the alert animal are depicted in orange, and data from the anesthetized animals are represented in green; error bars represent the bootstrapped standard deviations of the estimates for pattern index and rotation. Solid lines represent the lines of best fit (Press et al. 1992) for the two groups of cells. Arrows show the direction tuning rotation expected from idealized pattern and component cells (Fig. 2A). Black circles indicate the example cells from Fig. 2. Shaded background colors indicate the ranges of pattern and component cells as displayed in Fig. 3.
The data from anesthetized and alert recordings (Fig. 4) were subtly different, with data from alert recordings showing a more pronounced negative slope. This difference is captured by the fitted lines, computed based on the bootstrapped standard deviations of the values (error bars). The difference in the slopes approaches but fails to reach significance in a permutation test (P = 0.0759). Full pattern motion coding for unikinetic stimuli, indicated by direction tuning rotations near 0°, is however evident only for data from alert animals, but the variability of the data could obscure a similar representation under anesthesia.
In Fig. 2, we showed that static gratings presented alone evoked only weak responses from MT cells, yet for pattern-direction-selective cells they had a potent influence on directional preference. We noticed that the response to static gratings was not only weak but transient, disappearing within 50–100 ms. We therefore decided to examine the time course of the static grating’s influence on direction tuning, by delaying the onset of the moving grating and measuring the variation in direction tuning over time; conceptually similar measurements on ocular following behavior were made by Quaia et al. (2016), although they used flickering rather than static stationary gratings.
Figure 5 shows the design and results of this experiment. In Fig. 5A, we represent the experimental design: at the start of each trial, we switched on a static grating. In one condition, we left that grating on screen for 250 ms. In three other conditions, we added a moving grating, either synchronously, with 50-ms delay, or with 100-ms delay. We took all the data (from 84 neurons recorded from anesthetized animals and 121 neurons recorded from the alert animal) and extracted the responses for the condition in which the moving grating moved in the cell’s preferred direction. Figure 5, B and C, shows (for alert and anesthetized data, respectively) the mean of the responses of the neuronal population. The mean response to the static grating alone showed a brief transient that returned to baseline roughly 100 ms after stimulus onset. The responses to the static-moving compound gratings were all elevated above the response to the static grating alone, and all converged on the same elevated value by the end of the measurement, 250 ms after stimulus onset.
Fig. 5.

Time course of responses and tuning preferences for asynchronously presented compound stimuli. A: experimental design. At the start of all trials, we introduced a static grating (gray arrow). For trials with compound stimuli, we added a moving grating with an orientation 60° different from the static grating either synchronously (red) or with a delay of 50 or 100 ms (blue or cyan, respectively). B and C: mean firing rates evoked by optimal single gratings and plaids containing those gratings for 121 cells from the alert animal (B) and for 84 cells from the anesthetized animal (C) for the 4 stimulus conditions schematized in A, computed at 1-ms intervals within a 5-ms sliding window. D and E: mean direction tuning to moving stimuli for the neuronal populations (alert, D; anesthetized, E). We rotated the tuning data for all neurons so that the preferred direction for single gratings was aligned at horizontal (indicated as 30°) and estimated the population preferred direction within the same 5-ms sliding window. The preferred direction is plotted only for times past the time at which the estimate for each stimulus had stabilized.
As described in materials and methods, we rotated the data for each cell so that the preferred direction for gratings was aligned (drawn as rightward in Fig. 5A and denoted as 30° for consistency with Fig. 4). We then computed the population vector preferred direction and compared it with that of a moving grating presented alone. The traces of this “tuning rotation” for the three compound stimuli are shown for alert and anesthetized recordings in Fig. 5, D and E. We averaged data from all cells: pattern, component, and unclassed; separate analysis of these cell groups did not reveal a different pattern of dynamics. The population preferred direction, as indicated by the arrows, therefore falls between the value of 30°, corresponding to the pure component direction (horizontal), and 0°, corresponding to the pure pattern direction (oblique). The population preferred direction is stably maintained from the onset of tuning to the end of the measurement period. Note that the population preferred direction is the same whether the moving grating is synchronous with the static grating or is delayed by either 50 or 100 ms. It is especially striking to note that for the 100-ms condition, the neuronal response to the static grating had completely ended (Fig. 5, B and C), yet the influence of this static component on the population preferred direction was undiminished.
These results raise the question of how the shift in preferred direction produced by the static grating is mediated, since it evokes no response. From Fig. 5, it seems clear that it cannot be mediated by spiking in MT itself, suggesting the involvement of neurons in other areas in the encoding of the direction of unikinetic plaids, perhaps neurons in the ventral stream of visual processing that exhibit a more sustained response to static stimuli.
DISCUSSION
We extended the exploration of pattern motion sensitivity in MT neurons. Unlike their afferents from V1, some MT neurons combine motion signals in a way that makes them sensitive to the motion of compound stimuli. This renders pattern cells, at least in the ideal case, sensitive only to the direction, but not to the spatial composition, of the moving stimulus. This invariant sensitivity is captured by measuring responses to gratings and to plaids made by summing two gratings; in most previous studies those two gratings have moved at the same speed to create bikinetic or “type I” plaids (Khawaja et al. 2009; Movshon et al. 1985; Rodman and Albright 1987; Rust et al. 2006; Wilson et al. 1992). In the present study we have included unikinetic plaids, in which only one of the component gratings moves. These “type II” plaids have the interesting property that their direction of motion deviates from the sum of the motion vectors of their components, and they have been used extensively in both perceptual and oculomotor experiments (Barthélemy et al. 2008, 2010; Ferrera and Wilson 1987, 1990; Wilson et al. 1992; Yo and Wilson 1992). They are conceptually similar to “barber-pole” stimuli, in which the direction of motion of an oblique grating follows the borders of a narrow bounding window (Adelson and Movshon 1983; Guilford 1929; Masson et al. 2000; Wallach 1935).
Unikinetic plaids are more than mere parametric extensions of conventional plaids. They are interesting for the exploration of motion integration, because they create cases in which the percept of a moving stimulus is modified by a static one. We wanted to know whether the striking perceptual effects reported with these stimuli were reflected in the responses of neurons in MT: MT neurons compute pattern motion for bikinetic plaids in which both components evoke responses independently; we wondered whether they would also compute pattern motion when one component is static, given that MT neurons respond poorly to stimuli that do not move.
Our results show that the responses of MT pattern cells are indeed influenced by static targets in the receptive field, even though these evoke weak responses by themselves; this influence is not seen for component neurons. However, this effect is not easy to detect with conventional methods for classifying pattern direction selectivity, because the response of MT neurons to static stimuli is weak, which renders predictions based on the response to the static component unreliable. Thus the standard analysis of the shapes of tuning curves for plaids and their component gratings works poorly when one of the gratings is static (Fig. 3), leading to the false impression that stopping the motion of one grating turns most MT cells into component cells. A more sensitive measure of pattern motion sensitivity in unikinetic plaids is the angle by which the preferred direction is rotated by the addition of a static grating (Fig. 4). Whereas the comparison of tuning in the standard analysis (Fig. 3) depends on shape details for two similar curves, the tuning rotation measure requires only an estimate of preferred direction and is therefore less vulnerable to noise. Because considerable variability can always be expected to be present (Taouali et al. 2016), tuning rotation is a more robust and thus more suitable metric of neural responses to bikinetic versus unikinetic plaids. Pattern cells approach but rarely achieve perfect invariance in their direction tuning for unikinetic plaid stimuli, but they approach that ideal for moving stimuli in general. These results are broadly consistent with those of Pack et al. (2004), who observed shifts in the tuning of MT responses to barber-pole stimuli but did not distinguish pattern from component cells.
Our findings have implications for functional theories of the properties of neurons in area MT. Simoncelli and Heeger (1998) proposed that the responses of pattern cells in MT could be accounted for by assuming that they pool the responses of a set of V1 afferents whose selectivity for spatiotemporal frequency is arranged so that they tile the plane in three-dimensional spatiotemporal frequency space that corresponds to a particular direction and speed of motion. The original characterization of pattern direction selectivity with plaids (Movshon et al. 1985) probes the tiling of this plane by testing two components of the same velocity, leaving much of this stimulus space unexplored. Efforts to characterize the complete three-dimensional frequency structure of the inputs to pattern cells have suggested that the tiling of this plane is often incomplete, being attenuated near the zero-temporal-frequency plane where static stimuli reside (Nishimoto and Gallant 2011; Zaharia et al. 2019). This may not be unexpected. V1 neurons that provide much of the input to MT are directionally selective and respond poorly to static stimuli (Movshon and Newsome 1996). Also, pattern neurons in MT respond poorly to stimuli that do not move (Rodman and Albright 1987; Rust et al. 2006; see Figs. 2 and 5).
Our results suggest that the responses of pattern cells do reflect information from cells responding to static stimuli (near-zero temporal frequency), but they do so both implicitly and incompletely. The results in Fig. 5 show that static gratings evoke a transient response that falls rapidly back to baseline, yet the influence of those static gratings on direction preference persists. This influence must therefore be implicit and nonlinear, and might reflect a modulatory influence from cells that respond better to the static stimuli than MT cells do. It is interesting to speculate about the source of this sustained signal, which might arise from a parallel cortical stream (e.g., through V2; Ponce et al. 2008) or from direct thalamic input to MT from the koniocellular lateral geniculate nucleus (Sincich et al. 2004). Moreover, as shown by Khawaja et al. (2013), pattern responses are more robust in MST than in MT; it is unclear how MST would receive this signal: directly, from MT, or indirectly, from a yet to be characterized path, or from both? The influence of the static grating in MT is also incomplete, because only in rare cases do MT cells show completely invariant direction tuning (Fig. 4). Consider the neurons whose pattern index is much greater than zero, the unambiguous pattern cells. If these cells all integrated zero-temporal-frequency information perfectly, they would all have direction tuning rotation values near 0°. In reality, their direction tuning rotations are dispersed over the entire range from 0° to 60°; few neurons exhibit the idealized pattern of responses that could be expected from the Simoncelli-Heeger model.
Finally, we note that our results were qualitatively similar in both acute and awake preparations, despite rather different dynamics and response magnitudes (evident in Fig. 5, cf. Alitto et al. 2011). This similarity suggests that attentional or top-down effects, which are diminished or absent in anesthetized animals, had little influence on the general pattern of results.
How might our results relate to human perception and visually guided action? Humans misjudge the motion of briefly presented lines to be orthogonal to their orientation (Lorenceau et al. 1993). Moreover, measurements of short-latency ocular following in humans and monkeys reveal that the initial tracking of the motion of unikinetic plaids is in the direction orthogonal to the moving component; then, after 10–20 ms, the direction of tracking rotates to match the true pattern motion (Barthélemy et al. 2008, 2010). Our results show, as expected, that component cells can only provide a signal to drive eye tracking of the direction of the moving single grating, whereas pattern cells could in principle signal the true direction of motion. If the responses of pattern cells were delayed compared with those of component cells, then both the perceptual and the ocular following results could be explained. Interestingly, in earlier work from our laboratory (Smith et al. 2005), we showed that component cells have slightly shorter visual latencies than pattern cells, and we further showed that pattern cells’ tuning does not fully stabilize for some time after response onset. Our conclusions are therefore consistent with the hypothesis that signals from MT cells contribute to the perception of motion and to the control of visually guided action.
GRANTS
This work was supported by NIH Grants R01 EY02017 and R01 EY04440 (to J. A. Movshon) and NIH Fellowship F32 EY019833 (to P. Wallisch).
DISCLOSURES
No conflicts of interest, financial or otherwise, are declared by the authors.
AUTHOR CONTRIBUTIONS
P.W. and J.A.M. conceived and designed research; P.W. performed experiments; P.W. analyzed data; P.W. and J.A.M. interpreted results of experiments; P.W. and J.A.M. prepared figures; P.W. and J.A.M. drafted manuscript; P.W. and J.A.M. edited and revised manuscript; P.W. and J.A.M. approved final version of manuscript.
ACKNOWLEDGMENTS
We thank Frédéric Chavane for comments on an earlier version of the manuscript, Romesh Kumbhani for help with recordings, and the members of the Movshon laboratory for assistance.
REFERENCES
- Adelson EH, Movshon JA. Phenomenal coherence of moving visual patterns. Nature 300: 523–525, 1982. doi: 10.1038/300523a0. [DOI] [PubMed] [Google Scholar]
- Adelson EH, Movshon JA. The perception of coherent motion in two-dimensional patterns. Proceedings of the Association of Computing Machinery Interdisciplinary Workshop on Motion: Representation and Perception. Toronto, Canada, April 4–6, 1983, p. 11–14. [Google Scholar]
- Albright TD. Direction and orientation selectivity of neurons in visual area MT of the macaque. J Neurophysiol 52: 1106–1130, 1984. doi: 10.1152/jn.1984.52.6.1106. [DOI] [PubMed] [Google Scholar]
- Alitto HJ, Moore BD 4th, Rathbun DL, Usrey WM. A comparison of visual responses in the lateral geniculate nucleus of alert and anaesthetized macaque monkeys. J Physiol 589: 87–99, 2011. doi: 10.1113/jphysiol.2010.190538. [DOI] [PMC free article] [PubMed] [Google Scholar]
- Allman JM, Kaas JH. A representation of the visual field in the caudal third of the middle tempral gyrus of the owl monkey (Aotus trivirgatus). Brain Res 31: 85–105, 1971. doi: 10.1016/0006-8993(71)90635-4. [DOI] [PubMed] [Google Scholar]
- Barthélemy FV, Fleuriet J, Masson GS. Temporal dynamics of 2D motion integration for ocular following in macaque monkeys. J Neurophysiol 103: 1275–1282, 2010. doi: 10.1152/jn.01061.2009. [DOI] [PubMed] [Google Scholar]
- Barthélemy FV, Perrinet LU, Castet E, Masson GS. Dynamics of distributed 1D and 2D motion representations for short-latency ocular following. Vision Res 48: 501–522, 2008. doi: 10.1016/j.visres.2007.10.020. [DOI] [PubMed] [Google Scholar]
- Cavanaugh JR, Bair W, Movshon JA. Nature and interaction of signals from the receptive field center and surround in macaque V1 neurons. J Neurophysiol 88: 2530–2546, 2002. doi: 10.1152/jn.00692.2001. [DOI] [PubMed] [Google Scholar]
- Chukoskie L, Movshon JA. Modulation of visual signals in macaque MT and MST neurons during pursuit eye movement. J Neurophysiol 102: 3225–3233, 2009. doi: 10.1152/jn.90692.2008. [DOI] [PMC free article] [PubMed] [Google Scholar]
- Dobkins KR, Stoner GR, Albright TD. Perceptual, oculomotor, and neural responses to moving color plaids. Perception 27: 681–709, 1998. doi: 10.1068/p270681. [DOI] [PubMed] [Google Scholar]
- Dubner R, Zeki SM. Response properties and receptive fields of cells in an anatomically defined region of the superior temporal sulcus in the monkey. Brain Res 35: 528–532, 1971. doi: 10.1016/0006-8993(71)90494-X. [DOI] [PubMed] [Google Scholar]
- Ferrera VP, Wilson HR. Direction specific masking and the analysis of motion in two dimensions. Vision Res 27: 1783–1796, 1987. doi: 10.1016/0042-6989(87)90107-6. [DOI] [PubMed] [Google Scholar]
- Ferrera VP, Wilson HR. Perceived direction of moving two-dimensional patterns. Vision Res 30: 273–287, 1990. doi: 10.1016/0042-6989(90)90043-K. [DOI] [PubMed] [Google Scholar]
- Fisher RA. Frequency distribution of the values of the correlation coefficient in samples from an indefinitely large population. Biometrika 10: 507–521, 1915. doi: 10.2307/2331838. [DOI] [Google Scholar]
- Fisher RA. On the probable error of a coefficient of correlation deduced from a small sample. Metron 1: 3–32, 1921. [Google Scholar]
- Gattass R, Gross CG. Visual topography of striate projection zone (MT) in posterior superior temporal sulcus of the macaque. J Neurophysiol 46: 621–638, 1981. doi: 10.1152/jn.1981.46.3.621. [DOI] [PubMed] [Google Scholar]
- Guilford JP. Illusory movement from a rotating barber pole. Am J Psychol 41: 686, 1929. doi: 10.2307/1414763. [DOI] [Google Scholar]
- Jazayeri M, Wallisch P, Movshon JA. Dynamics of macaque MT cell responses to grating triplets. J Neurosci 32: 8242–8253, 2012. doi: 10.1523/JNEUROSCI.5787-11.2012. [DOI] [PMC free article] [PubMed] [Google Scholar]
- Khawaja FA, Liu LD, Pack CC. Responses of MST neurons to plaid stimuli. J Neurophysiol 110: 63–74, 2013. doi: 10.1152/jn.00338.2012. [DOI] [PubMed] [Google Scholar]
- Khawaja FA, Tsui JM, Pack CC. Pattern motion selectivity of spiking outputs and local field potentials in macaque visual cortex. J Neurosci 29: 13702–13709, 2009. doi: 10.1523/JNEUROSCI.2844-09.2009. [DOI] [PMC free article] [PubMed] [Google Scholar]
- Lorenceau J, Shiffrar M, Wells N, Castet E. Different motion sensitive units are involved in recovering the direction of moving lines. Vision Res 33: 1207–1217, 1993. doi: 10.1016/0042-6989(93)90209-F. [DOI] [PubMed] [Google Scholar]
- Masson GS, Rybarczyk Y, Castet E, Mestre DR. Temporal dynamics of motion integration for the initiation of tracking eye movements at ultra-short latencies. Vis Neurosci 17: 753–767, 2000. doi: 10.1017/S0952523800175091. [DOI] [PubMed] [Google Scholar]
- Maunsell JH, Van Essen DC. Functional properties of neurons in middle temporal visual area of the macaque monkey. I. Selectivity for stimulus direction, speed, and orientation. J Neurophysiol 49: 1127–1147, 1983. doi: 10.1152/jn.1983.49.5.1127. [DOI] [PubMed] [Google Scholar]
- Movshon JA, Adelson EH, Gizzi MS, Newsome WT. The analysis of moving visual patterns. In: Pattern Recognition Mechanisms: Proceedings of a Study Week/Organized by The Pontifical Academy of Sciences, Casina Pius IV, Vatican City, edited by Chagas C, Gattass R, Gross C. Berlin: Springer, 1985. [Google Scholar]
- Movshon JA, Albright TD, Stoner GR, Majaj NJ, Smith MA. Cortical responses to visual motion in alert and anesthetized monkeys. Nat Neurosci 6: 3, 2003. doi: 10.1038/nn0103-3a. [DOI] [PubMed] [Google Scholar]
- Movshon JA, Newsome WT. Visual response properties of striate cortical neurons projecting to area MT in macaque monkeys. J Neurosci 16: 7733–7741, 1996. doi: 10.1523/JNEUROSCI.16-23-07733.1996. [DOI] [PMC free article] [PubMed] [Google Scholar]
- Nishimoto S, Gallant JL. A three-dimensional spatiotemporal receptive field model explains responses of area MT neurons to naturalistic movies. J Neurosci 31: 14551–14564, 2011. doi: 10.1523/JNEUROSCI.6801-10.2011. [DOI] [PMC free article] [PubMed] [Google Scholar]
- O’Keefe LP, Movshon JA. Processing of first- and second-order motion signals by neurons in area MT of the macaque monkey. Vis Neurosci 15: 305–317, 1998. doi: 10.1017/S0952523898152094. [DOI] [PubMed] [Google Scholar]
- Pack CC, Berezovskii VK, Born RT. Dynamic properties of neurons in cortical area MT in alert and anaesthetized macaque monkeys. Nature 414: 905–908, 2001. doi: 10.1038/414905a. [DOI] [PubMed] [Google Scholar]
- Pack CC, Gartland AJ, Born RT. Integration of contour and terminator signals in visual area MT of alert macaque. J Neurosci 24: 3268–3280, 2004. doi: 10.1523/JNEUROSCI.4387-03.2004. [DOI] [PMC free article] [PubMed] [Google Scholar]
- Ponce CR, Lomber SG, Born RT. Integrating motion and depth via parallel pathways. Nat Neurosci 11: 216–223, 2008. doi: 10.1038/nn2039. [DOI] [PMC free article] [PubMed] [Google Scholar]
- Press WH, Teukolsky SA, Vetterling WT, Flannery BP. Numerical Recipes in C++: The Art of Scientific Computing (2nd ed). Cambridge, UK: Cambridge University Press, 1992, p. 671–675. [Google Scholar]
- Quaia C, Optican LM, Cumming BG. A motion-from-form mechanism contributes to extracting pattern motion from plaids. J Neurosci 36: 3903–3918, 2016. doi: 10.1523/JNEUROSCI.3398-15.2016. [DOI] [PMC free article] [PubMed] [Google Scholar]
- Rodman HR, Albright TD. Coding of visual stimulus velocity in area MT of the macaque. Vision Res 27: 2035–2048, 1987. doi: 10.1016/0042-6989(87)90118-0. [DOI] [PubMed] [Google Scholar]
- Rust NC, Mante V, Simoncelli EP, Movshon JA. How MT cells analyze the motion of visual patterns. Nat Neurosci 9: 1421–1431, 2006. doi: 10.1038/nn1786. [DOI] [PubMed] [Google Scholar]
- Simoncelli EP, Heeger DJ. A model of neuronal responses in visual area MT. Vision Res 38: 743–761, 1998. doi: 10.1016/S0042-6989(97)00183-1. [DOI] [PubMed] [Google Scholar]
- Sincich LC, Park KF, Wohlgemuth MJ, Horton JC. Bypassing V1: a direct geniculate input to area MT. Nat Neurosci 7: 1123–1128, 2004. doi: 10.1038/nn1318. [DOI] [PubMed] [Google Scholar]
- Smith MA, Majaj NJ, Movshon JA. Dynamics of motion signaling by neurons in macaque area MT. Nat Neurosci 8: 220–228, 2005. doi: 10.1038/nn1382. [DOI] [PubMed] [Google Scholar]
- Taouali W, Benvenuti G, Wallisch P, Chavane F, Perrinet LU. Testing the odds of inherent vs. observed overdispersion in neural spike counts. J Neurophysiol 115: 434–444, 2016. doi: 10.1152/jn.00194.2015. [DOI] [PMC free article] [PubMed] [Google Scholar]
- Wallach H. Über visuell wahrgenommene Bewegungsrichtung. Psychol Res 20: 325–380, 1935. doi: 10.1007/BF02409790. [DOI] [Google Scholar]
- Wilson HR, Ferrera VP, Yo C. A psychophysically motivated model for two-dimensional motion perception. Vis Neurosci 9: 79–97, 1992. doi: 10.1017/S0952523800006386. [DOI] [PubMed] [Google Scholar]
- Yo C, Wilson HR. Perceived direction of moving two-dimensional patterns depends on duration, contrast and eccentricity. Vision Res 32: 135–147, 1992. doi: 10.1016/0042-6989(92)90121-X. [DOI] [PubMed] [Google Scholar]
- Zaharia AD, Goris RL, Movshon JA, Simoncelli EP. Compound stimuli reveal the structure of visual motion selectivity in macaque MT neurons (Preprint). BioRxiv 692533, 2019. doi: 10.1101/692533. [DOI] [PMC free article] [PubMed]