

Summary
Targeted GBS is a recent approach for obtaining an effective characterization for hundreds to thousands of markers. The high throughput of next‐generation sequencing technologies, moreover, allows sample multiplexing. The aims of this study were to (i) define a panel of single nucleotide polymorphisms (SNPs) in the cat, (ii) use GBS for profiling 16 cats, and (iii) evaluate the performance with respect to the inference using standard approaches at different coverage thresholds, thereby providing useful information for designing similar experiments. Probes for sequencing 230 variants were designed based on the Felis_catus_8.0. 8.0 genome. The regions comprised anonymous and non‐anonymous SNPs. Sixteen cat samples were analysed, some of which had already been genotyped in a large group of loci and one having been whole‐genome sequenced in the 99_Lives Cat Genome Sequencing Project. The accuracy of the method was assessed by comparing the GBS results with the genotypes already available. Overall, GBS achieved good performance, with 92–96% correct assignments, depending on the coverage threshold used to define the set of trustable genotypes. Analyses confirmed that (i) the reliability of the inference of each genotype depends on the coverage at that locus and (ii) the fraction of target loci whose genotype can be inferred correctly is a function of the total coverage. GBS proves to be a valid alternative to other methods. Data suggested a depth of less than 11× is required for greater than 95% accuracy. However, sequencing depth must be adapted to the total size of the targets to ensure proper genotype inference.
Keywords: DNA profiling, Felis catus, genotyping‐by‐sequencing, single nucleotide polymorphisms
Introduction
The global pet care market size (major segments including food, veterinary care and over‐the‐counter products) was estimated at USD 131.7 billion in 2016 and is expected to reach USD 202.6 billion by 2025, an estimated growth of 4.9% calculated with the Compound Annual Growth Rate (https://www.grandviewresearch.com/press-release/global-pet-care-market, March 2018). Cats are increasingly appreciated as pets because they are known for helping reduce stress and anxiety and for having strong interactions with humans (Hart et al. 2018). In this context, fancy breeds are becoming more and more popular worldwide. In pedigreed cats, studbooks can recommend a DNA‐based control of both animal identity and traits of interest for enrolment and selection, together with a permanent electronic identification. The International Society of Animal Genetics (ISAG) fosters the definition and nomenclature standardization of panels of genetic markers for the identification and parentage control of domestic animals, including cats (Lipinski et al. 2007; https://www.isag.us/committees.asp). These panels are used by service laboratories for owners and breeder association requirements. Recently, ISAG introduced single nucleotide polymorphisms (SNPs) as additional markers for the cat genetic profiling and parentage test after more than a decade of exclusively using microsatellites (short tandem repeats (STRs); Lipinski et al. 2007). As novel polymorphisms affecting health and morphology are discovered, the identification of carriers is a growing problem, which requires versatile approaches when regions of interests must be added or changed rapidly. The simultaneous analysis of mutations and neutral markers that define cat identity allows a univocal match between the animal and the biological profile, helping to avoid mistakes and fraud. Following this line of reasoning, and under the expectation of a huge increase in the number of documented trait‐associated polymorphisms, a targeted GBS approach was implemented. Such a method can probably be used effectively at reasonable costs.
Genotyping by sequencing has been widely used in plants as a valid alternative to the currently available genotyping technologies for molecular marker discovery, genome‐wide associations (Zhang et al. 2015), genomic diversity analyses (Pembleton et al. 2016) and breeding programmes (He et al. 2014; Kim et al. 2016). GBS can also be applied successfully to animal genomes (De Donato et al. 2013; Gurgul et al. 2018). GBS has been used recently in animals, even when no SNP chips were available. Moreover, GBS has been demonstrated to be an effective method for genome‐wide SNP discovery and genotyping, opening the door to inbreeding control and genomic selection, for example in Peking duck and Indian cattle (Zhu et al. 2016; Malik et al. 2018).
Genotyping by sequencing is a targeted multiplexed approach exploiting the extremely high throughput of next‐generation sequencing (NGS), whereby a high number of regions of interest (for instance containing variants) are simultaneously enriched using specifically designed probes, amplified and then sequenced. After demultiplexing and quality control, bioinformatic analyses are performed to infer the genotypes at the variant loci. In humans, GBS showed high accuracy in the detection of mutations in patients with suspected genetic disorders and has been proposed for the diagnosis of more than 500 Mendelian diseases (Liu et al. 2015). The GBS approach can also be expanded to the monitoring of predisposition to polygenic disease or complex disease (Guan et al. 2015).
In the present work, the design and the data analysis of a customized GBS panel for the genomic profiling of the domestic cat is reported.
Materials and methods
Samples
Sixteen genomic DNA Felis catus samples were analysed. Thirteen samples (Cat_1–13) from British Shorthair cats were provided by an Australian service laboratory (Orivet). Two came from the Animal Tissue and DNA Repository at the University of Milan, Italy (Cat_14–15), and one, from an Abyssinian cat (Cat_16), was part of the cat whole genome sequencing (WGS) 99 Lives Cat Genome Sequencing Initiative (NCBIe accession no. SRR6997541).
Genomic DNA had been extracted from tissue samples using a DNeasy Blood and Tissue Kit (Qiagen), according to the company instructions. The DNA was quantified with Qubit (Thermo Fisher Scientific) and adjusted to 25 ng/μl. Approximately 50 ng was used for genotyping each sample.
Genomic target
Cat‐specific DNA variants (n = 230) were targeted, partially obtained by screening the references in OMIA (https://omia.org/home/) and relevant reviews (Lyons 2010, 2012, 2015). SNP1–SNP120 had already been genotyped by Orivet using probes designed based on Felis_catus_6.2 (accession no. GCA_000181335.2; Montague et al. 2014) and the Agena Biosciences iPLEX Gold Genotyping kit, as previously described (Oh et al. 2017) and shown in Table S1. STR loci (no. 19) were included in the 230 variants (Lipinski et al. 2007). The genotypes at all of the target loci were also already available for Cat_16 from its WGS.
DNA sequences of approximately 500 bp and including the target loci were manually downloaded from the genome cat assembly ICGSC Felis_catus_8.0/Felcat8 (https://genome.ucsc.edu/cgi-bin/hgGateway; Kent et al. 2002). The genome positions of the target variants were submitted to Agilent Technology for the SureSelectQXT Target Enrichment custom panel design, with a tier of 1–449 kb and a maximum of 57 680 probes (hereinafter the target probes) being requested. The Agilent custom kit included the design and production of five target probes of 120 bp for each target locus. Target probes were then manually controlled for correct design using integrated genome browser (Affymetrix Inc. Research).
Sequencing data output and analysis
Paired reads obtained from the sequencing were combined using flash whenever they overlapped (Magoč & Salzberg 2011), setting minimum and maximum overlap to 10 and 150 nucleotides respectively. The resulting reads were aligned to the genome cat assembly ICGSC Felis_catus_8.0/Felcat8 using bowtie2 (Langmead & Salzberg 2012), and the bcftools suite (Li 2011) was used to obtain the consensus base calling for the covered positions. In detail, bcftools mpileup was used to calculate the likelihood of the alignments present in each position. With bcftools call, using multiallelic caller option, the SNPs were called and the genotypes of the target genome positions were obtained. Informative values associated with the genotypes, such as the likelihood of the second most likely genotype (an indication of the robustness of the reported genotype inference) and the read coverage, were extracted and analysed in R (R Core Team 2013).
Comparisons of the GBS results with those from the Agena Mass Array (hereinafter named Reference) were based on 120 markers and involved 13 common samples (Cat_1–13), whereas the comparison with the WGS involved only the corresponding sample (Cat_16) in the GBS panel and comprised all of the markers. All of the comparisons were performed using custom‐made R scripts.
Results
All of the target probes were successfully designed for all 230 regions. The libraries passed the quality controls, and the reads were quality filtered to keep only high‐confidence sequences. GBS produced 1 402 870 reads with an average of approximately 87 679 reads per sample (Fig. 1). The length of the Agilent SureSelect amplicons (~120 bp) was not sufficient to generate reads spanning the full repetitive motif of the STRs, and genotypes could not be determined for the majority of the 19 STR markers (16 of 19; data not shown). Therefore, the STRs did not receive further consideration in the analyses. The target loci for the 211 SNPs were identified in each cat.
Figure 1.

Reads processed by flash. For the loci, number of sequenced (fragmentSeq), combined (fragmentExtended), not combined (fragmentNotCombined) and mapped (fragmentMapped) fragments for each sample under analysis. Combined are fragments merged by the overlapping region, and the not combined fragments are those without an overlapping region.
For the GBS results from the 211 SNPs, the sequencing depth varied among samples, ranging from 56 332 to 172 812 fragments per sample. Additionally, samples differed in the number of read mates combined (from 33 173 to 101 308) or not combined (from 23 159 to 71 504) by flash and in the number of fragments mapping to the cat genome (from 39 994 to 129 779) (Fig. 1).
A preliminary analysis with bcftools of the 211 SNPs allowed inference of the genotypes in the 16 cats. As a measure of significance of the inferred genotype (Table S1), the likelihood of the second most likely genotype was used, as reported by the program (Table S2). This value was chosen because it was informative about the existence of alternative SNPs at the same locus, providing a measure of the reliability of the most likely genotype. bcftools assigns the significance of the reported genotype a likelihood of 1, without respect to coverage or additional information. Therefore, the negative log likelihood of the second most likely genotype allowed an indirect assessment of the reliability of the reported one: when the value was high, the likelihood was low, which means that a valuable alternative to the called genotype was not detected. The reliability of the inferred genotypes was dependent on the coverage, as a small number of reads was insufficient to identify the correct genotype, especially in heterozygous conditions. Coverage and negative log likelihood of the genotype were positively related, meaning that the genotypes with higher coverage were identified with more confidence. In Fig. 2, sequencing coverage was plotted against the likelihood of the second genotype for all of the SNPs under analysis (data in Table S2). Despite the points being widely dispersed, the trend was clearly positive.
Figure 2.
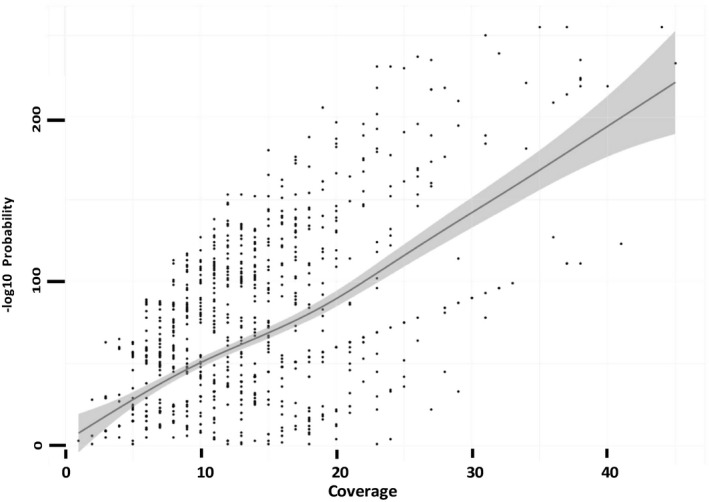
Plot of each genomic position by coverage (x‐axis) and −log10 of the likelihood of the second most likely genotype. The line represents the tendency of the distribution. The grey area represents the 95% confidence interval for the tendency calculated under the generalized addictive model.
Similarly, by setting a threshold on the negative log likelihood (Fig. 3; data reported in Table S3) at 15 (likelihood of the second genotype of 10−15), the percentage of genomic positions that pass the threshold increased, making the coverage deeper but reducing the number of loci for which the genotype could be inferred. Briefly, the threshold at 15 was empirically selected based on the number of the genomic positions considered and on the proportion of errors admitted, which minimized the number of incorrectly assigned genotypes and allowed an adequate number of loci to be retained. In Fig. 3, the histogram refers to the left y‐axis and shows that the number of SNPs for each interval of coverage decreased at higher coverage for the given threshold. On the right y‐axis, the fraction of target loci overcoming the likelihood threshold per coverage bin was also calculated. The chart clearly shows that the fraction of target loci above the coverage threshold increased when the coverage was larger.
Figure 3.

Histogram: number of SNPs with the likelihood of the second most probable genotype higher than 15 (the chosen likelihood threshold) and lying in a coverage interval. Scatter plot: proportion of SNPs over the total within each coverage interval that passed the likelihood threshold.
The average number of target loci per sample (indicated on the y‐axis) with a coverage exceeding the threshold (indicated on the x‐axis) is shown in Fig. 4. Combined with the information in Fig. 3, this number highlights the compromise among the fraction of recovered target loci (which was maximal for low coverage thresholds) and the quality of the resulting genotypes (maximal for high coverage).
Figure 4.

Mean and standard deviation (y‐axis) of target loci with a coverage exceeding the threshold (x‐axis) per 16 samples.
Genotyping by sequencing
Genotyping results were compared with the available genotype data (Reference), and the accuracy was analysed.
As a first assessment, the work focused on the 120 SNP markers genotyped in 13 samples (1560 genotypes) and included both in the GBS panel and Reference data, with the latter assumed to have 100% accuracy. Of the 120 SNPs, three markers recorded low performances: SNP33, SNP60 and SNP101. These markers showed large failure (missing genotypes) and low concordance in genotyping with the Reference, suggesting a design failure. SNP45, SNP86 and SNP90 also showed low concordance. Furthermore, SNP20, SNP71, SNP75 and SNP115 did not have MassArray data for comparison for most of the samples. All discordant genotypes concerned homozygous loci. This finding was expected, as the probability of observing both bases at heterozygous loci decreases at smaller coverage (Table S4).
The ratio of the number of GBS matching Reference genotypes to the number of genomic positions shared was calculated. For the GBS results, the performances for several coverage thresholds were reported, as the coverage had previously been shown to have a strong impact on the accuracy and completeness of the results (Figs 3 & 4). These thresholds were chosen as representative of shallow to strict filtering, but at least half of the total genomic positions were always included so as not to lose too much information. For each coverage threshold, the genomic positions typed with both methods were considered for comparison. The resulting assessment (Table 1A), indicated good performances for the GBS method, with 92–96% of correct assignments, depending on the coverage threshold.
Table 1.
Heatmap of the performance of the genotyping by sequencing compared with the genotyping results of the Reference for anonymous SNPs from SNP01 to SNP120 at different coverage levels in the samples genotyped with both methods

To check if any of the samples had a strong impact on the global accuracies, the accuracy on a per sample basis was calculated, with the results showing that the global performances were reduced by a few samples (Table 1B, & Table S4 limited to the heterozygous performances). Here, the same approach mentioned above that was used to calculate performances was applied once more. Notably, different pools of genomic positions might be compared depending on the samples being contrasted, which is different from the previous comparison analysis.
The comparison of GBS with WGS (30× average depth, one single cat, n = 16) further indicated the importance of coverage: with a lower threshold, the performance was low compared with the results discussed above, but with a stringent cut‐off on coverage, the accuracy increased, even though the genomic position overcoming the coverage threshold was only 25–50% of the original dataset (Fig. 5). This confirmed that the accuracy can be easily increased to the highest values by increasing the depth just above 11×.
Figure 5.

Scatter plot of the performances at different coverage levels. GBS: performance of the 13 samples genotyped with both GBS and Mass Array (data in Table 1A); WGS: performance of Cat_16 genotyped with both GBS and WGS (data on the left in the figure).
Discussion
Since 2004, ISAG has organized cat comparisons using anonymous DNA markers and microsatellites and, since 2017, also SNPs to standardize genetic profiles for subject identification and parentage control, so these profiles could be recognized by genetic testing service laboratories worldwide. However, the availability of a unique assay to genotype neutral loci for identity profiling, together with coding loci for traits of interest, could provide all of the possible requested information and protect against mistakes and errors.
DNA chips can be used to type large numbers of SNPs (Alhaddad et al. 2013; Gandolfi et al. 2018), combining identity profiling and coding trait loci, but their customization is expensive in both the production and application phases because they are static tools that must be entirely used or wasted before adding content. The possibility to calibrate the average sequencing coverage, the high barcode sample multiplexing/pooling and the easy addition of new markers all make GBS a flexible, customizable, upgradable and effective alternative to SNP chip or other methods and, overall, make it economically competitive in a short time prospect (Gorjanc et al. 2015). In fact, the use of NGS through intensive multiplexing dramatically increases the captured fraction of the genome. This fraction can be readily adjusted according to the needs of the project, and samples obtained from different species can potentially be pooled for sequencing.
When the present GBS experiment was planned, the cost of the design was reduced as much as possible, with a compromise among the depth of the sequencing and completeness of the results being sought. In the design, in addition to SNP variants, some indels (STRs) were also included for testing. As expected, the short length of the reads and the customized, but standard, design were insufficient to resolve the full repetitive motif of most STR markers, causing the overall genotyping to fail at these loci.
All of the remaining loci (n = 211 SNPs) were successfully genotyped. An assessment of the accuracy of the GBS results was conducted on 13 samples (Cat_1‐13) that were previously genotyped with Agena at 120 loci. One additional sample (Cat_16) was compared with the information from its WGS (30× average depth), in this case considering the full set of 211 SNPs. Analyses showed that, by using a relatively shallow sequencing (~11×), achieving good performances in genotyping is possible. The range of accuracy was always affected by the coverage levels. That is, the range of accuracy was 89–96% in the WGS sample (Fig. 5), 92–96% in the GBS when total genotypes were considered (Table 1A and Fig. 5) and 82–100% (Table 1B) when the genotypes per sample were considered. More importantly, the present data show that the coverage has a strong effect on the number of genomic positions for which a genotype can be inferred with genomic DNA.
The present work therefore suggests that, when genotype inference for all or most genomic regions of interest is needed, such as in genotyping for service, a deeper sequencing is required. In our analysis, a coverage of 25× provided 100% of SNPs, exceeding the threshold that minimized the number of incorrectly assigned genotypes, as shown in Table S3. Therefore, we suggest a coverage depth of 25× when maximal accuracy is required. Conversely, when exploratory analysis is performed, such as in variant discovery or population screenings, a shallow sequencing can be enough to identify the genotype at most of the targeted genomic positions.
These results echo other studies in which GBS was used to genotype known variant sites. The coverage level considered varied depending on the studies (minimum two reads per site in Torkamaneh et al. 2016; minimum five reads per site in Ariani et al. 2016) and no consensus was found. However, the present trial showed that such low coverage levels often preclude the determination of genotypes with satisfactory performances. Additionally, Brouard et al. (2017) showed results consistent with those reported in the present work, with filtering by coverage and by genotype significance leading to better performances.
This is the first work aiming to identify anonymous (suitable for DNA profiling) and non‐anonymous loci at the same time using a targeted NGS approach in cats. The comparatively high throughput, the high sensitivity and the opportunity to combine different types of variants (SNPs and indels) and samples from different species, thanks to the barcoding, together with the exhaustive performance characterization performed in this work, all suggest that GBS can be used proficiently in population screening of mutations and, at deeper coverage, in DNA diagnostic testing.
Competing interests
The authors declare that they have no competing interests.
Funding
Internal funds from the University of Milan, Italy (ML) and Linea 2 University of Milan_CBA22_2018AB (CB).
Ethics approval and consent to participate
Not applicable.
Consent for publication
Not applicable.
Availability of data and material
13 DNA (Cat_1–13) were provided by Orivet laboratory as part of its routine procedures. One DNA (Cat_16) was part of the 99 Lives Consortium, and its data are fully accessible in the NCBI database according to accession number as specified in the main text. Two tissues (EDTA blood), Cat_14 and Cat_15, were from the Animal Tissue and DNA Repository at the Department of Veterinary Medicine, University of Milan (the University of Milan permitted the use of collected samples in the existing Repository with no. OPBA‐56‐2016).
Supporting information
Table S1 Felis catus genome—SNPs chromosomal positions; Reference and GBS genotypes; coverage at each locus and sample by allele (identical to the species reference sequence and alternative); total coverage at each locus and sample.
Table S2 GBS, genotype analysis. Log 10 of the negative likelihood of the second most probable genotype.
Table S3 Coverage analysis.
Table S4 Coverage analysis in the heterozygous genotypes.
References
- Alhaddad H., Khan R., Grahn R.A. et al (2013) Extent of linkage disequilibrium in the domestic cat, Felis silvestris catus, and its breeds. PLoS ONE 8, e53537. [DOI] [PMC free article] [PubMed] [Google Scholar]
- Ariani A., Berny Mier y Teran J.C. & Gepts P. (2016) Genome‐wide identification of SNPs and copy number variation in common bean (Phaseolus vulgaris L.) using genotyping‐by‐sequencing (GBS). Molecular Breeding 36, 87. [Google Scholar]
- Brouard J.S., Boyle B., Ibeagha‐Awemu E.M. & Bissonnette N. (2017) Low‐depth genotyping‐by‐sequencing (GBS) in a bovine population: strategies to maximize the selection of high‐quality genotypes and the accuracy of imputation. BMC Genetics 18, 32. [DOI] [PMC free article] [PubMed] [Google Scholar]
- De Donato M., Peters S.O., Mitchell S.E., Hussain T. & Imumorin I.G. (2013) Genotyping‐by‐sequencing (GBS): a novel, efficient and cost‐effective genotyping method for cattle using next‐generation sequencing. PLoS ONE 8, e62137. [DOI] [PMC free article] [PubMed] [Google Scholar]
- Gandolfi B., Alhaddad H., Abdi M. et al (2018) Applications and efficiencies of the first cat 63K DNA array. Scientific Reports 8, 7024 Erratum in: Scientific Reports (2018) 8, 8746. [DOI] [PMC free article] [PubMed] [Google Scholar]
- Gorjanc G., Cleveland M.A., Houston R.D. & Hickey J.M. (2015) Potential of genotyping‐by‐sequencing for genomic selection in livestock populations. Genetics Selection Evolution 47, 12. [DOI] [PMC free article] [PubMed] [Google Scholar]
- Guan Y., Hu H., Peng Y. et al (2015) Detection of inherited mutations for hereditary cancer using target enrichment and next generation sequencing. Familial Cancer 14, 9–18. [DOI] [PubMed] [Google Scholar]
- Gurgul A., Miksza‐Cybulska A., Szmatoła T., Jasielczuk I., Piestrzyńska‐Kajtoch A., Fornal A., Semik‐Gurgul E. & Bugno‐Poniewierska M. (2018) Genotyping‐by‐sequencing performance in selected livestock species. Genomics 11, 185–95. [DOI] [PubMed] [Google Scholar]
- Hart L.A., Hart B.L., Thigpen A.P., Willits N.H., Lyons L.A. & Hundenski S. (2018) Compatibility of cats with children in the family. Frontiers in Veterinary Science 5, 278. [DOI] [PMC free article] [PubMed] [Google Scholar]
- He J., Zhao X., Laroche A., Lu Z.‐X., Liu H. & Li Z. (2014) Genotyping‐by‐sequencing (GBS), an ultimate marker‐assisted selection (MAS) tool to accelerate plant breeding. Frontiers in Plant Science 5, 484. [DOI] [PMC free article] [PubMed] [Google Scholar]
- Kent W.J., Sugnet C.W., Furey T.S., Roskin K.M., Pringle T.H., Zahler A.M. & Haussler D. (2002) The human genome browser at UCSC. Genome Research 12, 996–1006. [DOI] [PMC free article] [PubMed] [Google Scholar]
- Kim C., Guo H., Kong W., Chandnani R., Shuang L.S. & Paterson A.H. (2016) Application of genotyping by sequencing technology to a variety of crop breeding programs. Plant Science 242, 14–22. [DOI] [PubMed] [Google Scholar]
- Langmead B. & Salzberg S.L. (2012) Fast gapped‐read alignment with bowtie2 . Nature Methods 9, 357–9. [DOI] [PMC free article] [PubMed] [Google Scholar]
- Li H.. (2011) A statistical framework for SNP calling, mutation discovery, association mapping and population genetical parameter estimation from sequencing data. Bioinformatics 27, 2987–93. [DOI] [PMC free article] [PubMed] [Google Scholar]
- Lipinski M.J., Amigues Y., Blasi M. et al (2007) An international parentage and identification panel for the domestic cat (Felis catus). Animal Genetics 38, 371–7. [DOI] [PMC free article] [PubMed] [Google Scholar]
- Liu Y., Wei X., Kong X. et al (2015) Targeted next‐generation sequencing for clinical diagnosis of 561 Mendelian diseases. PLoS ONE 10, e0133636 Erratum in: PLoS ONE (2016) 11, e0148154 and PLoS ONE (2015) 10, e0139258. [DOI] [PMC free article] [PubMed] [Google Scholar]
- Lyons L.A. (2010) Feline genetics: clinical applications and genetic testing. Topics in Companion Animal Medicine 25, 203–12. [DOI] [PMC free article] [PubMed] [Google Scholar]
- Lyons L.A. (2012) Genetic testing in domestic cats. Molecular and Cellular Probes 26, 224–30. [DOI] [PMC free article] [PubMed] [Google Scholar]
- Lyons L.A. (2015) DNA mutations of the cat: the good, the bad and the ugly. Journal of Feline Medicine and Surgery 17, 203–19. [DOI] [PMC free article] [PubMed] [Google Scholar]
- Magoč T. & Salzberg S.L. (2011) flash: fast length adjustment of short reads to improve genome assemblies. Bioinformatics 27, 2957–63. [DOI] [PMC free article] [PubMed] [Google Scholar]
- Malik A.A., Sharma R., Ahlawat S., Deb R., Negi M.S. & Tripathi S.B. (2018) Analysis of genetic relatedness among Indian cattle (Bos indicus) using genotyping‐by‐sequencing markers. Animal Genetics 49, 242–5. [DOI] [PubMed] [Google Scholar]
- Montague M.J., Li G., Gandolfi B. et al (2014) Comparative analysis of the domestic cat genome reveals genetic signatures underlying feline biology and domestication. Proceedings of the National Academy of Sciences of the United States of America 111, 17230–5. [DOI] [PMC free article] [PubMed] [Google Scholar]
- Oh A., Pearce J.W., Gandolfi B. et al (2017) Early‐onset progressive retinal atrophy associated with an IQCB1 variant in African Black‐Footed Cats (Felis nigripes). Scientific Reports 7, 43918 Erratum in: (2018) Science Reports 8, 46978. [DOI] [PMC free article] [PubMed] [Google Scholar]
- Pembleton L.W., Drayton M.C., Bain M., Baillie R.C., Inch C., Spangenberg G.C., Wang J., Forster J.W. & Cogan N.O.I. (2016) Targeted genotyping‐by‐sequencing permits cost‐effective identification and discrimination of pasture grass species and cultivars. Theoretical and Applied Genetics 129, 991–1005. [DOI] [PubMed] [Google Scholar]
- R Core Team (2013) R: A Language and Environment for Statistical Computing. R Foundation for Statistical Computing, Vienna. [Google Scholar]
- Torkamaneh D., Laroche J. & Belzile F. (2016) Genome‐wide SNP calling from genotyping by sequencing (GBS) data: a comparison of seven pipelines and two sequencing technologies. PLoS ONE 11, e0161333. [DOI] [PMC free article] [PubMed] [Google Scholar]
- Zhang T., Yu L.X., Zheng P., Li Y., Rivera M., Main D. & Greene S.L. (2015) Identification of loci associated with drought resistance traits in heterozygous autotetraploid alfalfa (Medicago sativa L.) using genome‐wide association studies with genotyping by sequencing. PLoS ONE 10, e0138931. [DOI] [PMC free article] [PubMed] [Google Scholar]
- Zhu F., Cui Q.Q. & Hou Z.C. (2016) SNP discovery and genotyping using genotyping‐by‐sequencing in Pekin ducks. Scientific Reports 6, 36223. [DOI] [PMC free article] [PubMed] [Google Scholar]
Associated Data
This section collects any data citations, data availability statements, or supplementary materials included in this article.
Supplementary Materials
Table S1 Felis catus genome—SNPs chromosomal positions; Reference and GBS genotypes; coverage at each locus and sample by allele (identical to the species reference sequence and alternative); total coverage at each locus and sample.
Table S2 GBS, genotype analysis. Log 10 of the negative likelihood of the second most probable genotype.
Table S3 Coverage analysis.
Table S4 Coverage analysis in the heterozygous genotypes.
Data Availability Statement
13 DNA (Cat_1–13) were provided by Orivet laboratory as part of its routine procedures. One DNA (Cat_16) was part of the 99 Lives Consortium, and its data are fully accessible in the NCBI database according to accession number as specified in the main text. Two tissues (EDTA blood), Cat_14 and Cat_15, were from the Animal Tissue and DNA Repository at the Department of Veterinary Medicine, University of Milan (the University of Milan permitted the use of collected samples in the existing Repository with no. OPBA‐56‐2016).