

Summary
Commercial cellular tests are used to diagnose Lyme borreliosis (LB), but studies on their clinical validation are lacking. This study evaluated the utility of an in‐house and a commercial enzyme‐linked immunosorbent spot (ELISpot) assay for the diagnosis of Lyme neuroborreliosis (LNB). Prospectively, peripheral blood mononuclear cells (PBMCs) were isolated from patients and controls and analysed using an in‐house Borrelia ELISpot assay and the commercial LymeSpot assay. B. burgdorferi B31 whole cell lysate and a mixture of outer surface proteins were used to stimulate the PBMCs and the numbers of interferon‐gamma‐secreting T cells were measured. Results were evaluated using receiver operating characteristic (ROC) curve analysis. Eighteen active and 12 treated LNB patients, 10 healthy individuals treated for an early (mostly cutaneous) manifestation of LB in the past and 47 untreated healthy individuals were included. Both assays showed a poor diagnostic performance with sensitivities, specificities, positive and negative predictive values ranging from 44.4–66.7%, 42.0–72.5%, 21.8–33.3% and 80.5–87.0%, respectively. The LymeSpot assay performed equally poorly when the calculation method of the manufacturer was used. Both the in‐house and the LymeSpot assay are unable to diagnose active LNB or to monitor antibiotic treatment success.
Keywords: Borrelia, Lyme neuroborreliosis, ELISpot, T cells, interferon‐gamma
We performed a validation of a commercial ELISpot (LymeSpot) assay for the diagnosis of Lyme neuroborreliosis and compared the results with those obtained with our in‐house Borrelia ELISpot assay. This validation was performed on well‐defined study participants consisting of active Lyme neuroborreliosis patients, treated Lyme neuroborreliosis patients, healthy individuals treated for an early (mostly cutaneous) manifestation of Lyme borreliosis in the past, and untreated healthy individuals. ROC curve analysis showed that both ELISpot assays cannot be used for the diagnosis of Lyme neuroborreliosis, or to monitor antibiotic treatment.

Introduction
Lyme borreliosis (LB) is a tick‐borne disease caused by bacteria of the Borrelia burgdorferi sensu latu group. In Europe, the most prevalent species that cause LB are B. afzelii, B. garinii and B. burgdorferi sensu stricto. The most common manifestation of LB is erythema migrans (EM); other manifestations include Lyme neuroborreliosis (LNB), Lyme arthritis (LA) and acrodermatitis chronica atrophicans (ACA). Most people, however, do not notice any symptoms and clear the infection unknowingly. In the Netherlands, surveys among general practitioners conducted in 1994 and 2017 showed a fourfold increase from an estimated 6500 to an estimated 25 500 patients with EM 1, 2. In addition, 1500 cases of a disseminated manifestation of LB were reported in 2017 1. Thus, LB has an increasing impact on public health in the Netherlands 3.
The diagnosis of LB depends on clinical symptoms and can sometimes be difficult due to the lack of a ‘gold standard’ test, such as culture or polymerase chain reaction (PCR). Culture is only useful for skin manifestations such as EM or ACA, but is not recommended because of the varying sensitivity and long duration, and EM is mainly a clinical diagnosis 4, 5, 6. PCR is particularly useful in skin manifestations and LA 5, 7. For LNB, both culture and PCR show varying sensitivity and are mostly useful in the early phase of the disease 5, 7, 8, 9, 10.
The most frequently used laboratory test for LB is based on the detection of Borrelia‐specific antibodies. Unfortunately, the interpretation of serological tests can be difficult, as Borrelia‐specific antibodies can persist lifelong and, hence, do not discriminate between an active LB and a cleared infection. Furthermore, the absence of Borrelia‐specific antibodies in the early phase of the infection does not exclude LB 11. Therefore, better diagnostic tools are needed that can establish an active LB, especially because early antibiotic therapy has proved to be effective 12.
In recent years, various cellular assays for the diagnosis of LB have been described. Some of these assays are based on the proliferation of T cells, such as the lymphocyte transformation test (LTT) described by von Baehr et al. 13 or the LTT‐memory lymphocyte immunostimulation assay (MELISA) described by Valentine‐Thon et al. 14. Other assays detect cytokines which are secreted by T cells upon stimulation with Borrelia antigens, such as the Quantiferon test described by Callister et al. 15 or the enzym‐linked immunosorbent spot (ELISpot) assay (iSpot Lyme) described by Jin et al. 16. Most studies on cellular assays have used poorly described study populations and lack clinical validations. Despite the lack of such validations, these assays are used in some laboratories for the diagnosis of LB 17, 18, 19, and when the test result is positive – thus when Borrelia‐specific T cells are detected – (long‐term) antibiotic treatment regimens are started for treatment of active LB 17, which is of major concern. Therefore, we recently validated an in‐house Borrelia ELISpot assay for the detection of active LNB on a well‐established study population of active LNB patients and various control groups 20. We concluded that the T‐cell activity measured in our in‐house Borrelia ELISpot assay could not be used as a marker for active LNB. In the current study, we evaluated the diagnostic performance of a commercial LymeSpot assay that has not been validated previously, and compared this to the diagnostic performance of our in‐house Borrelia ELISpot assay in patients suspected of LNB.
Materials and methods
Study population
Inclusion for this study started in March 2014 and ended in November 2017, and for a large part ran in parallel with two previously published studies 20, 21. Therefore, most of the study participants in the current study also participated in the previous studies and, hence, the study groups of this study consisted of subgroups of the study groups of these previous studies.
All patients diagnosed with LNB in the Diakonessenhuis Hospital, Utrecht and the St Antonius Hospital, Nieuwegein, the Netherlands, were eligible for inclusion in the study if they fulfilled at least two criteria for LNB as defined by the European Federation of Neurological Societies (EFNS) 10. These criteria are (i) the presence of neurological symptoms suggestive of LNB without other obvious explanations, (ii) cerebrospinal fluid (CSF) pleocytosis (≥ 5 leukocytes/µl) and (iii) Borrelia‐specific intrathecal antibody production. If all three criteria were met, then a case was categorized as definite LNB; if two criteria were met, then a case was categorized as possible LNB. Patients were either recently diagnosed with active LNB or had been treated for LNB in the past. Clinical symptoms of LNB patients were classified as cranial or peripheral nerve infections – further divided into radiculopathy, cranial or peripheral neuropathy – or as central nervous system disease (which also included meningoencephalitis). Active LNB patients were recruited from March 2014 to November 2017 and were included if blood was drawn within 2 weeks after the start of antibiotic therapy. Treated LNB patients, who had been diagnosed between September 2006 and September 2014, were enrolled from February 2015 to March 2015 and were included at least 4 months after the completion of antibiotic therapy for LNB. The clinical outcome of both active and treated LNB patients was assessed by a neurologist after antibiotic treatment for active LNB was finished. The clinical outcome was interpreted as either a recovery of clinical symptoms or as no (or incomplete) recovery of clinical symptoms.
Healthy individuals were recruited during the period from March 2014 to December 2015 from personnel of the Diakonessenhuis Hospital, Utrecht, the St Antonius Hospital, Nieuwegein and the National Institute for Public Health and the Environment (RIVM), Bilthoven, the Netherlands. Healthy individuals also included boy scout patrol leaders, owners of hunting dogs and recreational runners. All were invited to participate if they pursued recreational activities in high‐risk areas for tick bites, such as gardens, forests, grasslands and dunes 22. Thus, the healthy individuals in this study represented a subgroup of healthy individuals, with a high risk of tick exposure. The healthy individuals were further subdivided into two groups. The first group consisted of healthy individuals who had received antibiotic treatment for LB‐related symptoms in the past, as they had reported in the Lyme‐specific questionnaire, and were referred to as treated healthy individuals. The second group comprised all other healthy individuals and these were referred to as untreated healthy individuals.
All study participants were asked to complete a Lyme‐specific questionnaire. This questionnaire included questions on tick bites, the presence of EM, antibiotic treatment for LB and self‐reported complaints at the moment of inclusion and during possible earlier episodes of LB. Information regarding the clinical symptoms, pleocytosis and intrathecal antibody production during active disease of the LNB patients was extracted from the hospital information system. Healthy individuals were recruited only if they reported no complaints at the time of inclusion in the study.
Antibody detection in serum and serum–CSF pairs
For the detection of Borrelia‐specific antibodies in serum, the C6 enzyme‐linked immunosorbent assay (ELISA) (Immunetics, Boston, MA, USA) was used 23. Equivocal and positive C6 ELISA results were confirmed using the recomLine immunoglobulin (Ig)M and IgG immunoblot test (Mikrogen GmbH, Neuried, Germany) 24. Detection of intrathecally produced Borrelia‐specific IgM and IgG antibodies was performed using the second‐generation IDEIA LNB test (Oxoid, Hampshire, UK), which was adapted from the original publication by Hansen et al. 25. Most importantly, the dilution of CSF was adjusted from 1 : 10 to 1 : 5, and various incubation times (of patient samples, conjugate and substrate) were shortened. The C6 ELISA and the IDEIA LNB tests were performed using a DS2‐automated ELISA instrument (Dynex Technologies, Chantilly, VA, USA) and analysed with the DS‐Matrix™ software (Dynex Technologies). The immunoblot results were recorded with an automated recomScan system using the recomScan software (Mikrogen GmbH). All assays were performed according to the instructions of the respective manufacturers and were interpreted as described previously 20.
Isolation of peripheral blood mononuclear cells
Isolation of peripheral blood mononuclear cells (PBMCs) was performed from whole blood specimens which were collected in lithium heparin tubes. If isolation of PBMCs started within 8 h after venipuncture, 3 ml of fresh, prewarmed (37°C) Roswell Park Memorial Institute (RPMI) medium (Life Technologies, Invitrogen, Bleiswijk, the Netherlands) was added to 5 ml of blood and, after gently mixing, transferred into a Leucosep tube (Oxford Immunotec Ltd, Abingdon, UK). PBMCs were separated through density gradient centrifugation (Hettich Rotanta 460 RS; rotor 5624) at room temperature for 15 min at 1000 g. If isolation of PBMCs was performed between 8 and 32 h after venipuncture, then a T‐Cell Xtend (Oxford Immunotec Ltd) step was performed prior to the addition of 3 ml of RPMI medium and density gradient centrifugation, as previously described 20, 26, 27. After centrifugation, the PBMC fraction was collected and washed twice in 10 ml RPMI medium. The first wash step was performed at room temperature for 7 min at 600 g; the second wash step was also performed at room temperature for 7 min at 300 g. If necessary, excess erythrocytes were removed between the first and second wash step using human erythrocyte lysis buffer [0.010 M KHCO3, 0.0001 M ethylenediamine tetraacetic acid (EDTA), 0.150 M NH4Cl (pH 7.3 ± 0.1)]. After addition of 5 ml of lysis buffer, the solution was incubated for 5 min at 2°C and subsequently centrifuged using the first wash step centrifugation program. The final pellet was suspended in 1.1 ml of fresh, prewarmed (37°C) AIM‐V medium (Life Technologies) and PBMCs were counted using the AC.T diff 2 analyser (Beckman Coulter, Woerden, the Netherlands), as described previously 20. After isolation, the PBMCs were adjusted to a concentration of 2.5 × 10⁶/ml using AIM‐V medium, 100 µl of which (2.5 × 10⁵ PBMCs) was tested in the in‐house Borrelia ELISpot assay and the commercial LymeSpot assay [Autoimmun Diagnostika (AID) GmbH, Straßberg, Germany].
The in‐house Borrelia ELISpot assay
The in‐house Borrelia ELISpot assay was performed as previously described 20. In brief, a precoated polyvinylidene difluoride (PVDF) ELISpotPRO 96‐well plate (Mabtech, Nacka Strand, Sweden) was used, and four wells were tested for each study participant. These wells contained 50 µl of positive control [anti‐human CD3 monoclonal antibody (mAb) CD3‐2 (0.1 µg/ml); Mabtech], 50 µl of negative control (AIM‐V medium), 50 µl of B. burgdorferi B31 whole cell lysate (5 µg/ml; AID), hereafter referred to as B. burgdorferi B31, and 50 µl of outer surface protein (Osp)‐mix (5 µg/ml; AID), respectively, which were used to stimulate the PBMCs. The Osp‐mix consisted of a pool of 9‐mer to 11‐mer peptides of Osp‐A (B. burgdorferi, B. afzelii and B. garinii), native Osp‐C (B. afzelii) and recombinant p18. For the current study, this protocol was extended by the addition of two wells: the first additional well contained 100 µl of B. burgdorferi B31 (5 µg/ml) and the second additional well contained 100 µl of Osp‐mix (5 µg/ml) to stimulate the PBMCs (Supporting information, Table S1).
The numbers of Borrelia‐specific interferon (IFN)‐γ‐secreting T cells/2.5 × 105 PBMCs (displayed as black spots) were measured with an ELISpot reader (AID) and counted by two different people using the ELISpot software (AID), hereafter referred to as the numbers of spot‐forming cells (SFCs). SFCs were counted without prior knowledge of the medical background of the study participants. The SFC size used was based on the expected SFC size of an IFN‐γ‐producing T cell, as determined by Feske et al. 28, and was set on –2.8 log (mm2). Samples that had a discrepancy in the numbers of SFCs between the two counting persons were recounted by a third person, whose result was leading. For samples that were stimulated with 50 µl of Borrelia antigen, the conditions for recounting have been described previously 20. For samples which were stimulated with 100 µl of B. burgdorferi B31, a recount was performed for those samples which had a discrepancy in the numbers of SFCs in the critical area (between 0 and 10 SFCs), determined by receiver operating characteristic (ROC) curve analysis. When 100 µl of Osp‐mix was used, those samples which had a discrepancy in the numbers of SFCs in the critical area (between 0 and 5 SFCs), determined by ROC curve analysis, were recounted. The results of the in‐house Borrelia ELISpot assay were only interpreted when the assay was valid; i.e. when the numbers of SFCs upon stimulation in the positive control well were ≥ 20 and in the negative control well were ≤ 6 (the latter representing spontaneous SFCs) (Supporting information, Table S1). If the assay was valid, the final numbers of SFCs in the Borrelia antigen‐stimulated wells were determined. For the wells containing 50 µl of Borrelia antigen, this was performed by subtraction of the numbers of SFCs in the negative control well from the numbers of SFCs in the Borrelia antigen‐stimulated well. For the wells containing 100 µl of Borrelia antigen, the final numbers of SFCs were calculated by first multiplying the numbers of SFCs in the negative control well by 2 before subtracting them from the numbers of SFCs in the Borrelia antigen‐stimulated well (Supporting information, Table S1). The final numbers of SFCs corresponded with the numbers of SFCs after stimulation with either B. burgdorferi B31 or Osp‐mix. For some cases, the Borrelia antigens were tested several times and, for such cases, the median T‐cell count was used to determine the final numbers of SFCs. Using the extended version of our in‐house Borrelia ELISpot assay, we were able to compare our in‐house Borrelia ELISpot assay with the LymeSpot assay on the basis of exactly the same (absolute) amount of Borrelia antigens (100 µl of a 5 µg/ml concentration per well), as prescribed in the LymeSpot assay protocol. In addition, we could also study the effect of various amounts of Borrelia antigen (50 versus 100 µl of a concentration of 5 µg/ml) on the numbers of SFCs for the in‐house Borrelia ELISpot assay (Supporting information, Table S1).
The LymeSpot assay
The LymeSpot assay (AID) was run in parallel with the in‐house Borrelia ELISpot assay. The LymeSpot assay uses a 96‐well PVDF plate coated with anti‐human IFN‐γ antibodies. The assay was performed according to the manufacturer’s protocol (Supporting information, Table S1), except for the isolation of the PBMCs and the amount of PBMCs/well, for which our standard protocol was used as described above and in Supporting information, Table S1. In a pilot study we investigated the influence of this deviation from the LymeSpot protocol, and showed that this had no impact on the diagnostic performance of the LymeSpot assay (see Supporting information, Data S4). Stimulation of the PBMCs in the LymeSpot assay was performed using a negative control (100 µl of AIM‐V medium), a positive control (100 µl of Pokeweed; AID), 100 µl of B. burgdorferi B31 (5 µg/ml; AID) and 100 µl of Osp‐mix (5 µg/ml; AID). Both the B. burgdorferi B31 and the Osp‐mix antigens were identical to the Borrelia antigens used for the in‐house Borrelia ELISpot assay described above. If the PBMC yield was sufficient, both controls and antigens were tested in duplicate (Supporting information, Table S1).
The final LymeSpot results were only calculated when the assay was valid. Following the manufacturer’s instructions, the LymeSpot results were valid when the positive control well had ≥ 50 SFCs and the negative control well had ≤ 10 SFCs. The final LymeSpot results were calculated in two ways. First, the average numbers of SFCs were calculated, similarly as described above for the in‐house Borrelia ELISpot assay, to allow an objective comparison of the results of the LymeSpot assay with those of the in‐house Borrelia ELISpot assay (Supporting information, Table S1). Secondly, stimulation indices (SIs) were calculated following the protocol of the manufacturer (Supporting information, Fig. S2). For this, the numbers of SFCs of the negative control needed to be established first. If these numbers were between 3 and 10, SIs were calculated by dividing the numbers of Borrelia‐specific SFCs by the numbers of SFCs of the negative control. If the numbers of SFCs of the negative control were between 0 and 2, SIs were calculated by dividing the final numbers of Borrelia‐specific SFCs by 1. The final LymeSpot results were based on the combination of the results of the SIs of both the B. burgdorferi B31 and the Osp‐mix antigens, and a case could either be categorized as negative, positive (highly specific), or require diagnostic verification (Supporting information, Fig, S2).
Data handling and statistical analysis
The results of the in‐house Borrelia ELISpot assay using 50 µl and using 100 µl of Borrelia antigen and the results of the LymeSpot assay were compared with regard to their ability to detect active LNB patients and to distinguish them from the study participants in the other three groups. The 50‐µl results were published previously, as part of a larger study population (n = 243) 20. For both ELISpot assays, a comparison was performed based on the individual, as well as the combined results of the numbers of SFCs after stimulation with either 50 or 100 µl B. burgdorferi B31 and 50 or 100 µl Osp‐mix. In addition, for the LymeSpot assay, the B. burgdorferi B31‐specific SI, the Osp‐mix‐specific SI and the final results based on the combination of both SIs (Supporting information, Fig. S2) were compared between the four study groups.
Dichotomous, unrelated data were analysed using the χ2 or Fisher’s exact test. Quantitative, unrelated data comparing more than two groups were analysed using the Kruskal–Wallis χ2 test, and subsequent two‐group comparisons were analysed using the Dunn’s test 29. Quantitative, unrelated data comparing two groups were analysed using the Wilcoxon rank sum test. Quantitative, related data comparing greater than or equal to two groups were analysed using the Wilcoxon signed‐rank test with continuity correction.
To assess the diagnostic performance of both ELISpot assays, various ROC curves were constructed and used to calculate the area under the curve (AUC), sensitivity, specificity, positive predictive value (PPV) and negative predictive value (NPV) with 95% confidence intervals (CIs) 30. The optimal threshold was calculated using the point on each ROC curve for which the distance to the upper left corner (where both sensitivity and specificity are 100%) was shortest, and was determined by the square root of [(1‐sensitivity)2+(1‐specificity)2]. The sensitivity, specificity, PPV and NPV were calculated based on the optimal threshold. For both ELISpot assays, a ROC curve was constructed for each antigen separately by comparing the numbers of Borrelia‐specific SFCs among active LNB patients with those among the other three groups, as well as for the results of both antigens together. To assess the diagnostic performance of each ELISpot assay using the results of both antigens together, a binomial logistic regression (BLR) model was built before the ROC curves were constructed. The numbers of B. burgdorferi B31‐specific SFCs and the numbers of Osp‐mix‐specific SFCs, without and with their interaction term, were included as predictor variables in the model; the outcome variable was binary: sick (all active LNB patients) or not‐sick (all other study participants). The performance of the BLR model was assessed by calculating the prediction error using cross‐validation. For the LymeSpot assay, ROC curve analysis was also performed based on the SIs after stimulation with B. burgdorferi B31 and Osp‐mix, as described in the Materials and methods section covering the LymeSpot assay and in Supporting information, Fig. S2. The final results that needed diagnostic verification were classified as ‘positive’, and were combined with the positive results. Comparison of the ROC curves was performed using DeLong’s test for two correlated ROC curves 30.
Raw P‐values < 0.05 were interpreted as statistically significant, which were subsequently followed by two‐group comparisons where appropriate. To account for the multiple statistical analyses in this study, we applied the Benjamini–Hochberg (BH) procedure and controlled the false discovery rate at the level of 2.5%, i.e. no more than one false positive was allowed to be found in our list of rejections 31. For all statistical analyses and construction of the figures, Rstudio version 1.1.383, 2009‐2017 (Rstudio, Boston, MA, USA) was used.
Results
Study population
Ninety‐two study participants were eligible for inclusion in the study; however, five (5.4%) patients were excluded. Four study participants, one active LNB patient, one untreated and two treated healthy individuals, were excluded because of insufficient amounts of PBMCs to perform both ELISpot assays. One untreated healthy individual was excluded because the negative control well in the in‐house Borrelia ELISpot assay was invalid (> 6 SFCs). Eighty‐four (96.6%) of the 87 study participants comprised a subgroup of our recently published study 20; 77 (88.5%) of the 87 study participants were also part of another published study 21 (Supporting information, Table S3).
Characteristics of the active LNB patients
Eighteen active LNB patients were included in the study, with a median of 6.0 days after the start of antibiotic treatment for their active disease; their median age was 54.7 years (Table 1). Based on the EFNS criteria 10, 12 of 18 (66.7%) active LNB patients were classified as definite LNB cases and the remaining six (33.3%) were classified as possible LNB cases because of the lack of intrathecally produced Borrelia‐specific antibodies (Table 1). Clinical symptoms consisted of radiculopathy (n = 2), cranial neuropathy (n = 7) or central nervous system disease (n = 5). Four patients had a combination of different symptoms: one patient had radiculopathy and cranial neuropathy, one patient had radiculopathy, cranial and peripheral neuropathy, one patient had radiculopathy and central nervous system disease and the last patient had cranial neuropathy and central nervous system disease (data not shown). Most active LNB patients had Borrelia‐specific antibodies in their blood [15 of 18 (83.3%)], which was greater compared to treated LNB patients [one of 12 (8.3%)] and untreated healthy individuals [seven of 47 (14.9%)] (adjusted P‐value ≤ 0.002) (Table 1). The majority [13 of 18 (72.2%)] of the active LNB patients showed complete recovery after the end of antibiotic therapy for active LNB, which was assessed by the neurologist with a median of 38.0 days after antibiotic treatment ended (Table 1).
Table 1.
Demographic and clinical characteristics of the four study groups
| Parameters | Active LNB patients (n = 18) | Treated LNB patients (n = 12) | Treated healthy individuals (n = 10) | Untreated healthy individuals (n = 47) | Statistics | |
|---|---|---|---|---|---|---|
| BHa (overall) | BHa (two‐group) | |||||
| Gender (no. of males; %) | 10 (55.6) | 7 (58.3) | 8 (80.0) | 23 (48.9) | 0.680 | n.d.b |
| Age (median years; IQR) | 54.7 (45.8–63.8) | 56.3 (51.2–68.0) | 55.2 (41.6–59.5) | 35.1 (23.2–44.9) | < 0.001 | ≤ 0.018c |
| Tick bite (yes; %) | 8 (44.4) | 8 (66.7) | 9 (90.0) | 37 (78.7) | 0.129 | > 0.025d |
| EM (yes; %) | 1 (5.6) | 3 (25.0) | 8 (80.0)e | 2 (4.3) | 0.007 | ≤ 0.002f |
| Serology (no. of positives; %) | 15 (83.3) | 1 (8.3) | 4 (40.0) | 7 (14.9) | 0.007 | ≤ 0.002g |
| Intrathecal antibody production (no. of positives; %) | 12 (66.7) | 12 (100) | n.a. | n.a. | 0.225 | n.a. |
| Pleocytosis (yes; %) | 18 (100) | 11 (91.7) | n.a. | n.a. | 0.687 | n.a. |
| EFNS criteria | ||||||
| Definite LNB (yes; %) | 12 (66.7) | 11 (91.7) | n.a. | n.a. | 0.462 | n.a. |
| Possible LNB (yes; %) | 6 (33.3) | 1 (8.3) | ||||
| Time between end of AB and blood sampling (median years; IQR) | n.a. | 5.4 (3.6–6.1) | 5.0 (2.0–7.0) | n.a. | 0.888 | n.a. |
| Time between start of AB and blood sampling (median days; IQR) | 6.0 (3.3–7.0) | n.a. | n.a. | n.a. | n.a. | n.a. |
| Recoveryh | ||||||
| Time between end of AB and visit at neurologist (median days; IQR) | 38.0 (22.5–67.2) | 37.0 (15.5–53.0) | n.a. | n.a. | 0.883 | n.a. |
| Complete recovery (yes; %) | 13 (72.2) | 10 (83.3) | n.a. | n.a. | 0.875 | n.a. |
| Symptoms at the start of the study (yes; %) | 18 (100) | 8 (66.7) | 0 (0) | 0 (0) | 0.007 | ≤ 0.017i |
LNB = Lyme neuroborreliosis; n = number of study participants; BH = Benjamini–Hochberg; n.d. = not done; IQR = interquartile range; EM = erythema migrans; AB = antibiotic treatment for Lyme borreliosis (LB); EFNS = European Federation of Neurological Societies (10); n.a. = not applicable.
To correct for multiple comparisons, the Benjamini–Hochberg procedure was applied with a false discovery rate of 2.5%;
as the initial comparison was not significantly different (raw P‐value > 0.050), two‐group comparisons were not performed;
untreated healthy individuals versus treated healthy individuals, treated Lyme neuroborreliosis (LNB) patients and active LNB patients (adjusted P‐values are 0.018, 0.002 and 0.001, respectively);
as the initial comparison was significantly different (raw P‐value < 0.050), two‐group comparisons were also performed;
one treated healthy individual had an atypical skin rash, one had flu‐like symptoms after the tick bite;
treated healthy individuals versus untreated healthy individuals and active LNB patients (adjusted P‐values are < 0.001 and 0.002, respectively);
active LNB patients versus treated LNB patients and untreated healthy individuals (adjusted P‐values are 0.002 and < 0.001, respectively);
the clinical outcome of both active and treated LNB patients was assessed by the neurologist after antibiotic treatment for active LNB was finished. The clinical outcome was interpreted as either a recovery of clinical symptoms or as no (or incomplete) recovery of clinical symptoms;
treated healthy individuals versus treated and active LNB patients (adjusted P‐values are 0.017 and < 0.001, respectively), and untreated healthy individuals versus treated and active LNB patients (adjusted P values are < 0.001 for both).
Characteristics of the treated LNB patients
Twelve treated LNB patients were included in the study, who were diagnosed with active LNB on average 5.4 years ago (Table 1). The median age of the treated LNB patients at inclusion was 56.3 years and the majority (91.7%) were classified as definite LNB cases at the time of diagnosis of active LNB in the past. One (8.3%) patient was classified as a possible LNB case because of the absence of pleocytosis (Table 1). Clinical symptoms included radiculopathy (n = 1), cranial neuropathy (n = 4) or central nervous system disease (n = 3). Four treated LNB patients had combined symptomology: one patient had radiculopathy, cranial neuropathy and central nervous system disease, one patient had radiculopathy and cranial neuropathy, one patient had radiculopathy and peripheral neuropathy and one patient had cranial and peripheral neuropathy (data not shown). Ten (83.3%) of the 12 treated LNB patients showed complete recovery after the end of antibiotic therapy for active LNB in the past, which was assessed by the neurologist with a median of 37.0 days after antibiotic treatment ended (Table 1). At inclusion in this study, however, eight (66.7%) of the 12 treated LNB patients reported complaints in the Lyme‐specific questionnaire (Table 1). These self‐reported symptoms included fatigue, neuropathic complaints, myalgias, arthralgias and cognitive complaints (data not shown).
Characteristics of the healthy individuals
A total of 57 healthy individuals were included. Ten (17.5%) reported having had antibiotic treatment for an early manifestation of LB in the past, which took place on average 5.0 years ago, and who were therefore classified as treated healthy individuals (Table 1). The median age of the treated healthy individuals was 55.2 years. Nine (90.0%) of the 10 treated healthy individuals reported having had a tick bite, and although this percentage was higher than among the other three groups, it was not statistically significant. Eight (80.0%) of the treated healthy individuals reported an EM, which was higher than among active LNB patients [one of 18 (5.6%)] and untreated healthy individuals [two of 47 (4.3%)] (adjusted P‐value ≤ 0.002) (Table 1). The other two either reported flu‐like symptoms or an atypical skin rash after the tick bite.
The remaining 47 (82.5%) healthy individuals all reported never to have had antibiotic treatment for LB, and thus were classified as untreated healthy individuals. Their median age was 35.1 years, which was younger than the other three groups (adjusted P‐value ≤ 0.018) (Table 1).
Influence of the different amounts of Borrelia antigen used on the median numbers of SFCs in the in‐house Borrelia ELISpot assay
PBMCs of all 87 study participants were stimulated with 50 µl 20 and 100 µl of B. burgdorferi B31 and Osp‐mix, and subsequently tested in our in‐house Borrelia ELISpot assay (Table 2). Overall, when 50 µl of B. burgdorferi B31 was used to stimulate the PBMCs, a lower median number of SFCs was obtained than when 100 µl of antigen was used (2.0 versus 4.0) (adjusted P‐value < 0.001) (Table 2). When the four study groups were analysed separately, the association between the use of lower amounts of antigen as stimulant and the lower median number of SFCs remained for untreated healthy individuals (1.5 versus 2.0) (adjusted P‐value = 0.006) (Table 2). Stimulation of PBMCs with either 50 or 100 µl of Osp‐mix did not result in a difference between the median numbers of SFCs in the in‐house Borrelia ELISpot assay (1.0 versus 1.0) (adjusted P‐value = 0.786) (Table 2).
Table 2.
Comparison of the ELISpot results expressed in the numbers of spot‐forming cells for the in‐house Borrelia ELISpot assay and the LymeSpot assay among the four study groups
| Study participants | Borrelia antigen | SFC count (median; IQR) | Statistics | ||||||
|---|---|---|---|---|---|---|---|---|---|
| In‐house Borrelia ELISpot assay | LymeSpot assay | 50 µl in‐house Borrelia ELISpot assay versus 100 µl in‐house Borrelia ELISpot assay | 100 µl in‐house Borrelia ELISpot assay versus 100 µl LymeSpot assay | ||||||
| 50 µl | 100 µl | 100 µl | BHa (overall) | BHa (within each group) | BHa (overall) | BHa (within each group) | |||
| All study participants (n = 87) | Bb B31 | 2.0 (0.8–6.0) | 4.0 (2.0–9.5) | 5.0 (2.0–10.3) | < 0.001 | 0.006b | 0.360 | > 0.025 | |
| Osp‐mix | 1.0 (0.0–2.0) | 1.0 (0.0–3.0) | 1.5 (0.5–3.3) | 0.786 | > 0.025 | 0.685 | > 0.025 | ||
| Active LNB patients (n = 18) | Bb B31 | 5.5 (1.3–7.8) | 6.5 (1.5–11.5) | 6.1 (2.6–10.2) | |||||
| Osp‐mix | 0.0 (0.0–4.8) | 1.0 (0.0–3.0) | 1.3 (0.1–2.5) | ||||||
| Treated LNB patients (n = 12) | Bb B31 | 5.5 (2.0–9.9) | 9.5 (5.0–17.5) | 8.4 (2.4–12.8) | |||||
| Osp‐mix | 0.5 (0.0–4.5) | 0.5 (0.0–2.5) | 1.5 (0.9–3.3) | ||||||
| Treated healthy individuals (n = 10) | Bb B31 | 9.3 (3.5–27.0) | 6.5 (3.3–22.2) | 26.1 (7.5–73.7) | |||||
| Osp‐mix | 2.0 (1.1–6.0) | 2.5 (0.5–7.8) | 5.6 (3.3–12.0) | ||||||
| Untreated healthy individuals (n = 47) | Bb B31 | 1.5 (0.0–3.0) | 2.0 (1.0–5.5) | 3.0 (1.4–6.3) | |||||
| Osp‐mix | 1.0 (0.0–1.5) | 1.0 (0.0–2.5) | 1.0 (0.0–2.5) | ||||||
| Statistics | Bb B31 versus Osp‐mix | BHa (overall) | < 0.001 | < 0.001 | < 0.001 | ||||
| BHa (within each group) | > 0.025 | 0.017c | ≤ 0.005d | ||||||
| Bb B31 | BHa (overall) | 0.018 | 0.132 | 0.075 | |||||
| BHa (two–group) | 0.015e | > 0.025f | 0.014e, f | ||||||
| Osp‐mix | BHa (overall) | 0.489 | 0.766 | 0.058 | |||||
| BHa (two–group) | n.d.g | n.d.g | 0.005e, f | ||||||
SFC = spot‐forming cell; IQR = interquartile range; ELISpot = enzyme‐linked immunosorbent spot; BH = Benjamini–Hochberg; n = number of study participants; Bb B31 = Borrelia burgdorferi B31; Osp = outer surface protein; n.d. = not done; LNB = Lyme neuroborreliosis.
To correct for multiple comparisons, the Benjamini‐Hochberg procedure was applied with a false discovery rate of 2.5%;
the numbers of SFCs among untreated healthy individuals were significantly higher after stimulation with 100 µl of B. burgdorferi B31 compared to 50 µl of B. burgdorferi B31;
the numbers of SFCs after stimulation with 100 µl of B. burgdorferi B31 among active Lyme neuroborreliosis (LNB) patients were significantly higher compared to stimulation with 100 µl of Osp‐mix;
the numbers of SFCs after stimulation with 100 µl of B. burgdorferi B31 among untreated healthy individuals and active LNB patients were significantly higher compared to stimulation with 100 µl of Osp‐mix (adjusted P‐values are <0.001 and 0.005, respectively);
untreated versus treated healthy individuals;
as the initial comparison was significantly different (raw P‐value <0.050), two‐group comparisons were also performed;
as the initial comparison was not significantly different (raw P‐value >0.050), two‐group comparisons were not performed.
Influence of the different Borrelia antigens used for PBMC stimulation on the median numbers of SFCs in the two ELISpot assays
Analysis of the results of all 87 study participants showed that PBMC stimulation with 50 µl of B. burgdorferi B31 resulted in a higher median number of SFCs than stimulation with 50 µl of Osp‐mix in the in‐house Borrelia ELISpot assay (2.0 versus 1.0) (adjusted P‐value < 0.001) (Table 2). These results are similar to the results we have published previously using a study population of 243 study participants 20. When the four study groups were analysed separately, the median numbers of B. burgdorferi B31‐specific SFC counts were higher compared to the median numbers of Osp‐mix‐specific SFC counts, although not significant (adjusted P‐values > 0.025) (Table 2). A higher median number of SFCs after PBMC stimulation with B. burgdorferi B31 compared to PBMC stimulation with Osp‐mix was also seen when a volume of 100 µl of Borrelia antigen was used in the in‐house Borrelia ELISpot assay (4.0 versus 1.0) (adjusted P‐value < 0.001) (Table 2). Comparisons within each of the four groups showed that this difference remained significant for active LNB patients (adjusted P‐value = 0.017) (Table 2).
In the LymeSpot assay, the higher yield of the B. burgdorferi B31 over the Osp‐mix remained when the median numbers of SFCs were compared (5.0 versus 1.5) (adjusted P‐value < 0.001) (Table 2). When the four study groups were analysed separately, B. burgdorferi B31 remained superior in the LymeSpot assay for untreated healthy individuals and active LNB patients (adjusted P‐values ≤ 0.005) (Table 2).
Comparison of the median numbers of SFCs in the two ELISpot assays between the four study groups after stimulation of the PBMCs with B. burgdorferi B31
The PBMCs of treated healthy individuals were stimulated the most when either 50 µl of B. burgdorferi B31 was used in the in‐house Borrelia ELISpot assay or 100 µl of B. burgdorferi B31 was used in the LymeSpot assay. The PBMCs of treated LNB patients were stimulated the most when 100 µl of B. burgdorferi B31 was used in the in‐house Borrelia ELISpot assay (Table 2; Fig. 1a,c,e). In contrast, the PBMCs of untreated healthy individuals were stimulated the least, irrespective of the volume and the ELISpot assay used. An increased T‐cell activation for patients and treated healthy individuals after PBMC stimulation with B. burgdorferi B31 was also seen in our previous study, which included more study participants (n = 243), and suggests that the ELISpot activity is related to exposure to the Borrelia bacterium 20
Figure 1.
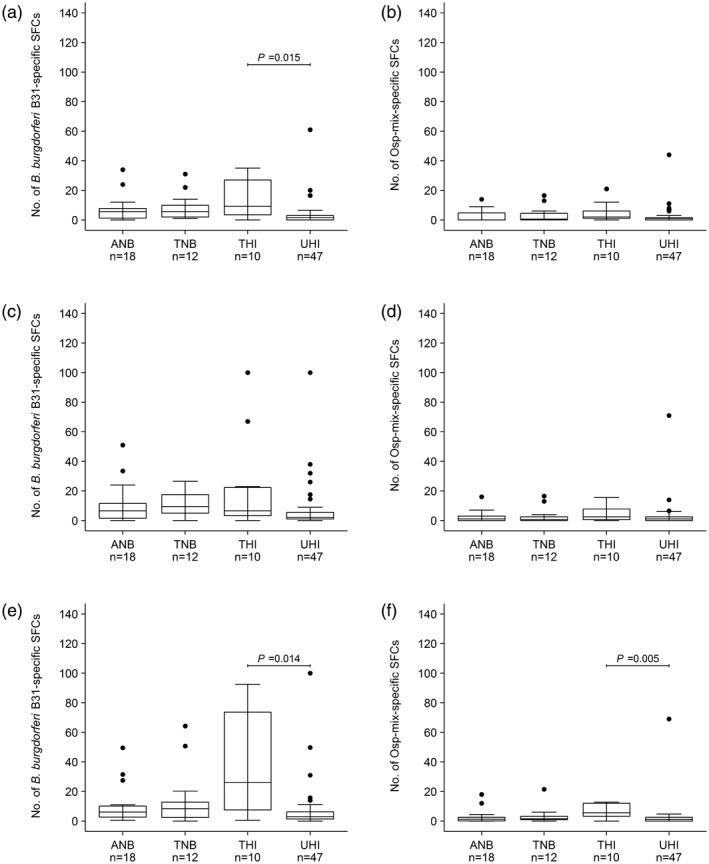
Results of the in‐house Borrelia enzym‐linked immunosorbent spot (ELISpot) assay (a–d) and the LymeSpot assay (e–f) expressed in the numbers of spot‐forming cells (SFCs). (a) (50 µl), (c) and (e) (both 100 µl) are the results after peripheral blood mononuclear cell (PBMC) stimulation with Borrelia burgdorferi B31, and (b) (50 µl), (d) and (f) (both 100 µl) are the results after PBMC stimulation with outer surface protein (Osp)‐mix among active Lyme neuroborreliosis patients (ANB), treated Lyme neuroborreliosis patients (TNB), treated healthy individuals (THI) and untreated healthy individuals (UHI). The displayed P‐values are corrected and interpreted using the Benjamini–Hochberg procedure with a false discovery rate of 2.5% for multiple comparisons (only false discovery rates < 0.025 are displayed).
Analysis of the different amounts of B. burgdorferi B31 showed that when 50 µl was used to stimulate the PBMCs in the in‐house Borrelia ELISpot assay, the median number of SFCs of 1.5 for untreated healthy individuals was lower compared to the median number of SFCs of 9.3 for treated healthy individuals (adjusted P‐value = 0.015) (Table 2, Fig. 1a). When 100 µl of B. burgdorferi B31 was used to stimulate the PBMCs, no differences were found between the four study groups for the in‐house Borrelia ELISpot assay (adjusted P‐value > 0.025) (Table 2, Fig. 1c). For the LymeSpot assay, the results were only significantly different between untreated (less ELISpot activity) and treated healthy individuals (more ELISpot activity) (adjusted P‐value = 0.014) (Table 2, Fig. 1e).
Overall, no difference was found between the median numbers of SFCs between both ELISpot assays when 100 µl of B. burgdorferi B31 was used to stimulate the PBMCs (adjusted P‐value = 0.360). Similarly, no differences were found when the four study groups were analysed separately (adjusted P‐values > 0.025) (Table 2).
Comparison of the median numbers of SFCs in the two ELISpot assays between the four study groups after stimulation of the PBMCs with Osp‐mix
Similar to stimulation with B. burgdorferi B31, the PBMCs of treated healthy individuals were activated most upon stimulation with Osp‐mix (Table 2, Fig. 1b,d,f). No significant differences between the four study groups were found for the in‐house Borrelia ELISpot assay using 50 or 100 µl of Osp‐mix (adjusted P‐value 0.489 and 0.766, respectively) (Table 2, Fig. 1b,d). For the LymeSpot assay, however, stimulation of the PBMCs with 100 µl of Osp‐mix resulted in a significantly higher median number of SFCs of 5.6 for treated healthy individuals compared to the median number of SFCs of 1.0 for untreated healthy individuals (adjusted P‐value = 0.005) (Table 2, Fig. 1f).
Similar to the use of 100 µl of B. burgdorferi B31, no difference was seen between the median numbers of SFCs between both ELISpot assays upon stimulation of the PBMCs with 100 µl of Osp‐mix (adjusted P‐value = 0.685). Subsequent comparisons within each group also did not show a difference (adjusted P‐values > 0.025) (Table 2).
The diagnostic performance of the two ELISpot assays based on the numbers of SFCs
The diagnostic performance of the in‐house Borrelia ELISpot assay and the LymeSpot assay were evaluated using ROC curve analysis, for which the numbers of SFCs were used. In order to enable a fair comparison between the two assays, the results obtained with PBMCs that were stimulated with 100 µl of Borrelia antigen were used for the in‐house Borrelia ELISpot assay and compared with the results of the LymeSpot assay. The results obtained with 100 µl of Borrelia antigen were used, as this is the standard in the LymeSpot assay (Supporting information, Table S1). ROC curves were constructed based on the results obtained after PBMC stimulation with the B. burgdorferi B31 and the Osp‐mix separately, as well as on the combined results of both Borrelia antigens. The calculated AUCs based on the individual Borrelia antigens were comparable to a random predictor, and ranged from 0.459 to 0.570 (Table 3, Fig. 2a,b). No difference was found between the AUC of the in‐house Borrelia ELISpot assay and the AUC of the LymeSpot assay based on the numbers of B. burgdorferi B31‐specific SFCs (AUC = 0.553 and 0.570, respectively) (adjusted P‐value = 0.974) (Table 3, Fig. 2a). Similarly, comparison of the AUCs from the two ELISpot assays based on the numbers of Osp‐mix‐specific SFCs also showed no difference (AUC = 0.479 for the in‐house Borrelia ELISpot assay and AUC = 0.459 for the LymeSpot assay, respectively) (adjusted P‐value = 0.930) (Table 3, Fig. 2b).
Table 3.
Diagnostic performance of the in‐house Borrelia ELISpot assay and the LymeSpot assay based on the numbers of spot‐forming cells obtained after peripheral blood mononuclear cell stimulation with Borrelia burgdorferi B31 and Osp‐mix separately, and based on the combined numbers of spot‐forming cells of both Borrelia antigens by using a binomial logistic regression model
| Interpretation | ELISpot assay | Thresholda (95% CI) | AUC (95% CI) | Sensitivity (%; 95% CI) | Specificity (%; 95% CI) | PPV (%; 95% CI) | NPV (%; 95% CI) | BHb | Prediction error BLR model (%) |
|---|---|---|---|---|---|---|---|---|---|
| SFC count after stimulation with Bb B31 (100 µl) | In‐house Borrelia ELISpot assay | 7.0 (2.5‐8.5) | 0.553 (0.382‐0.714) | 61.1 (38.9‐77.8) | 66.7 (42.0‐81.2) | 30.6 (20.5‐44.8) | 85.7 (79.1‐92.2) | 0.974 | |
| LymeSpot assay | 5.3 (5.0‐8.4) | 0.570 (0.433‐0.706) | 66.7 (44.4‐88.9) | 59.4 (44.9‐72.5) | 29.7 (21.1‐39.5) | 87.0 (79.6‐94.7) | |||
| SFC count after stimulation with Osp‐mix (100 µl) | In‐house Borrelia ELISpot assay | 2.5 (0.5‐5.5) | 0.479 (0.326‐0.631) | 44.4 (16.7‐72.2) | 66.7 (33.3‐87.0) | 23.3 (13.8‐40.0) | 80.9 (72.2‐87.1) | 0.930 | |
| LymeSpot assay | 2.3 (0.3‐4.3) | 0.459 (0.305‐0.614) | 50.0 (22.2‐77.8) | 56.5 (24.6‐84.1) | 22.2 (14.6‐36.4) | 80.5 (72.3‐87.5) | |||
| SFC count of both antigens without interaction term in a BLR modelc, d | In‐house Borrelia ELISpot assay | 0.21 (0.20‐0.22) | 0.546 (0.398‐0.694) | 66.7 (38.9‐88.9) | 49.3 (33.3‐81.2) | 26.5 (20.0‐40.0) | 85.7 (78.4‐94.3) | 0.517 | 21.8 |
| LymeSpot assay | 0.21 (0.21‐0.22) | 0.429 (0.292‐0.566) | 61.1 (27.8‐88.9) | 42.0 (20.3‐73.9) | 21.8 (16.1‐29.8) | 80.8 (72.7‐90.6) | 21.8 | ||
| SFC count of both antigens with interaction term in a BLR modelc, d | In‐house Borrelia ELISpot assay | 0.21 (0.19‐0.22) | 0.549 (0.380‐0.719) | 55.6 (33.3‐77.8) | 72.5 (42.0‐85.5) | 33.3 (21.1‐50.0) | 85.7 (79.6‐91.8) | 0.959 | 20.7 |
| LymeSpot assay | 0.21 (0.19‐0.22) | 0.521 (0.372‐0.670) | 50.0 (33.3‐83.3) | 68.1 (30.4‐81.2) | 27.6 (18.9‐41.7) | 83.9 (77.4‐91.3) | 20.7 | ||
| Final result based on the stimulation indices of both antigens | LymeSpot assay | n.a.e | 0.487 (0.367‐0.606) | 27.8 (11.1‐50.0) | 69.6 (58.0‐79.7) | 19.1 (7.7‐32.0) | 78.6 (73.7‐84.0) | n.a. |
ELISpot = enzyme‐linked immunosorbent spot; AUC = area under the curve; PPV = positive predictive value; NPV = negative predictive value; CI = confidence interval; BH = Benjamini‐Hochberg; BLR = binomial logistic regression; SFC = spot‐forming cell; Bb B31 = B. burgdorferi B31; Osp = outer surface protein; n.a. = not applicable.
The threshold is based on the numbers of spot‐forming cells when the result of a single Borrelia antigen was analysed, and on the linear predictors of the binary logistic regression model when the combined results of both Borrelia antigens were analysed;
to correct for multiple comparisons, the Benjamini–Hochberg procedure was applied with a false discovery rate of 2.5%;
no significant difference (adjusted P‐value =1.000) between the outcome of the BLR model without interaction term and the outcome of the BLR model with interaction term for the in‐house Borrelia ELISpot assay;
no significant difference (adjusted P‐value = 0.717) between the outcome of the BLR model without interaction term and the outcome of the BLR model with interaction term for the LymeSpot assay;
see Supporting information, Fig. S2.
Figure 2.

The receiver operating characteristic (ROC) curves for both the in‐house Borrelia enzyme‐linked immunosorbent spot (ELISpot) assay (solid lines) and the LymeSpot assay (dashed lines) to discriminate active Lyme neuroborreliosis (LNB) patients from the other three groups. The dotted grey line represents the random predictor. (a) ROC curves based on the numbers of spot‐forming cells after stimulation with 100 µl of B. burgdorferi B31. (b) ROC curves based on the numbers of spot‐forming cells after stimulation with 100 µl of Osp‐mix. (c) ROC curves based on the outcomes of the two binary logistic regression models (M) for which the combined results of both Borrelia antigens, which were based on the numbers of spot‐forming cells, without (M1) and with (M2) their interaction term, were included as risk factors. P (M1) represents the adjusted P‐value for the comparison of both assays using the outcomes of model 1, P (M2) represents the adjusted P‐value for the comparison of both assays using the outcomes of model 2, P (M1 versus M2 in‐house Borrelia ELISpot) represents the adjusted P‐value for the comparison of the outcomes of models 1 and 2 for the in‐house Borrelia ELISpot assay, P (M1 versus M2 LymeSpot) represents the adjusted P‐value for the comparison of the outcomes of models 1 and 2 for the LymeSpot assay. (d) ROC curve of the LymeSpot assay based on the final LymeSpot result (a combination of the stimulation indices of both antigens following the protocol of the manufacturer (Supporting information, Fig. S2).
Calculation of the optimal thresholds for the two assays using a single Borrelia antigen showed that the sensitivity and NPV was highest for the LymeSpot assay when B. burgdorferi B31 was used to stimulate the PBMCs (sensitivity = 66.7%, NPV = 87.0%) (Table 3). The specificity was highest for the in‐house Borrelia ELISpot assay irrespective of whether B. burgdorferi B31 or Osp‐mix was used to stimulate the PBMCs (66.7% each) (Table 3). The PPV was highest for the in‐house Borrelia ELISpot assay when B. burgdorferi B31 was used to stimulate the PBMCs (30.6%) (Table 3).
Combining the results of the two Borrelia antigens without or with their interaction term as risk factors in a BLR model also resulted in AUCs that were comparable to a random predictor (range = 0.429–0.549) (Table 3). Comparison of the AUCs for the in‐house Borrelia ELISpot assay and the LymeSpot assay without their interaction term did not show a difference (AUC = 0.546 and 0.429, respectively) (adjusted P‐value = 0.517) (Table 3, Fig. 2c). Similarly, the AUCs for the in‐house Borrelia ELISpot assay and the LymeSpot assay with their interaction term were also comparable (AUC = 0.549 and 0.521, respectively) (adjusted P‐value = 0.959) (Table 3, Fig. 2c). For both ELISpot assays, the prediction errors of the BLR models with the interaction term were only slightly better than the prediction errors of the BLR models without the interaction term (20.7% for both versus 21.8% for both) (Table 3). Thus, approximately one in five patients were wrongly diagnosed by using the BLR models.
Furthermore, no differences were found between the AUCs of both BLR models for the in‐house Borrelia ELISpot assay (adjusted P‐value = 1.000) as well as for the LymeSpot assay (adjusted P‐value = 0.717) (Table 3, Fig. 2c). The highest sensitivity was found for the in‐house Borrelia ELISpot assay when both antigens without their interaction term were included in the BLR model (66.7%); the highest specificity (72.5%) and PPV (33.3%) was found for the in‐house Borrelia ELISpot assay when both antigens with their interaction term were included in the BLR model. The NPV was highest for the in‐house Borrelia ELISpot assay, irrespective of whether or not the interaction term was included (85.7% each) (Table 3).
In conclusion, the two ELISpot assays showed a poor diagnostic performance for the diagnosis of active LNB when the numbers of SFCs were used in the ROC curve analyses, with sensitivities ranging from 44.4 to 66.7%, specificities from 42.0 to 72.5%, PPVs from 21.8 to 33.3% and NPVs from 80.5 to 87.0% (Table 3).
The diagnostic performance of the LymeSpot assay based on the SIs
ROC curve analysis based on a combination of the SIs of both antigens following the manufacturer’s protocol (Supporting information, Fig. S2) resulted in an AUC of 0.487 (Table 3), which almost perfectly fitted the random predictor (Fig. 2d). Based on this analysis, the LymeSpot assay had a sensitivity of 27.8% to diagnose active LNB (Table 3). Thus, only five of the 18 active LNB patients were correctly identified using the LymeSpot assay (Table 4). Of these five active LNB patients, two had a positive LymeSpot result, and for three active LNB patients the LymeSpot results would still need diagnostic verification according to the manufacturer’s instructions. The remaining 13 (72.2%) active LNB patients had a negative LymeSpot result (Table 4). When the results that needed diagnostic verification were excluded from the positive results, the sensitivity of the LymeSpot assay decreased to 11.1%. The specificity of the LymeSpot assay was 69.9% (Table 3), and 21 (30.4%) of the 69 controls either needed diagnostic verification [n = 11 (15.9%)] or had a positive LymeSpot result [n = 10 (14.5%)] (Table 4). Interestingly, the percentage of positive LymeSpot results was highest among treated healthy individuals [seven of 10 (70.0%)]; however, this was not significantly higher when compared to the other groups (adjusted P‐values > 0.025) (Table 4).
Table 4.
Interpretation of the LymeSpot assay based on the stimulation indices according to the protocol of the manufacturer
| Study groups | NEG (n; %) | POSa (n; %) | Statistics | |
|---|---|---|---|---|
| BHb (overall) | BHb (two‐group) | |||
| Active LNB patients (n = 18) | 13 (72.2) | 5c (27.8) | 0.066 | > 0.025e |
| Treated LNB patients (n = 12) | 7 (58.3) | 5d (41.7) | ||
| Treated healthy individuals (n = 10) | 3 (30.0) | 7f (70.0) | ||
| Untreated healthy individuals (n = 47) | 38 (80.9) | 9g (19.1) | ||
| Control grouph (n = 69) | 48 (69.6) | 21i (30.4) | n.a. | n.a. |
NEG = negative; POS = positive; n = number of study participants; BH = Benjamini–Hochberg; LNB = Lyme neuroborreliosis; n.a. = not applicable.
The positive results include those results that needed diagnostic verification;
to correct for multiple comparisons, the Benjamini–Hochberg procedure was applied with a false discovery rate of 2.5%;
three (16.7%) of 18 active Lyme neuroborreliosis (LNB) patients required diagnostic verification;
three (25.0%) of 12 treated LNB patients required diagnostic verification;
as the initial comparison was significantly different (raw P‐value < 0.050), two‐group comparisons were also performed;
two (20.0%) of 10 treated healthy individuals required diagnostic verification;
six (12.8%) of 47 untreated healthy individuals required diagnostic verification;
the control group consists of all study participants except the active LNB patients.
11 (15.9%) out of 69 controls required diagnostic verification.
ELISpot results versus clinical symptoms, antibiotic therapy and recovery status
In total, 26 (29.9%) of the 87 study participants reported symptoms at inclusion in this study; all active LNB patients (n = 18) and eight (66.7%) of the 12 treated LNB patients. Overall, no association was found between the presence of symptoms and the results of the various ELISpot protocols (Table 5a). For treated LNB patients, the number of complaints reported at the start of the study was also not associated with the ELISpot results, irrespective of the ELISpot protocol used (Table 5a). As the treated healthy individuals were only included when they did not report any symptoms at the start of the study, elevated SFC counts in this group could not be linked to symptoms. Similarly, 16 (28.1%) of the 57 healthy individuals had a positive LymeSpot result, which could not be linked to symptoms.
Table 5.
Overview of the T‐cell response, the presence and duration of clinical symptoms, and the degree of recovery (after antibiotic therapy) among the various study groups
| Study groups | Symptomsa | n (%) | 50 µl B. burgdorferi B31 | 100 µl B. burgdorferi B31 | 50 µl Osp‐mix | 100 µl Osp‐mix | LymeSpot assay | |||||||||||
|---|---|---|---|---|---|---|---|---|---|---|---|---|---|---|---|---|---|---|
| SFC count in‐house Borrelia ELISpot assay | SFC count in‐house Borrelia ELISpot assay | SFC count LymeSpot assay | SFC count in‐house Borrelia ELISpot assay | SFC count in‐house Borrelia ELISpot assay | SFC count LymeSpot assay | |||||||||||||
| Median (IQR) | BHb | Median (IQR) | BHb | Median (IQR) | BHb | Median (IQR) | BHb | Median (IQR) | BHb | Median (IQR) | BHb | NEG | POS | BHb | ||||
| (a) | All study participants (n = 87) | NO | 61 (70.1) | 2.0 (0.5–6.0) | 0.439 | 3.0 (2.0–8.0) | 0.486 | 4.5 (1.5–10.5) | 0.916 | 1.0 (0.0–2.0) | 0.994 | 1.0 (0.0–3.0) | 0.811 | 1.5 (0.5–3.5) | 0.720 | 42 | 19 | 1.000 |
| YESc | 26 (29.9) | 4.5 (1.3–7.4) | 7.5 (1.5–13.9) | 5.8 (2.1–9.6) | 0.0 (0.0–4.8) | 1.0 (0.0–3.0) | 1.3 (0.3–2.5) | 19 | 7 | |||||||||
| Treated LNB patients (n = 12) | NO | 4 (33.3) | 15.2 (7.9–24.2) | 0.157 | 15.0 (5.0–25.4) | 0.717 | 30.5 (9.9–54.1) | 0.100 | 2.0 (0.0–6.3) | 1.000 | 1.0 (0.0–2.5) | 1.000 | 2.8 (1.4–8.4) | 0.570 | 1 | 3 | 0.497 | |
| YESc | 8 (66.7) | 2.0 (1.8–5.6) | 9.5 (4.0–15.6) | 3.3 (1.7–8.3) | 0.5 (0.0–3.0) | 0.5 (0.0–4.0) | 1.3 (0.4–2.3) | 6 | 2 | |||||||||
| (b) | Symptom durationd (median; IQR) | n (%) | Correlation coefficient | BHb | Correlation coefficient | BHb | Correlation coefficient | BHb | Correlation coefficient | BHb | Correlation coefficient | BHb | Correlation coefficient | BHb | LymeSpot assay | Symptom durationd (median; IQR) | BHb | |
| Active LNB patients | 33.5 (15.8–59.5) | 18 (100) | r = –0.200 | 0.703 | r = –0.130 | 0.815 | r = 0.170 | 0.746 | r = 0.180 | 0.721 | r = 0.180 | 0.722 | r = 0.440 | 0.250 | NEG (n = 13) | 32.0 (14.0–45.0) | 0.677 | |
| POS (n = 5) | 55.0 (22.0–204.0) | |||||||||||||||||
| (c) | Post AB‐treatment timee (median; IQR) | n (%) | Correlation coefficient | BHb | Correlation coefficient | BHb | Correlation coefficient | BHb | Correlation coefficient | BHb | Correlation coefficient | BHb | Correlation coefficient | BHb | LymeSpot assay | Post AB‐treatment timee (median days; IQR) | BHb | |
| Active LNB patients | 6.0 (3.3–7.0) | 18 (100) | r = –0.160 | 0.770 | r = –0.130 | 0.816 | r = –0.370 | 0.374 | r = –0.088 | 0.910 | r = –0.098 | 0.889 | r = –0.210 | 0.683 | NEG (n = 13) | 6.0 (5.0–8.0) | 0.358 | |
| POS (n = 5) | 2.0 (2.0–6.0) | |||||||||||||||||
| (d) | Recovery statusf | n (%) | Median (IQR) | BHb | Median (IQR) | BHb | Median (IQR) | BHb | Median (IQR) | BHb | Median (IQR) | BHb | Median (IQR) | BHb | LymeSpot assay | BHb | ||
| NEG | POS | |||||||||||||||||
| Active LNB patients (n = 18) | Incomplete | 5 (27.8) | 6.0 (2.0–9.5) | 0.938 | 9.0 (5.0–14.5) | 0.735 | 6.3 (1.0–10.0) | 0.735 | 0.0 (0.0–0.0) | 0.460 | 1.0 (1.0–2.0) | 0.992 | 0.5 (0.0–2.5) | 0.784 | 4 | 1 | 1.000 | |
| Complete | 13 (72.2) | 5.0 (1.0–7.0) | 5.0 (1.0–10.0) | 6.0 (3.0–11.0) | 1.0 (0.0–6.0) | 0.0 (0.0–5.0) | 1.5 (0.5–2.5) | 9 | 4 | |||||||||
Osp = outer surface protein; SFC = spot‐forming cell; ELISpot = enzyme‐linked immunosorbent spot; n = number of study participants; IQR = interquartile range; BH = Benjamini–Hochberg; NEG = negative; POS = positive; LNB = Lyme neuroborreliosis.
Symptoms are defined as the presence of symptoms at the start of the study. For (un)treated healthy individuals and treated Lyme neuroborreliosis (LNB) patients, the presence of symptoms was assessed by the completion of a Lyme‐specific questionnaire; (un)treated healthy individuals were only included if they did not report any symptoms at the start of the study. For active LNB patients, the presence of symptoms was extracted from the hospital information system;
to correct for multiple comparisons, the Benjamini–Hochberg procedure was applied with a false discovery rate of 2.5%;
in total eight (66.7%) of the 12 treated LNB patients reported complaints at the start of the study. For all treated LNB patients, the presence of complaints was reported on average 5.4 years after the diagnosis of active disease in the past (Table 1);
Symptom duration is defined as the number of days the study participant experienced complaints prior to blood sampling;
Post AB‐treatment time is defined as the number of days between the start of antibiotic AB) treatment and blood sampling (median days; IQR)
the degree of recovery (recovery status) was assessed after a median of 38.0 days after the end of antibiotic therapy for active disease (Table 1).
Among active LNB patients, no association was found between the duration of symptoms prior to the blood sampling and the ELISpot results, irrespective of the ELISpot protocol used (Table 5b). For most active LNB patients, the antibiotic treatment had already started at the time of blood sampling; however, no association was found between the duration of antibiotic therapy prior to blood sampling and the ELISpot results using the various ELISpot protocols (Table 5c). Similarly, no association was found between the degree of recovery and the T‐cell response of active LNB patients (Table 5d). For treated LNB patients, the degree of recovery was assessed at a median of 37.0 days after the end of antibiotic treatment for active disease in the past (approximately 5.4 years ago; Table 1), therefore, we did not compare the degree of recovery with the various ELISpot results obtained in the current study.
ELISpot results versus Borrelia‐specific antibodies
In our previous study, elevated numbers of B. burgdorferi B31‐specific T cells were significantly associated with the presence of Borrelia‐specific serum antibodies 20. In this study, which included a smaller number of study participants, comparison of the B. burgdorferi B31‐specific SFC counts with the serology results showed a trend towards a combined B‐ and T‐cell response when all study participants were analysed together, irrespective of the ELISpot protocol used (Table 6a). Within‐group comparisons also showed a (non‐significant) trend towards a combined B‐ and T‐cell response, except for treated LNB patients, who showed elevated B. burgdorferi B31‐specific SFC counts in the absence of Borrelia‐specific antibodies. This was, again, in line with the results found in our previous study 20. The presence of Borrelia‐specific IgM or IgG also was not associated with elevated SFC counts (adjusted P‐values ranged from 0.199 to 1.000; data not shown).
Table 6.
Overview of the B‐ and T‐cell response among the various study groups
| Study group | AI (IgM + IgG) | n (%) | 50 µl Bb B31 | 100 µl Bb B31 | 50 µl Osp‐mix | 100 µl Osp‐mix | Final LymeSpot resulta | |||||||||||
|---|---|---|---|---|---|---|---|---|---|---|---|---|---|---|---|---|---|---|
| SFC count in‐house Borrelia ELISpot assay | SFC count in‐house Borrelia ELISpot assay | SFC count LymeSpot assay | SFC count in‐house Borrelia ELISpot assay | SFC count in‐house Borrelia ELISpot assay | SFC count LymeSpot assay | |||||||||||||
| Median (IQR) | BHb | Median (IQR) | BHb | Median (IQR) | BHb | Median (IQR) | BHb | Median (IQR) | BHb | Median (IQR) | BHb | NEG | POS | BHb | ||||
| (a) | All study participants combined (n = 87) | NEG | 60 (69.0) | 2.0 (0.4–5.3) | 0.181 | 3.0 (1.8–6.0) | 0.162 | 3.4 (1.4–8.6) | 0.107 | 1.0 (0.0–2.0) | 1.000 | 1.0 (0.0–3.0) | 0.769 | 1.0 (0.4–3.0) | 0.672 | 43 | 17 | 0.986 |
| POS | 27 (31.0) | 5.0 (1.5–8.8) | 8.0 (3.0–14.5) | 7.0 (3.8–19.4) | 0.0 (0.0–4.5) | 1.0 (0.0–4.0) | 2.0 (0.5–4.0) | 18 | 9 | |||||||||
| Active LNB patients (n = 18) | NEG | 3 (16.7) | 5.0 (2.5–19.5) | 1.000 | 5.0 (2.5–28.0) | 1.000 | 11.0 (6.3–30.2) | 0.685 | 1.0 (0.5–5.0) | 0.630 | 5.0 (2.5–6.0) | 0.652 | 4.5 (2.3–8.3) | 0.691 | 1 | 2 | 0.430 | |
| POS | 15 (83.3) | 6.0 (1.5–7.5) | 8.0 (2.0–11.0) | 6.0 (2.8–9.3) | 0.0 (0.0–4.5) | 1.0 (0.0–2.5) | 1.0 (0.3–2.5) | 12 | 3 | |||||||||
| Treated LNB patients (n = 12) | NEG | 11 (91.7) | 6.0 (2.0–11.2) | 0.783 | 7.0 (5.0–19.0) | 1.000 | 8.3 (2.3–15.2) | 1.000 | 1.0 (0.0–5.0) | 0.355 | 0.0 (0.0–3.0) | 1.000 | 1.5 (0.8–3.5) | 1.000 | 6 | 5 | 1.000 | |
| POS | 1 (8.3) | 2.0 | 12.0 | 8.5 | 0.0 | 1.0 | 1.5 | 1 | 0 | |||||||||
| Treated healthy individuals (n = 10) | NEG | 6 (60.0) | 4.5 (1.5–10.9) | 0.359 | 3.5 (3.0–4.8) | 0.130 | 8.5 (2.4–15.8) | 0.111 | 1.8 (0.4–2.0) | 0.724 | 2.0 (0.5–2.8) | 0.418 | 3.8 (2.8–6.2) | 0.309 | 3 | 3 | 0.471 | |
| POS | 4 (40.0) | 24.0 (12.5–33.5) | 45.0 (19.2–75.2) | 78.8 (66.8–83.1) | 9.5 (5.5–14.2) | 11.0 (6.8–13.6) | 12.2 (10.0–12.6) | 0 | 4 | |||||||||
| Untreated healthy individuals (n = 47) | NEG | 40 (85.1) | 1.3 (0.0–3.0) | 0.551 | 2.0 (1.0–4.3) | 0.581 | 3.0 (1.2–5.6) | 0.377 | 1.0 (0.0–1.3) | 0.785 | 1.0 (0.0–2.0) | 0.679 | 1.0 (0.0–2.1) | 0.469 | 33 | 7 | 0.814 | |
| POS | 7 (14.9) | 3.0 (0.8–5.5) | 6.0 (2.0–11.2) | 5.0 (3.5–10.0) | 0.0 (0.0–1.0) | 2.0 (0.5–4.0) | 2.5 (1.0–3.8) | 5 | 2 | |||||||||
| (b) | Active LNB patients (n = 18) | NEG | 6 (33.3) | 3.5 (2.3–19.0) | 1.000 | 4.0 (1.5–26.4) | 1.000 | 4.3 (2.6–8.9) | 0.847 | 2.0 (0.0–5.5) | 0.845 | 0.5 (0–1.8) | 0.890 | 0.3 (0.0–2.0) | 0.625 | 4 | 2 | 1.000 |
| POS | 12 (66.7) | 6 (0.8–7.3) | 8.0 (2.3–10.5) | 6.6 (4.6–10.4) | 0.0 (0.0–2.8) | 1.0 (0.0–3.5) | 1.5 (0.5–2.9) | 9 | 3 | |||||||||
Bb B31 = B. burgdorferi B31; OSP = outer surface protein; SFC = spot‐forming cell; ELISpot = enzyme‐linked immunosorbent spot; AI = antibody index; n = number of study participants; IQR = interquartile range; BH = Benjamini–Hochberg; NEG = negative; POS = positive; LNB = Lymeneuroborreliosis; AB = antibiotic treatment for Lyme borreliosis.
The final LymeSpot result is based on a combination of the stimulation indices of both antigens following the protocol of the manufacturer (Supporting information, Fig. S2);
to correct for multiple comparisons, the Benjamini–Hochberg procedure was applied with a false discovery rate of 2.5%.
Among active LNB patients, no significant association was found between the intrathecal production of Borrelia‐specific antibodies and the T‐cell response (Table 5b), which was similar to the results of our previous study in which 33 active LNB patients were included 20. We also did not find a difference among the active LNB patients between negative and positive IgM AI results or between negative and positive IgG AI results when compared to the various SFC counts (adjusted P‐values ranged from 0.131 to 1.000; data not shown).
For treated LNB patients, the presence of intrathecally produced Borrelia‐specific antibodies was determined at the time of active disease in the past, therefore, we did not compare these results with the ELISpot results using the various ELISpot protocols, as these were performed on average 5·4 years (Table 1), at the time the treated LNB patients were included in this study.
Discussion
In the current study, the diagnostic performance of two ELISpot assays to diagnose active LNB were compared. The final study population consisted of 87 participants and comprised 18 active and 12 treated LNB patients, 10 healthy individuals who were treated for an early (mainly cutaneous) manifestation of LB in the past and 47 untreated healthy individuals. Both our in‐house Borrelia ELISpot assay and the LymeSpot assay showed a poor diagnostic performance based on the numbers of SFCs with AUCs ranging from 0.429 to 0.570. The corresponding sensitivities, specificities, PPVs and NPVs ranged from 44.4 to 66.7%, 42.0 to 72.5%, 21.8 to 33.3% and 80.5 to 87.0%, respectively. The diagnostic performance of the LymeSpot assay, using so‐called SIs following the manufacturer’s protocol, resulted in a comparably low AUC of 0.487, with a corresponding sensitivity of 27.8%, a specificity of 69.6%, a PPV of 19.1% and a NPV of 78.6%. Our study showed that the two ELISpot assays, irrespective of the protocol used, cannot be used to diagnose LNB or to monitor antibiotic treatment success.
The results of the 87 study participants of the in‐house Borrelia ELISpot assay after stimulation of the PBMCs with 50 µl of B. burgdorferi B31 in the current study represent a subset of the results of the 243 study participants published previously 20. The SFC counts between the four study groups of the subgroup in this study were comparable with the SFC counts between the four study groups of the entire study population. Both studies showed significantly higher numbers of SFCs after stimulation with B. burgdorferi B31 for treated healthy individuals compared to untreated healthy individuals. Active LNB patients and treated LNB patients also showed higher numbers of SFCs after stimulation with B. burgdorferi B31 compared to untreated healthy individuals, although not significant in the current study. This is most probably explained by the lower number of study participants per group in the current study. The association between the B‐ and T‐cell response that was found in our previous study was also seen in the current study, although it was not significant, most probably due to the smaller study population. The overall conclusion, that elevated numbers of SFCs are associated with a previous contact with the Borrelia bacterium 20, however, was confirmed and could not be linked to symptomology nor to the degree of recovery or to antibiotic treatment. Elevated IFN‐γ levels among asymptomatic individuals and previous LB patients have also been found by others 32, 33, 34, 35.
Comparison of the in‐house Borrelia ELISpot results after PBMC stimulation with either 50 or 100 µl of B. burgdorferi B31 showed similar results for three of the four study groups. However, among untreated healthy individuals, significantly higher numbers of SFCs were seen when 100 µl was used. This could be explained by the relatively higher number of untreated healthy individuals compared to the number of study participants in the other three groups.
Consistent with our previous study 20, we found that the use of Osp‐mix as a T‐cell stimulant resulted in very low numbers of SFCs, and cannot be used in its current composition to distinguish active LNB patients from the three control groups. Other studies also described a reduced performance of recombinant antigens compared to whole cell lysates 13, 36. This may, in part, be explained by the number of different antigens present: (a mixture of various) recombinant antigens contains far less antigens than a whole cell lysate. Alternatively, recombinant antigens are more specific, therefore limiting the possibility of cross‐reactivity. It is known that Borrelia‐specific antibodies show cross‐reactivity with other diseases 37 and that the bacterium shows high sequence homology with bacteria such as Treponema or Leptospira 38, 39. Cross‐reactivity could theoretically result in higher numbers of SFCs when a whole cell lysate of B. burgdorferi B31 is used in patients with an active or previous infection caused by bacteria such as Treponema or Leptospira, or in healthy individuals who carry non‐pathogenic Treponema or Leptospira species. Previously, we have tested two patients with active leptospirosis in our in‐house Borrelia ELISpot assay, and one of them had high numbers of SFCs after stimulation with a whole cell lysate of B. burgdorferi B31 20.
Overall, the numbers of SFCs after stimulation with B. burgdorferi B31 were also relatively low. In our experience, as well as described by others – for tuberculosis or cytomegalovirus infections – the numbers of IFN‐γ‐secreting T cells among exposed or infected individuals measured in an ELISpot assay using comparable amounts of PBMCs, ranging from 2.0 × 10⁵ to 2.5 × 10⁵, are generally much higher 40, 41, 42. The lack of T‐cell activity among the active LNB patients could be explained by the choice of Borrelia antigens. In the Netherlands, LNB is mainly caused by B. garinii and B. bavariensis 43 and less frequently by B. burgdorferi sensu stricto. As we have discussed previously 20, we do not believe that the use of B. burgdorferi B31 whole cell lysate in the ELISpot assay resulted in the poor performance of both ELISpot assays, as B. burgdorferi, B. garinii and B. bavariensis are closely related and share many antigens. Von Baehr et al. 13 evaluated three Borrelia species and did not find any difference. Nordberg et al. 44 used B. garinii as a stimulating agent, CSF instead of blood and nitrocellulose‐bottomed ELISpot plates instead of PVDF‐bottomed plates, and also did not find higher numbers of activated T cells in their ELISpot assay. The Osp‐mix we used contained antigens derived from an LNB‐associated strain (B. garinii); however, the Osp‐mix was inferior compared to the use of B. burgdorferi B31, as discussed in the previous paragraph. The lack of T‐cell activity might also be explained by the inability of the human host to develop an adequate immune response against the Borrelia bacterium or the ability of the Borrelia bacterium to escape or suppress the immune system 45, 46. It could also be due to the disease manifestation that was studied, as already debated previously 20, as LNB implies a local infection of the brain. Testing blood might thus be less suitable, as the immune cells could have migrated towards the central and/or peripheral nervous system 47, 48. The testing of CSF, in combination with blood, may be more suitable 49. Furthermore, IFN‐γ may not the best marker to diagnose active LNB. It would be interesting to investigate whether other cytokines and/or chemokines could improve the ELISpot assays tested in this study. Recently, the LymeSpot assay has been adapted by the manufacturer by adding the detection of interleukin (IL)‐2. However, no data are available yet with regard to the diagnostic performance of this modified LymeSpot assay.
For the LymeSpot assay, the PBMC isolation procedure used in this study deviated from the manufacturer’s (AID) recommended protocol. These deviations from the LymeSpot protocol were made in order for the technician to be able to perform and process the ELISpot assays simultaneously, and to minimize the differences between the assays to allow for a more fair comparison. The PBMCs used in the LymeSpot assay were thus isolated according to the same protocol that was already in use in our laboratory for the in‐house Borrelia ELISpot assay 20 and for the T‐SPOT.TB test 20, 26, 50. Consequently, the PBMC isolation differed at four points compared to the instruction manual of the LymeSpot assay.
First, the medium to dilute the blood prior to PBMC isolation differed, as RPMI medium was used instead of phosphate‐buffered saline (PBS). Secondly, Leucosep tubes were used for the isolation of PBMCs, while the LymeSpot protocol advises to use standard tubes with a Ficoll gradient. As a consequence, the centrifugation steps of the isolation procedure were adjusted based on the instruction manual supplied with the Leucosep tubes. As the isolation of PBMCs is based on a gradient, we do not believe that the altered centrifugation time resulted in a different PBMC yield. An increased centrifugation speed could, potentially, result in a higher PBMC yield, but this should not influence the results of the LymeSpot assay, as the amount of PBMCs per well is standardized. This is confirmed by others 51, 52, who showed that PBMCs isolated by Leucosep tubes performed equally well in the ELISpot assay compared to PBMCs isolated using the Ficoll‐gradient technique.
Thirdly, the centrifugation steps that were used to wash the PBMCs and the number of times the PBMCs were washed differed from the LymeSpot protocol. However, in the literature, various centrifugation speeds and times for washing the PBMCs are described, which range from 300 to 640 g for 7–10 min for the first wash step and from 300 to 470 g for 7–10 min for the second wash step 26, 41, 51, 53, 54, 55.
Finally, the amount of PBMCs used varied slightly, as we used 2.5 × 10⁵ PBMCs/well, and according to the LymeSpot assay, 2.0 × 10⁵ PBMCs/well should have been used. A higher number of PBMCs per well could result in increased numbers of SFCs, as the use of more PBMCs results in more antigen‐presenting cells and more T cells that could become activated after stimulation with the Borrelia antigens.
The results of a comparative pilot experiment that we performed in which we assessed the influence of the deviations discussed above supported that these deviations from the recommended protocol are not critical as such (Supporting information, Data S4). Hence, the conclusion stands that both ELISpot assays cannot help to diagnose active LNB.
Probably some of the most critical steps that influence the performance of an ELISpot assay are the time between venipuncture and PBMC isolation, the time between PBMC isolation and incubation of the assay and the (overnight) incubation time of the assay 56, 57. In this study, these times were all within the limits as described in the LymeSpot protocol, with the exception of the time between venipuncture and PBMC isolation, which was prolonged for various cases. A prolonged time between venipuncture and PBMC isolation is known to decrease the PBMC viability 56. To compensate for this, for those cases for which the time between venipuncture and PBMC isolation was prolonged (8–32 h), we performed a T‐Cell Xtend step prior to PBMC isolation. This T‐Cell Xtend step has proved not to be detrimental to the PBMC yield and the ELISpot performance 26, 27, 58.
No data are provided in the instruction manual of the LymeSpot assay with regard to the diagnostic performance of this assay. To our knowledge, this is the first study that has investigated the diagnostic capacity of the LymeSpot assay for the diagnosis of active LNB. The diagnostic performance of the LymeSpot assay for other manifestations of LB has not yet been investigated thoroughly and remains unclear. Hopefully, more validation studies will be performed which will include other manifestations of LB, as well as follow‐up studies to understand more clearly the diagnostic potential for treatment monitoring.
Disclosures
None.
Supporting information
Table S1. Comparison of the protocols used for the evaluation of the in‐house Borrelia ELISpot assay and the LymeSpot assay.
Fig. S2. Interpretation scheme of the LymeSpot assay according to the manufacturer.
Table S3. Overview of the study populations used in the three studies.
Data S4. A pilot study to investigate the influence of three different protocols for the isolation of peripheral blood mononuclear cells (PBMCs) on the LymeSpot results
Acknowledgements
The Dutch Ministry of Health, Welfare and Sports is kindly acknowledged for their financial contribution. The funder had no role in the study design, data collection and interpretation, or the decision to submit the work for publication. We would like to thank all study participants for their participation. Autoimmun Diagnostika (AID) GmbH (Straßberg, Germany) is kindly acknowledged for providing the LymeSpot assays and the Borrelia antigens (B. burgdorferi B31 whole cell lysate and the Osp‐mix) free of charge. We would also like to thank Mw Rosemary Preyer from AID for the fruitful discussions. Mw Alina Nicolaie from the Department of Statistics, Informatics and Mathematical Modelling of the Dutch National Institute for Public Health and the Environment is kindly acknowledged for support with the statistical analyses. The regional Medical Research Ethics Committees United approved the study (Nieuwegein, the Netherlands; MEC‐U: NL36407.100.11). All study participants gave their informed consent.
References
- 1. National Institute for Public Health and the Environment, the Netherlands . Lyme disease cases have quadrupled. Available at: https://www.rivm.nl/en/Documents_and_publications/Common_and_Present/Newsmessages/2018/Lyme_disease_cases_have_quadrupled (Accessed June 2018).
- 2. de Mik EL, van Pelt W, Docters‐van Leeuwen BD, van der Veen A, Schellekens JF, Borgdorff MW. The geographical distribution of tick bites and erythema migrans in general practice in the Netherlands. Int J Epidemiol 1997; 26:451–7. [DOI] [PubMed] [Google Scholar]
- 3. Hofhuis A, Harms M, Bennema S, van den Wijngaard CC, van Pelt W. Physician reported incidence of early and late Lyme borreliosis. Parasit Vectors 2015; 8:161. [DOI] [PMC free article] [PubMed] [Google Scholar]
- 4. Kwaliteitsinstituut voor de Gezondheidszorg (CBO) . [CBO‐richtlijn Lymeziekte definitief]. 2013. Available at: https://www.rivm.nl/nieuws/cbo-richtlijn-lymeziekte-definitief (Accessed June 2018).
- 5. Wilske B. Diagnosis of Lyme borreliosis in Europe. Vector‐Borne Zoonot. Dis 2003; 3:215–27. [DOI] [PubMed] [Google Scholar]
- 6. Strle F. Principles of the diagnosis and antibiotic treatment of Lyme borreliosis. Wien Klin Wochenschr 1999; 111:911–5. [PubMed] [Google Scholar]
- 7. van Dam AP. Molecular diagnosis of Borrelia bacteria for the diagnosis of Lyme disease. Expert Opin Med Diagn 2011; 5:135–49. [DOI] [PubMed] [Google Scholar]
- 8. Cerar T, Ogrinc K, Cimperman J, Lotric‐Furlan S, Strle F, Ruzic‐Sabljic E. Validation of cultivation and PCR methods for diagnosis of Lyme neuroborreliosis. J Clin Microbiol 2008; 46:3375–9. [DOI] [PMC free article] [PubMed] [Google Scholar]
- 9. Karlsson M, Hovind‐Hougen K, Svenungsson B, Stiernstedt G. Cultivation and characterization of spirochetes from cerebrospinal fluid of patients with Lyme borreliosis. J Clin Microbiol 1990; 28:473–9. [DOI] [PMC free article] [PubMed] [Google Scholar]
- 10. Mygland A, Ljostad U, Fingerle V et al EFNS guidelines on the diagnosis and management of European Lyme neuroborreliosis. Eur J Neurol 2010; 17:8–16, e1–4. [DOI] [PubMed] [Google Scholar]
- 11. Engstrom SM, Shoop E, Johnson RC. Immunoblot interpretation criteria for serodiagnosis of early Lyme disease. J Clin Microbiol 1995; 33:419–27. [DOI] [PMC free article] [PubMed] [Google Scholar]
- 12. Wormser GP, Nadelman RB, Dattwyler RJ et al Practice guidelines for the treatment of Lyme disease. The Infectious Diseases Society of America. Clin Infect Dis 2000; 31(Suppl 1):1–14. [DOI] [PubMed] [Google Scholar]
- 13. von Baehr V, Doebis C, Volk HD, von Baehr R. The lymphocyte transformation test for Borrelia detects active Lyme borreliosis and verifies effective antibiotic treatment. Open Neurol J 2012; 6:104–12. [DOI] [PMC free article] [PubMed] [Google Scholar]
- 14. Valentine‐Thon E, Ilsemann K, Sandkamp M. A novel lymphocyte transformation test (LTT‐MELISA) for Lyme borreliosis. Diagn Microbiol Infect Dis 2007; 57:27–34. [DOI] [PubMed] [Google Scholar]
- 15. Callister SM, Jobe DA, Stuparic‐Stancic A et al Detection of IFN‐gamma secretion by T cells collected before and after successful treatment of early Lyme disease. Clin Infect Dis 2016; 62:1235–41. [DOI] [PMC free article] [PubMed] [Google Scholar]
- 16. Jin C, Roen DR, Lehmann PV, Kellermann GH. An enhanced ELISpot assay for sensitive detection of antigen‐specific T-cell responses to Borrelia burgdorferi . Cells 2013; 2:607–20. [DOI] [PMC free article] [PubMed] [Google Scholar]
- 17. Alstrup K, and Bech M. TV2_Documentar [Snyd eller borrelia]. 2016. Available at: https://www.dailymotion.com/video/x4wmdyj (Accessed 11 February 2019).
- 18. Arminlabs . Borrelia ELISpot (T‐Cell‐Spot/IGRA: Interferon‐Gamma‐Release Assay). Available at: https://www.arminlabs.com/en/tests/elispot (Accessed November 2018).
- 19. BCA‐clinic . Is the LymeSpot revised more effective than the traditional ELISpot. 2018. Available at: https://www.bca-clinic.de/en/is-the-lymespot-revised-more-effective-than-the-traditional-elispot/ (Accessed February 2019).
- 20. van Gorkom T, Sankatsing SUC, Voet W et al An enzyme‐linked immunosorbent spot assay measuring Borrelia burgdorferi B31‐specific interferon gamma‐secreting T cells cannot discriminate active Lyme neuroborreliosis from past Lyme borreliosis: a prospective study in the Netherlands. J Clin Microbiol 2018; 56. [DOI] [PMC free article] [PubMed] [Google Scholar]
- 21. van Gorkom T, Kremer K, Voet W et al Disagreement between the results from three commercial tests for the detection of Borrelia‐specific serum antibodies in the Netherlands associated with antibiotic treatment for Lyme borreliosis: a retrospective study. Eur J Clin Microbiol Infect Dis 2017; 36:2137–46. [DOI] [PMC free article] [PubMed] [Google Scholar]
- 22. Sprong H, Hofhuis A, Gassner F et al Circumstantial evidence for an increase in the total number and activity of Borrelia‐infected Ixodes ricinus in the Netherlands. Parasit Vectors 2012; 5:294. [DOI] [PMC free article] [PubMed] [Google Scholar]
- 23. Liang FT, Steere AC, Marques AR, Johnson BJ, Miller JN, Philipp MT. Sensitive and specific serodiagnosis of Lyme disease by enzyme‐linked immunosorbent assay with a peptide based on an immunodominant conserved region of Borrelia burgdorferi VlsE. J Clin Microbiol 1999; 37:3990–6. [DOI] [PMC free article] [PubMed] [Google Scholar]
- 24. Wilske B, Fingerle V, Schulte‐Spechtel U. Microbiological and serological diagnosis of Lyme borreliosis. FEMS Immunol Med Microbiol 2007; 49:13–21. [DOI] [PubMed] [Google Scholar]
- 25. Hansen K, Lebech AM. Lyme neuroborreliosis: a new sensitive diagnostic assay for intrathecal synthesis of Borrelia burgdorferi‐specific immunoglobulin G, A, and M. Ann Neurol 1991; 30:197–205. [DOI] [PubMed] [Google Scholar]
- 26. Bouwman JJ, Thijsen SF, Bossink AW. Improving the timeframe between blood collection and interferon gamma release assay using T‐Cell Xtend. J Infect 2012; 64:197–203. [DOI] [PubMed] [Google Scholar]
- 27. Wang SH, Stew SS, Cyktor J, Carruthers B, Turner J, Restrepo BI. Validation of increased blood storage times with the T‐SPOT.TB assay with T‐Cell Xtend reagent in individuals with different tuberculosis risk factors. J Clin Microbiol 2012; 50:2469–71. [DOI] [PMC free article] [PubMed] [Google Scholar]
- 28. Feske ML, Medina M, Graviss EA, Lewis DE. IL‐7 addition increases spot size and number as measured by T‐SPOT.TB . Methods Mol Biol 2012; 792:229–41. [DOI] [PubMed] [Google Scholar]
- 29. Dunn OJ. Multiple comparisons using rank sums. Technometrics 1964; 6:241–52. [Google Scholar]
- 30. Robin X, Turck N, Hainard A et al pROC: an open‐source package for R and S+ to analyze and compare ROC curves. BMC Bioinformatics 2011; 12:77. [DOI] [PMC free article] [PubMed] [Google Scholar]
- 31. Benjamini Y, Hochberg Y. Controlling the false discovery rate: a practical and powerful approach to multiple testing. J Roy Stat Soc: Ser B (Methodol) 1995; 57:289–300. [Google Scholar]
- 32. Ekerfelt C, Forsberg P, Svenvik M, Roberg M, Bergstrom S, Ernerudh J. Asymptomatic Borrelia‐seropositive individuals display the same incidence of Borrelia‐specific interferon‐gamma (IFN‐gamma)‐secreting cells in blood as patients with clinical Borrelia infection. Clin Exp Immunol 1999; 115:498–502. [DOI] [PMC free article] [PubMed] [Google Scholar]
- 33. Ekerfelt C, Masreliez C, Svenvik M, Ernerudh J, Roberg M, Forsberg P. Antibodies and T‐cell reactivity to Borrelia burgdorferi in an asymptomatic population: a study of healthy blood donors in an inland town district in the south‐east of Sweden. Scand J Infect Dis 2001; 33:806–8. [DOI] [PubMed] [Google Scholar]
- 34. Jarefors S, Janefjord CK, Forsberg P, Jenmalm MC, Ekerfelt C. Decreased up‐regulation of the interleukin‐12Rbeta2‐chain and interferon‐gamma secretion and increased number of forkhead box P3‐expressing cells in patients with a history of chronic Lyme borreliosis compared with asymptomatic Borrelia‐exposed individuals. Clin Exp Immunol 2007; 147:18–27. [DOI] [PMC free article] [PubMed] [Google Scholar]
- 35. Skogman BH, Hellberg S, Ekerfelt C et al Adaptive and innate immune responsiveness to Borrelia burgdorferi sensu lato in exposed asymptomatic children and children with previous clinical Lyme borreliosis. Clin Dev Immunol 2012; 2012:294587. [DOI] [PMC free article] [PubMed] [Google Scholar]
- 36. Glickstein L, Moore B, Bledsoe T, Damle N, Sikand V, Steere AC. Inflammatory cytokine production predominates in early Lyme disease in patients with erythema migrans. Infect Immun 2003; 71:6051–3. [DOI] [PMC free article] [PubMed] [Google Scholar]
- 37. Fawcett PT, Gibney KM, Rose CD, Dubbs SB, Doughty RA. Frequency and specificity of antibodies that crossreact with Borrelia burgdorferi antigens. J Rheumatol 1992; 19:582–7. [PubMed] [Google Scholar]
- 38. Bruckbauer HR, Preac‐Mursic V, Fuchs R, Wilske B. Cross‐reactive proteins of Borrelia burgdorferi . Eur J Clin Microbiol Infect Dis 1992; 11:224–32. [DOI] [PubMed] [Google Scholar]
- 39. Aguero‐Rosenfeld ME, Wang G, Schwartz I, Wormser GP. Diagnosis of Lyme borreliosis. Clin Microbiol Rev 2005; 18:484–509. [DOI] [PMC free article] [PubMed] [Google Scholar]
- 40. Jafari C, Ernst M, Kalsdorf B et al Rapid diagnosis of smear‐negative tuberculosis by bronchoalveolar lavage enzyme‐linked immunospot. Am J Respir Crit Care Med 2006; 174:1048–54. [DOI] [PubMed] [Google Scholar]
- 41. Barabas S, Spindler T, Kiener R et al An optimized IFN‐gamma ELISpot assay for the sensitive and standardized monitoring of CMV protein‐reactive effector cells of cell‐mediated immunity. BMC Immunol 2017; 18:14. [DOI] [PMC free article] [PubMed] [Google Scholar]
- 42. van Gemert JP, Thijsen SF, Bossink AW. Tuberculosis‐specific T‐cell response after recent treatment and remote cure. Eur Respir J 2011; 38:1225–8. [DOI] [PubMed] [Google Scholar]
- 43. Jahfari S, Krawczyk A, Coipan EC et al Enzootic origins for clinical manifestations of Lyme borreliosis. Infect Genet Evol 2017; 49:48–54. [DOI] [PubMed] [Google Scholar]
- 44. Nordberg M, Forsberg P, Nyman D et al Can ELISpot be applied to a clinical setting as a diagnostic utility for neuroborreliosis? Cells 2012; 1:153–67. [DOI] [PMC free article] [PubMed] [Google Scholar]
- 45. Liang FT, Yan J, Mbow ML et al Borrelia burgdorferi changes its surface antigenic expression in response to host immune responses. Infect Immun 2004; 72:5759–67. [DOI] [PMC free article] [PubMed] [Google Scholar]
- 46. Verhaegh D, Joosten LAB, Oosting M. The role of host immune cells and Borrelia burgdorferi antigens in the etiology of Lyme disease. Eur Cytokine Netw 2017; 28:70–84. [DOI] [PubMed] [Google Scholar]
- 47. Ekerfelt C, Ernerudh J, Bunikis J et al Compartmentalization of antigen specific cytokine responses to the central nervous system in CNS borreliosis: secretion of IFN‐gamma predominates over IL‐4 secretion in response to outer surface proteins of Lyme disease Borrelia spirochetes. J Neuroimmunol 1997; 79:155–62. [DOI] [PubMed] [Google Scholar]
- 48. Grusell M, Widhe M, Ekerfelt C. Increased expression of the Th1‐inducing cytokines interleukin‐12 and interleukin‐18 in cerebrospinal fluid but not in sera from patients with Lyme neuroborreliosis. J Neuroimmunol 2002; 131:173–8. [DOI] [PubMed] [Google Scholar]
- 49. Schub DST, Sester M. [Neues Verfahren zum verbesserten Nachweis Antigen‐spezifischer Immunzellen in extrasanguinen Flüssigkeiten]. 2015. Available at: https://patents.google.com/patent/DE102014018047B3/de (Accessed July 2018).
- 50. Hofland RW, Thijsen SF, van Lindert AS et al Positive predictive value of ELISpot in BAL and pleural fluid from patients with suspected pulmonary tuberculosis. Infect Dis (Lond) 2017; 49:347–55. [DOI] [PubMed] [Google Scholar]
- 51. Nilsson C, Aboud S, Karlen K, Hejdeman B, Urassa W, Biberfeld G. Optimal blood mononuclear cell isolation procedures for gamma interferon enzyme‐linked immunospot testing of healthy Swedish and Tanzanian subjects. Clin Vaccine Immunol 2008; 15:585–9. [DOI] [PMC free article] [PubMed] [Google Scholar]
- 52. Afonso G, Scotto M, Renand A et al Critical parameters in blood processing for T‐cell assays: validation on ELISpot and tetramer platforms. J Immunol Methods 2010; 359:28–36. [DOI] [PubMed] [Google Scholar]
- 53. Sumonwiriya M, Paris DH, Sunyakumthorn P et al Strong interferon‐gamma mediated cellular immunity to scrub typhus demonstrated using a novel whole cell antigen ELISpot assay in rhesus macaques and humans. PLOS Negl Trop Dis 2017; 11:e0005846. [DOI] [PMC free article] [PubMed] [Google Scholar]
- 54. Bathoorn E, Limburg A, Bouwman JJ, Bossink AW, Thijsen SF. Diagnostic potential of an enzyme‐linked immunospot assay in tuberculous pericarditis. Clin Vaccine Immunol 2011; 18:874–7. [DOI] [PMC free article] [PubMed] [Google Scholar]
- 55. Wang SH, Powell DA, Nagaraja HN, Morris JD, Schlesinger LS, Turner J. Evaluation of a modified interferon‐gamma release assay for the diagnosis of latent tuberculosis infection in adult and paediatric populations that enables delayed processing. Scand J Infect Dis 2010; 42:845–50. [DOI] [PMC free article] [PubMed] [Google Scholar]
- 56. Bourguignon P, Clement F, Renaud F et al Processing of blood samples influences PBMC viability and outcome of cell‐mediated immune responses in antiretroviral therapy‐naive HIV‐1‐infected patients. J Immunol Methods 2014; 414:1–10. [DOI] [PubMed] [Google Scholar]
- 57. Mallone R, Mannering SI, Brooks‐Worrell BM et al Isolation and preservation of peripheral blood mononuclear cells for analysis of islet antigen‐reactive T-cell responses: position statement of the T‐Cell Workshop Committee of the Immunology of Diabetes Society. Clin Exp Immunol 2011; 163:33–49. [DOI] [PMC free article] [PubMed] [Google Scholar]
- 58. Li J, Liu Y, Ma L et al The performance of T‐cell Xtend reagent in increasing blood storage times for interferon gamma release assays. J Clin Lab Anal 2018; 32 (2): e22253. [DOI] [PMC free article] [PubMed] [Google Scholar]
Associated Data
This section collects any data citations, data availability statements, or supplementary materials included in this article.
Supplementary Materials
Table S1. Comparison of the protocols used for the evaluation of the in‐house Borrelia ELISpot assay and the LymeSpot assay.
Fig. S2. Interpretation scheme of the LymeSpot assay according to the manufacturer.
Table S3. Overview of the study populations used in the three studies.
Data S4. A pilot study to investigate the influence of three different protocols for the isolation of peripheral blood mononuclear cells (PBMCs) on the LymeSpot results