Abstract
Sarcopenia is a geriatric syndrome and it impairs physical function. Patients with type 2 diabetes mellitus (T2DM) are at a higher risk of sarcopenia. The purpose of this study is to explore characteristics of general information and metabolic factors of sarcopenia in patients with T2DM in the northeast of China, and provide information for the prevention and treatment of sarcopenia in clinical practice.
Patients with T2DM aged ≥65 were recruited in Changchun from March 2017 to February 2018. Questionnaires of general information, physical examination, laboratory and imaging examination were conducted. The patients were assigned into sarcopenia group and non-sarcopenia group according to the diagnostic criteria proposed by Asian working group for sarcopenia (AWGS), and the differences between 2 groups were analyzed.
A total of 132 participants were included in this study, of which, 38 (28.8%) were diagnosed with sarcopenia. 94 (71.2%) were with no sarcopenia. Logistic regression analysis showed that age (OR: 1.182, 95%CI: 1.038–1.346), trunk fat mass (TFM) (OR: 1.499, 95%CI: 1.146–1.960) and free thyroxine (FT4) (OR: 1.342, 95%CI: 1.102–1.635) were independent risk factors for sarcopenia. BMI (body mass index) (OR: 0.365, 95%CI: 0.236–0.661), exercise (OR: 0.016, 95%CI: 0.001–0.169), female (OR: 0.000, 95%CI: 0.00–0.012), metformin (OR: 0.159, 95%CI: 0.026–0.967) and TSM (trunk skeletal muscle mass) (OR: 0.395, 95%CI: 0.236–0.661) were protective factors for sarcopenia.
Sarcopenia in patients with T2DM is associated with increased age, increased TFM and increased FT4 level. Regular exercise, female, metformin administrations, high BMI and increased TSM are associated with lower risk of sarcopenia.
Keywords: clinical characteristics, diabetes mellitus, type 2, sarcopenia
1. Introduction
The musculoskeletal system plays an important role in maintaining posture, completing movements, protecting vital internal organs, and maintaining homeostasis of the body. As aging, musculoskeletal disease has become a serious public health issue. Sarcopenia is a geriatric syndrome, which is associated with age. It is characterized by the reduce of muscle mass, decrease of muscle strength and decline of physical performance.[1] It is related to reduced physical ability, impaired cardio-respiratory function, disability and death in the elderly.[2] The age-related reduction of muscle mass is mainly a reduction of type II muscle fibers and motor neurons and infiltration of muscle lipid.[3] Sarcopenia not only affects daily activities of the elderly resulting in the decline of the quality of life, but also accelerates the progress of metabolic diseases. It is estimated that 50 million people worldwide are suffering from sarcopenia nowadays, and the number will rise to 500 million by 2050,[4] indicating that sarcopenia will increase the burden of social medical expenses, raising concern worldwide.
The definition and diagnostic criteria of sarcopenia proposed by AWGS,[1] adequately covers the body composition, genetic background and ethnicity of Asian people. According to the diagnostic criteria of AWGS, the prevalence of sarcopenia is between 6.8% and 31%,[5–8] which is related to a variety of factors, including gender, age, hormone level, BMI, inflammatory markers, T2DM and tumor.[6,9,10] Patients with T2DM are at a higher risk in developing sarcopenia.[11] Changes of the muscular fibers in participants with T2DM may due to diabetic complications and insulin resistance. Possible mechanism could be oxidative type I muscular fibers reduced and glycolytic type II fibers increased,[12] which accelerate the declination of muscle mass and strength. Furthermore, sustained hyperglycemia increases the accumulation of advanced glycation end products (AGEs) in the muscles and cartilage, which in return leads to muscle stiffness and reduced muscle function.[13,14]
According to AWGS, there were some studies on sarcopenia conducted in the southern districts of China, but none has been reported in the north. Since there are differences in lifestyles including diet and exercise et al, as well as climate between south and north, this study aims to first demonstrate the clinical characteristics of sarcopenia in T2DM in the northeast of China and discuss the factors associated with sarcopenia, in order to provide the evidence for possible effective preventions and treatments.
2. Methods
2.1. Subjects
A cross-sectional study was conducted during March, 2017 to February, 2018 in the department of endocrinology and metabolism of the First Hospital of Jilin University. In-patients at the department who aged ≥65 and met the diagnostic criteria of T2DM proposed by WHO in 1999 were recruited. The participants received at least half an hour of sunlight daily (self-reported). All the participants signed informed consent designed by ethical board of the First Hospital of Jilin University. Participants who had severe peripheral neuropathy, disuse muscle atrophy, malignant tumor, severe cognitive disorder, autoimmune disease were excluded from the study. Participants who had supplement of Vitamin D, medications affecting skeletal muscle in the last 3 months were also excluded from the study. Participants who remained long-term bedridden, and/or failed to complete dua-energy X-ray absorptiometry (DXA), were excluded. The study complied with the Declaration of Helsinki, and was approved by the ethics committee of the First Hospital of Jilin University.
2.2. Questionnaires
Questionnaires were self-reported, and the followings were included:
-
(1)
general conditions of each subject including name, gender, nation, age, menstrual and obstetrical histories, educational level, occupation, type of medical insurance, smoking and alcoholism history.
-
(2)
daily exercise (type, duration and frequency), sleep (time and duration), diet and history of tumbles.
-
(3)
medical history including hypertension, coronary artery disease, cerebrovascular disease and duration history of diabetes, application of anti-diabetic drugs (type, dose, frequency) and subcutaneous insulin (type, dose, frequency).
2.3. Anthropometric measurements
-
(1)
Height and weight were measured according to the clinical standard.
-
(2)
BMI was calculated by dividing weight (in kilograms) by the square of the height (in meters).
-
(3)
Step speed was calculated as the time taken for 6 meters’ walk divided by 6 meters. The participants walked at daily speed. Record the time with a stopwatch (accurate to 0.01 seconds). The average values were calculated after a second measurement.
-
(4)
Grip dynamometer (EH-101 electronic dynamometer, China) was used to measure the grip strength of the dominant hand for 3 times, and the maximum grip strength value was taken into analysis.
-
(5)
Calf circumference was measured around the most prominent part of the gastrocnemius muscle (accurate to 0.1 cm). We asked the participants to stand with their feet shoulder-width apart. Average values were obtained after measuring the left and right sides respectively.
2.4. Body composition by DXA
Measuring instrument: Dual-Energy X-ray Absorptiometry (Luna Prodigy Advance, GE, America).
Measurement method: total body muscle mass, fat mass of the participants was measured, and the CV value of muscle content was 0.89%. All the above measurements were performed by the same technician. Appendicular skeletal muscle mass index (ASMI) = [Appendicular skeletal muscle mass (ASM) (kg)/Height (H)2 (m2)]. ASMI is a diagnostic indicator of reduced skeletal muscle mass.
Diagnosis of sarcopenia: according to AWGS, the diagnostic criteria[1] is defined as the following: the cut-off of reduction of muscle mass is that ASMI is less than 7.0 kg/m2 (male) and 5.4 kg/m2 (female), together with weakness of muscle strength (less than 26.0 kg (male), less than 18.0 kg (female)) and (or) decline of step speed (less than 0.8 m/seconds).
2.5. Biochemical measurements
Eight-hour fasting samples were collected for each participant. Blood samples were centrifuged at 3000 rpm for 8 minutes at 4°C, aliquoted to yield serum and plasm and then stored at −80°C until analyses. Fasting blood glucose (FBG), post-prandial glycemia, liver function, renal function, serum lipid, and creatine kinase were determined by colorimetry (7600–210, Hitachi). Glycosylated hemoglobin was determined by multi-effect liquid chromatography (BIO-RAD-VARIANT2). Blood routine was determined by Semiconductor laser nucleic acid staining method (Sysmex XN9000-1). Thyroid function, 0-minute C peptide and fasting insulin (Fins) were determined by electro-chemiluminescence method (C0bas e62, Roche). HOMA-IR (calculation formula = FBG (mmol/L)∗Fins (mU/L)/22.5). 8:00 blood cortisol, testosterone (male), estradiol (female) and parathyroid hormone (PTH) were determined by chemiluminescence method (DXI800, Bechman). 25-OH-vitamin D and 25-OH-vitamin D3 were measured by liquid chromatography tandem mass spectrometry. C-reactive protein (CRP) was determined by turbidimetry method (7600-210, Hitachi). Twenty-four-hours urinary protein and 24-hours micro albumin were determined by immunoturbidimetry method (7600–210, Hitachi). And lower limb artery ultrasound, carotid ultrasound, sensory nerve quantitative examination, fundus examination and systemic bone mineral density (BMD) were performed successively.
2.6. Statistical analysis
Statistical analyses were performed using SPSS 24.0 software. Data are presented as mean ± SD or median (interquartile range). In all cases, probability (P) value of <.05 was considered statistically significant. The t test was used to determine differences in various parameters between 2 groups. Frequencies were compared between 2 groups by Fisher exact test. The associations between sarcopenia and clinical characteristics were assessed by logistic regression analysis.
3. Results
3.1. Characteristics of participants grouped by sarcopenia
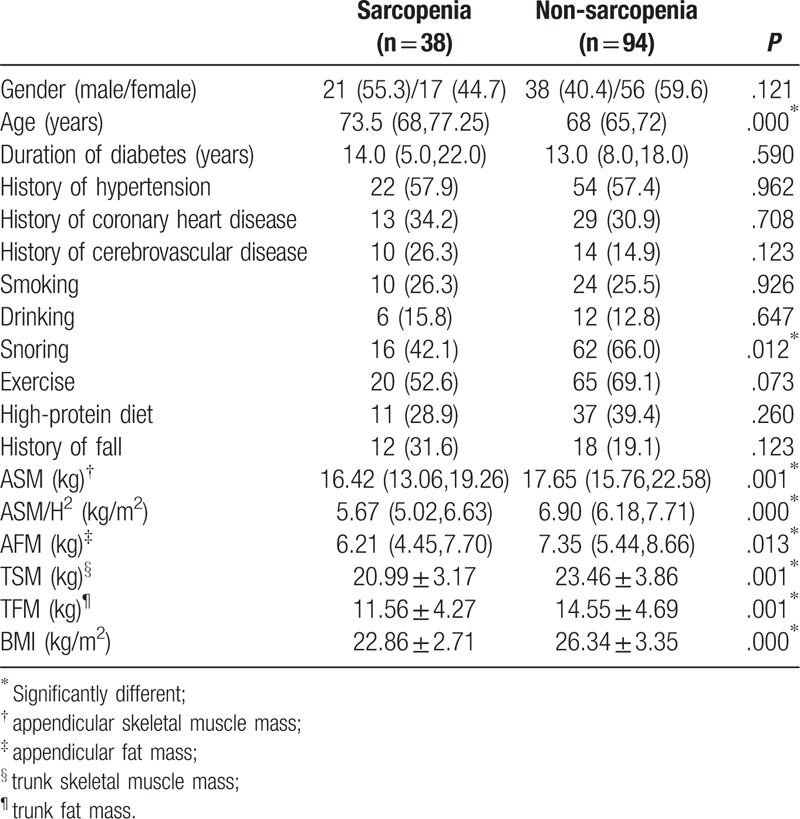
A total of 132 (59 males and 73 females) participants were included in this study. As shown in Table 1, 38 participants were diagnosed with sarcopenia, accounting for 28.8%, with an average age of 73.5 years, and 94 had no sarcopenia, accounting for 71.2%, with an average age of 68 years. The average age of the sarcopenia group was higher than that of the non-sarcopenia group (P < .05), and participants from the sarcopenia group had lower BMI, ASM, ASM/H2, appendicular fat mass (AFM), TSM and TFM than those of the non-sarcopenia group (P < .05). Interestingly, sarcopenia group tends to snore less than non-sarcopenia during sleep (P < .05). No significant difference were found in gender, duration of diabetes, history of hypertension, history of coronary heart disease, history of cerebrovascular disease, smoking, drinking, exercise, high-protein diet, and history of tumbles between 2 groups (P > .05).
Table 1.
Characteristics of subjects categorized by groups of sarcopenia.
3.2. The distribution of age and gender
The overall prevalence of sarcopenia was 28.8%, and the prevalence was 35.6% in male and 23.3% in female (P > .05). Grouped by age, as shown in Table 2, the prevalence of sarcopenia in each age group was 17.4%, 28.1%, 52.4%, 60%, respectively (P < .001). And the prevalence of sarcopenia increased with age (P < .001). Grouped by gender, the prevalence of sarcopenia in women of all age groups was 15.0%, 20.0%, 36.4%, and 57.1%, respectively, with no significant difference (P > .05). The prevalence of sarcopenia in men in all age groups was 20.1%, 35.3%, 70.0%, 66.7%, respectively (P < .05). Moreover, the prevalence of sarcopenia increased with age in men (P < .05), and the trend was shown in Figure 1.
Table 2.
The distribution of age and gender.

Figure 1.
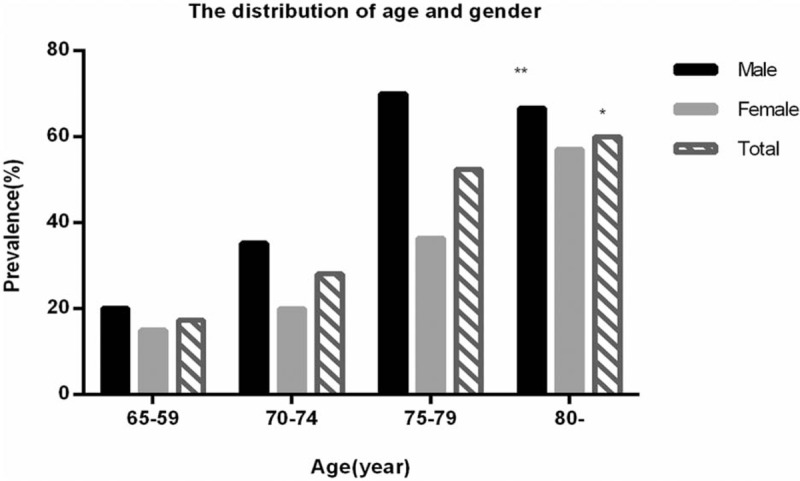
The distribution of age and gender. ∗The prevalence of sarcopenia in each age group was significantly different, and the prevalence of sarcopenia increased with age (P < .001). ∗∗The prevalence of sarcopenia in men of all age groups was significantly different, and it increased with age in men (P < .05).
3.3. Sarcopenia and indicators related to diabetes
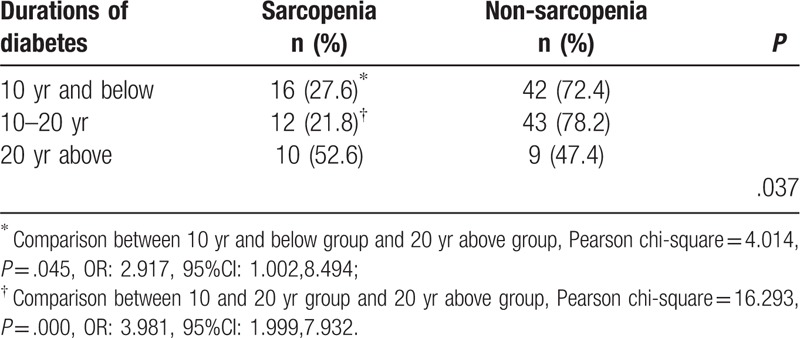
According to the duration of diabetes, the participants were sub-divided into 3 groups, 10 years and below group, 10 to 20 years group and 20 years above group, as shown in Table 3. The prevalence of sarcopenia was 27.6%, 21.8%, and 52.6%, respectively (P < .05). Participants in 20 years above group had significantly higher prevalence of sarcopenia than the other 2 groups (P < .05).
Table 3.
Prevalence of sarcopenia in different durations of diabetes.
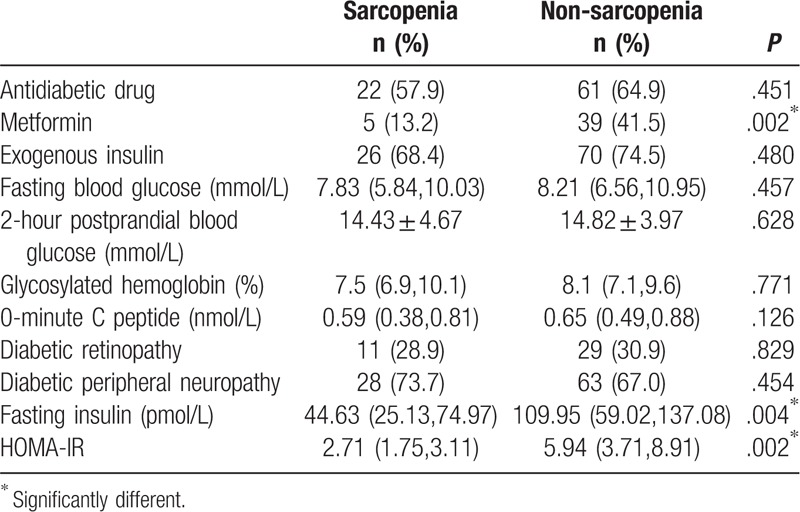
The number of participants who received metformin treatment in the sarcopenia group was significantly fewer than those in the non-sarcopenia group (P < .05). In addition, 36 of the participants did not use exogenous insulin, and their fasting insulin and HOMA-IR in the sarcopenia group were all significantly lower than those in the non-sarcopenia group (P < .05). No significant difference in fasting blood glucose, 2-hour postprandial blood glucose, glycosylated hemoglobin, 0-minute C peptide, diabetic retinopathy, diabetic peripheral neuropathy, whether to use hypoglycemic agents, and whether to use exogenous insulin between sarcopenia and non-sarcopenia groups (P > .05) (Table 4).
Table 4.
Related indicators of diabetes in sarcopenia and non-sarcopenia groups.
3.4. Sarcopenia and biochemical indicators, hormonal indicators
As shown in Table 5, serum uric acid and triglycerides of the sarcopenia group were both significantly lower than those of the non-sarcopenia group (P < .05). FT4 in the sarcopenia group was significantly higher than that in the non-sarcopenia group (P < .05). The T-value of systemic BMD in the sarcopenia group was significantly lower than that in the non-sarcopenia group (P < .05). As shown in Table 6, the subjects were assigned into normal triglyceride group (0.28–1.8 mmol/L) and triglyceride-elevated group (>1.8 mmol/L), and the prevalence of sarcopenia was, 39.7% and 15.3%, respectively (P < .05).
Table 5.
Biochemical indicators and hormonal indicators of the sarcopenia and non-sarcopenia groups.
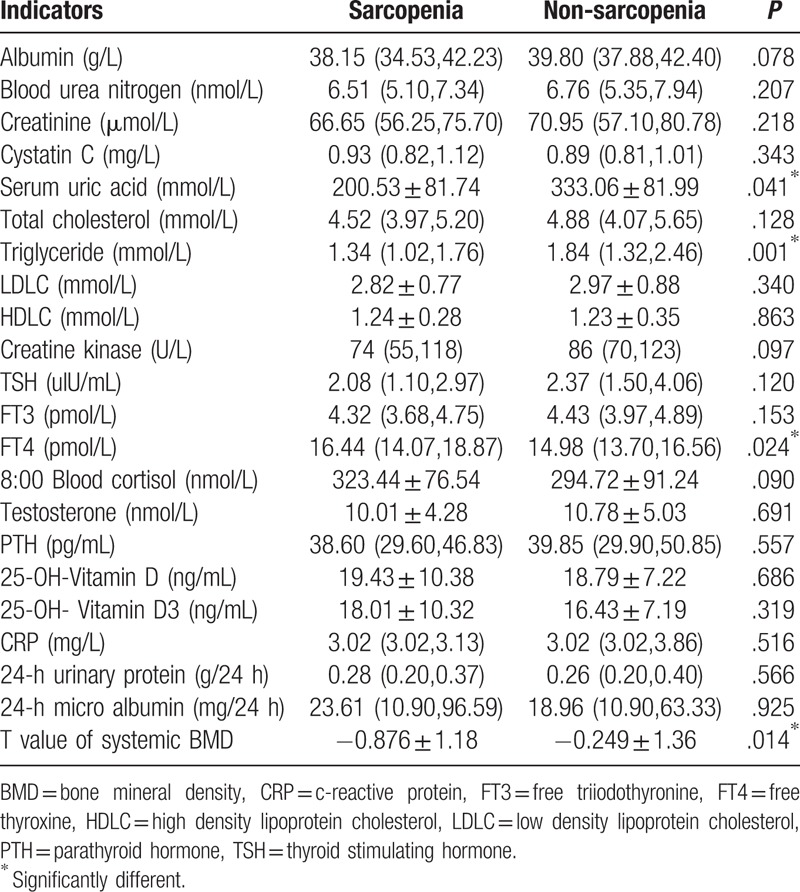
Table 6.
Prevalence of sarcopenia in different triglyceride group.

3.5. Sarcopenia and physical examination
3.5.1. Sarcopenia and BMI
The subjects were sub-divided into 4 groups, those are, the underweight group (BMI < 18.5 kg/m2), the normal weight group (18.5–23.9 kg/m2), the overweight group (24.0–27.9 kg/m2) and the obesity group (>28.0 kg/m2). As shown in Table 7, the prevalence of sarcopenia of each group was significantly different (P < .001). Moreover, with BMI level increasing, the prevalence of sarcopenia significantly decreased (P < .001), as shown in Figure 2.
Table 7.
Prevalence of sarcopenia in different BMI groups.
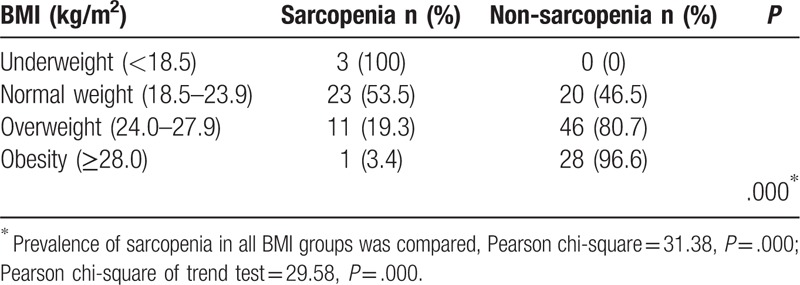
Figure 2.
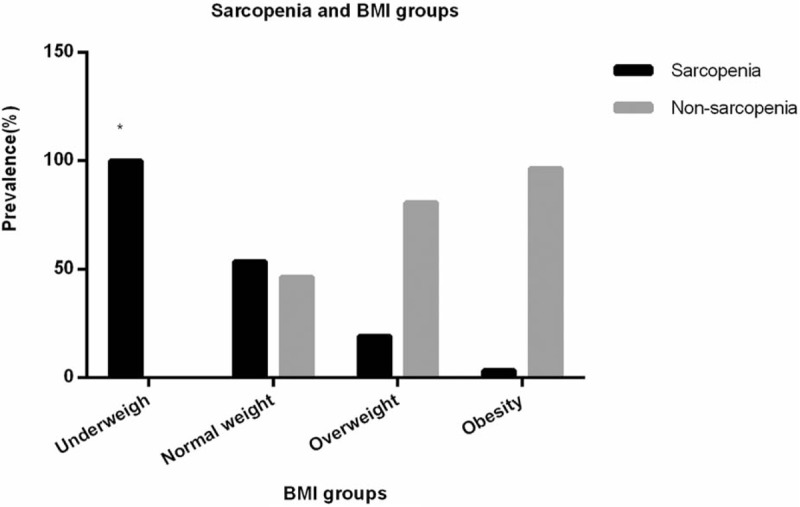
Sarcopenia and BMI groups. ∗With BMI level increasing, the prevalence of sarcopenia significantly decreased (P < .001).
3.5.2. Sarcopenia and grip strength, calf circumference
Stratified by gender, grip strength of men and women in sarcopenia group were both significantly lower than that of non-sarcopenia group (P < .001), and calf circumference of men and women in sarcopenia group was both significantly lower than that in non-sarcopenia group (P < .001), as shown in Table 8.
Table 8.
Grip strength and calf circumference stratified by gender.

3.6. Logistic multiple regression analysis of influence factors for sarcopenia
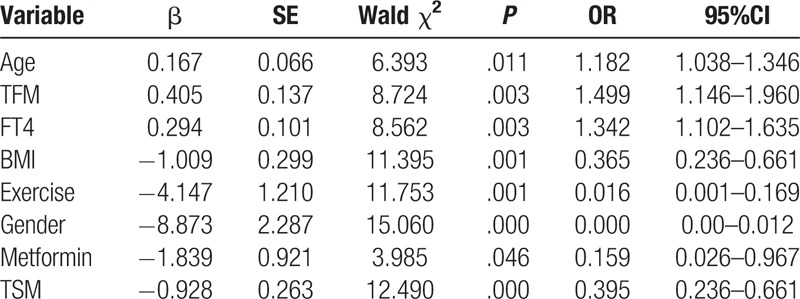
Logistic multiple regression analysis showed that age (OR: 1.182, 95%CI: 1.038–1.346), TFM (OR: 1.499, 95%CI: 1.146–1.960) and FT4 (OR: 1.342, 95%CI: 1.102–1.635) were independent risk factors for sarcopenia. BMI (OR: 0.365, 95%CI: 0.236–0.661), exercise (OR: 0.016, 95%CI: 0.001–0.169), female (OR: 0.000, 95%CI: 0.00–0.012), metformin (OR: 0.159, 95%CI: 0.026–0.967) and TSM (OR: 0.395, 95%CI: 0.236–0.661) were protective factors for sarcopenia, as shown in Table 9.
Table 9.
Logistic multiple regression analysis of influence factors for sarcopenia.
4. Discussion
According to previous literatures, sarcopenia in patients with T2DM are at a higher risk of sarcopenia, which lead the current study focusing on sarcopenia in patients with T2DM. A study conducted in China has reported that participants with T2DM have 1.56 times higher risk of sarcopenia than healthy people.[15] A Korean researcher has reported[16] that the risk of reduction of muscle mass increases 2 to 4 times in participants with T2DM. On one hand, insulin stimulates protein synthesis, insufficient secretion of insulin or insulin resistance will lead to insufficient muscle protein synthesis and increased protein degradation, which may result in sarcopenia.[17] On the other hand, persistent hyperglycemia causes AGEs to accumulate in muscles and cartilages, leading to muscle stiffness and dysfunction.[13,14] AGEs also promote inflammation and dysfunction of endothelial cells in microcirculation of skeletal muscles through receptors of AGEs, which lead to sarcopenia.[18] T2DM patients with increased levels of cytokines such as TNF and IL-6 show negative effects on muscle mass and function.[19] Other studies have demonstrate that hyperglycemia causes decline of muscle function in the early stages of T2DM, and diabetic peripheral neuropathy accelerates the progress of sarcopenia in the late stage.[20] In return, with the development of sarcopenia, mobility of the elderly declines, the muscle's intake of glucose reduces, insulin resistance increases, and diabetes, therefore, will progress. Therefore, the relationship between sarcopenia and T2DM is obvious and we analyzed the clinical characteristics of sarcopenia in T2DM.
4.1. Sarcopenia and indicators related to diabetes in T2DM
This study showed that the prevalence of sarcopenia was significantly higher in the group with a diabetic duration over 20 years than the other 2 groups. This result suggests that the long course of diabetes may promote the occurrence and development of sarcopenia, but the mechanism is not clear yet. Kalyani et al[20] have reported that the prevalence of sarcopenia in T2DM combined with chronic complications including renal insufficiency and (or) peripheral neuropathy may be higher than those without complication. This suggests the longer the course of diabetes, the higher the prevalence of chronic complications, the higher risk of sarcopenia occurs, which is consistent with current findings. However, no clear relationship between sarcopenia and diabetic complications were found in this study, considering the severity of diabetic peripheral neuropathy is not sensible by quantitative sensory testing, which may cause misunderstanding in the results.
As for insulin resistance, since the skeletal muscle is one of the main organs that insulin acts on, the loss of muscle mass can negatively regulate the body's sensitivity to insulin, which contributes to the progress of insulin resistance. This study showed that fasting insulin was lower in sarcopenia group, suggesting reduction of endogenous secretion of insulin may be associated with sarcopenia. It is related to the worse function of pancreatic β cells in older people and in patients with long duration of diabetes, which leads to failure in stimulating the synthesis of muscle proteins. Shishikura et al[21] have reported decreased insulin secretion was associated with reduced muscle mass, and another study showed deficient insulin secretion was a risk factor in men with T2DM,[22] which were consistent with our results. Previous studies[12,23] have demonstrated insulin resistance is associated with sarcopenia, however, current study showed that HOMA-IR in the sarcopenia group was significantly lower than that in the control group, which was probably due to the influence of confounding factors such as weight, BMI and abdominal circumference, and these results require further investigation.
This research showed that the number of participants taking metformin in sarcopenia group was significantly fewer than that in non-sarcopenia group. A randomized, controlled trial involving 91 non-diabetic participants has revealed[24] that gait speed improved in the group of participants who were regularly taking metformin treatment than those who did not, most likely due to the administration of metformin may improve insulin resistant, also due to the increased uptake of glucose and calcium in skeletal muscles,[25] as well as inhibition of inflammation and oxidative stress levels. Metformin is an AMPK agonist, which can enhance the insulin's reaction in adult tissues. Activation of AMPK is also related to autophagy, thus metformin can lead to the induction of atrophic gene MurF1 because of autophagic cell death.[26] However, no study has shown that metformin leads to atrophy of skeletal muscles in vivo,[27] which needs further study.
4.2. Sarcopenia and gender in T2DM
This study showed that prevalence of sarcopenia was 35.6% in men and 23.3% in women. The single factor analysis indicated no significant difference between gender. But the logistic regression analysis suggested that male participants were more likely to suffer from sarcopenia than female participants. The mechanism by which skeletal muscle mass of males decreases faster than that of females remains unclear, but it may be related to the decrease in testosterone secretion. Verschueren et al have suggested that testosterone promotes the synthesis of muscle protein, which is more significant in maintaining muscle mass and muscle function than estrogen,[28] but after the age of 30, testosterone levels in males decrease by 1% per year. Both in human and rodent studies, androgens induce a great increase in muscle mass.[29]
4.3. Sarcopenia and age in T2DM
Our study showed the prevalence of sarcopenia in different ages was significantly different and it increased with age. Moreover, logistic regression presented that age was an independent risk factor for sarcopenia, suggesting that more attentions are needed to elder people. Age-related decline in exercise capacity is a major factor in the decline of muscle mass and muscle strength in older adults.[30] Studies showed that muscle mass declines after peaking in the fourth decade, and after the age of 70, the loss of motor neurons can reach up to 50%, which significantly affects functions of lower limbs,[23] which are consistent with current findings.
4.4. Sarcopenia and exercise in T2DM
Studies have shown that sedentary behavior results in loss of muscle mass, while exercise, due to its anabolic effect, can fight against sarcopenia mainly through different mechanisms, activation of mTORC1 reducing the expression of pro-inflammatory mediators and oxidative stress, and increasing mitochondrial synthesis and tissue reactivity to insulin.[31,32] Resistance exercise is the best choice for the prevention and control of sarcopenia, which can promote the synthesis of net muscle proteins, increase muscle mass, muscle strength and muscle quality, while aerobic exercise is more suitable for maintaining and increasing cardiovascular fitness.[31] In this study, multi-factor logistic regression analysis showed that exercise was a protective factor for sarcopenia, and aerobic exercise or resistance exercise was not distinguished, but mostly aerobic exercise. Chronic aerobic exercise has significant influences on mitochondria, reducing mitochondrial apoptosis and enhancing mitochondrial biosynthesis. Therefore, the elder people should be encouraged to do aerobic and resistance exercise appropriately.
4.5. Sarcopenia and metabolism in T2DM
This study suggested that patients in sarcopenia group had a lower BMI, which was consistent with the previous study,[9] indicating the loss of muscle mass may cause loss of weight. Asians tend to have a relative lower weight than Caucasians, and Asians rarely show sarcopenic obesity. In addition, the calf circumference of both men and women in the sarcopenia group was significantly lower than that of the non-sarcopenia group. Regarding trunk fat mass, this study showed that TFM was an independent risk factor, which might be related to abdominal obesity and increased visceral fat. Adipose tissues increase the secretion of inflammatory markers and lead to the occurrence of sarcopenia.
In the present study, the serum uric acid in the sarcopenia group was significantly lower than that in the non-sarcopenia group. Serum uric acid decreases the level of NO in endothelial cells, thereby, increasing the blood flow of skeletal muscle and glucose uptake, and is also associated with the activity of insulin.[33] Uric acid in proper level acts as a powerful antioxidant and a scavenger of singlet oxygen and free radicals. Uric acid may protect the proteins from oxidative damage due to the antioxidant capacity.
The current study showed that the risk of sarcopenia was significantly higher in the normal triglyceride group than in the triglyceride-elevated group. Since sarcopenia group presented lower ASM, AFM, TSM, TFM, and BMI and may be not sufficient in nutrient, it is easy to conclude. A Korean study[34] has reported that, when using ASM/weight as the diagnostic index, elderly men with sarcopenic obesity are at a higher risk of dyslipidemia than those with sarcopenia alone or simple obesity. Another study[35] has indicated that among postmenopausal women, those who are purely obese had higher triglycerides and lower high density lipoprotein (HDL) cholesterol than those with sarcopenic obesity. In our study, ASM/H2 was used as the diagnostic indicator of sarcopenia, since the definition of sarcopenia varies, the results may be different.
In addition, the loss of muscle mass in participants with sarcopenia may indeed cause low metabolic level of the body, leading to low calf circumference, low BMI, low serum uric acid and low triglyceride. Moreover, this study is a cross-sectional study, which cannot distinguish the cause and effect of the 2 factors. Therefore, further prospective studies are needed to clarify the cause and effect of the 2 factors.
4.6. Sarcopenia and hormones in T2DM
This study presented that FT4 was a risk factor for sarcopenia, suggesting higher FT4 levels may be associated with sarcopenia. A study by Van et al[36] has indicated that increased FT4 level is associated with decreased physical performance and muscle strength, independent of TSH levels. In addition, hyperthyroidism is associated with weight loss, while exercise capacity and loss of weight are both signs of frailty and are similar to sarcopenia. Besides, this study showed that T value of systemic body bone mineral density in sarcopenia group was lower than that of the non-sarcopenia group, while the T value of systemic BMD could not substitute for T value of lumbar or femoral BMD. However, to some extent, it demonstrated that the bone mass was positively correlated with muscle mass. There was a positive correlation between the regulation of muscle mass and bone mass in elder participants. Since both myoblasts and osteoblasts originate from pluripotent mesenchymal stem cells, muscles and bones are regulated by some of the same genes. The study of GWAS suggested that the coding genes of myostatin, α-actinin 3, etc were closely related to both sarcopenia and osteoporosis.[37]
4.7. Limitations and prospects
Firstly, this is a cross-sectional study, which limits its cause-and-effect conclusion. Secondly, the sample size included in this study was relatively small, the researchers are planning to increase the sample size in future studies. In addition, prospective study can be carried out for the study of sarcopenia in 3 aspects respectively, the influence factors of muscle mass, muscle strength and physical performance. In conclusion, the risk of sarcopenia in participants with T2DM is associated with aging, increased trunk fat mass and increased FT4 level. Regular exercise, female, metformin administrations, high BMI and increased TSM are associated with low risk of sarcopenia.
Acknowledgments
Thanks are due to Shuo Yang and Xinyue Hu for polishing the language of this paper and to Longhao Zhang for assistance with making tables and figures.
Author contributions
Conceptualization: Guixia Wang.
Data curation: Xiaokun Gang.
Formal analysis: Zhuo Li.
Funding acquisition: Guixia Wang.
Investigation: Mengzhao Cui.
Methodology: Xiaokun Gang.
Project administration: Gang Wang, Xianchao Xiao, Zongmiao Jiang.
Validation: Xianchao Xiao.
Writing – original draft: Mengzhao Cui, Xiaokun Gang.
Writing – review & editing: Guixia Wang, Xiaokun Gang.
Guixia Wang orcid: 0000-0001-8107-616X.
Footnotes
Abbreviations: AFM = appendicular fat mass, AGEs = advanced glycation end products, ASM = appendicular skeletal muscle mass, ASMI = appendicular skeletal muscle mass index, AWGS = Asian working group for sarcopenia, BMD = bone mineral density, BMI = body mass index, CRP = c-reactive protein, DXA = dual energy X-ray absorptiometry, FBG = fasting blood glucose, Fins = fasting insulin, FT4 = free thyroxine, H = height, HDL = high density lipoprotein, PTH = parathyroid hormone, T2DM = type 2 diabetes mellitus, TFM = trunk fat mass, TSM = trunk skeletal muscle mass.
How to cite this article: Cui M, Gang X, Wang G, Xiao X, Li Z, Jiang Z, Wang G. A cross-sectional study: Associations between sarcopenia and clinical characteristics of patients with type 2 diabetes. Medicine. 2020;99:2(e18708).
XG is co-first author.
This study was supported by a grant from the Jilin Province Science and Technology Agency (20170623092TC-01&20180623083TC-01) and Jilin Province Development and Reform Commission (2016C020).
All procedures performed in studies involving human participants were in accordance with the ethical standards of the ethics committee of the First Hospital of Jilin University and with the 1964 Helsinki declaration and its later amendments or comparable ethical standards.
The authors declare that they have no conflict of interest.
References
- [1].Chen LK, Liu LK, Woo J, et al. Sarcopenia in Asia: consensus report of the Asian Working Group for Sarcopenia. J Am Med Dir Assoc 2014;15:95–101. [DOI] [PubMed] [Google Scholar]
- [2].Hanna JS. Sarcopenia and critical illness: a deadly combination in the elderly. JPEN J Parenter Enteral Nutr 2015;39:273–81. [DOI] [PubMed] [Google Scholar]
- [3].Jackson MJ. Interactions between reactive oxygen species generated by contractile activity and aging in skeletal muscle? Antioxid Redox Signal 2013;19:804–12. [DOI] [PMC free article] [PubMed] [Google Scholar]
- [4].Larsson L, Degens H, Li M, et al. Sarcopenia: aging-related loss of muscle mass and function. Physiol Rev 2019;99:427–511. [DOI] [PMC free article] [PubMed] [Google Scholar]
- [5].Hu X, Jiang J, Wang H, et al. Association between sleep duration and sarcopenia among community-dwelling older adults: a cross-sectional study. Medicine (Baltimore) 2017;96:e6268. [DOI] [PMC free article] [PubMed] [Google Scholar]
- [6].Han P, Kang L, Guo Q, et al. Prevalence and factors associated with sarcopenia in suburb-dwelling older Chinese using the Asian Working Group for sarcopenia definition. J Gerontol A Biol Sci Med Sci 2016;71:529–35. [DOI] [PubMed] [Google Scholar]
- [7].Huang CY, Hwang AC, Liu LK, et al. Association of dynapenia, sarcopenia, and cognitive impairment among community-dwelling older Taiwanese. Rejuvenation Res 2016;19:71–8. [DOI] [PubMed] [Google Scholar]
- [8].Hao Q, Hu X, Xie L, et al. Prevalence of sarcopenia and associated factors in hospitalised older patients: a cross-sectional study. Australas J Ageing 2018;37:62–7. [DOI] [PubMed] [Google Scholar]
- [9].Kim H, Suzuki T, Kim M, et al. Incidence and predictors of sarcopenia onset in community-dwelling elderly Japanese women: 4-year follow-up study. J Am Med Dir Assoc 2015;16:85.e81-88. [DOI] [PubMed] [Google Scholar]
- [10].Sternang O, Reynolds CA, Finkel D, et al. Factors associated with grip strength decline in older adults. Age Ageing 2015;44:269–74. [DOI] [PMC free article] [PubMed] [Google Scholar]
- [11].Mesinovic J, Zengin A, De Courten B, et al. Sarcopenia and type 2 diabetes mellitus: a bidirectional relationship. Diabetes Metab Syndr Obes 2019;12:1057–72. [DOI] [PMC free article] [PubMed] [Google Scholar]
- [12].Cleasby ME, Jamieson PM, Atherton PJ. Insulin resistance and sarcopenia: mechanistic links between common co-morbidities. J Endocrinol 2016;229:R67–81. [DOI] [PubMed] [Google Scholar]
- [13].Dalal M, Ferrucci L, Sun K, et al. Elevated serum advanced glycation end products and poor grip strength in older community-dwelling women. J Gerontol A Biol Sci Med Sci 2009;64:132–7. [DOI] [PMC free article] [PubMed] [Google Scholar]
- [14].Semba RD, Bandinelli S, Sun K, et al. Relationship of an advanced glycation end product, plasma carboxymethyl-lysine, with slow walking speed in older adults: the InCHIANTI study. Eur J Appl Physiol 2010;108:191–5. [DOI] [PMC free article] [PubMed] [Google Scholar]
- [15].Wang T, Feng X, Zhou J, et al. Type 2 diabetes mellitus is associated with increased risks of sarcopenia and pre-sarcopenia in Chinese elderly. Sci Rep 2016;6:38937. [DOI] [PMC free article] [PubMed] [Google Scholar]
- [16].Kim KS, Park KS, Kim MJ, et al. Type 2 diabetes is associated with low muscle mass in older adults. Geriatr Gerontol Int 2014;14: Suppl 1: 115–21. [DOI] [PubMed] [Google Scholar]
- [17].Aleman-Mateo H, Lopez Teros MT, Ramirez FA, et al. Association between insulin resistance and low relative appendicular skeletal muscle mass: evidence from a cohort study in community-dwelling older men and women participants. J Gerontol A Biol Sci Med Sci 2014;69:871–7. [DOI] [PubMed] [Google Scholar]
- [18].Payne GW. Effect of inflammation on the aging microcirculation: impact on skeletal muscle blood flow control. Microcirculation 2006;13:343–52. [DOI] [PubMed] [Google Scholar]
- [19].Cesari M, Penninx BW, Pahor M, et al. Inflammatory markers and physical performance in older persons: the InCHIANTI study. J Gerontol A Biol Sci Med Sci 2004;59:242–8. [DOI] [PubMed] [Google Scholar]
- [20].Kalyani RR, Metter EJ, Egan J, et al. Hyperglycemia predicts persistently lower muscle strength with aging. Diabetes Care 2015;38:82–90. [DOI] [PMC free article] [PubMed] [Google Scholar]
- [21].Shishikura K, Tanimoto K, Sakai S, et al. Association between skeletal muscle mass and insulin secretion in patients with type 2 diabetes mellitus. Endocr J 2014;61:281–7. [DOI] [PubMed] [Google Scholar]
- [22].Tanaka K, Kanazawa I, Sugimoto T. Reduction in endogenous insulin secretion is a risk factor of sarcopenia in men with type 2 diabetes mellitus. Calcif Tissue Int 2015;97:385–90. [DOI] [PubMed] [Google Scholar]
- [23].Batsis JA, Villareal DT. Sarcopenic obesity in older adults: aetiology, epidemiology and treatment strategies. Nat Rev Endocrinol 2018;14:513–37. [DOI] [PMC free article] [PubMed] [Google Scholar]
- [24].Laksmi PW, Setiati S, Tamin TZ, et al. Effect of metformin on handgrip strength, gait speed, myostatin serum level, and health-related quality of life: a double blind randomized controlled trial among non-diabetic pre-frail elderly patients. Acta Med Indones 2017;49:118–27. [PubMed] [Google Scholar]
- [25].Salminen A, Kaarniranta K, Kauppinen A. Age-related changes in AMPK activation: Role for AMPK phosphatases and inhibitory phosphorylation by upstream signaling pathways. Ageing Res Rev 2016;28:15–26. [DOI] [PubMed] [Google Scholar]
- [26].Krawiec BJ, Nystrom GJ, Frost RA, et al. AMP-activated protein kinase agonists increase mRNA content of the muscle-specific ubiquitin ligases MAFbx and MuRF1 in C2C12 cells. Am J Physiol Endocrinol Metab 2007;292:E1555–1567. [DOI] [PubMed] [Google Scholar]
- [27].Cetrone M, Mele A, Tricarico D. Effects of the antidiabetic drugs on the age-related atrophy and sarcopenia associated with diabetes type II. Curr Diabetes Rev 2014;10:231–7. [DOI] [PubMed] [Google Scholar]
- [28].Verschueren S, Gielen E, O’Neill TW, et al. Sarcopenia and its relationship with bone mineral density in middle-aged and elderly European men. Osteoporos Int 2013;24:87–98. [DOI] [PubMed] [Google Scholar]
- [29].Dubois V, Laurent MR, Sinnesael M, et al. A satellite cell-specific knockout of the androgen receptor reveals myostatin as a direct androgen target in skeletal muscle. FASEB J 2014;28:2979–94. [DOI] [PubMed] [Google Scholar]
- [30].Rolland Y, Czerwinski S, Abellan Van Kan G, et al. Sarcopenia: its assessment, etiology, pathogenesis, consequences and future perspectives. J Nutr Health Aging 2008;12:433–50. [DOI] [PMC free article] [PubMed] [Google Scholar]
- [31].Ziaaldini MM, Marzetti E, Picca A, et al. Biochemical pathways of sarcopenia and their modulation by physical exercise: a narrative review. Front Med (Lausanne) 2017;4:167. [DOI] [PMC free article] [PubMed] [Google Scholar]
- [32].Yoon MS. mTOR as a key regulator in maintaining skeletal muscle mass. Front Physiol 2017;8:788. [DOI] [PMC free article] [PubMed] [Google Scholar]
- [33].Nakagawa T, Tuttle KR, Short RA, et al. Hypothesis: fructose-induced hyperuricemia as a causal mechanism for the epidemic of the metabolic syndrome. Nat Clin Pract Nephrol 2005;1:80–6. [DOI] [PubMed] [Google Scholar]
- [34].Baek SJ, Nam GE, Han KD, et al. Sarcopenia and sarcopenic obesity and their association with dyslipidemia in Korean elderly men: the 2008-2010 Korea National Health and Nutrition Examination Survey. J Endocrinol Invest 2014;37:247–60. [DOI] [PubMed] [Google Scholar]
- [35].Aubertin-Leheudre M, Lord C, Goulet ED, et al. Effect of sarcopenia on cardiovascular disease risk factors in obese postmenopausal women. Obesity (Silver Spring) 2006;14:2277–83. [DOI] [PubMed] [Google Scholar]
- [36].van den Beld AW, Visser TJ, Feelders RA, et al. Thyroid hormone concentrations, disease, physical function, and mortality in elderly men. J Clin Endocrinol Metab 2005;90:6403–9. [DOI] [PubMed] [Google Scholar]
- [37].Urano T, Inoue S. Recent genetic discoveries in osteoporosis, sarcopenia and obesity. Endocr J 2015;62:475–84. [DOI] [PubMed] [Google Scholar]


