

Abstract
The aboveground parts of terrestrial plants (collectively called phyllosphere) are sometimes considered to be the “lungs of the planet” and represent one of the most abundant habitats for microbiota colonization on earth. Whether and how plants control phyllosphere microbiota to ensure plant health is poorly understood. Here we show that the Arabidopsis quadruple mutant (min7 fls2 erf cerk1; mfec1 hereinafter) simultaneously defective in pattern-triggered immunity and the MIN7 vesicle traffic pathway or the constitutively activated cell death1 (cad1) mutant defective in a “membrane-attack-complex/perforin (MACPF) domain” protein have altered endophytic phyllosphere microbiota and display leaf tissue damages associated with dysbiosis. The relative abundance of Firmicutes was dramatically reduced, whereas Proteobacteria were enriched in the mfec and cad1 mutants, bearing some cross-kingdom resemblance to what occurs in human inflammatory bowel disease. Bacterial community transplantation experiments demonstrated a causal role of a properly assembled leaf bacterial community in phyllosphere health. Pattern-triggered immune signaling, MIN7 and CAD1 are found in major land plant lineages and are likely key components of a genetic network through which terrestrial plants control the level and nurture the diversity of endophytic phyllosphere microbiota for survival and health in a microbe-rich environment.
The phyllosphere is inhabited by a diverse microbiota, with some phyllosphere microbiota living on the surface of plants as epiphytes and others residing inside leaves as endophytes2,3. Compared to the intensively studied roles of root-colonizing microbiota in plant health4–11, the collective community-level contribution of phyllosphere microbiota to plant growth, development and health is less understood. The phyllosphere is functionally distinct from the belowground rhizosphere. Compared to roots, for example, leaves have a larger apoplast, which facilitates gas exchange essential for photosynthesis and provides a largely air-filled internal space for microbiota colonization. Interestingly, it has been shown that the composition of leaf microbiota can be influenced by host genotypes12–14 and a recent ecological study showed an intriguing positive correlation between leaf bacterial diversity and terrestrial ecosystem productivity15. However, whether these variations in phyllosphere microbiota make a causal contribution to (or merely a consequence of) plant health remains an unresolved fundamental question.
In a previous study aimed at identifying plant pathways that are attacked by the bacterial pathogen Pseudomonas syringae pv. tomato (Pst) DC3000, we noticed that Arabidopsis quadruple mutants (e.g., mfec or min7 bak1, bkk1 cerk1 [mbbc1]) not only allowed increased proliferation of a nonpathogenic mutant of Pst DC3000, but also harbored a greater abundance of endophytic leaf microbiota under high humidity, one of the most common environmental conditions plants encounter in nature. mfec and mbbc mutants are defective in two pathways ˗ pattern-triggered immune signaling16,17 and the MIN7 vesicle traffic pathway, which is involved in modulating water content in the apoplast1. Surprisingly, the mfec and mbbc mutants exhibited spontaneous leaf necrosis and chlorosis in the absence of pathogen inoculation1. However, the lack of proper soil-based gnotobiotic plant growth systems (the mfec and mbbc mutants showed most obvious phenotypes when grown in soil) prohibited us from answering the fundamental question of whether altered leaf endophytic microbiota are the cause or merely a consequence of poor phyllosphere health of mfec and mbbc plants.
Genotype-dependent shift of microbiota
Because mfec and mbbc exhibited similar phenotypes in initial experiments, we conducted further characterization using the mfec mutant and found additional intriguing phenotypes. First, chlorosis and/or necrosis phenotypes in the mfec mutant were observed in plants grown in different soil types in air-circulating growth chambers, albeit to various degrees (see Fig. 1a and Extended Data Fig. 1a). Second, tissue damages appeared to be restricted mostly to leaves because roots of Col-0 and the mfec mutant appeared similar (Extended Data Fig. 1b). Third, in contrast to the drastic difference in the levels of endophytic bacterial microbiota (estimated after surface sterilization to remove epiphytic bacteria), little difference was observed between Col-0 and mfec plants in total leaf bacterial microbiota (without surface sterilization), which include both epiphytic and endophytic bacteria (Fig. 1b). The total bacterial microbiota level was usually at least 100-fold higher than the endophytic bacterial microbiota level (Fig. 1b; in Col-0). Our results provided evidence for compartment-specific modulation of phyllosphere microbiota and suggest that the bulk epiphytic phyllosphere bacteria may have a less intimate interaction with and, therefore, may be less influenced by host innate immune signaling and the MIN7 vesicle traffic pathway.
Fig. 1. Total and endophytic leaf microbiota in Col-0 and mfec plants.
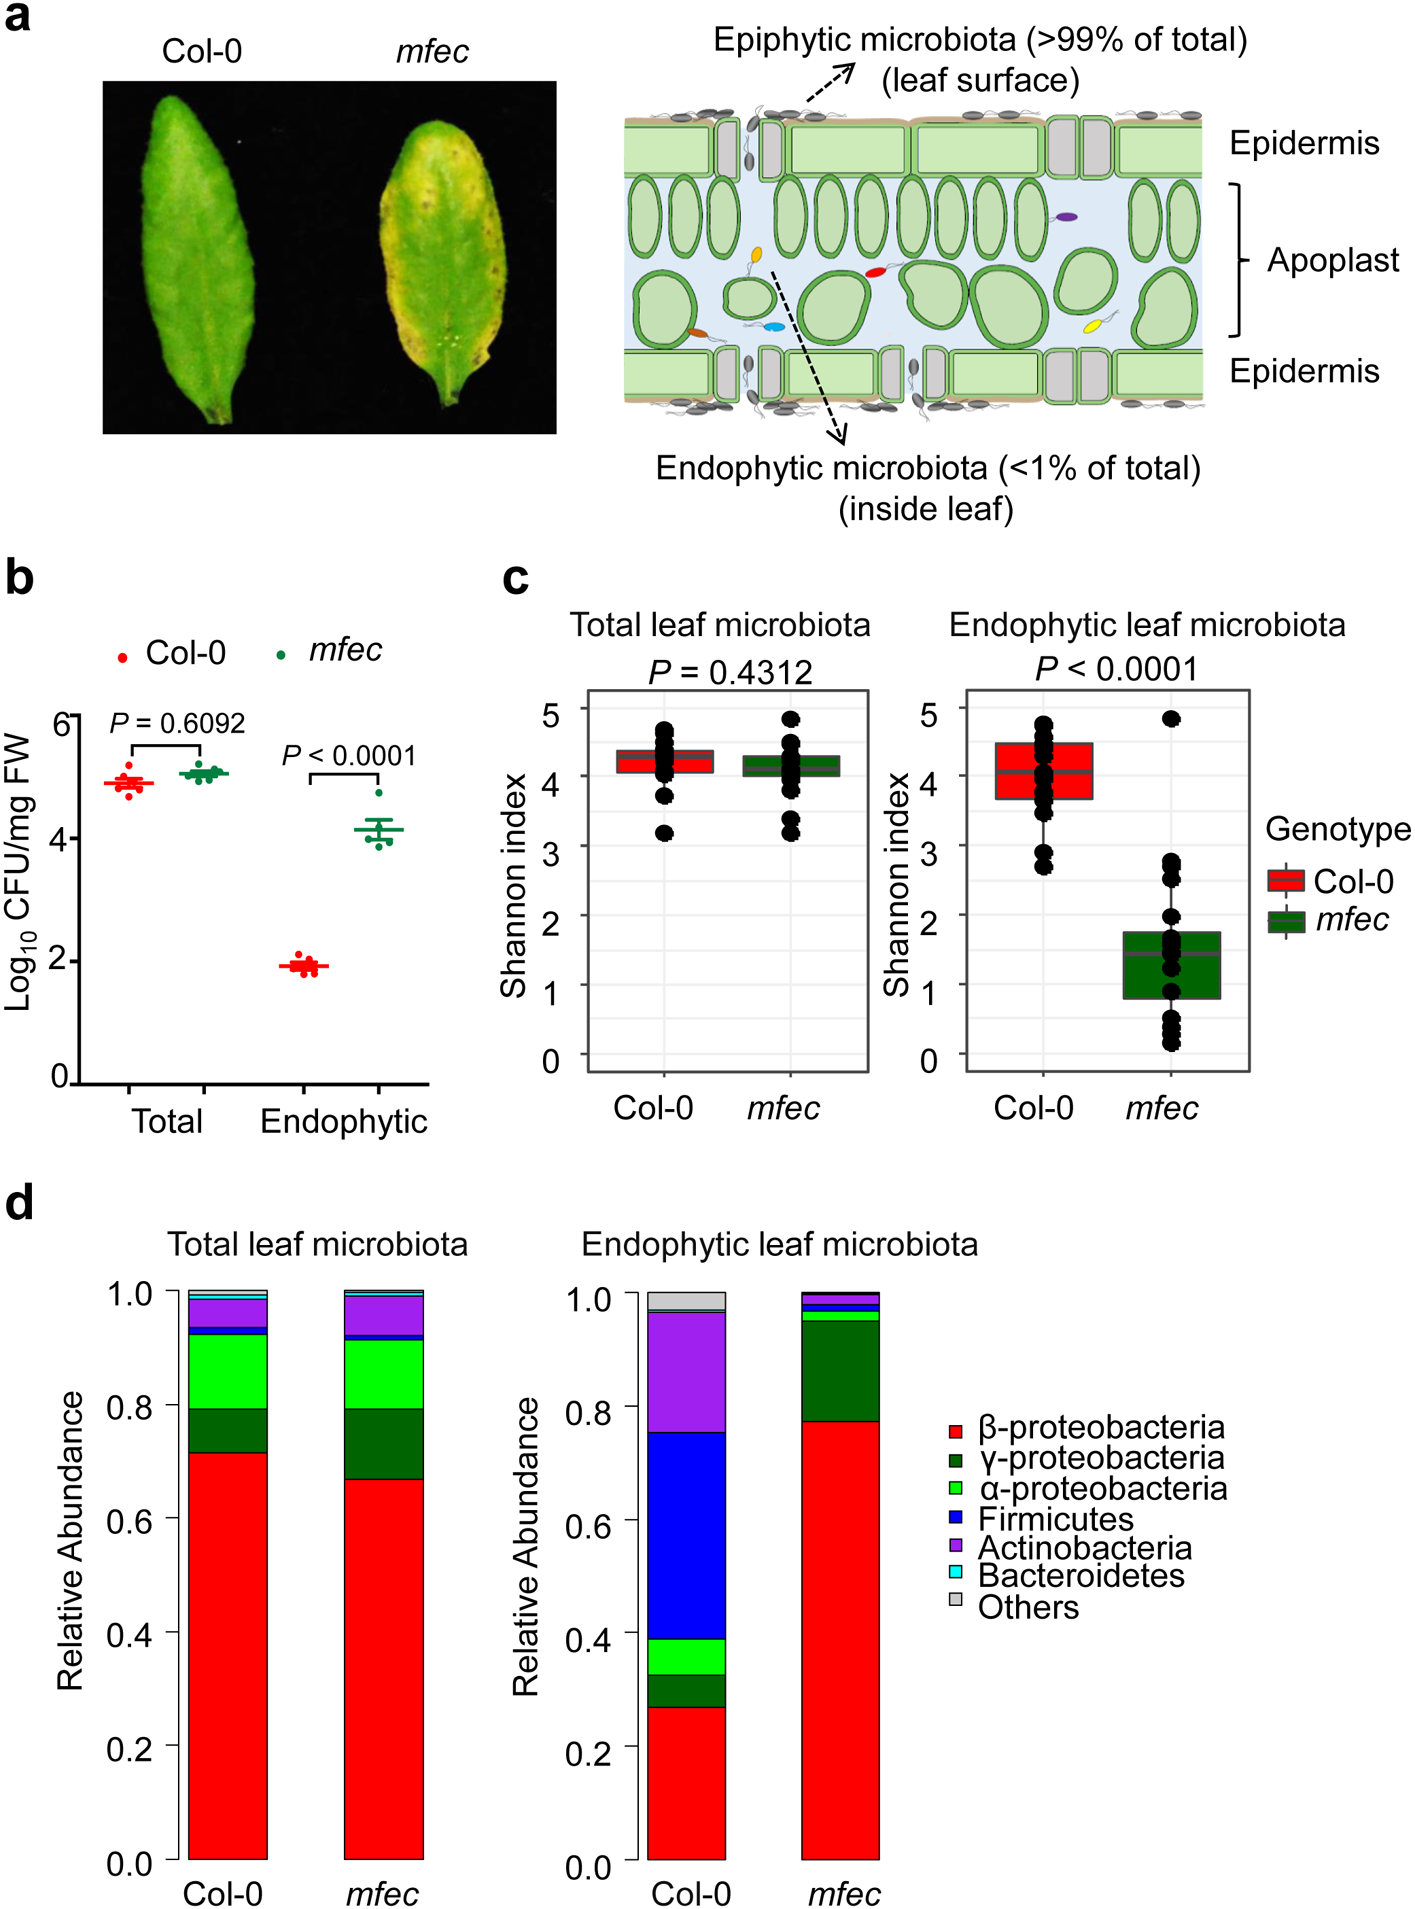
a and b, Leaf appearance of (a) and levels of leaf microbiota (b) in 5-week-old Col-0 and mfec plants grown in Arabidopsis Mix potting soil. a (left), Pictures at day 5 after plants (grown at ~60% humidity) were exposed to high humidity (~95%). a (right), A diagram depicting epiphytic and endophytic microbiota in a leaf cross-section. Statistical analysis was performed using one-way ANOVA with Tukey’s test. n = 6 biological replicates for total bacteria populations, n = 5 biological replicates for endophytic bacteria populations. Data are shown as mean ± s.e.m. Experiments (a and b) were repeated three times with similar results. c and d, 16S rRNA gene sequence profiles of total and endophytic bacteria in Col-0 and mfec plants grown in Arabidopsis Mix potting soil. Shannon indexes (c) and the relative abundance of bacteria at the phylum level (d) are presented. The horizontal bars within boxes represent medians. The tops and bottoms of boxes represent the 75th and 25th percentiles, respectively. The upper and lower whiskers extend to data no more than 1.5× the interquartile range from the upper edge and lower edge of the box, respectively. Statistical significance was determined by two-tailed Mann Whitney test. Biological replicate numbers are: Col-0 (n = 15) and mfec (n =15) for analysis of total leaf bacterial microbiota across 3 independent experiments; Col-0 (n = 18) and mfec (n=20) for analysis of leaf endophytic bacterial microbiota across 4 independent experiments.
Next, we conducted 16S rRNA gene sequencing analysis of leaf bacterial communities in Col-0 and mfec plants. In these experiments, plants were grown in “Arabidopsis Mix” potting soil in air-circulating growth chambers for colonization of phyllosphere microbiota. We observed that the endophytic leaf community in Col-0 plants was substantially more diverse than that in the mfec plants, as judged by Shannon index and observed OTUs (Fig. 1c and Extended Data Fig. 2a, b). Most strikingly, Firmicutes and Actinobacteria were abundantly observed in Col-0 leaves, whereas their relative abundance was greatly reduced in the mfec mutant. Conversely, Beta- and Gamma-proteobacteria were greatly enriched in mfec leaves (Fig. 1d). In contrast, total leaf bacteria showed no significant difference in bacterial composition between Col-0 and mfec leaves (Fig. 1c, d), providing further evidence for profound compartment-specific modulation of the level and composition of leaf microbiota by pattern-triggered immunity and MIN7 vesicle traffic pathway.
To determine the contribution of pattern-triggered immunity and the MIN7 vesicle traffic pathway, individually, to the endophytic leaf microbiota shift in the mfec mutant, we performed further 16S rRNA gene sequencing. In these experiments, we added a 48-member leaf endophytic bacterial community derived from healthy Col-0 plants (i.e., SynComCol−0, Supplementary Information Table 1) to the Arabidopsis Mix potting soil (as a consistent microbiota source, in addition to presumably variable to soil/air-derived communities to which plants were exposed in growth chambers). Again, we observed a significant reduction in the overall diversity and a substantial shift in the composition of the endophytic bacterial community in the mfec leaves, but not in fec (defective in pattern-triggered immunity alone) or min7 (defective in MIN7 pathway alone) leaves, compared to that in Col-0 leaves (Fig. 2a, b and Extended Data Fig. 2c). Correspondingly, only mfec quadruple mutant plants displayed necrosis and chlorosis and had a higher endophytic bacterial microbiota level (Fig. 2c, d). These results show non-redundant and essential roles of pattern-triggered immunity and the MIN7 vesicle traffic pathway in controlling the endophytic leaf microbiota in Arabidopsis.
Fig. 2. Endophytic leaf microbiota in Col-0, fec, min7 and mfec plants.

a and b, 16S rRNA gene sequence profiles of endophytic leaf bacteria in plants grown in Arabidopsis Mix soil supplemented with SynComCol-0. Shannon indexes (a) and the relative abundance of bacteria at the phylum level (b) are presented. Data presentation and statistical analysis as in Fig. 1c, d. Biological replicate numbers passing quality control are: Col-0 (n = 20), fec (n = 19), mfec (n = 19) and min7 (n = 19) across 4 independent experiments. c and d, Levels of endophytic leaf microbiota (c) and leaf appearance (d) of 5-week-old plants 6 days after plant were shifted to high humidity (~95%). Statistical analysis was performed by one-way ANOVA with Tukey’s test. n = 3 biological replicates, data are shown as mean ± s.e.m. Experiments were repeated four times with similar results.
Further analysis of endophytic microbiota 16S profiling data from SynCom-supplemented experiments revealed changes in specific ASVs (amplicon sequence variants representing unique bacterial 16S rRNA gene sequences) between Col-0 and mfec (Supplementary Information Table 2). ASVs belonging to Comamonadaceae (ASV1, ASV113, ASV141 and ASV280), Xanthomonadaceae (ASV12 and ASV386), Alcaligenaceae (ASV3), and Sphingomonadaceae (ASV245) were enriched in mfec plants (together representing 91.97% of reads in mfec plants compared to only 39.69% in Col-0 plants). Conversely, 33 Paenibacillaceae ASVs are depleted in mfec plants (representing 24.83% and 0.52% of reads in Col-0 and mfec plants, respectively). However, the observed modest enrichment of above-mentioned ASVs, based on relative abundance, cannot account for the ~100-fold increase of total endophytic microbiome population in the mfec mutant, suggesting contributions of other Proteobacteria ASVs to the increase of the total load of endophytic microbiota in mfec leaves without being reflected by their relative abundance to each other. A clear resolution of all ASVs will require a future study using alternative methodologies that are more appropriate for estimating absolute abundance, instead of relative abundance, of each ASV.
Role of mfec microbiota in dysbiosis
The reduction of overall relative bacterial diversity and conversion of a Firmicute-rich to Proteobacteria-rich community in the mfec mutant was intriguing because these changes bear resemblance to what are observed in human microbiome dysbiosis associated with inflammatory bowel disease (IBD)18,19. This raised the possibility that tissue damages in mfec plants may result from a form of dysbiosis in the plant kingdom. However, true dysbiosis implies a causative role of altered microbiota in symptom induction. To test this possibility, we grew plants in sterile 1/2 Murashige-Skoog (MS) agar plates as well as a newly developed peat-based gnotobiotic plant growth system (“GnotoPot” hereinafter; Methods) and found that the mfec plants appeared healthy in the absence of microbiota (Extended Data Fig. 2d, e). In contrast, chlorosis and some necrosis were observed in mfec plants in the presence of leaf endosphere-derived SynComCol-0. As control, genetically wild-type Col-0 plants remained healthy in the presence of SynComCol-0. Thus, SynComCol−0 is sufficient to partially recapitulate host genotype-dependent dysbiotic symptoms in the phyllosphere.
Next, we addressed the important question of whether mfec-associated (i.e., “improperly assembled”) microbiota per se is sufficient to cause dysbioptic symptoms in genetically wild-type Col-0 plants. For this purpose, we assembled a 52-member mfec leaf-derived endophytic bacterial community, called SynCommfec (Supplementary Information Table 1), which was constructed in parallel with the above-mentioned SynComCol-0. Genome sequencing of individual isolates in SynComCol−0 and SynCommfec confirmed a more diverse and balanced bacterial composition in SynComCol−0 compared to that in SynCommfec (Extended Data Fig. 3a and Supplementary Information Table 3, 4 and 5), partially reflecting the endophytic bacterial composition found in Col-0 and mfec leaves, as revealed by 16S rRNA gene sequencing (Fig. 1d). In particular, Firmicute isolates are found frequently and represented 20.8% relative abundance in SynComCol−0, whereas, strikingly, no culturable Firmicutes were recovered in SynCommfec. Conversely, 96.2% of isolates were Proteobacteria in SynCommfec, compared to 62.5% of isolates belonging to Proteobacteria isolates in SynComCol−0 (Supplementary Information Table 1). There were additional taxonomic differences in the two synthetic communities even though they were derived from Col-0 and mfec plants that were grown in the same soil/growth chamber at the same time (Methods), illustrating the powerful influence of the mfec genotype on the assembly of the leaf endophytic bacterial community.
We conducted three types of functional assays to rigorously test whether mfec-associated (i.e., “incorrectly assembled”) microbiota could cause health-damaging dysbiosis. First, in MS agar plate assay SynCommfec-inoculated Col-0 plants had significantly reduced biomass relative to SynComCol−0-inoculated Col-0 plants (Fig. 3a, b). Second, when grown in peat-based GnotoPots Col-0 plants appeared healthy in the presence of SynComCol−0, but showed varying degrees of seedling stunting and overall rosette size reduction in the presence of SynCommfec (Fig. 3c, d). Third, when infiltrated at a concentration of 1×10⁸ CFU/mL into otherwise healthy leaves of fully grown and colonized Col-0 plants, SynCommfec, but not SynComCol−0, induced prominent necrosis and chlorosis (Fig. 3e). In addition, SynCommfec grew to a higher population than SynComCol−0 in Col-0 leaves (Fig. 3f). When infiltrated at a lower concentration of 1×10⁷ CFU/mL (equivalent to ~104 CFU/mg leaf tissue in Arabidopsis; Extended Data Fig. 3b), which simulates the endophytic microbiota level in mfec leaves (Fig. 1b), SynCommfec was still capable of causing tissue damages, but to a lesser degree with a spotty pattern (Fig. 3e and Extended Data Fig. 3c). Altogether, these results, from three independent assays, demonstrated that a dysbiotic microbiota (SynCommfec) is sufficient to confer a negative health impact in genetically wild-type plants and provided, to our knowledge, the first evidence for the importance of assembling a normal leaf endophytic microbiota to ensure phyllosphere health.
Fig. 3. Functional impact of SynComCol−0 and SynCommfec on plant health.

a and b, Phenotype (a) and biomass (b) of Col-0 seedlings inoculated with SynComCol−0 or SynCommfec. Twelve 14-day-old seedlings were weighed as one sample (see Methods). The Box and Whisker plot displays biomass, with min, median and max indicated. Statistical significance was determined by two-tailed Mann Whitney test. n = 13 biological replicates. c and d, Appearance (c) and leaf area per plant (d) of Col-0 plants grown in GnotoPots in the presence of SynComCol−0 or SynCommfec for 26 days. Data presentation and statistical analysis as in b. n = 20 biological replicates. e and f, Col-0 leaves were syringe-infiltrated with SynComCol−0 or SynCommfec at 1 ×10⁸ CFU/ml, and leaf images (e) and bacterial populations (f) were recorded 5 days after infiltration. Statistical significance was determined by two-tailed Mann Whitney test. n = 6 biological replicates, data are shown as mean ± s.e.m. All experiments in this figure were repeated three times with similar results.
Next, we investigated whether individual strains in SynComCol−0 and SynCommfec could cause tissue damages when infiltrated into leaves of Col-0 plants grown in Arabidopsis Mix soil. At the inoculum of 1×10⁸ CFU/mL more SynCommfec strains (32 strains) caused tissue damages than SynComCol−0 strains (17 strains), supporting the hypothesis that mfec leaves are enriched for tissue-damaging bacteria (Supplementary Information Table 1). At the inoculum of 1×10⁷ CFU/mL (equivalent to ~104 CFU/mg leaf tissue found in mfec leaves), ten SynCommfec strains, compared to only 4 SynComCol−0 strains, still induced mild tissue damages (Supplementary Information Table 1). Interestingly, none of the “symptom-inducer” strains multiplied like Pst DC3000, a virulent pathogen of Arabidopsis (Extended Data Fig. 4a), consistent with the hypothesis that these “symptom-inducer” strains are not canonical pathogens per se, but likely represent potentially harmful members of a normal leaf microbiota that are kept at low, non-damaging levels in the healthy wild-type phyllosphere. We assembled a 5-member sub-SynCom, consisting of SynCommfec-derived Proteobacteria strains, which induced robust leaf tissue damage (Extended Data Fig. 4b). Each of these five strains was sufficient to cause leaf damage, suggesting functional redundancy within SynCommfec in the induction of phyllosphere dysbiosis. On the other hand, simple removal of Firmicutes from SynComCol−0 was not sufficient to produce a dysbiotic bacterial community (Extended Data Fig. 3c). This is consistent with the fact that there are many fine taxonomical differences between strains of SynComCol−0 and SynCommfec.
Mechanisms for bacterial community shift
Next, we investigated the underlying mechanism by which mfec plants lost the ability to maintain endophytic leaf bacterial diversity. We hypothesized that, in addition to host genetic influences, antagonistic bacterial interactions might be involved. To test this hypothesis, we performed binary inhibition assays (2,116 combinations) on R2A media of 46 strains that represent all bacterial species we identified in SynComCol−0 and SynCommfec. This assay revealed a surprising pattern of almost uni-directional antibiosis: most Firmicutes were strongly inhibited by a subset of Proteobacteria in vitro (Extended Data Fig. 5).
We were initially puzzled by this in vitro observation because it could not explain the co-existence of both Firmicutes and Proteobacteria in Col-0 leaves. We then considered the possibility that perhaps the largely uni-directional antibiosis observed on R2A media may become biologically relevant only when two bacteria are spatially close in vivo (i.e., when endophytic bacterial populations become relatively high, as was observed in mfec leaves; Fig. 1b). To examine this possibility, we further studied strong binary interaction pairs (e.g., Proteobacteria strain C13 vs. Firmicute strain C3, Proteobacteria strain C45 vs. Firmicute strain C3, and Proteobacteria strain C13 vs. Firmicute strain C41, respectively) in vivo (i.e., infiltrated into leaves of Col-0 plants grown in Arabidopsis Mix potting soil) using two different bacterial concentrations: 1×10⁴ CFU/mL (equivalent to 1× 10² CFU/cm2 leaf) and 1×10⁶ CFU/mL (equivalent to 1 ×10⁴ CFU/cm2 leaf). Remarkably, for all three binary interactions examined, Firmicute strains were outcompeted only when high inoculate were used (Extended Data Fig. 6). No such competition was observed between Proteobacterium strain C52 vs. Firmicute strain C3, which did not show inhibition in vitro (Extended Data Fig. 5b and 6b). These results suggest a possible mechanism to explain why mfec plants lost the ability to maintain endophytic leaf bacterial diversity. In wild-type Col-0 leaves, pattern-triggered immunity and the MIN7 vesicle traffic pathway restrain the growth of leaf endophytic bacteria, including the “aggressive” members of Proteobacteria that could inhibit the “vulnerable” members of the leaf endophytic bacteria, most notably, Firmicutes. In the mfec mutant, over-proliferation of leaf endophytic bacteria likely leads to mass-inhibition of Firmicutes by “aggressive” Proteobacteria strains, contributing to the reduction of overall relative bacterial diversity and conversion of a Firmicute-rich community in Col-0 leaves to a Proteobacteria-rich community in the mfec mutant leaves.
A framework for microbiota homeostasis
While our results so far provided strong evidence for the importance of pattern-triggered immunity and the MIN7 vesicle traffic pathway in controlling endophytic phyllosphere microbiota, it remained unclear whether these two processes are mechanistically separate or are components of a large molecular framework. Fortuitously, during this study we discovered mfec-like phenotypes in another Arabidopsis mutant called ben3, which was initially isolated based on a genetic screen for a defect in intracellular vesicle traffic20,21. The ben3 mutant phenocopied the mfec quadruple mutant in (i) exhibiting spontaneous dysbiosis-like symptoms (Fig. 4a and Extended Data Fig. 7a, c), (ii) harboring a higher level of leaf endophytic microbiota compared to Col-0 plants (Fig. 4b and Extended Data Fig. 7b), and (iii) hosting a leaf endophytic microbial community that is enriched in Proteobacteria and depleted in Firmicutes (Fig. 4c, Extended Data Fig. 9a). During further characterization, however, we discovered that independent big2 mutants carrying T-DNA insertions (big2–1 and big2–2) did not show dysbiosis phenotypes (Extended Data Fig. 8a, b, g), and, by bulk segregation analysis and next-generation sequencing (Methods), we eventually identified the causal mutation to be a S205F mutation in the Constitutively Activated Cell Death1 (CAD1) gene, which encodes a membrane attack complex/perforin (MACPF) domain protein (Extended Data Fig. 8c–g and Supplementary Information Table 6) localized to the plasma membrane22–24.
Fig. 4. Microbiota phenotypes in the ben3 (cad1 hereinafter) mutant.

a and b, Appearance (a) and levels of total and endophytic leaf microbiota (b) in Col-0 and cad1 plants grown in Arabidopsis Mix soil supplemented with SynComCol−0 for four weeks before plants were shifted to high humidity (~95%) for 2 days (see Methods). Statistical analysis was performed by one-way ANOVA with Tukey’s test. n = 6 biological replicates; data are shown as mean ± s.e.m. c, Shannon indexes of 16S rRNA gene sequence profiles of endophytic leaf bacteria in Col-0 and cad1 plants supplemented with SynComCol-0. Data presentation and statistical analysis as in Fig. 1c. Biological replicate numbers are: Col-0 (n = 20) and cad1 (n = 20). d and e, Western blot analyses of CAD1 protein in Col-0 plants (e) and min7 (f) plants. Five-week-old Col-0 and min7 leaves were infiltrated with 1 μM flg22 and harvested at time points indicated. The CAD1 protein was detected with a CAD1 antibody and nonspecific bands show equal loading. Uncropped gel image is shown in Supplementary Fig. 1. All experiments in this figure were repeated three times with similar results.
We found it surprising that a single cad1 gene mutation could phenocopy the mfec quadruple mutants that are defective in two separate cellular processes. One possibility, we reasoned, is that CAD1 may be one of the convergent components downstream of pattern-triggered immunity and the MIN7 vesicle traffic pathway. Consistent with this possibility, we found that the CAD1 gene and protein were induced in response to flg22 (Fig. 4d and Extended Data Fig. 8h), an inducer of pattern-triggered immunity25,26, and, interestingly, flg22-induced accumulation of the CAD1 protein was affected by the min7 mutation (Fig. 4e and Extended Data Fig. 8i). These results suggest that pattern-triggered immunity and the MIN7 vesicle traffic pathway converge on CAD1 as three important components of a large molecular framework that controls endophytic microbial abundance and diversity in the phyllosphere (Extended Data Fig. 9).
Discussion
Results reported here begin to highlight conceptual parallels between plants and mammals in the mechanism of preventing dysbiosis, which has devastating health consequences. In particular, defects in innate immunity pathways seem to be a common determinant underlying dysbiosis in mammals27–29 and plants (this study). In addition, CAD1 belongs to the MACPF protein family, some members of which, like complement protein C9 and Perforin, have been shown to be involved in innate and adaptive immunity against pathogens in mammals30,31. Pattern-triggered immunity, MIN7 and CAD1 are broadly conserved across plant taxa (Extended Data Fig. 10 and Supplementary Information Table 7), suggesting that host control of endophytic phyllosphere microbiota level and diversity may be a conserved feature in the plant kingdom. Future manipulation of host genetic pathways regulating microbiota homeostasis may result in a better and more climate-resilient phyllosphere microbiota, which in turn could positively impact the performance of natural ecosystems and crop fields. See “Supplementary Discussion” for additional discussion.
Methods
Plant materials and growth conditions.
For most experiments, Arabidopsis thaliana plants were grown in “Arabidopsis Mix” greenhouse potting soil (equal parts of SUREMIX [Michigan Grower Products Inc.], medium vermiculate and perlite; autoclaved once) or Redi-Earth soil (Sun Gro Horticulture) in air-circulating growth chambers for colonization of phyllosphere microbiota. Plants were grown under relative humidity set at 60%, temperature at 22°C, light intensity at 100 μE⋅m2⋅s and photoperiod at a 12 h light-12 h dark cycle. Five-week-old plants were used for bacterial inoculation and microbiota assays.
The wild-type accession Col-0, min7 fls2 erf cerk1 (mfec), ben3 (i.e., cad1–5 used in this study) and dde2–2/ein2–1/pad4–1/sid2–2 (deps) mutant derivatives were described previously1,21,32 or in this study. The big2–1 (SALK_033446) and big2–2 (SALK_016558) T-DNA insertion mutants were obtained from the Arabidopsis Biological Resource Centre (ABRC) at The Ohio State University.
Bacterial quantification.
To quantify culturable endophytic bacterial communities, leaves were surface-sterilized in 75% ethanol for 1 min and rinsed in sterile water twice. After air-drying to evaporate surface water, leaves were weighed and ground in 1 mL sterile 10 mM MgCl2 buffer. A serial dilution in 100 μL (to up to 10−3 for Col-0 and up to 10−5 for mfec and cad1 mutants) was made and plated on R2A plates (100 mm × 100 mm). Under experimental conditions in this study, almost all leaf bacteria grew to large enough micro-colonies in R2A plates in 2–3 days that could be efficiently counted under a microscope (20 X magnification). Pilot trials with longer incubation times, up to 10 days (see below), did not yield significantly more bacterial colonies that would have affected plant genotype differences. Therefore, we performed enumeration of bacterial colony-forming units (CFU) 3 days after R2A plates were incubated at room temperature. CFUs were normalized to fresh tissue weight or leaf disk area. Total leaf bacterial communities were determined following the same protocol except without surface sterilization. A serial dilution was made in 100 μL volume (up to 10−5 for Col-0, mfec and cad1) and plated on R2A plates.
Pilot trials: Two leaves or eight leaf disks were ground in 1 mL sterile 10 mM MgCl2 buffer. After serial dilutions (see above), 100 μL of leaf homogenate were spread onto square petri dishes (100 mm × 100 mm) containing 30 mL R2A agar. Degrees of dilution were determined by empirical experiments to make sure that there were 20 to 200 CFUs per plate for accurate counting. As an example, when the following two incubation methods were used: (i) 3 days of incubation at room temperature and (ii) 10 days of incubation (2 days at room temperature, 6 days at 4℃ and 2 days at room temperature), bacterial CFUs (mean ± SEM, n = 4) were 105 ± 20 (2-day incubation) and 101 ± 23 (10 day incubation), respectively.
Gnotobiotic plant growth systems.
Three gnotobiotic plant growth systems were used in this study. Murashige-Skoog (MS) agar plate system: Col-0, mfec and cad1–5 seeds were surface-sterilized, cold-stratified, and germinated on 1/2 MS agar media plates. Seedlings were grown under 50 μE⋅m2⋅s with a photoperiod of 12 h light-12 h dark cycle. “FlowPot” gnotobiotic system: A peat-based gnotobiotic system described previously33. “GnotoPot”: A compressed peat pellet-based gnotobiotic system developed in this study as a simpler, alternative potting soil-based gnotobiotic system. Briefly, compressed peat pellets (Jiffy Products) were transferred to 2” polypropylene pots and hydrated to saturation with Linsmaier & Skoog (LS) medium buffered with 2-(N-morpholino) ethanesulfonic acid (MES) to pH 5.7 (Caisson Labs). GnotoPots were then placed in plant tissue culture microbox (SacO2, Belgium) that had a #40 green filter mounted in the lid. Assembled microboxes with lids loosely covered were placed inside an autoclave bag (Sun Bag, Sigma) and autoclaved twice for 45 min each, with 24 h storage at room temperature in between. After GnotoPots were cooled down, microboxes were sealed and stored until the time of usage. Surface-sterilized Arabidopsis seeds were stratified at 4°C for 24 h before sown into GnotoPots under germ-free conditions. GnotoPots were then placed in a tissue culture growth chamber set at 22°C, 12 h light-12 h dark cycle photoperiod and light intensity of 100 μE⋅m2⋅s. Sterility of FlowPots and GnotoPots was routinely monitored by plating samples of plants and peat substrate in R2A plates.
For induction of dysbiosis symptoms shown in Extended Data Fig. 2e, 5.5- to 6.5-week-old GnotoPots-grown plants were sprayed with sterile water, placed under a clear plastic dome to achieve high humidity (~95%) under 40 μE⋅m2⋅s light intensity and temperature at 23 °C for 10 days. For results shown in Fig. 3c, plants were grown in GnotoPots under a photoperiod of 16 h light-8 h dark (100 μE⋅m2⋅s and temperature at 22 °C) for 26 days and total leaf areas were measured with the Easy Leaf Area software34.
Synthetic communities of leaf endophytic bacteria (SynCom).
To generate SynComs, Col-0 and mfec plants were grown in “Arabidopsis Mix” potting soil to 5 weeks old and were sprayed with water and kept under high humidity (~95%) for 5 days. Representative leaves were harvested (8 leaves were picked from 4 plants of each genotype) and surface-sterilized in 75% ethanol for 1 min and rinsed in sterile water twice. Leaves were ground in sterile water, and bacterial suspensions were diluted (to 10−3 for Col-0 and 10−5 for mfec) and plated on R2A plates, which were kept at 22 °C for 4 days. About 50 colonies from each genotype were randomly picked, constituting SynComCol−0 and SynCommfec, respectively.
For addition of SynCom bacteria as internal control to Arabidopsis potting soil for 16S rRNA gene sequence profiles (Fig. 2, 4 and Extended Data Fig. 2). Individual bacteria strain was scraped from R2A plate and suspended in 10 mM MgCl2 buffer, bacterial suspensions were adjusted to the same OD600. Equal volume of each bacterial strain was pooled and diluted to a final OD600 of 0.01 (~ 0.5×10⁷ CFU/mL). 5 mL of prepared SynCom was added to each “Arabidopsis Mix” soil pot. To reduce background microbiota that is naturally present in Arabidopsis Mix soil, Arabidopsis mix soil and meshes were autoclaved twice prior to addition of SynCom bacteria; pots, flats and plastic domes used in growing plants were sprayed with 75% ethanol. Surface-sterilized Col-0, mfec, min7, fec or cad1–5 seeds were then added to the assembled soil pots. Plants were watered with autoclaved nutrient water 1–2 times each week.
For experiments with 1/2 MS agar plates (Fig. 3a, b), Sterile Col-0 seeds were germinated on 1/2 MS plates (without sucrose) in the presence of 2 μL 107 CFU/mL SynComCol−0 or SynCommfec for 14 days. The 2 μL SynCom was applied directly to each seed. For preparation of SynComCol−0 and SynCommfec for inoculation into FlowPots or GnotoPots (Fig. 3c, d and Extend Data Fig. 2, 7), SynComCol−0 and SynCommfec mixtures were prepared as above and the final OD600 was adjusted to 0.04 (~2×10⁷ CFU/mL). A single seed was sown to each pot and 1 mL of the SynCom suspension was added. For experiments to compare the effects of different SynComs on leaf health grown in Arabidopsis potting soil (Fig. 3e, f and Extended Data Fig. 3b, c), SynComCol−0 and SynCommfec mixtures were prepared as above, and the final OD600 was adjusted to 0.2 (~1×10⁸ CFU/ml; ~2×10⁶ CFU/ml for each strain) or 0.02 (~1×10⁷ CFU/ml; ~2×10⁵ CFU/ml for each strain) before infiltration into 4-week-old leaves.
16S rRNA gene sequence profiling.
Col-0, mfec, min7, fec or cad1–5 plants were grown on experimental Arabidopsis Mix soil with or without inoculated SynComCol−0 added as described above. Five-week-old healthy plants were sprayed with water and kept under high humidity (~95%) for several days until dysbiosis symptoms appeared. Middle-age leaves from Col-0 and mutants were collected. To analyze endophytic bacterial community, leaves were first surface-sterilized with 5% (v/v) bleach for 1 min, followed with rinse with sterile ddH2O twice. After blot-drying to remove surface water, two leaves from the same plant were collected in one tube as one biological replicate, which was then snap-frozen in liquid N2 and stored in −80 ℃. For analysis of total bacterial community, two leaves from one plant was collected in a tube as one sample, which was then snap-frozen in liquid N2 and stored in −80 ℃.
To prepare DNA for bacterial 16S rRNA gene-based community analysis, Total DNA from leaf samples was extracted using MoBio Power Soil DNA Isolation kit (Qiagen). PCR was performed using AccuPrime high-fidelity Taq DNA polymerase (Invitrogen) using barcoded primers 799F/1193R35. 799F: ACACTGACGACATGGTTCTACA-AACMGGATTAGATACCCKG and 1193R: TACGGTAGCAGAGACTTGGTCT-ACGTCATCCCCACCTTCC (The underlined sequences are the illumina CS (Common sequence) adapters). PCR was performed in triplicate in 25 μL reaction volume containing 0.15 μL AccuPrime high-fidelity Taq DNA polymerase, 1 μL DMSO, 2.5 μL Buffer II, 0.5 μL of each primer (10uM), 2 μL template DNA and 18.85 μL ddH2O. The PCR program included a hot start at 94 °C for 60 s, 35 cycles of denaturation at 94 °C for 20 s, primer annealing at 53 °C for 30 s and extension at 68 °C for 45 s, followed by a final extension at 68 °C for 2 min and a cool down to 8 °C. PCR products were separated on 1% agarose gel. The 450 bp band of amplified bacterial 16S rRNA gene was extracted using Zymoclean Gel DNA Recovery Kit (Zymo Research) according to the manufacturer’s instructions. DNA concentration was measured with PicoGreen dsDNA assay kit (Life Technologies) and adjusted to 1 to 10 ng/μL for all samples. Samples were submitted to Research Technology Service Facility (RTSF) at Michigan State University (MSU) for library preparation and 16S rRNA gene sequencing (see below).
RTSF Genomics Core at MSU completed library preparation by PCR with dual indexed Illumina compatible adapters targeting the Fluidigm barcoding oligos. Final PCR products were bulk normalized using Invitrogen SequalPrep DNA Normalization plates and recovered libraries were pooled. The library pool was cleaned up using AmpureXP magnetic beads and then quantified using a combination of Qubit dsDNA HS (Invitrogen). Agilent 4200 TapeStation DNA 1000 and Kapa Illumina Library Quantification qPCR assays. The library pool was loaded onto an Illumina MiSeq Standard v2 flow cell and sequencing was performed in a 2×250bp paired end format using a MiSeq v2 500 cycle reagent cartridge. Common sequencing and index primers complementary to the Fluidigm CS1/CS2 oligomers were added to appropriate wells of the reagent cartridge. Base calling was done by Illumina Real Time Analysis (RTA) v1.18.54 and output of RTA was demultiplexed and converted to FastQ format with Illumina Bcl2fastq v2.19.1.
Raw Illumina fastq files were quality-filtered and taxonomically analyzed using QIIME 2 Core 2018.11 distribution40. Briefly, primers of imported sequences were removed via the Cutadapt36. DADA237 was used to filter and denoise sequences, remove chimeras, identify representative sequences of OTUs (operational taxonomic unit) and create an OTU table. Representative sequences of OTUs were taxonomically annotated using a pre-trained Naive Bayes classifier38 based on the bacterial 16S rRNA Greengenes reference database (13_8 release). From this taxonomic annotation, all unassigned sequences and sequences annotated as mitochondria and chloroplast were removed. The filtered sequences were clustered at 97% similarity and the resulting OTU table was then used to determine taxonomic distributions and alpha (observed OTUs and Shannon’s species diversity index). For alpha diversity calculations, samples were rarefied to the same number of reads.
The total bacterial community in Col-0 leaves at phylum level are dominated by Proteobacteria (92.2 % relative abundance), Actinobacteria (5 %), Firmicutes (1.1 %) and Bacteroidetes (0.7%) in this study, which are similar (Pearson’s cor = 0.96, P value = 0.037) to the Arabidopsis leaf natural communities found by Bai and colleagues35. At the order level, we found that 9 of the top 10 orders (Burkholderiales, Actinomycetales, Methylophilales, Sphingomonadales, Rhizobiales, Pseudomonadales, Enterobacteriales, Flavobacteriales and Caulobacterales) in our total Col-0 leaf bacterial community are also identified as the top 10 orders of Arabidopsis leaf natural communities found by Bai and colleagues35.
Bacterial genome assembly and taxonomic classification.
To isolate high molecular weight genomic DNA of bacterial isolates in SynComCol−0 and SynCommfec, we used a modified E. Z. N. A. Bacterial DNA Kit Protocol (OMEGA Bio-Tek, UAS). Quality of genomic DNA was analyzed by agarose gel (1% (w/v)) and quantified by Qubit. Approximately 1 μg of genomic DNA was used for Oxford Nanopore bacterial sequencing and 30 μg of genomic DNA for Illumina sequencing.
Using software Canu version 1.7 with default parameters39, raw nanopore reads were corrected, trimmed and then assembled into long contigs. A majority of the assembled genomes of SynComCol−0 and SynCommfec are complete or near complete, with genome size ranging from 3.54 to 9.42 Mb (Supplementary Information Table 3). To further improve the quality of the assembled genomes, we re-sequenced full genomes for 27 relevant strains using Illumina sequencing platform. After removing adaptor sequences, trimming and removing low-quality reads using software Sickle40 version 1.33, more than 24 Gb high quality short reads were generated (Supplementary Information Table 3). We applied high quality short reads from Illumina sequencing platform to correct the assembled genomes using program Pilon41 version 1.22. To generate accurate taxonomic information for the sequenced genomes, the average nucleotide identity of whole genome with references and phylogenetic relationship with references based on 120 marker genes were inferred using program gtdbtk42 version 0.1.3. We also used Ribosomal Database Project (RDP) tools to infer the taxonomy of sequenced isolates based on full-length 16S rRNA genes using software Mothur43 version v.1.34.2. The Maximum-Likelihood phylogenetic tree for sequenced isolates were constructed based on the full-length 16S rRNA gene using MEGA744. A total of 100 bootstrap replicates were made.
Binary interaction.
Bacterial strains were individually cultured on R2A plates at 28°C for 1–2 days. One full inoculation loop of bacteria was suspended in 3 mL media R2A (OD600 of 2.1 to 4.0). For making a bacterial lawn, 2.6 mL of a “target” bacterial suspension was added to 40 mL of molten R2A agar pre-cooled to 42°C, gently mixed and then poured into two square petri dishes (100 × 100 mm). Two μL of each “attacker” strain was spotted onto the plate and incubated at room temperature for 3 days at which photographs were taken to observe inhibition zones. Two technical repeats were performed for each strain, strain had two technical repeats, and experiment was conducted three times. In total, 2,116 binary interactions were examined.
Characterization of the ben3 (cad1) mutant.
The ben3 (cad1) mutant was backcrossed to wild type Col-0 to generate a mapping-by-sequencing population. Of 24 F1 plants grown in soil, all showed wild type Col-0 phenotype (i.e., no spontaneous dysbiosis symptoms), indicating mutant phenotype is a recessive trait. F1 plants were allowed to self and produce a segregating F2 population. Of 376 F2 plants, 88 showed mutant phenotype (i.e., spontaneous dysbiosis symptoms), whereas the rest (288 plants) were wild-type-like. The observed ~1:3 (mutant:wild type) phenotype segregation ratio suggests the mutant phenotype is caused by a single mutation on a nuclear gene. To identify the causative mutation, genomic DNA was extracted from 50 F2 plants exhibiting mutant phenotype and 50 F2 plants exhibiting wild-type phenotype and pooled into mutant-like and wild type-like pools. Pooled DNA samples were submitted to MSU RTSF Genomic Core facility for library preparation (Illumina TruSeq Nano DNA Library Preparation Kit) and sequenced on Illumina HiSeq 4000 platform in a 2×150bp paired end sequencing format. 70.3 and 94.3 million reads were obtained for mutant-like and wild type-like pools, respectively. Whole genome re-sequencing data were analyzed following methods developed by Austin and colleagues45, with minor package and version changes. Briefly, adaptor sequences and poor quality reads were trimmed off using Trimmomatic (v0.33). Reads were aligned to Arabidopsis TAIR10 genome using bowtie2 (v2.3.1). Alignments were coordinate-sorted using SAMtools (v1.5); PCR duplicate reads were removed using picardTools (v1.89). Variances were called using bcftools (v1.2). Candidate causative mutations were analyzed using SHOREmap v3.046 with algorithms developed for recessive mutation within a backcrossing population.
Production of 35S::CAD1 transgenic Arabidopsis.
The CAD1 coding sequence was amplified by PCR using the following primers. Sense primer: CACCATGGAGAATCGTAAAGGAGGAAACT (start codon underlined); antisense primer: TCAATAATTTAGCAACGAATACTTC (stop codon underlined). The amplified CAD1 fragment was cloned into pENTR/D cloning vector (Invitrogen), and transferred by LR recombination into the binary expression vector pB7–35S::HIS-FLAG-GW47 to generate a 35S::HIS-FLAG-CAD1 (named 35S::CAD1 for short). The binary vectors containing 35S::CAD1 gene was introduced into Agrobacterium tumefaciens C58C1 by electroporation. Arabidopsis plants were transformed using the floral dip method48. Glufosinate ammonium (Basta) was used to select for transgenic T1 plants, which were further screened by western blot using a CAD1-specific antibody. Homozygous T3 plants expressing fusion proteins were used for analyses. CAD1-specific antibody was prepared against the C-terminal 240 amino acids. The NdeI and XhoI fragment of CAD1322–561 was cloned into pET28a vector (Novagen) to overexpress a 6×His::CAD1 fusion protein. Sense primer: CATATGTGGGCTCCCGAACAGAGTAACCTCC (NdeI site underlined, start codon double underlined); antisense primer: CTCGAGTCAATAATTTAGCAACGAATACTTC (XhoI site underlined, stop codon double underlined). Purified 6×His::CAD1 protein was injected to Guinea Pig to raise CAD1 specific antibody (Cocalico Biologicals, Inc).
Data analysis, statistics and experimental repeats.
Plants of different genotypes (Col-0, mfec, and cad1) were grown side by side to minimize unexpected environmental variations during growth and experimentation. Leaf samples of similar ages were collected and assessed randomly for each genotype. Researchers were not blinded to allocation during experiments and outcome assessment. This is in part because different plant genotypes under study (Col-0, mfec, and cad1) exhibit very distinct phenotypes visually; blinding was not possible. Routine practices included more than one author observing/assessing phenotypes, whenever possible. The specific statistical method used, the sample size, the number of experimental repeats and the results of statistical analyses are described in the relevant figure legends. Sample size was determined based on experimental trials and with consideration of previous publications on similar experiments to allow for confident statistical analyses. Two-tailed Mann Whitney test or one-way or two-way ANOVA with Tukey’s test was used for multiple comparisons within a data set, with significance set to a P value < 0.05. ANOVA analysis was performed with GraphPad Prism software. Statistical significance of alpha-diversity between plant genotypes were determined via Mann Whitney test. The Benjamini–Hochberg method (false discovery rate; FDR)49 was applied to correct the P values after performing multiple comparisons. Differential amplicon sequence variants (ASVs; amplicon sequence variants representing unique bacterial 16S rRNA sequences) of endophytic phyllosphere microbiota between Col-0 and mfec mutants grown in potting soil supplemented with SynCom strains were identified with a negative binomial generalized linear model (GLM) in the edgeR package50. The Benjamini–Hochberg method FDR was applied to correct the P values after performing multiple comparisons. ASVs with FDR below or equal to 0.05 were considered differentially colonized (i.e. enriched/depleted in mfec compared to Col-0).
Data accessibility.
Raw source 16S rRNA gene sequences from this project are available in the SRA (Sequence Read Archive) database under the BioProject PRJNA554246, accession no. SAMN12259846- SAMN12260169. Bacterial genome source data are available in the SRA database under the BioProject PRJNA555902. Source data for Fig. 4d and 4e are provided in Source Data Supplementary Fig. 1, respectively. Source data for Fig. 8e is provided in Source Data Supplementary Fig. 2. All other source data are provided in Source Data: Supplementary Table 1.
Code Availability.
Scripts used in the microbiota analyses are available at https://github.com/godlovexiaolin/A-genetic-network-for-host-control-of-phyllosphere-microbiota-for-plant-health. Other software used in this study are published and cited accordingly.
Extended Data
Extended Data Fig. 1. Leaf and root appearance of soil-grown Col-0 and mfec plants.

a, Leaf appearance of Col-0 and mfec plants grown in Arabidopsis Mix soil (Soil A) and “MSU community” agricultural soil (Soil B; equal parts of MSU Community soil, medium vermiculate and perlite) or Organic Seed Starter Premium Potting Mix, Espoma (Soil C) for 6.5 weeks. Pictures were taken 5 days (Soil A) or 11 days (Soil B and Soil C) after plants were shifted to high humidity (~95%). Representative leaf images are shown. b, Root appearance of Col-0 and mfec plants grown in Arabidopsis Mix soil for five weeks and shifted to high humidity (~95%) for 5 days. Representative root images are shown. Experiments (a and b) were repeated three times with similar results.
Extended Data Fig. 2. Observed OTUs of total and endophytic leaf bacteria in different plant genotypes and requirement of microbiota for appearance of dysbiosis symptoms in mfec leaves.

Observed OTUs of total (a) and endophytic leaf bacteria (b) in Col-0 and mfec plants, which were grown in Arabidopsis Mix soil and shift to high humidity for 5 days. c, Observed OTUs of endophytic leaf microbiota in Col-0, fec, min7 and mfec plants supplemented with SynComCol-0. The horizontal bars within boxes represent medians. The tops and bottoms of boxes represent the 75th and 25th percentiles, respectively. The upper and lower whiskers extend to data no more than 1.5× the interquartile range from the upper edge and lower edge of the box, respectively. Statistical significance was determined by two-tailed Mann Whitney test. Biological replicate numbers passing quality control are: Col-0 (n = 15) and mfec (n = 15) for analysis of total leaf bacterial microbiota across 3 independent experiments; Col-0 (n = 18) and mfec (n = 20) for analysis of leaf endophytic bacterial microbiota across 4 independent experiments. Col-0 (n = 20), fec (n = 19), min7 (n = 19) and mfec (n = 19) for analysis of leaf endophytic bacterial microbiota with SynComCol−0 across 4 independent experiments. d, Leaf appearance of Col-0 and mfec plants grown in sterile MS agar plates. Pictures were taken 5 days after shifting plates to high humidity (~95%). e, Leaf appearance of Col-0 and mfec plants grown in GnotoPots in the absence (axenic) or presence of SynComCol−0 for 6.5 weeks. Plants were then shifted to high humidity (~95%) for 10 days, before pictures were taken. Rosette leaf images are representative of at least four replicated experiments.
Extended Data Fig. 3. A Maximum-likelihood phylogenetic tree for genome-sequenced bacterial isolates in SynComCol−0 and SynCommfec.

a, Tree was constructed based on the full-length 16S rRNA gene using MEGA7. A total of 100 bootstrap replicates were made, and bootstrap values were indicated at the branch points. Colors represent bacterial isolates from different plant genotypes: mfec mutant (purple); Col-0 (green). Forty-eight strains were derived from healthy Col-0 endophytic leaves and 52 strains were derived from mfec endophytic leaves displaying dysbiosis symptoms. b, Col-0 leaves were syringe-infiltrated with SynComCol−0 and SynCommfec at 1×10⁷ CFU/ml, infiltrated plants were kept under ambient humidity for 1 h for water to evaporate. Then bacterial populations were determined after plant leaves returned to pre-infiltration appearance. Colony-forming units were normalized to tissue fresh weight and leaf disk areas. Statistical significance was determined by two-tailed Mann Whitney test. n = 6 biological replicates, data are shown as mean ± s.e.m. Experiments were repeated three times with similar results. c, Col-0 plants were syringe-infiltrated with SynComCol−0, SynCommfec or SynComCol−0−38 (with 10 Firmicutes removed from SynComCol−0) at 1×10⁷ CFU/ml. Inoculated plants were kept under high humidity (~ 95%), and leaf images were taken 7 days after infiltration. Experiments were repeated three times with similar results. Images are representative of leaves from four plants.
Extended Data Fig. 4. Multiplication and dysbiosis symptom phenotypes of bacterial strains in Col-0 leaves.

a, Population levels of bacterial strains in Col-0 leaves day 0 (1 h after leaf infiltration) and day 5 after leaf infiltration with each strain at 1×10⁶ CFU/ml. DC3000, Pseudomonas syringae pv. tomato DC3000, pathogenic on Col-0 plants; hrcC−, a nonpathogenic mutant of DC3000 defective in type III secretion; Col-0–33, mfec-20 and mfec-1, control strains that do not induce dysbiosis symptoms (Supplementary information Table 1); others mfec strains, induce dysbiosis symptoms (Supplement information Table 1). Humidity: ~ 95%. Statistical analysis was performed by two-way ANOVA with Tukey’s test. n = 3 biological replicates, data are shown as mean ± s.e.m. Experiments were repeated twice with similar results. b, Leaf dysbiosis symptoms 7 days after infiltration of leaves of 4.5-week-old Col-0 plants with indicated mfec strains or SynCommix 5 at 1×10⁷ CFU/ml. SynCommix 5 is a mix of mfec-10, mfec-23, mfec-41, mfec-48 or mfec-51 with equal OD600 values. Humidity: ~ 95%. Experiments were repeated three times with similar results.
Extended Data Fig. 5. Binary inter-bacterial inhibition.

a, Examples of inhibitory halos are labelled with strong, weak or no inhibition. b, Binary inhibition assays (2,116 combinations) on R2A plate of 46 strains that represent all bacterial species identified in SynComCol−0 and SynCommfec. Horizontal direction displays “target” bacterial strains, whereas vertical direction displays “attacker” bacterial strains. A large or clear halo, indicative of strong binary inhibition, is shown in red color, whereas a small or less transparent halo, indicative of weaker binary inhibition, is shown in pink, and no halo is shown in white. The strains labelled with a star symbol were used for in planta binary inhibition assay in Extended Data Fig. 6. Experiments were repeated three times with similar results.
Extended Data Fig. 6. In planta binary inhibition.
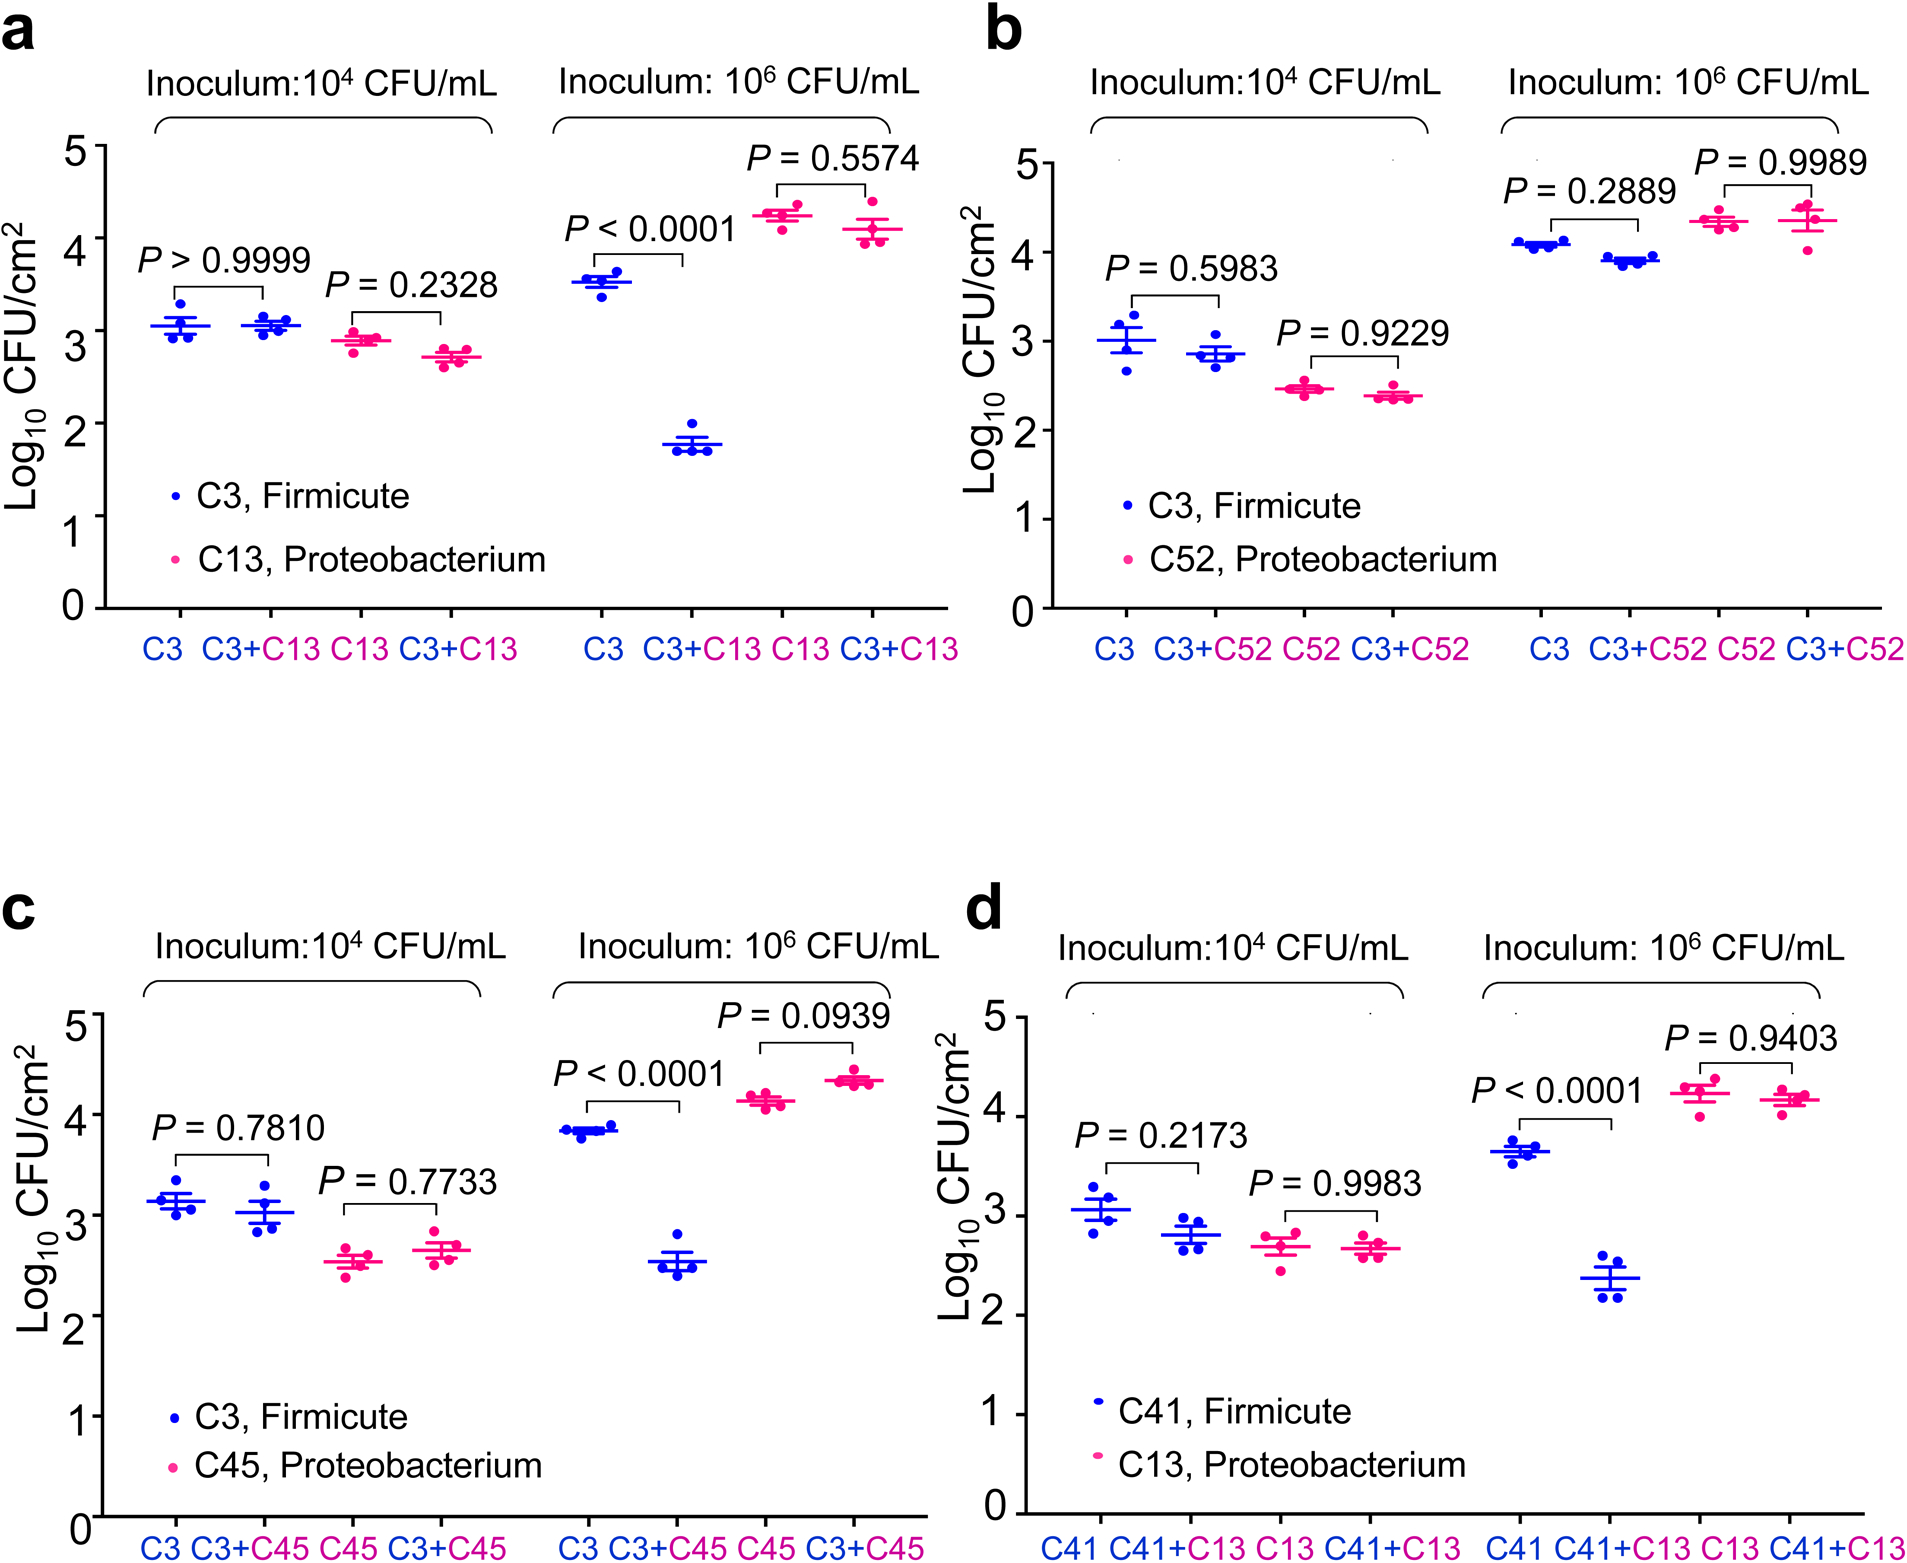
In planta inhibition of Firmicutes by those Proteobacteria strains that displayed a strong inhibitory effect in R2A agar plate assay. a, Leaves of Col-0 plants were syringe-infiltrated with Paenibacillus chondroitinus (C3; a Firmicute) alone, Comamonas testosreroni (C13, a Proteobacterium) alone or C3 and C13 together at 1 × 10⁴ CFU/mL, corresponding to approximately 1 × 10² CFU/cm2 leaf area, or 1 × 10⁶ CFU/mL, corresponding to approximately 1×10⁴ CFU/cm2 leaf area. After infiltration plants were kept under high humidity (~95%) for 5 days before bacterial populations were determined. A non-inhibitory binary interaction between strains C3 and Variovorax sp. C52 (a Proteobacterium) is shown as control (b). c, Leaves of Col-0 plants were syringe-infiltrated with Paenibacillus chondroitinus (C3; a Firmicute) alone, Stenotrophomonas maltophilia (C45, a Proteobacterium) alone or C3 and C45 together at 1 × 10⁴ CFU/mL or 1 × 10⁶ CFU/mL. d, Leaves of Col-0 plants were syringe-infiltrated with Paenibacillus chondroitinus (C41; a Firmicute) alone, Comamonas testosreroni (C13, a Proteobacterium) alone or C41 and C13 together at 1 × 10⁴ CFU/mL or 1 × 10⁶ CFU/mL. After infiltration plants were kept under high humidity (~95%) for 5 days before bacterial populations were determined. One-way ANOVA with Tukey’s test was performed. n = 4 biological replicates, data are shown as mean ± s.e.m. Experiments were repeated three times with similar results.
Extended Data Fig. 7. Appearance and bacterial populations in Col-0 and cad1 plants before and after shifted to high humidity (~95%).

a, Leaf appearance of 5-week-old Col-0 and cad1 plants grown in the absence (axenic) or presence of SynComCol−0 in the FlowPot gnotobiotic system (see Methods). Pictures were taken before (day 0) and 5 days after plants were shifted to high humidity (~95%). b, Levels of endophytic bacterial community in presence of SynComCol−0 in the FlowPot gnotobiotic system. Statistical analysis was performed by one-way ANOVA with Tukey’s test. n = 6 biological replicates, data are shown as mean ± s.e.m. Experiments were repeated three times with similar results. c, Leaf appearance of Col-0 and cad1 plants grown in enclosed sterile LS agar plates for 4 weeks. d, Leaf appearance of 5-week-old Col-0, deps and cad1 plants grown in Arabidopsis Mix soil 5 days after exposing plants to ~95% relative humidity. e, Levels of endophytic leaf microbiota in 5-week-old Col-0, deps and cad1 plants 5 days after plants were exposed to high humidity (~95%). Statistical analysis was performed by one-way ANOVA with Tukey’s test. n = 4 biological replicates, data are shown as mean ± s.e.m. Experiments were repeated three times with similar results.
Extended Data Fig. 8. Identification of a cad1 mutation responsible for dysbiosis in the cad1 mutant.

a, Leaf appearance of 4.5-week-old Col-0, cad1 and big2 plants grown in redi-earth potting soil. Pictures were taken at day 5 after plants were shifted to high humidity (~95%). b, Bacterial populations of the endophytic bacterial community and statistical analysis was performed by one-way ANOVA with Tukey’s test. n = 6 biological replicates; data are shown as mean ± s.e.m. Experiments were repeated three times with similar results. Two independent T-DNA insertion lines of BIG2 were analyzed with similar results (big2–1, SALK_033446; big2–2, SALK_016558). c-e, Appearance of (c) and endophytic bacterial populations in (d) Col-0, cad1 and cad1/35S::CAD1 plants at day 5 after humidity shift. Plants were grown in redi-earth potting soil for 4.5 weeks before humidity shift. Populations of endophytic bacterial community and statistical analysis was performed by one-way ANOVA with Tukey’s test. n = 6 biological replicates, data are shown as mean ± s.e.m. Experiments were repeated three times with similar results. Two independent different complementation lines (cad1/35S::CAD1 Line1 and cad1/35S::CAD1 Line2) were analyzed with similar results and protein levels were confirmed by western blot with the CAD1 antibody (e). Uncropped gel image is shown in Supplementary Fig. 2. f, cad1 genomic mapping. Green and brown dots indicate wild type-like and cad1-like allele frequencies, respectively (see detail information in Supplementary Information Table 6). g, Schematic illustrations of mutations in big2 and cad1 mutants. h and i, q-PCR analyses of CAD1 transcript in Col-0 plants (h) and min7 plants (i) grown in Arabidopsis Mix soil. Five-week-old Col-0 and min7 leaves were infiltrated with 1 μM flg22 and harvested at time points indicated. Transcript levels were normalized to that of the PP2AA3 gene. Statistical analysis was performed by one-way ANOVA with Tukey’s test. n = 3 biological replicates, data are shown as mean ± s.e.m. Experiments were repeated three times with similar results.
Extended Data Fig. 9. A model for plant control of endophytic phyllosphere microbiota.

a, 16S rRNA gene sequence profiles of endophytic leaf bacteria in Col-0 and cad1 plants supplemented with SynComCol-0. Data presentation and statistical analysis as in Fig. 1c. Biological replicate numbers are: Col-0 (n = 20) and cad1 (n = 20). b, A simplified diagram depicting pattern-triggered immune signaling, MIN7 and CAD1 as three components of a putative genetic framework for controlling endophytic bacterial microbiota, which live outside a plant cell. MIN7 has previously been shown to be involved in regulating callose deposition51,52 and aqueous microenvironment in the leaf apoplast (i.e., extracellular space)1. c, A diagram depicting great shifts in the level and composition of endophytic leaf microbiota in wild-type Col-0 vs. mfec leaves (or cad1 leaves; not shown) in part via microbial infighting between Proteobacteria and Firmicutes.
Extended Data Fig. 10. Phylogenetic trees of protein sequences of MIN7 and CAD1 homologues from different plant species.

Protein sequences of Arabidopsis thaliana AtMIN7/AtBIG5 (AT3G43300.1) (a) and AtCAD1/AtNSL2 (AT1G29690.1) (b) were used for blast against the proteome of Arabidopsis and other seven plant species (https://phytozome.jgi.doe.gov/). Homologues with E-value lower than E100 were selected to generate phylogenetic trees across taxa, and only homologues specific to AtMIN7 or AtCAD1 clade were presented with selected proteins from Arabidopsis as outgroups. Bootstrap values were obtained from 1000 replicates using the maximum likelihood algorithm, via MEGA7 (https://www.megasoftware.net/). The scale bar represents 0.2 substitutions per amino acid site. List of genes were indicated in Supplementary Information Table 7. AtMIN7 and AtCAD1 were highlighted by red stars. Abbreviations: BREFELDIN A-INHIBITED GUANINE NUCLEOTIDE-EXCHANGE PROTEIN (BIG), NECROTIC SPOTTED LESIONS (NSL), Arabidopsis thaliana (At), Marchantia polymorpha (Mp), Oryza sativa (Os), Physcomitrella patens (Pp), Populus rtichocarpa (Pt), Selaginella meollendorffii (Sm), Solanum lycopersicum (Sl), Zostera marina (Zm).
Supplementary Material
Acknowledgements
We thank He lab members for insightful discussions and constructive suggestions. We thank Tianyu Gong for help with testing leaf necrosis phenotypes of plants grown on MS agar plates, and Dr. Hirokazu Tanaka and Jiri Friml for ben3/cad1 seeds. This project was supported by funding from National Institutes of Health (GM109928), the Department of Energy (the Chemical Sciences, Geosciences, and Biosciences Division, Office of Basic Energy Sciences, Office of Science; DE-FG02-91ER20021 for ben3/cad1 mutant characterization) and Plant Resilient Institute at Michigan State University for support of optimization of the GnotoPot system (to S.Y.H.) and from the CAS Center for Excellence in Molecular Plant Sciences and the Institute of Plant Physiology and Ecology, Chinese Academy of Sciences (to X-F. X).
Footnotes
Supplementary Information is linked to the online version of the paper at www.nature.com/nature.
The authors declare no competing financial interests.
Readers are welcome to comment on the online version of the paper.
References
- 1.Xin XF et al. Bacteria establish an aqueous living space in plants crucial for virulence. Nature 539, 524–529, doi: 10.1038/nature20166 (2016). [DOI] [PMC free article] [PubMed] [Google Scholar]
- 2.Beattie GA & Lindow SE Bacterial colonization of leaves: a spectrum of strategies. Phytopathology 89, 353–359, doi: 10.1094/PHYTO.1999.89.5.353 (1999). [DOI] [PubMed] [Google Scholar]
- 3.Lindow SE & Brandl MT Microbiology of the phyllosphere. Applied and environmental microbiology 69, 1875–1883, doi: 10.1128/aem.69.4.1875-1883.2003 (2003). [DOI] [PMC free article] [PubMed] [Google Scholar]
- 4.Berendsen RL, Pieterse CM & Bakker PA The rhizosphere microbiome and plant health. Trends in plant science 17, 478–486, doi: 10.1016/j.tplants.2012.04.001 (2012). [DOI] [PubMed] [Google Scholar]
- 5.Xu L et al. Drought delays development of the sorghum root microbiome and enriches for monoderm bacteria. Proceedings of the National Academy of Sciences of the United States of America 115, E4284–E4293, doi: 10.1073/pnas.1717308115 (2018). [DOI] [PMC free article] [PubMed] [Google Scholar]
- 6.Edwards JA et al. Compositional shifts in root-associated bacterial and archaeal microbiota track the plant life cycle in field-grown rice. PLoS biology 16, e2003862, doi: 10.1371/journal.pbio.2003862 (2018). [DOI] [PMC free article] [PubMed] [Google Scholar]
- 7.Finkel OM, Castrillo G, Herrera Paredes S, Salas Gonzalez I & Dangl JL Understanding and exploiting plant beneficial microbes. Current opinion in plant biology 38, 155–163, doi: 10.1016/j.pbi.2017.04.018 (2017). [DOI] [PMC free article] [PubMed] [Google Scholar]
- 8.Pieterse CMJ, de Jonge R & Berendsen RL The Soil-Borne Supremacy. Trends in plant science 21, 171–173, doi: 10.1016/j.tplants.2016.01.018 (2016). [DOI] [PubMed] [Google Scholar]
- 9.Duran P et al. Microbial Interkingdom Interactions in Roots Promote Arabidopsis Survival. Cell 175, 973–983 e914, doi: 10.1016/j.cell.2018.10.020 (2018). [DOI] [PMC free article] [PubMed] [Google Scholar]
- 10.Muller DB, Vogel C, Bai Y & Vorholt JA The Plant Microbiota: Systems-Level Insights and Perspectives. Annual review of genetics 50, 211–234, doi: 10.1146/annurev-genet-120215-034952 (2016). [DOI] [PubMed] [Google Scholar]
- 11.Zhang J et al. NRT1.1B is associated with root microbiota composition and nitrogen use in field-grown rice. Nature biotechnology 37, 676–684, doi: 10.1038/s41587-019-0104-4 (2019). [DOI] [PubMed] [Google Scholar]
- 12.Horton MW et al. Genome-wide association study of Arabidopsis thaliana leaf microbial community. Nature communications 5, 5320, doi: 10.1038/ncomms6320 (2014). [DOI] [PMC free article] [PubMed] [Google Scholar]
- 13.Bodenhausen N, Bortfeld-Miller M, Ackermann M & Vorholt JA A synthetic community approach reveals plant genotypes affecting the phyllosphere microbiota. PLoS genetics 10, e1004283, doi: 10.1371/journal.pgen.1004283 (2014). [DOI] [PMC free article] [PubMed] [Google Scholar]
- 14.Wagner MR et al. Host genotype and age shape the leaf and root microbiomes of a wild perennial plant. Nature communications 7, 12151, doi: 10.1038/ncomms12151 (2016). [DOI] [PMC free article] [PubMed] [Google Scholar]
- 15.Laforest-Lapointe I, Paquette A, Messier C & Kembel SW Leaf bacterial diversity mediates plant diversity and ecosystem function relationships. Nature 546, 145–147, doi: 10.1038/nature22399 (2017). [DOI] [PubMed] [Google Scholar]
- 16.Tang D, Wang G & Zhou JM Receptor Kinases in Plant-Pathogen Interactions: More Than Pattern Recognition. The Plant cell 29, 618–637, doi: 10.1105/tpc.16.00891 (2017). [DOI] [PMC free article] [PubMed] [Google Scholar]
- 17.Boutrot F & Zipfel C Function, Discovery, and Exploitation of Plant Pattern Recognition Receptors for Broad-Spectrum Disease Resistance. Annual review of phytopathology 55, 257–286, doi: 10.1146/annurev-phyto-080614-120106 (2017). [DOI] [PubMed] [Google Scholar]
- 18.Turpin W, Goethel A, Bedrani L & Croitoru Mdcm K Determinants of IBD Heritability: Genes, Bugs, and More. Inflammatory bowel diseases 24, 1133–1148, doi: 10.1093/ibd/izy085 (2018). [DOI] [PMC free article] [PubMed] [Google Scholar]
- 19.Sokol H & Seksik P The intestinal microbiota in inflammatory bowel diseases: time to connect with the host. Current opinion in gastroenterology 26, 327–331, doi: 10.1097/MOG.0b013e328339536b (2010). [DOI] [PubMed] [Google Scholar]
- 20.Tanaka H, Kitakura S, De Rycke R, De Groodt R & Friml J Fluorescence imaging-based screen identifies ARF GEF component of early endosomal trafficking. Current biology : CB 19, 391–397, doi: 10.1016/j.cub.2009.01.057 (2009). [DOI] [PubMed] [Google Scholar]
- 21.Kitakura S et al. BEN3/BIG2 ARF GEF is Involved in Brefeldin A-Sensitive Trafficking at the trans-Golgi Network/Early Endosome in Arabidopsis thaliana. Plant & cell physiology 58, 1801–1811, doi: 10.1093/pcp/pcx118 (2017). [DOI] [PubMed] [Google Scholar]
- 22.Morita-Yamamuro C et al. The Arabidopsis gene CAD1 controls programmed cell death in the plant immune system and encodes a protein containing a MACPF domain. Plant & cell physiology 46, 902–912, doi: 10.1093/pcp/pci095 (2005). [DOI] [PubMed] [Google Scholar]
- 23.de Michele R et al. Free-Flow Electrophoresis of Plasma Membrane Vesicles Enriched by Two-Phase Partitioning Enhances the Quality of the Proteome from Arabidopsis Seedlings. Journal of proteome research 15, 900–913, doi: 10.1021/acs.jproteome.5b00876 (2016). [DOI] [PubMed] [Google Scholar]
- 24.Alexandersson E, Saalbach G, Larsson C & Kjellbom P Arabidopsis plasma membrane proteomics identifies components of transport, signal transduction and membrane trafficking. Plant & cell physiology 45, 1543–1556, doi: 10.1093/pcp/pch209 (2004). [DOI] [PubMed] [Google Scholar]
- 25.Felix G, Duran JD, Volko S & Boller T Plants have a sensitive perception system for the most conserved domain of bacterial flagellin. The Plant journal : for cell and molecular biology 18, 265–276 (1999). [DOI] [PubMed] [Google Scholar]
- 26.Zipfel C et al. Bacterial disease resistance in Arabidopsis through flagellin perception. Nature 428, 764–767, doi: 10.1038/nature02485 (2004). [DOI] [PubMed] [Google Scholar]
- 27.Levy M, Kolodziejczyk AA, Thaiss CA & Elinav E Dysbiosis and the immune system. Nature reviews. Immunology 17, 219–232, doi: 10.1038/nri.2017.7 (2017). [DOI] [PubMed] [Google Scholar]
- 28.Hall AB, Tolonen AC & Xavier RJ Human genetic variation and the gut microbiome in disease. Nature reviews. Genetics 18, 690–699, doi: 10.1038/nrg.2017.63 (2017). [DOI] [PubMed] [Google Scholar]
- 29.Sun L, Nava GM & Stappenbeck TS Host genetic susceptibility, dysbiosis, and viral triggers in inflammatory bowel disease. Current opinion in gastroenterology 27, 321–327, doi: 10.1097/MOG.0b013e32834661b4 (2011). [DOI] [PMC free article] [PubMed] [Google Scholar]
- 30.McCormack R, de Armas L, Shiratsuchi M & Podack ER Killing machines: three pore-forming proteins of the immune system. Immunologic research 57, 268–278, doi: 10.1007/s12026-013-8469-9 (2013). [DOI] [PMC free article] [PubMed] [Google Scholar]
- 31.Spicer BA, Conroy PJ, Law RHP, Voskoboinik I & Whisstock JC Perforin-A key (shaped) weapon in the immunological arsenal. Seminars in cell & developmental biology 72, 117–123, doi: 10.1016/j.semcdb.2017.07.033 (2017). [DOI] [PubMed] [Google Scholar]
- 32.Tsuda K, Sato M, Stoddard T, Glazebrook J & Katagiri F Network properties of robust immunity in plants. PLoS genetics 5, e1000772, doi: 10.1371/journal.pgen.1000772 (2009). [DOI] [PMC free article] [PubMed] [Google Scholar]
- 33.Kremer JMP, B. C; Rhodes D; Thireault; Froehlich JE; Schulze-Lefert P; Tiedje JM; He SY FlowPot axenic plant growth system for microbiota research. bioRxiv (2018). [Google Scholar]
- 34.Easlon HM & Bloom AJ Easy Leaf Area: Automated digital image analysis for rapid and accurate measurement of leaf area. Applications in plant sciences 2, doi: 10.3732/apps.1400033 (2014). [DOI] [PMC free article] [PubMed] [Google Scholar]
- 35.Bai Y et al. Functional overlap of the Arabidopsis leaf and root microbiota. Nature 528, 364–369, doi: 10.1038/nature16192 (2015). [DOI] [PubMed] [Google Scholar]
- 36.Martin M Cutadapt removes adapter sequences from high-throughput sequencing reads. 2011 17, 3, doi: 10.14806/ej.17.1.200. (2011) EMBnet Journal, 10–12 (2011). [DOI] [Google Scholar]
- 37.Callahan BJ et al. DADA2: High-resolution sample inference from Illumina amplicon data. Nature methods 13, 581–583, doi: 10.1038/nmeth.3869 (2016). [DOI] [PMC free article] [PubMed] [Google Scholar]
- 38.Werner JJ et al. Impact of training sets on classification of high-throughput bacterial 16s rRNA gene surveys. The ISME journal 6, 94–103, doi: 10.1038/ismej.2011.82 (2012). [DOI] [PMC free article] [PubMed] [Google Scholar]
- 39.Koren S et al. Canu: scalable and accurate long-read assembly via adaptive k-mer weighting and repeat separation. Genome research 27, 722–736, doi: 10.1101/gr.215087.116 (2017). [DOI] [PMC free article] [PubMed] [Google Scholar]
- 40.Joshi NAF, Sickle JN: A sliding-window, adaptive, quality-based trimming tool for FastQ files (Version 1.33) [Software]. Available at https://github.com/najoshi/sickle (2011).
- 41.Walker BJ et al. Pilon: an integrated tool for comprehensive microbial variant detection and genome assembly improvement. PloS one 9, e112963, doi: 10.1371/journal.pone.0112963 (2014). [DOI] [PMC free article] [PubMed] [Google Scholar]
- 42.Parks DH et al. A standardized bacterial taxonomy based on genome phylogeny substantially revises the tree of life. Nature biotechnology 36, 996–1004, doi: 10.1038/nbt.4229 (2018). [DOI] [PubMed] [Google Scholar]
- 43.Schloss PD et al. Introducing mothur: open-source, platform-independent, community-supported software for describing and comparing microbial communities. Applied and environmental microbiology 75, 7537–7541, doi: 10.1128/AEM.01541-09 (2009). [DOI] [PMC free article] [PubMed] [Google Scholar]
- 44.Kumar S, Stecher G & Tamura K MEGA7: Molecular Evolutionary Genetics Analysis Version 7.0 for Bigger Datasets. Molecular biology and evolution 33, 1870–1874, doi: 10.1093/molbev/msw054 (2016). [DOI] [PMC free article] [PubMed] [Google Scholar]
- 45.Austin RS, Chatfield SP, Desveaux D & Guttman DS Next-generation mapping of genetic mutations using bulk population sequencing. Methods in molecular biology 1062, 301–315, doi: 10.1007/978-1-62703-580-4_17 (2014). [DOI] [PubMed] [Google Scholar]
- 46.Sun H & Schneeberger K SHOREmap v3.0: fast and accurate identification of causal mutations from forward genetic screens. Methods in molecular biology 1284, 381–395, doi: 10.1007/978-1-4939-2444-8_19 (2015). [DOI] [PubMed] [Google Scholar]
- 47.Lee CM, Adamchek C, Feke A, Nusinow DA & Gendron JM Mapping Protein-Protein Interactions Using Affinity Purification and Mass Spectrometry. Methods in molecular biology 1610, 231–249, doi: 10.1007/978-1-4939-7003-2_15 (2017). [DOI] [PubMed] [Google Scholar]
- 48.Clough SJ & Bent AF Floral dip: a simplified method for Agrobacterium-mediated transformation of Arabidopsis thaliana. The Plant journal : for cell and molecular biology 16, 735–743 (1998). [DOI] [PubMed] [Google Scholar]
- 49.Benjamini YH,Y. Controlling the false discovery rate: a practical and powerful approach to multiple testing. J R Stat Soc Ser B Methodol. 57, 289–300 (1995). [Google Scholar]
- 50.Robinson MD, McCarthy DJ & Smyth GK edgeR: a Bioconductor package for differential expression analysis of digital gene expression data. Bioinformatics 26, 139–140 (2010). [DOI] [PMC free article] [PubMed] [Google Scholar]
- 51.Nomura K et al. A bacterial virulence protein suppresses host innate immunity to cause plant disease. Science 313, 220–223, doi: 10.1126/science.1129523 (2006). [DOI] [PubMed] [Google Scholar]
- 52.Nomura K et al. Effector-triggered immunity blocks pathogen degradation of an immunity-associated vesicle traffic regulator in Arabidopsis. Proceedings of the National Academy of Sciences of the United States of America 108, 10774–10779, doi: 10.1073/pnas.1103338108 (2011). [DOI] [PMC free article] [PubMed] [Google Scholar]
Associated Data
This section collects any data citations, data availability statements, or supplementary materials included in this article.
Supplementary Materials
Data Availability Statement
Raw source 16S rRNA gene sequences from this project are available in the SRA (Sequence Read Archive) database under the BioProject PRJNA554246, accession no. SAMN12259846- SAMN12260169. Bacterial genome source data are available in the SRA database under the BioProject PRJNA555902. Source data for Fig. 4d and 4e are provided in Source Data Supplementary Fig. 1, respectively. Source data for Fig. 8e is provided in Source Data Supplementary Fig. 2. All other source data are provided in Source Data: Supplementary Table 1.