

Summary
From age 65 onwards, the risk of cancer incidence and associated mortality is substantially higher1–6. Nonetheless, our understanding of the complex relationship between age and cancer is still in its infancy2,3,7,8. For decades, this link has largely been attributed to increased exposure time to mutagens in older individuals. However, this view does not account for the well-established role of diet, exercise and small molecules that target the pace of metabolic aging9–12. Here, we show that metabolic alterations that occur with age can render a systemic environment favorable to progression and aggressiveness of tumors. Specifically, we show that methylmalonic acid (MMA), a by-product of propionate metabolism, is significantly up-regulated in the serum of older people, and functions as a mediator of tumor progression. We traced this to MMA’s ability to induce SOX4 and consequently eliciting a transcriptional reprogramming that can endow cancer cells with aggressive properties. Thus, accumulation of MMA represents a novel link between aging and cancer progression, implicating MMA as a novel therapeutic target for advanced carcinomas.
Considering the growing body of evidence demonstrating that cancer cell-extrinsic factors are key in modulating tumor progression, we hypothesized that aging produces a systemic environment that supports tumor progression and aggressiveness. To test this hypothesis, we cultured A549 and HCC1806 cells in 10% human serum (HS) from 30 young (age ≤ 30) and 30 old (age ≥ 60) healthy donors (Fig. 1a; Supplementary Table 1). While the majority of cells treated with young donor sera maintained their epithelial morphology (25 out of 30), cells treated with 25 out of the 30 old donor sera became mesenchymal, losing polarity and displaying a spindle-shaped morphology (Extended Data Fig. 1–3). These phenotypes were independent of donor ethnicity, and resembled epithelial-to-mesenchymal transition (EMT), a developmental process hijacked by cancer cells to acquire pro-metastatic properties13. Cells cultured with aged-donor sera displayed a pronounced loss of the epithelial marker E-cadherin and gain of the mesenchymal markers fibronectin and vimentin, in addition to increased expression of SERPINE1 and MMP2 – proteins associated with aggressive phenotypes13 (Fig. 1b, Extended Data Fig. 4a, b). Moreover, the aged sera promoted resistance to two distinct and widely used chemotherapeutic drugs, carboplatin and paclitaxel (Fig. 1c, Extended Data Fig. 4c). To determine if the cells treated with the old donor sera would also display heightened metastatic potential we treated MDA-MB-231 cells with HS before injecting them into the tail veins of athymic mice. In contrast to the young sera, the aged sera robustly potentiated the ability of the cells to colonize the lungs and form metastatic lesions (Fig. 1d, e). Together, our data show a role for systemic aging and age-induced circulatory factors in promoting the acquisition of aggressive properties of cancers.
Fig. 1: An age-induced circulatory factor promotes aggressiveness.
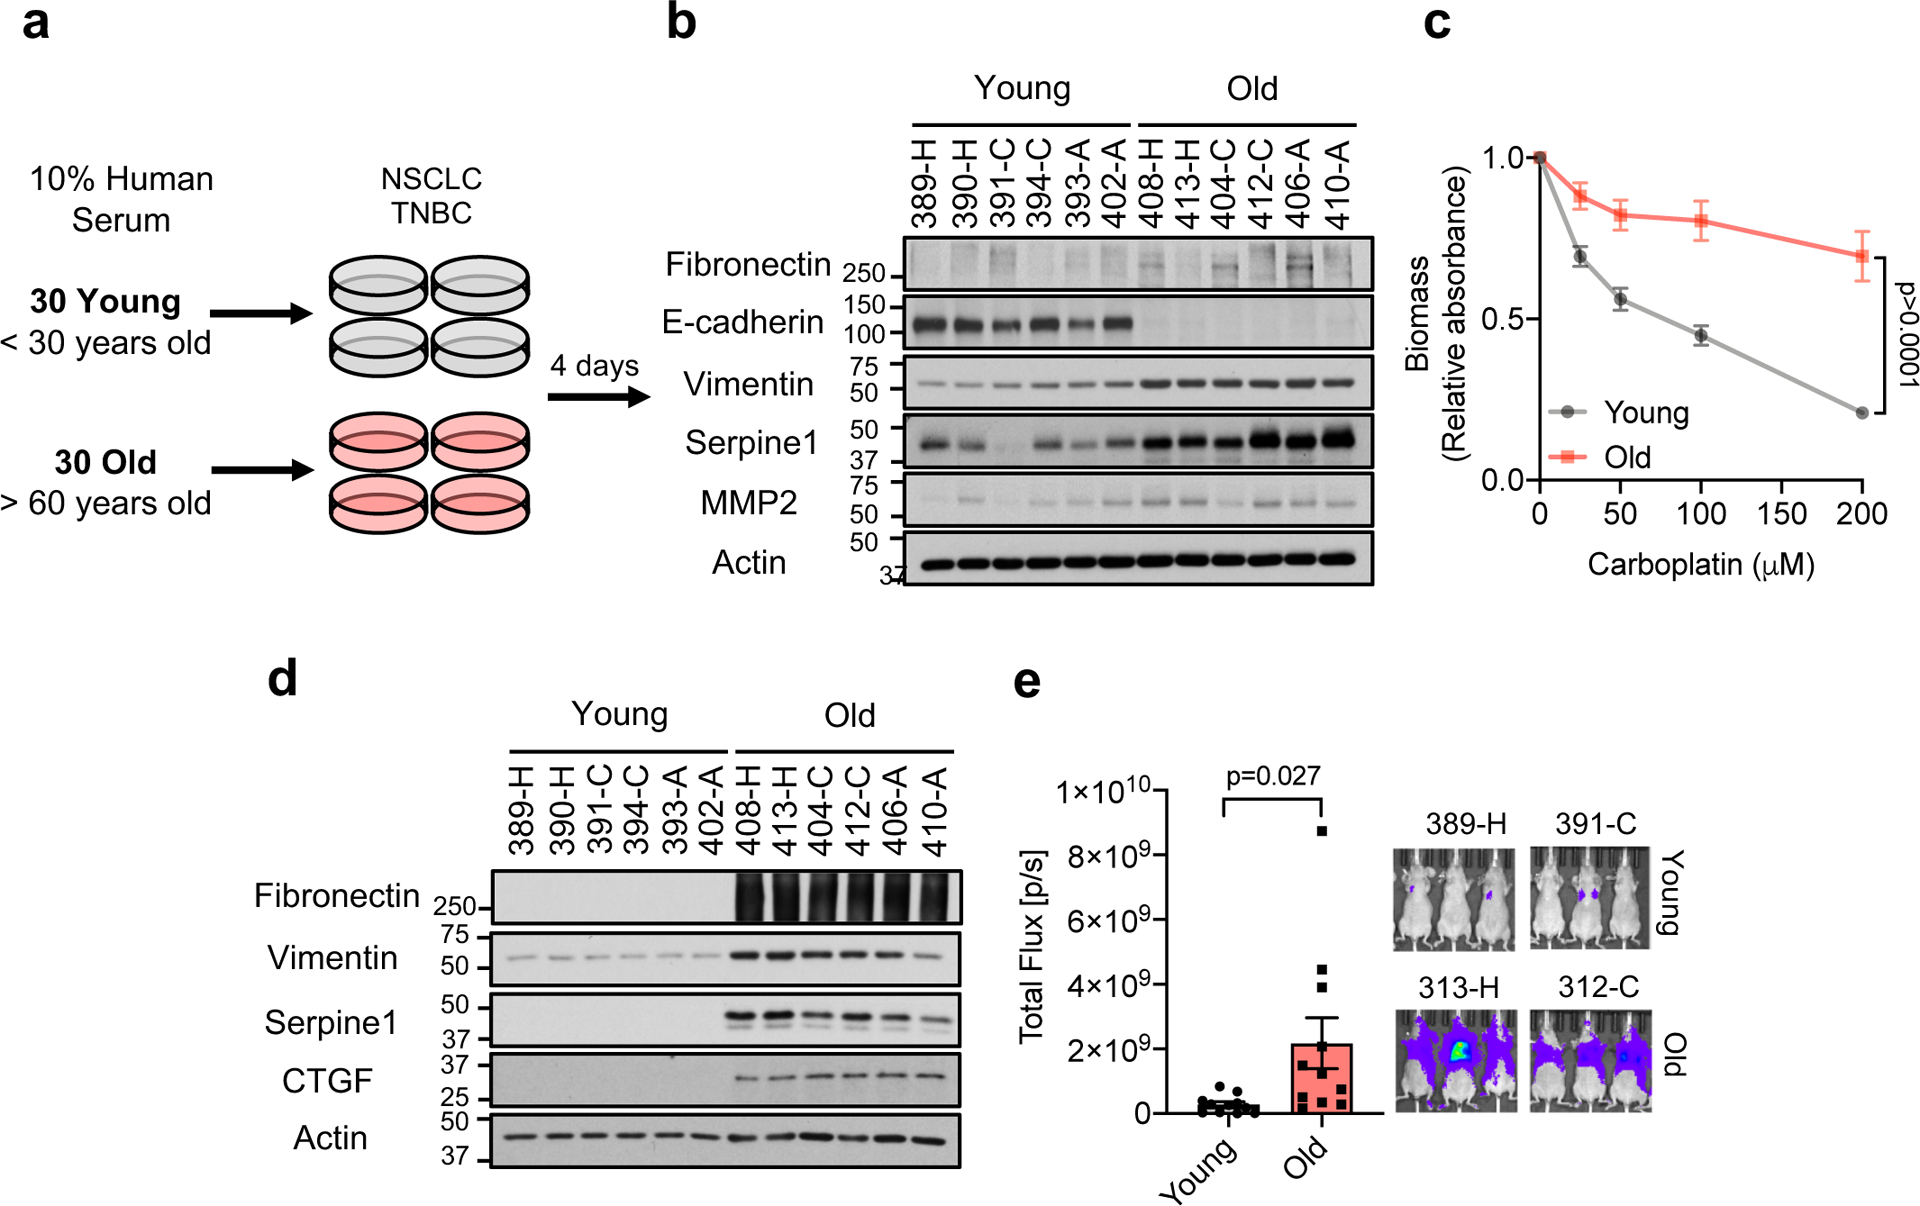
a, Diagram showing experimental design (see Online Methods). b, Immunoblots of A549 cells cultured for 4 days in HS; see Extended Data Fig. 4a (total of n=30 biologically independent samples per HS donor group). c, Resistance to carboplatin in A549 cells cultured for 4 days in HS (n=15 biologically independent samples per HS donor group, two-sided ANOVA). d, e, Metastatic properties of MDA-MB-231-luciferase cells cultured for 5 days in HS evaluated by immunoblots (n=6 biologically independent samples per HS donor group) (d) and lung colonization assay (n=11 biologically independent samples, which are each average of 3 mice used as technical replicates, per HS donor group, two-sided t-test) (e). For (c, e) data are presented as mean ± SEM. For gel source data, see Supplementary Fig. 2.
Pro-inflammatory factors play a key role in tumor progression14, and are also known contributors of age-related diseases15. However, proteomic analysis of the old sera did not show a general pro-inflammatory signature that could explain the aggressive properties we observed in the cancer cells. (Extended Data Fig. 4d). Considering the effectiveness of metabolic interventions such as diet, exercise and caloric restriction, in mitigating cancer susceptibility and outcome1,9–12, we examined the metabolic compositions of the donor sera as an alternative. Out of the 179 circulatory metabolites detected by targeted metabolomics, only 10 were altered at a statistically significant level (Supplementary Table 1). A pronounced decline in glutathione, spermidine, glutamine and α-ketoglutarate levels was expected, considering their known or suggested roles in the aging process16–19 (Supplementary Table 1). Interestingly, only 3 metabolites were consistently increased in the sera from the aged donors: phosphoenolpyruvate, quinolinate and methylmalonic acid (MMA) (Extended Data Fig. 4e). To test if any of these 3 metabolites was responsible for inducing the pro-aggressive effects, we treated A549 cells with each metabolite. Only MMA induced a complete pro-aggressive EMT-like phenotype with a decline in E-cadherin and a concurrent increase in fibronectin and vimentin (Extended Data Fig. 4f).
MMA, a dicarboxylic acid, is primarily a by-product of propionate metabolism. Propionyl-CoA, produced from catabolism of branched chain amino acids and odd chain fatty acids, yields succinyl-CoA in a vitamin B12-dependent manner to fuel the TCA cycle. Accumulation of MMA results from increased flux through and/or deregulation of the enzymes in this pathway and is a marker for a group of inborn metabolic diseases called methylmalonic acidemias, as well as of vitamin B12 deficiency20. Large-scale exploratory metabolomic experiments are notorious for their lack of sensitivity and quantitation21; therefore, to gain a deeper insight we determined the absolute concentration of this metabolite in the sera from all 60 donors. This analysis revealed a more substantial increase in the levels of MMA in the sera of the old (15–80 μM) compared to the young donors (0.1–1.5 μM) (Fig. 2a). Moreover, in the case of the 10 outlier samples (5 old non-EMT-inducing and 5 young EMT-inducing donor sera) MMA levels consistently correlated with the phenotypes observed in cancer cells, supporting the idea that MMA is, at least in part, responsible for the observed age-related aggressive phenotypes (Extended Data Fig. 4g). Vitamin B12 levels are known to decline with age22, and our measurements of vitamin B12 in the sera revealed a modest decline in old donors (Extended Data Fig. 4h); however, this decline did not correlate with MMA levels in the outlier samples (Extended Data Fig. 4i). Although we cannot exclude vitamin B12 deficiency as a contributor to the accumulation of MMA with age, other factors such as deregulation of propionate metabolism in a major organ are also likely to be at play.
Fig. 2: MMA induces aggressive traits of cancer cells.
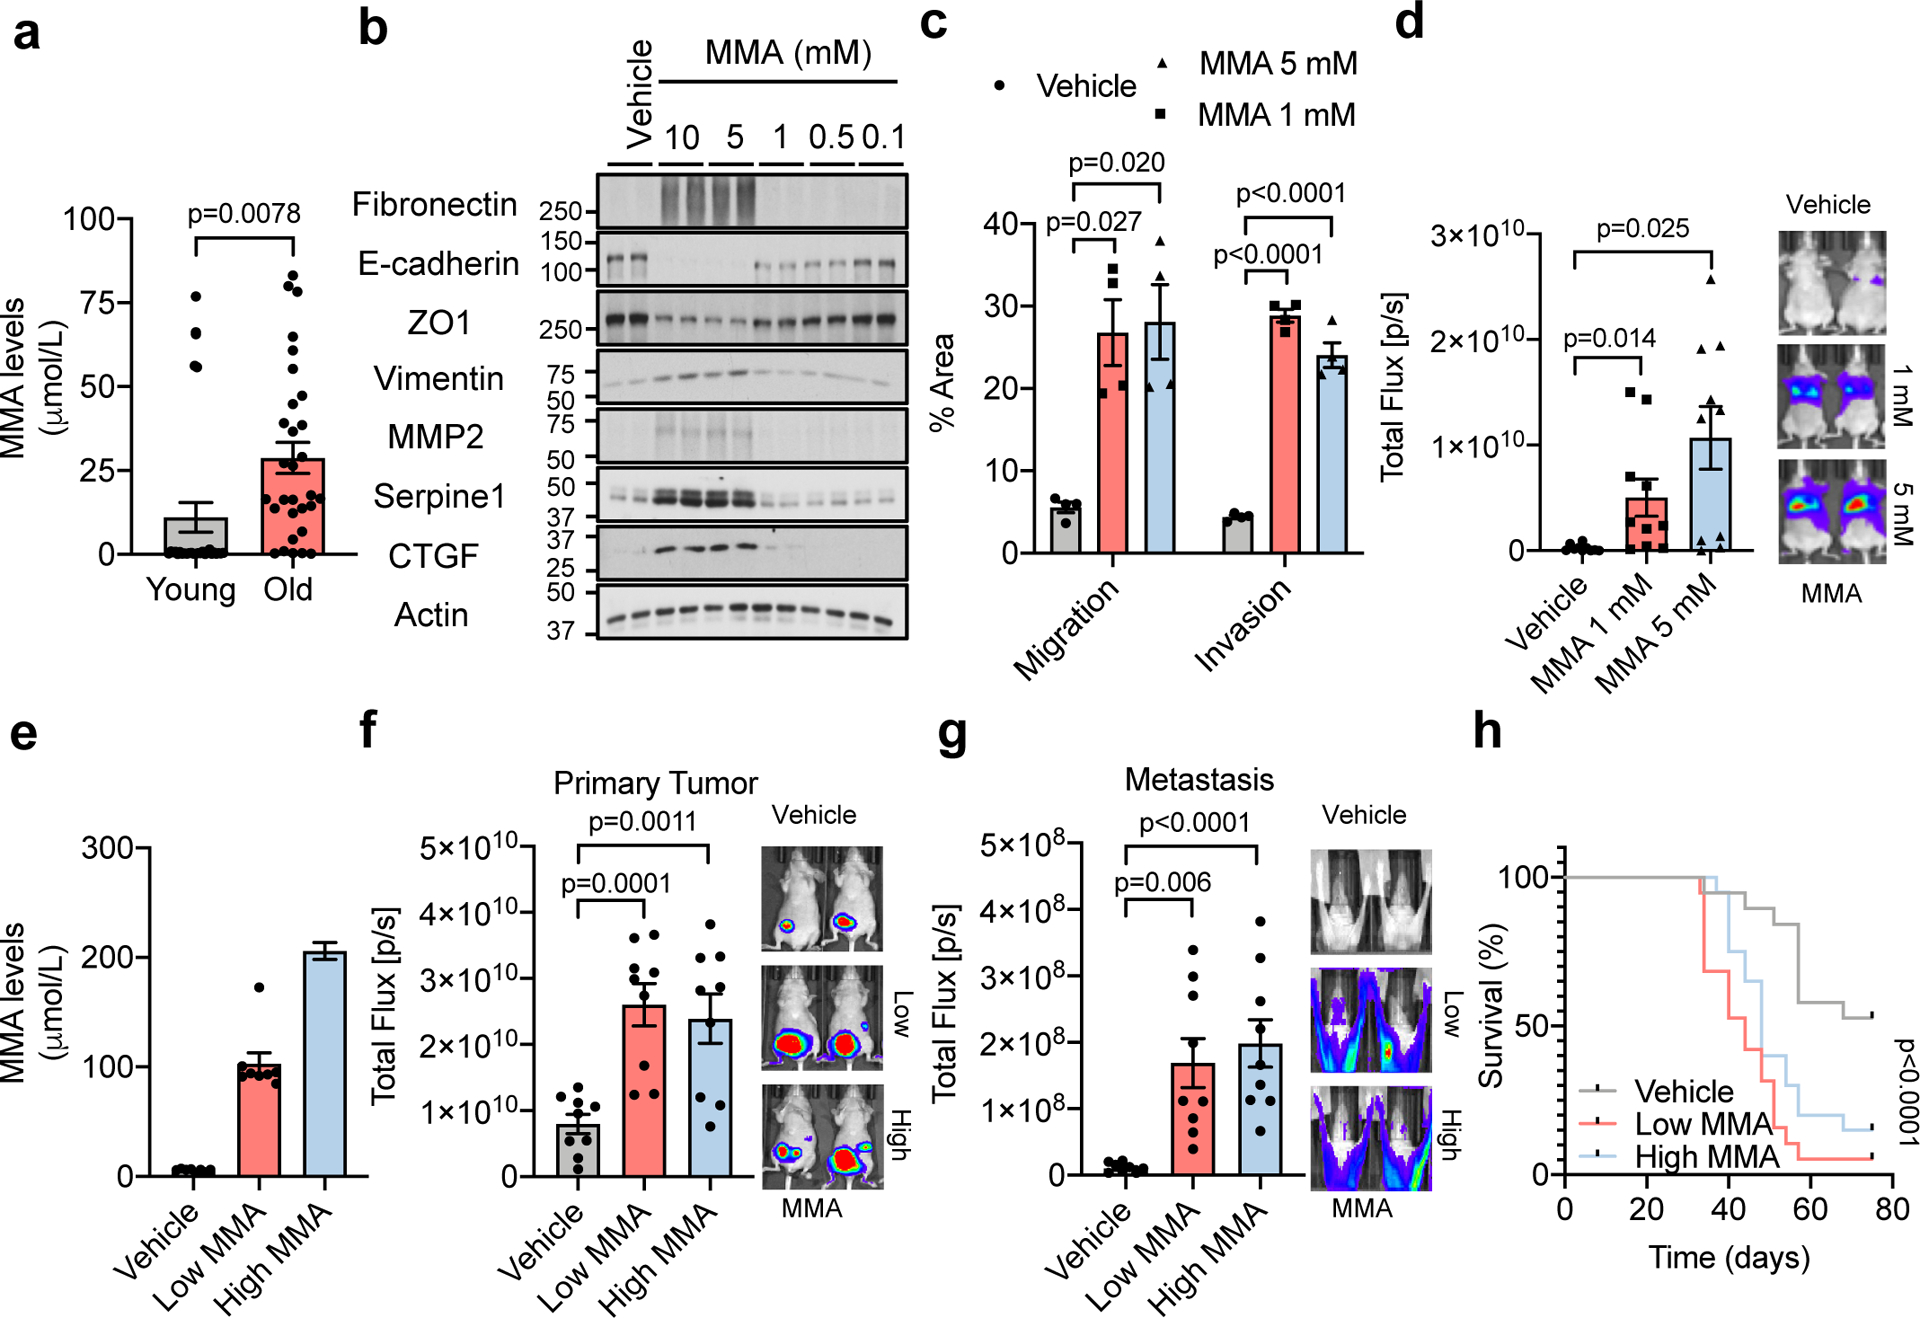
a, Concentrations of MMA in all HS samples (n=30 biologically independent samples per HS donor group). b, Immunoblots of A549 cells treated with MMA for 10 days; representative images (n=4 independent experiments). c, Transwell migration/invasion assays of MCF-10A cells treated with MMA for 10 days (n=4 independent experiments). d, Lung colonization assay of MDA-MB-231-luciferase cells treated with MMA for 5 days (n=10 mice per group). e-g, End-point serum MMA concentrations (n=8 mice per group) (e), bioluminescence intensity of the primary tumors (n=9 mice per group) (f), and metastases (n=9 mice per group) (g) in mice that were xenografted with MDA-MB-231-luciferase cells and subcutaneously injected with MMA daily. h, Kaplan-Meier curve of mice xenografted with MDA-MB-231-luciferase cells and treated with MMA either subcutaneously or through drinking water. (n=19 mice per experimental group). For (a, c-g) two-sided t-test was performed and data are presented as mean ± SEM; for (h) a Mantel-Cox test was utilized. For gel source data, see Supplementary Fig. 2.
To better understand MMA’s pro-aggressive properties, we treated HCC1806, A549 and MCF-10A (a common model for EMT studies) cells with MMA. Concentrations of 1 mM and above were sufficient to induce an EMT-like phenotype and the expression of pro-aggressive proteins (Fig. 2b, Extended Data Fig. 5a, b). Importantly, the pro-aggressive effects of MMA were specific, as different acids of similar structure and pKa did not induce the same complete phenotype with the specific conditions used (Extended Data Fig. 5c, d). MMA treatments also induced resistance to carboplatin and paclitaxel (Extended Data Fig. 5e–h), increased the cells’ migratory and invasive capacity (Fig. 2c, Extended Data Fig. 5i), and promoted stem-like properties, as shown by an upregulation of CD44 and a decline in CD24 (Extended Data Fig. 5j, k). Treatment of MDA-MB-231 cells in vitro with MMA increased markers of aggressiveness (Extended Data Fig. 5l) and was sufficient to robustly increase their ability to colonize the lungs of athymic mice in a concentration-dependent manner (Fig. 2d). All together, these data support MMA as a promoter of pro-aggressive traits and as a contributor to the cellular plasticity required for tumor progression.
Although MMA concentrations above 1 mM were required to potently induce aggressive traits in cancer cells in vitro, MMA concentrations measured in the sera from old donors were much lower (Fig. 2a). Further analysis demonstrated that the intracellular concentrations of MMA achieved within 4 hours of treatment with old sera or 5 mM MMA were substantially different (Extended Data Fig. 6a, b). In fact, 5 mM MMA could only produce intracellular concentrations similar to the ones observed with 4-hour old sera treatment by 48 hours. In contrast, a more cell-permeable version of MMA (dimethyl MMA) could induce pro-metastatic effects at concentrations as low as 10–50 μM (Extended Data Fig. 6c, d), suggesting that the discrepancy in concentrations are due to a lower cell-permeability of added MMA compared to endogenous MMA in donor sera. To assess if another component of the sera could facilitate the entrance of MMA in cancer cells, we depleted the old sera of lipids or of molecules larger than 3 kDa, two manipulations that should not affect the levels of polar metabolites such as MMA. In both cases, the ability of the depleted old sera to induce pro-aggressive properties was abolished (Extended Data Fig. 6e). Strikingly, both manipulations also caused a pronounced decrease in serum MMA levels (Extended Data Fig. 6f), indicating that the MMA responsible for this phenotype is complexed with lipidic structures (LSs) larger than 3 kDa in the sera facilitating its entry into cancer cells. To test this hypothesis, we first complexed MMA with synthetic LSs (LA) or with LSs purified from fetal bovine serum (FBS). With both approaches, the concentration of MMA necessary to induce pro-aggressive properties was reduced to the levels similar to the old donor sera (Extended Data Fig. 6g–i). Moreover, MMA complexed with LSs from FBS produced a similar intracellular concentration of MMA within the same time frame as treatment with old donor sera (Extended Data Fig. 6j). In support of this idea, treatment of cancer cells with LSs isolated from old sera, but not from young sera, or isolated from young sera and loaded with MMA at concentrations similar to the ones found in the old sera was sufficient to drive pro-aggressive properties (Extended Data Fig. 6k). Conversely, LS depletion from old sera resulted in a reduction of total serum MMA levels and was sufficient to abrogate the pro-aggressive phenotype (Extended Data Fig. 6l, m). Orthotopic injections of MDA-MB-231 cells into the mammary fat pads of athymic mice with elevated circulatory MMA levels (Fig. 2e, Extended Data Fig. 7a) further demonstrated a significant role of circulatory MMA in tumor progression by promoting tumor growth, metastatic spread and a concomitant significant decrease in survival of this cancer model (Fig. 2f–h, Extended Data Fig.7b, c). Altogether, our data show that MMA, complexed with LSs, is a circulatory factor that contributes to the pro-aggressive effects of aging in cancer cells and is sufficient to drive tumor progression and aggressiveness.
To investigate how MMA promotes the observed cellular plasticity, we performed a global transcriptomic analysis in A549 cells treated with MMA for 10 days. We found a dramatic transcriptional reprogramming induced by MMA (Extended Data Fig. 7d, Supplementary Table 2). Gene set enrichment analysis (GSEA) showed that MMA regulates genetic programs associated with cell fate decisions, such as wound healing and pattern specification (Extended Data Fig. 7e), as well as genes involved in resistance to chemotherapeutic drugs, including several members of the ABC transporter family (Extended Data Fig. 7f). Many of the upregulated genes encode secreted proteins known to remodel the tumor microenvironment, including factors that promote reorganization of the extracellular matrix, immunosuppressive cytokines, as well as ligands that promote cell-to-cell communication (Extended Data Fig. 7g, h). Altogether, MMA controls a panoply of genetic programs, remodeling both the tumor cells and the microenvironment to promote aggressiveness and cancer progression.
GSEA also showed MMA to be a positive regulator of transcription (Extended Data Fig. 7e), suggesting that the observed pro-aggressive transcriptional reprogramming may be mediated through this role. To find the transcriptional regulators involved, we again performed global transcriptomic analysis at an earlier time point of MMA treatment (day 3). Surprisingly, out of 439 induced genes (upregulated ≥1.5 fold), only 11 were transcription factors, 9 of which were significantly changed with qPCR validation (Extended Data Fig. 7i; Supplementary Table 2). One of the most upregulated of these transcription factors was the SRY-related HMG box (SOX) 4. Notably, SOX4 is a poor prognosis marker that contributes to tumor progression and metastasis formation, with aberrantly high expression in a wide variety of aggressive cancers23–26, and is known to be a master regulator of EMT27. The levels of SOX4 were considerably increased in a variety of cell models treated with different MMA concentrations, as well as in cells cultured with aged sera (Fig. 3a, b, Extended Data Fig. 7j–l)), supporting the idea that SOX4 mediates the pro-aggressive phenotype observed. A comparison between genes induced by SOX428 and the ones induced by MMA treatment revealed a statistically significant overlap of 199 genes (Extended Data Fig. 7m, Supplementary Table 2). Functional annotation clustering analysis revealed that the overlapping genes – such as FN1 (Fibronectin), CDH2 (N-Cadherin), MMP2, IL32 and TGFB1I1 – are associated with pro-aggressive genetic programs. To better understand the relationship between MMA and SOX4, we used shRNA to suppress SOX4 expression. Upon SOX4 suppression, treatment with MMA failed to upregulate the mRNA levels of several of these genes (Extended Data Fig. 8a–d). Moreover, suppression of SOX4 blocked the ability of MMA or old sera to induce EMT and aggressive markers (Extended Data Fig. 8e, f). Finally, SOX4 depletion fully abrogated the ability of MMA to promote migratory and invasive properties (Extended Data Fig. 8g), resistance to chemotherapeutic drugs (Extended Data Fig. 8h, i), and the ability of MDA-MB-231-luciferase cells to form colonies in the lungs of athymic mice upon treatment with MMA or with old sera (Fig. 3c, d).
Fig. 3: MMA triggers a pro-aggressive transcriptional reprogramming by activation of TGFβ signaling and consequent induction of SOX4.
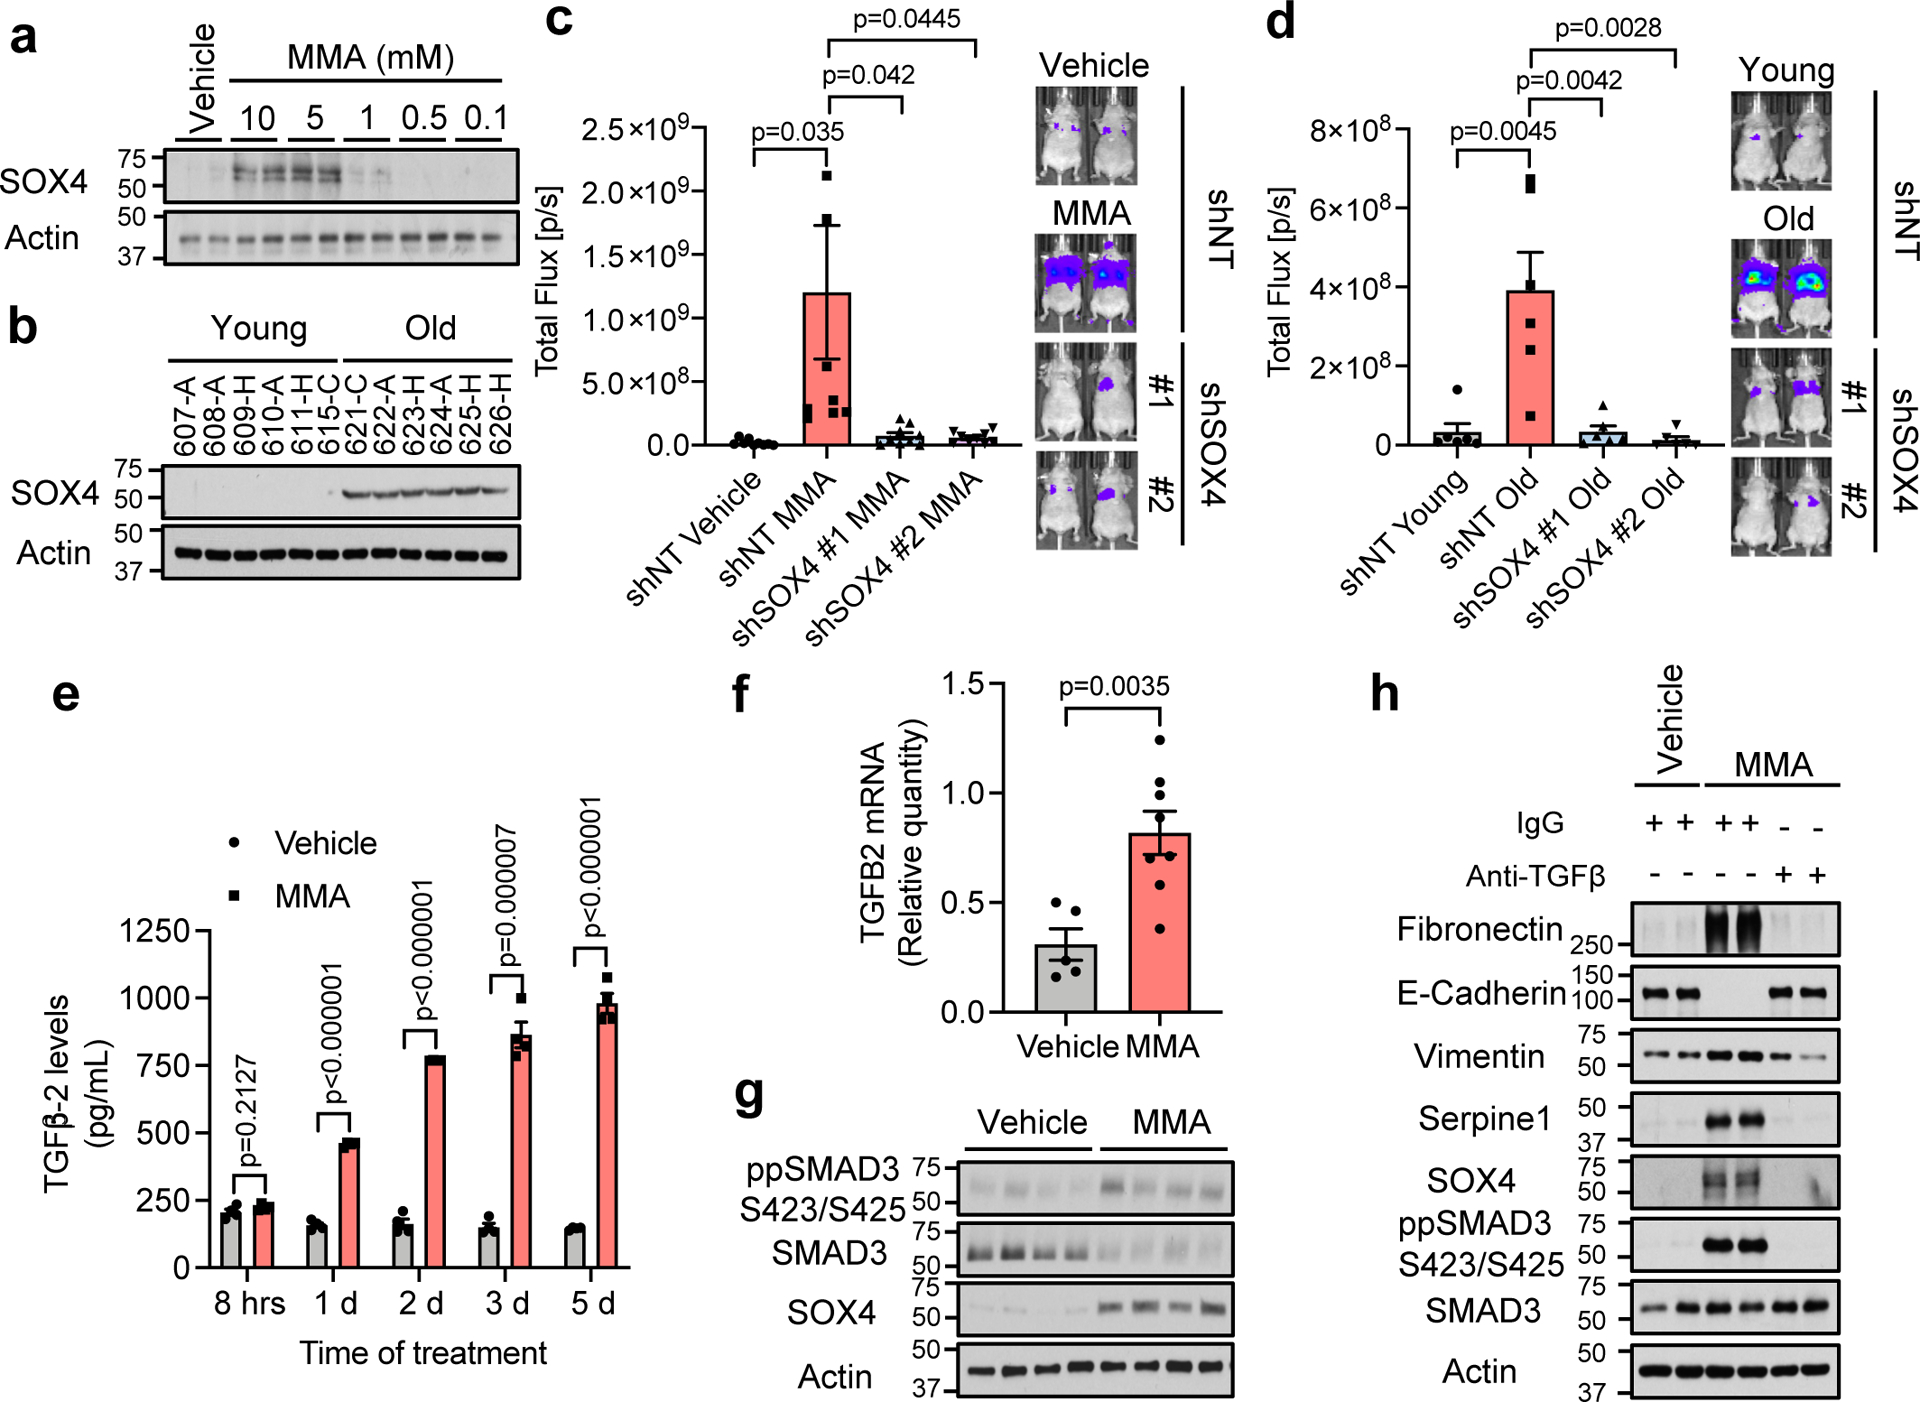
a, b Immunoblots of A549 cells treated with MMA for 10 days (n=4 independent experiments) (a) and HS for 4 days (n=6 biologically independent samples, which are each average of 3 mice used as technical replicates, per HS donor group,) (b). c, d, Lung colonization assay of MDA-MB-231-luciferase cells with SOX4 knockdown and treated with 5 mM MMA (n=8 mice per group) (c) or HS from old donors (n=6 mice per group) (d) for 5 days. e, Levels of TGFβ−2 ligand in conditioned media from A549 cells treated with 5mM MMA (n=4 independent experiment). f, g, TGFB2 mRNA levels determined by qPCR (vehicle n=5, MMA n=8 mice) (f) and immunoblots (representative images, n=8 mice per group) (g) in tumor samples from mice subcutaneously injected with the lower dose of MMA daily. h, Immunoblots of A549 cells treated with 5 mM MMA in the presence of TGFβ neutralizing antibody; representative images (n=4 independent experiments). For (c-f) two-sided t-test were performed and data are presented as mean ± SEM. For gel source data, see Supplementary Fig. 2.
Having shown that MMA promotes a pro-aggressive transcriptional remodeling through SOX4 induction, we next sought to understand how MMA induces SOX4 levels. TCA-related metabolites are known for their ability to regulate transcription through regulation of histone methylation levels29. In the cancer cell models used in this study, however, treatment with MMA did not change total levels of major histone modifications (Extended Data Fig. 9a, b). Alternatively, the TGFβ pathway regulates SOX4 levels30, and further analysis of the RNA-seq data showed an increase of several components of the TGFβ signaling pathway, including the upregulation of TGFB2 ligand (Supplementary Table 2). We confirmed the increase in the mRNA of TGFB2 (Extended Data Fig. 9c), which correlated with an increase over time in the abundance of TGFβ−2 in the media of cancer cells treated with MMA (Fig. 3e). Moreover, and supporting the physiological relevance of these findings, analysis of the tumor tissues from mice with elevated circulatory MMA levels showed a significant upregulation of TGFB2 mRNA, a concomitant induction of the TGFβ signaling and upregulation of SOX4 (Fig. 3f, g). Time course analysis showed that MMA robustly induced TGFβ signaling within 24 hours, during which an increase in SOX4 is observed, before any of the pro-aggressive markers are detected (Extended Data Fig. 9d), suggesting a link between activation of TGFβ signaling, SOX4 induction and the acquisition of pro-aggressive properties driven by MMA. To test if activation of TGFβ signaling is responsible for SOX4 upregulation, we concurrently treated cancer cells with MMA and a TGFβ receptor inhibitor or a pan TGFβ neutralizing antibody. Both inhibition of the TGFβ receptor or neutralization of TGFβ ligand in the media was sufficient to block the ability of MMA to induce SOX4 and pro-aggressive properties (Fig. 3h, Extended Data Fig. 9e). These data suggest that MMA relies on the activation of TGFβ signaling in an autocrine fashion to induce SOX4 and consequently the transcriptional reprogramming necessary for the cellular plasticity that sustains tumor progression.
Taken together, our results show that metabolic deregulation of the aged host plays a central role in the acquisition of aggressive properties thus contributing to tumor progression. Specifically, aging promotes the increase in circulatory MMA, which in turn endows cancer cells with the properties necessary to migrate, invade, survive and thrive as metastatic lesions resulting in decreased cancer-associated survival (Extended Data Fig. 9f). Although more in-depth studies are necessary to fully determine the scope of age-driven changes that contribute to the tumorigenic process, this study adds metabolic reprogramming to the complex relationship between aging and cancer.
Methods
Cell Lines
MCF-10A human mammary epithelial cells were obtained from the American Type Culture Collection (ATCC), and were cultured as previously described31. HCC1806 human breast cancer (triple negative breast cancer—TNBC) and A549 human lung cancer (non-small cell lung cancer—NSCLC) cell lines were also obtained from ATCC and were cultured in RPMI 1640 medium (Corning) supplemented with 10% FBS (Sigma-Aldrich) and penicillin-streptomycin (Gibco). MDA-MB-231-luciferase cells described previously32 were generated from the MDA-MB-231 parental human breast cancer cell line (ATCC) in Dr. Massague’s lab and obtained from Memorial Sloan Kettering Monoclonal Antibody Core facility. They were maintained in high glucose DMEM (Gibco) supplemented with 10% FBS (Sigma-Aldrich) and penicillin-streptomycin (Gibco). HEK293T cells were obtained from GenHunter and cultured in high glucose DMEM (Gibco) supplemented with 10% FBS (Sigma-Aldrich) and penicillin-streptomycin (Gibco). All cell lines were maintained at 37°C and 5% CO2. All cell lines were routinely tested for mycoplasma and were at all times mycoplasma negative.
Mice
Female nu/nu athymic mice (Envigo) were purchased at the age of 4–6 weeks, and the experiments were started 7–10 days after the mice were received at the Weill Cornell Medicine Belfer Research Building Vivarium. Experimental groups of 7–10 mice were created randomly and mice were group housed (maximum 5 in a cage) in standard cages with unrestricted acidified water and food, PicoLab Rodent Diet 5053 (Labdiet, Purina) containing 20% protein and 5% fat. Only deviation from the standard housing was for animals that received MMA in their drinking water as described in “Orthotopic Xenograft Experiments in Mice” section. Animal husbandry was carried out by the vivarium technical staff in a human xenograft designated area following animal biosafety level-2 procedures. The room was maintained at 21–23°C and a 12h light-dark cycle. The mice were maintained in compliance to Weill Cornell Medicine Institutional Animal Care and Use Committee protocols. The tumor size limit on the protocol was 20 mm on the largest dimension or 2.5 cm3 tumor volume or 10% of body weight, whichever was reached first. For mice studies no statistical method was used to predetermine sample size, mice were randomly distributed among the treatment groups and no blinding was performed.
Human Serum
Human serum from 30 “young” (aged 30 and below) and 30 “old” (aged 60 and above) male adults with no diagnosed disease at the time of collection were obtained from BioreclamationIVT (now BioIVT) collected as two separate batches (15 young and 15 old donors in each batch). Investigators of this manuscript did not participate in the recruitment of human participants or received any patient identifiers. The vendor was responsible for recruitment of donors and sample collection. BioreclamationIVT collected sera from consented donors under their IRB approved protocols at FDA registered donor centers and expansive clinical collection network. The specific serum used in this study is limited but samples from similar donors can be obtained from BioreclamationIVT. For detailed information on the donors please see Supplementary Table 1 for details. In figure legends, the race of donors is indicated as A – African American; C – Caucasian; H – Hispanic.
Cell Culture Treatments
To test the effects of aged serum in cancer cells, A549 or HCC1806 cells were seeded and their media replaced the next day with media containing 10% human serum for 4 days. Prior to replacement of the culturing media, the cells were washed 3 times with PBS. To evaluate the effects of the top upregulated metabolites in the serum of the elderly, A549 cells were plated in normal culture media and the following day treated with 5 mM quinolinate (QA) (Sigma-Aldrich), 5 mM phosphoenolpyruvate (PEP) (Sigma-Aldrich), 5 mM methylmalonic acid (MMA; Tocris), or vehicle (0.1% DMSO for quinolinate; double distilled water for MMA and phosphoenolpyruvate). For the subsequent treatments to determine the effects of MMA on cellular phenotypes, MCF-10A, HCC1806, MDA-MB-231-luciferase and A549 cells were seeded and the next day treatment was initiated with indicated concentrations of MMA (Tocris) or vehicle (double distilled water) for the time frames indicated. To test the specificity of MMA treatments in the phenotypes tested, A549 and HCC1806 cells were treated with 5 mM MMA (Tocris), 5 mM malonic acid (Sigma-Aldrich), 5 mM propionic acid (Sigma-Aldrich), 5 mM fumaric acid (Sigma-Aldrich), 5 mM pyruvic acid (Sigma-Aldrich), or vehicle (0.1% DMSO) for 10 days. MCF-10A cells were treated with vehicle (0.1% DMSO) or 1 mM each of the following acids: MMA (Tocris), malonic acid, propionic acid, succinic acid, pyruvic acid, hydroxyisobutyric acid (Sigma-Aldrich), fumaric acid (Sigma-Aldrich), maleic acid (Sigma-Aldrich), malic acid (Sigma-Aldrich), or ⍺-ketoglutaric acid (Sigma-Aldrich) for 10 days. To test the effects of enhanced MMA permeability A549 and HCC1806 cells were treated with 5 mM MMA or a range of dimethyl-MMA (Sigma-Aldrich) concentrations (5, 0.5, 0.05 or 0.005 mM), or vehicle (0.1% DMSO) for 10 days. MCF-10A cells, on the other hand, were treated with 1 mM MMA or a range of dimethyl-MMA concentrations (1, 0.1, 0.01 or 0.001 mM), or vehicle (0.1% DMSO) for 10 days. To test the role of TGFβ signaling in SOX4 induction upon MMA treatment, A549 cells were pretreated for 2 hours with TGFβ receptor inhibitor SB431542 (S1067; Selleck Chem) dissolved in DMSO or with 0.5 μg/ml TGFβ neutralizing antibody (MAB1835, R&D Biosystems; normal mouse IgG from Santa Cruz sc2025 used as control), and then maintained with the inhibitor or the antibody for the duration of MMA treatment. For all acidic treatments, 25 mM HEPES (Sigma-Aldrich) was added to the treatment media to buffer potential changes in pH, and the media were replaced every day during the treatments.
Targeted Metabolomics and Data Analysis
Circulatory polar metabolites were extracted using 80% (v/v) aqueous methanol as described before33 from 100 μL of sera of young and old donors. Targeted liquid chromatography-tandem mass spectrometry (LC-MS/MS) was performed using a 5500 QTRAP triple quadrupole mass spectrometer (AB/SCIEX) coupled to a Prominence UFLC HPLC system (Shimadzu) with Amide HILIC chromatography (Waters). Data were acquired in selected reaction monitoring (SRM) mode using positive/negative ion polarity switching for steady-state polar profiling of greater than 260 molecules. Peak areas from the total ion current for each metabolite SRM transition were integrated using MultiQuant v2.0 software (AB/SCIEX). Statistical analysis of the data was carried out using MetaboAnalyst v4.0, a free online software for the analysis of metabolomic experiments (www.metaboanalyst.ca). The original data was normalized to the median of the entire metabolome in each sample and log transformed prior to further analysis (Supplementary Table 1).
Proteomic Analysis of Human Serum
Abundant serum proteins were depleted using High Select Top 14 spin columns (Thermo #A36370) following the manufacturer provided protocol. Briefly, 10 μl of serum was applied to each column and incubated for 10 min with end-over-end rotation. Depleted samples were collected by centrifugation at 2000 x g for 2 min. Ice-cold 100% trichloroacetic acid was added to 20% final concentration. Proteins were allowed to precipitate on ice for 60 min and then pelleted for 10 min at 20k x g at 4°C. Pellets were washed twice with ice-cold acetone and allowed to dry at room temperature. Dry protein pellets were re-suspended in 8 M urea, 50 mM ammonium bicarbonate (ambic). Proteins were reduced by addition of dithiothreitol (DTT) to 5 mM and incubating at room temperature for 30 min, then alkylated by adding iodoacetamide to 15 mM and incubating in the dark at room temperature for 30 min. Iodoacetamide was quenched with an additional 5 mM DTT. Samples were diluted to 2 M urea with 50 mM ambic and digested overnight at room temperature by adding 600 ng Lysyl endopeptidase (lysC, Wako Chemicals USA, Inc.). Samples were further diluted to 1 M urea with 50 mM ambic and digested with 600 ng sequencing grade modified trypsin (Promega) for 6 hr at 37°C with shaking. Digests were acidified by the addition of neat formic acid (FA) to 2% final concentration, and desalted on hand packed C18 STAGE Tips34. Eluted peptides were dried in a centrifugal evaporator. Peptides were labeled with 10-plex amine reactive TMT labeling reagents (Thermo Fisher, Rockford, IL) by re-suspending in 100 μl of 0.2 M HEPES pH 8 and adding 0.2 mg of each TMT label in 10 μl of anhydrous acetonitrile and incubating at RT for 1 hr. Reactions were quenched with 8 μl of 5% hydroxylamine and then acidified with 16 μl neat FA. Test mixtures for each 10plex set were generated by mixing 5 μl from each channel and analyzed with a 75 min gradient version of the final analysis method (described below). The final mix was adjusted based on this analysis to generate equal total reporter ion intensities from each TMT channel. Mixed peptides were desalted on 50 mg tC18 Sep-Pak cartridges (Waters, Milford, MA), dried, and re-suspended in 5 μl of 5% FA. Mass Spectrometric analysis was performed on a Thermo Orbitrap Fusion mass spectrometer (Thermo Fisher, Waltham, MA) equipped with an Easy nLC-1000 UHPLC (Thermo Fisher Scientific). Peptides were separated with a gradient of 6–25% ACN in 0.1 % FA over 155 min and introduced into the mass spectrometer by nano-electrospray as they eluted off a self-packed 40 cm, 75 μm (ID) reverse-phase column packed with 1.8 μm, 120 Å pore size, C18 resin (Sepax Technologies, Newark, DE). They were detected using a data-dependent MS2 method with a real-time search (RTS) plugin35 used to trigger MS3 scans for TMT reporter ion quantification. For each cycle, one full MS scan was acquired in the Orbitrap at a resolution of 120,000 with automatic gain control (AGC) target of 5 × 10⁵ and a maximum ion accumulation time of 100 ms. Each full scan was followed by the selection of the most intense ions, as many as possible in 2 s total cycle time, for collision induced dissociation (CID) and MS2 analysis in the linear ion trap for peptide identification using an AGC target of 1.5 × 10⁴ and a maximum ion accumulation time of 50 ms. Ions selected for MS2 analysis were excluded from reanalysis for 60 s. Ions with +1 or unassigned charge were also excluded from analysis. MS2 spectra were searched in real-time using the RTS module35. RTS settings required a binomial score threshold of 65 to trigger SPS MS3 scans using positively identified MS2 fragment ions. Selected MS2 ions were fragmented with a HCD collision energy of 55 and scanned in the orbitrap at a resolution of 50,000 at m/z 200. To increase coverage of lower abundance proteins, we used the gene close-out feature to trigger a maximum of 10 MS3 per protein. MS/MS spectra were matched to peptide sequences using SEQUEST v.28 (rev. 13)36 and a composite database containing the 20,415 Uniprot reviewed canonical predicted human protein sequences (http://uniprot.org, downloaded 5/1/2019) and its reversed complement. Search parameters allowed for three missed cleavages, a mass tolerance of 20 ppm, a static modification of 57.02146 Da (carboxyamidomethylation) on cysteine, and dynamic modifications of 15.99491 Da (oxidation) on methionine and 229.16293 for TMT on lysines and peptide amino termini. Peptide spectral matches (PSMs) were filtered to 1% FDR using the target-decoy strategy37 combined with linear discriminant analysis (LDA)38 using the SEQUEST Xcorr and ΔCn’ scores, precursor mass error, observed ion charge state, and the number of missed cleavages. The data were further filtered to a 1% protein FDR using the same strategy with protein scores derived from the product of all LDA peptide probabilities. Remaining peptide matches to the decoy database as well as contaminating proteins (e.g., human keratins) were removed from the final data set. TMT reporter ion signal-to-noise (SN) values were extracted for all PSMs by identifying the maximum peak intensity within a 3 millidalton window around the theoretical m/z. Each PSM was required to have a sum reporter ion SN across all 10 TMT channels ≥ 100 for inclusion in subsequent protein quantification. Reporter ion intensities were adjusted to correct for the isotopic impurities of the different TMT reagents based on manufacturer supplied values. Protein quantification was performed separately for each 10plex by summing SN values from all matching PSMs for each channel. The protein sum SN values were normalized to correct for mixing errors by dividing each value by the sum of all values within its channel. These values were then transformed for each protein to generate a fractional intensity for each sample. All raw data files, peak lists, and the sequence database have been deposited in the MASSive repository (https://massive.ucsd.edu, ID#: MSV000084974).
Measurements of MMA and Vitamin B12 Concentrations in Human Serum
Frozen aliquots of the human serum (unprocessed, delipidated, size excluded or lipidic structure depleted) were sent to ARUP Laboratories (Sat Lake City, Utah) for measurement of MMA (test code: 2005255) and vitamin B12 (test code: 0070150) concentrations. ARUP Laboratories is a national nonprofit and academic reference laboratory of diagnostic medicine.
Delipidation and Size-Exclusion in Human Serum
Human serum samples were manipulated to assess the components of human serum that might facilitate entrance of MMA into cells. To delipidate the human serum Cleanascite Lipid Removal Reagent (Biotech Support Group) was utilized according to the manufacturer’s protocol specifically for “serum” samples, using a 1:4 volume ratio of Cleanascite reagent to sample. To deplete the serum from molecules larger than 3 kDa serial filtration through size exclusion columns was performed. Initially sera was applied to Amicon Ultra-4 centrifugal filter units (Milipore) with a molecular size cut-off of 100 kDa and centrifuged at 4000 x g at 4°C. The flow-through fraction then was processed successively through filter units with molecular size cut-offs of 50, 10 and 3 kDa. Delipidated or size-excluded human serum fractions were used in cell culture treatments similarly to unprocessed human serum as described above.
Lipidic Structure (LS) Isolation from Serum and LS Depletion from Human Serum
Lipidic structures were isolated from freshly thawed fetal bovine serum (FBS) or human serum using Total Exosome Isolation (from Serum) reagent (Invitrogen) according to the manufacturer’s protocol. Briefly 6 ml FBS or 1.5 ml of each human serum was pelleted with the reagent (supernatants were saved to be used as LS-depleted serum) and then the pellets were resuspended in sterile PBS in a volume equal to half of the starting serum volume (3 ml and 750 ul respectively). Aliquots of LSs were kept at −80°C to prevent freeze thaw cycles. Cells were treated with 150 μl LSs in PBS from human serum (LSs from equivalent to 300 μl human serum) or 300 μl LS-depleted human serum in 6 cm plates with 3 ml normal growth media for a total of 4-day treatment. The media was changed, and treatment repeated for a second time 48 hours after the initial treatment. To control for presence of the Total Exosome Isolation reagent in these LS-depleted sera, we added same amount of the reagent to cells treated with the control human serum.
Complexing of MMA with Artificial or Serum-Derived Lipidic Structures (LSs)
MMA was complexed with artificial LSs (Lipofectamine 2000) or with serum-derived LSs to achieve final concentrations of 1, 10 or 100 μM in the culture media. Briefly Lipofectamine 2000 and indicated amounts of MMA were diluted in Opti-MEM (Gibco) medium and incubated for half an hour for complex formation. A549 cells were treated with the complexes and the media were replaced with fresh growth media 24 hours later. Cells were treated one more time with freshly made complexes 48 hours after the initial treatment. The media were again replaced 24 hours later and cell lysates were collected 4 days after the initial treatment with the complexes. For complexing MMA with LSs isolated from either FBS or human serum Exo-Fect Exosome Transfection Kit (System Biosciences) was used according to the manufacturer’s protocol. Briefly 200 μl LSs from FBS or 300 μl LSs from each human serum was processed and resuspended in 600 μl PBS to be used to transfect 2–6 cm plates. Complexes were made fresh before the initial treatment and then the remaining complexes were stored at −80°C until they were used for the second treatment. Cells were treated with 300 μl MMA-complexed LSs in PBS in their normal growth media that contained either FBS or horse serum. The cells were treated with the remaining 300 μl MMA-complexed LSs a second time 48 hours after the initial treatment. The cell lysates were collected 4 days after the initial treatment.
SOX4 Gene Silencing
shSOX4 #1 (TRCN0000018213), shSOX4 #2 (TRCN0000018214) and shNT (shGFP - TRCN0000072181, all from Sigma Aldrich) lentiviruses were produced by co-transfection of HEK293T cells with plasmids encoding psPAX2 (Addgene plasmid 12260), and pMD2.G (Addgene plasmid 12259) using X-tremeGENE HP (Roche) in accordance with the manufacturer’s protocol. Medium was changed 24 hours post-transfection and the virus harvested after 48 hours, filtered, and used to infect MDA-MB-231 luciferase and A549 cells in the presence of 8 μg/mL polybrene (Sigma-Aldrich). Selection of resistant colonies was initiated 24 hours later using 2 μg/mL puromycin (Sigma-Aldrich) for 24 hours after which the cells were treated with MMA as described above for the time frame indicated.
Quantification of TGFβ−2 Ligand Levels in Cell Culture Media
A549 cells were treated with 5 mM MMA for indicated amounts of time and then the conditioned culture media were collected. The samples were centrifuged for 3 minutes at 300 g to remove any cells and debris and activated using the Sample Activation Kit 1 (R&D Systems) according to the manufacturer’s protocol. Human TGFβ−2 levels in these conditioned media were measured with the Human TGFB2 Quantikine ELISA Kit (R&D Systems) according to the manufacturer’s protocol.
Chemotherapeutic Drug Assays
A549, HCC1806 and MCF-10A cells were treated with the indicated concentrations of MMA or vehicle (double distilled water) for 10 days. A549 and MDA-MB-231-luciferase cells with SOX4 silenced were also treated with MMA as described above after which they were seeded in 96-well plates in technical triplicates. The cells were treated the next day with either vehicle control (DMSO (0.1%)), carboplatin (0–200 μM), or paclitaxel (0–7.5 nM) at various concentrations. The media containing the treatments were replaced every day for 4 days. At the end of the treatments the cells were fixed in 4% paraformaldehyde (Electron Microscopy Sciences) diluted in PBS for 30 minutes. After removing the fixative solution the plates were washed with PBS and stained with 0.1% Crystal Violet solution for 15 minutes. The staining solution was removed and the plates were washed 3 times under running water, to remove the excess stain, and allowed to dry at room temperature. To quantify the biomass, crystal violet staining was eluted with 100% methanol and the absorbance at 590 nm was measured using an Envision plate reader (Perkin Elmer).
Transwell Migration and Invasion Assays
MCF-10A cells were trypsinized and collected as previously described39. Resuspension media were aspirated, and cells were resuspended in assay medium (DMEM/F12 (Corning), 0.5% Horse Serum (Gibco), 500 ng/ml hydrocortisone (Sigma), 100 ng/ml cholera toxin (Sigma)). For migration assays, Boyden chamber inserts (BD Biosciences, 8 μm pore size) were pre-coated with 25 μg/μl rat tail collagen 1 (Corning). Assay medium supplemented with 5 ng/ml EGF (Peprotech) was added to the bottom chamber of the cell culture inserts. Cells (5 × 10⁴ cells/ 250 μl assay media) were then added to the top chamber of cell culture inserts in a 24-well companion plate. After 6 hours of incubation, the cells that had migrated to the lower surface of the membrane were fixed with ethanol and stained with 0.2% crystal violet in 2% ethanol. For cell invasion assays, BD BioCoat invasion chambers coated with growth factor reduced Matrigel were used. Invasion chambers were prepared according to manufacturer’s specifications and assays were performed as described for migration assays except that 20 ng/ml of EGF (Peprotech) was added to MCF-10A assay media to serve as the chemo-attractant and cells were allowed to invade for 24 hours.
For MDA-MB-231 and A549, transwell migration and invasion assays were performed as described above with minor changes. For MDA-MB-231 cells, high-glucose DMEM (Gibco) supplemented with 250 μg/mL BSA (Sigma-Aldrich) was used as the assay medium, and high glucose DMEM media supplemented with 10% FBS (Sigma-Aldrich) was used as the chemoattractant for both migration (6 hours) and invasion assays (20 hours). For A549 cells, RPMI (Corning) supplemented with 250 μg/mL BSA (Sigma-Aldrich) was used as the assay medium, and RPMI media supplemented with 10% FBS (Sigma-Aldrich) was used as the chemoattractant for the 24-hour migration assay. Images of crystal violet stained cells were captured using a Nikon DS-Fi2 camera, and quantifications were carried out in an automated way using Fiji/ImageJ v1.52. Briefly, binary images of the area covered by crystal violet-positive cells was generated using thresholding and settings that were appropriate for control samples, and these settings were used throughout the analysis. The percentage area covered by crystal violet-positive cells was quantified for each condition, using a minimum of three technical replicates.
Analysis of CD24 and CD44
Cells were dissociated using Cell Stripper (Corning), collected on ice and pelleted by centrifugation. After removing the Cell Stripper and washing the cell pellet with ice cold PBS, the cells were stained on ice for 30 minutes in 100 μL DMEM/F12 (without phenol red) with an APC mouse anti-human CD44 (559942, BD Biosciences) and FITC mouse anti-human CD24 (555427, BD Biosciences), or an APC mouse IgG2b (555745, BD Biosciences) and FITC mouse IgG2a (553456, BD Biosciences) as isotype controls. The antibodies were used at the dilution recommended by the manufacturer, i.e., 20 μl for 1 × 10^6 cells in a 100- μl test volume. After labeling, each sample was washed twice with ice cold PBS and resolved on a BD Accuri C6 flow cytometer (BD Biosciences). Data was collected using the BD Accuri C6 flow cytometer software, and then data analysis to determine the medium fluorescence intensity (MFI) of CD24 and CD44 positive cells was performed using the FlowJo v10 software package. A representation of the gating strategy performed prior to MFI analysis can be seen in Supplementary Fig. 1.
Immunoblots for total cell lysates
Proteins were isolated directly from intact cells via acid extraction using a 10% TCA solution (10% trichloroacetic acid, 25 mM NH4OAc, 1 mM EDTA, 10 mM Tris⋅HCl pH 8.0). Precipitated proteins were harvested and solubilized in a 0.1 M Tris⋅HCl pH 11 solution containing 3% SDS and boiled for 10–15 minutes. Protein content was determined with the DC Protein Assay kit II (BioRad), and 20 μg total protein from each sample were run on SDS-PAGE under reducing conditions. The separated proteins were electrophoretically transferred to a nitrocellulose membrane (GE Healthcare), which was blocked in TBS-based Odyssey Blocking buffer (LI-COR). Proteins of interest were probed with specific antibodies (listed as “target protein (catalog # - vendor, dilution factor): E-Cadherin (610181 - BD Biosciences, 1:1,000), ZO1 (5406S - Cell Signaling, 1:250), Fibronectin (ab2413 - Abcam, 1:10,000), Vimentin (5741S - Cell Signaling, 1:5,000), Serpine1 (612024 - BD Biosciences, 1:1,000), CTGF (ab6992 - Abcam, 1:250), MMP2 (4022S - Cell Signaling, 1:500), SOX4 (ab80261 - Abcam, 1:100), SMAD3 (9523S - Cell Signaling, 1:500), ppSMAD3 S423/S425 (ab52903 - Abcam, 1:1,000), Actin (sc1615 - Santa Cruz, 1:10,000). Membranes were incubated with the primary antibodies overnight at 4°C, and then with the appropriate horseradish peroxidase–conjugated (HRP) anti-rabbit (NA934 - GE Healthcare, 1:10,000), anti-mouse (NA931 - GE Healthcare, 1:10,000) or anti-goat (AP180P - Millipore, 1:10,000) immunoglobulin for 2 hours at room temperature. The signals were developed using Amersham ECL detection system (GE Healthcare).
Analysis of Histone Post-Translational Modifications
A549 and MCF-10A cells were trypsinized and normalized for cell numbers. Cell pellets were washed twice with ice-cold PBS+ (PBS containing containing 5 mM sodium butyrate, 2 mM nicotinamide, 2 mM phenylmethylsulfonyl fluoride (PMSF), 10 mM Aprotinin, 10 mM Leupetin, 10 mM Pepstain A, 10 mM NaF, 10 mM NaVO4, 0.02% (w/v) NaN3) and then resuspended in Triton Extraction Buffer (TEB: PBS+ containing 0.5% Triton X 100 (v/v)) at a cell density of 107 cells per ml. Cell lysis was achieved on a rotator at 4°C for 10 min. Nuclei were centrifuged at 6,500 x g for 10 min at 4°C, and washed once with half the volume of TEB. Histones were extracted in 0.2 N HCl at a density of 4×10⁷ nuclei per ml overnight at 4°C. To remove debris samples were centrifuged at 6,500 x g for 10 min at 4°C. The histone proteins present in the supernatant were collected and neutralized with 2 M NaOH at 1/10 of the volume of the supernatant. 8 μg of each sample was resolved on a 15% polyacrylamide gel and immunoblots were performed as described above. The following primary antibodies were utilized (listed as “target protein (catalog # - vendor, dilution factor): H3K4me3 (61379 - Active Motif, 1:500), H3K27me3 (39155 - Active Motif, 1:500), H3K27ac (39133 - Active Motif, 1:500), H4K8ac (ab15823 - Abcam, 1:500), H3K56ac (39281 - Active Motif, 1:500), H3K9ac (ab4441 - Abcam, 1:500), H3K9me3 (ab8898 - Abcam, 1:1,000), H3K36me3 (ab9050 - Abcam, 1:500), Total H4 (ab10158 - Abcam, 1:1,000), Total H3 (4499s - Cell Signaling, 1:1,000).
Gene Expression Analysis
RNA was isolated using the PureLink RNA isolation kit (Life Technologies) and contaminant DNA was digested with DNAse I (Amplification grade, Sigma-Aldrich). cDNA was synthesized using the iSCRIPT cDNA synthesis kit (BioRad) and analyzed by quantitative PCR (qPCR) using SYBR green master mix (Life Technologies) on a QuantStudio6 Real-Time PCR system with QuantStudio Real Time PCR software v1.3 (Life Technologies). Exported data was further processed in Microsoft Excel 2013. Target gene expression was normalized to Tata Binding Protein (TBP) and actin (ACTB) expression. Primer sequences can be found in Supplementary Table 3.
Global Gene Expression Analysis (RNA-sequencing)
RNA from A549 cells treated with 5 mM MMA for 3 or 10 days was isolated as described above. Total RNA was sent to Active Motif for further processing and RNA-seq analysis. Briefly, RNA quality was assessed by BioAnalyzer, and only RNAs with RIN values between 8.7 and 10.0 were used. RNA-sequencing libraries were prepared using the Illumina TruSeq RNA Sample Preparation v2 Guide (Illumina Part # 15026495). Polyadenylated RNA was enriched from 1 μg total RNA. Libraries were sequenced on Illumina NextSeq 500 as paired-end 42-nt reads, to a depth of 40.2 – 54.7 M read pairs. The TopHat algorithm v2.1.0 (Bowtie v2.2.6.0) was used to align the reads to the hg38 genome which was obtained through iGenomes (https:/support.illumina.com/sequencing/sequencing_software/igenome.html). The alignments (37.5–51.4 M aligned pairs) in the BAM files were further analyzed using the Cufflinks suite of programs v2.2.1 (running consecutively: Cufflinks v2.2.1.Linux_x86_64, Cuffcompare v2.2.1, Cuffdiff v2.2.2). Cufflinks was run using the hg38-genes as a reference database. The cufflinks outputs were compared using cuffdiff. The accession number for the raw sequencing data reported in this paper is GEO: GSE127001 and can be accessed on https://www.ncbi.nlm.nih.gov/geo/. A volcano plot visualizing the genes that were significantly changed ≥1.5 fold was created using EnhancedVolcano v1.0.140. The top 100 significantly changed genes were log-tranformed and clustered using HierarchicalClustering on GenePattern v3.041 using Euclidean distance and pairwise centroid-linkage, and was row centered. Functional annotation analysis on genes that were significantly changed ࣙ1.5 fold was performed using DAVID: Database for Annotation, Visualization, and Integrated Discovery v6.842. Gene sets based on annotations from the Gene Ontology database (http://www.geneontology.org) were used. Only gene sets with 10 genes or more, and EASE Score, a modified Fisher Exact p-values, of 0.05 or less were evaluated.
mRNA Overlap Analysis
The overlap of significantly altered mRNAs between A549 cells treated with MMA for 10 days (≥1.5 fold change) and the significantly altered genes induced by SOX4 induction (≥2 fold change)28 was evaluated using the GeneOverlap algorithm v.1.18.043. Functional annotation analysis on the set of overlapping genes was performed using DAVID: Database for Annotation, Visualization, and Integrated Discovery42. Gene sets based on annotations from the Gene Ontology database (http://www.geneontology.org) were used. Gene sets with an EASE Score, a modified Fisher Exact p-values, of 0.05 or less were evaluated.
Lung Colonization Assay in Mice
MDA-MB-231-lucifease cells were treated with human serum from young and old donors as described above prior to tail vein injection for lung colonization evaluation. 11 young and 11 old human serum from the first batch, not including outliers, was utilized. Each data point for each sera sample represents an average of the data collected from 3 mice used as technical replicates. To test the effect of MMA in lung colonization, luciferase-expressing MDA-MB-231 cells were treated with 1 or 5 mM MMA for 5 days. Similarly, SOX4 silenced MDA-MB-231-luciferase cells were also treated with 5 mM MMA for 5 days or with human serum from old donors (6 young and 6 old human serum from the first batch, not including outliers, was utilized; each data point for each serum sample represents an average of the data collected from 3 mice used as technical replicates), after which they were injected into the tail vein and lung colonization was evaluated as described before32,44. Briefly, female nu/nu athymic mice were injected with 100,000 cells in 100 μL PBS through tail vein injections. Metastases were monitored using IVIS Spectrum CT Pre-Clinical In Vivo Imaging System (Perkin-Elmer). 7–10 mice were used in each experimental group. After 6 weeks, luminescence was measured and quantified using the Living Image Software v.4.5 (Perkin-Elmer) to determine lung colonization. All animal studies followed the guidelines of and were approved by the Weill Cornell Medicine Institutional Animal Care and Use Committee.
Orthotopic Xenograft Experiments in Mice
To achieve increased circulatory MMA concentrations female nu/nu athymic mice were treated as described before45 with a dose escalation of a “low” (100 μg MMA/g mouse followed by 200 μg MMA/g mouse) or “high” MMA (200 μg MMA/g mouse followed by 400 μg MMA/g mouse) either by subcutaneous injections or through the drinking water. MMA treatments through either method did not cause behavioral changes or changes in drinking and feeding habits, nor did they cause changes in body weight throughout the duration of the experiments. Briefly, mice were treated for 16 days with the lower dose of MMA for both concentration groups after which the dose was doubled until the end of the experiment. For subcutaneous injections MMA (Sigma) was dissolved in 0.9% NaCl, adjusted to pH 7.4 with 6 M NaOH, and injections were performed daily during the time of the experiment. For delivery of MMA in the drinking water, MMA (Sigma) was dissolved in acidified water (as is standard IACUC procedure for mice husbandry) and it was replaced with a fresh solution every 3.5 days. Tumors were established in the mice after the first 8 days of MMA treatment by injection of 2 × 10^6 MDA-MB-231-luciferase cells in 100 μl 50:50 PSB and Matrigel (Corning) into the third mammary fat pad on the right side of each mouse. Primary tumors and metastases were monitored using IVIS Spectrum CT Pre-Clinical In Vivo Imaging System (Perkin-Elmer), luminescence was measured and quantified using the Living Image Software v.4.5 (Perkin-Elmer). To visualize the metastatic spread the primary tumors were covered and the upper body was imaged. The experiment continued until mice showed signs of significant illness or the primary tumors reached 10% of their weight at which point they were euthanized as specified by IACUC. At the time of euthanasia blood was collected to measure the serum MMA levels and primary tumor tissue was harvested. Time of natural death or euthanasia was used to create the Kaplan-Meier curves. All animal studies followed the guidelines of and were approved by the Weill Cornell Medicine Institutional Animal Care and Use Committee. Frozen tumor tissue was powderized with a mortar and pestle over liquid nitrogen. RNA was isolated from the powdered tissue and the qPCR was performed as described in the “gene expression analysis” section. For protein isolation powderized tissue was lysed with RIPA buffer for 30 minutes on ice and homogenized through a 22-gauge needle before centrifuged at full speed for 10 minutes. The proteins present in the lysate supernatants were then quantified and processed as described under “immunoblots for total cell lysates”.
Measurement of MMA absolute concentration
For intracellular measurements of MMA concentrations, metabolites were extracted and processed as described in the targeted metabolomics section. For mouse sera, metabolite extraction was performed in a mixture of ice/dry ice as previously described46,47. Briefly, 10 μL of plasma were extracted with 800 μL of 62.5% methanol containing 0.6 μg/ml of glutaric acid, followed by an addition of 500 μL of precooled chloroform. Samples were vortexed for 10 min at 4 °C and then centrifuged for other 10 min (max. speed, 4°C). After centrifugation, metabolites were separated in two phases divided by a protein layer: polar metabolites in the methanol/water (upper) phase and the lipid fraction in the chloroform (lower) phase. The samples were derivatized and measured as described before48. Briefly, polar metabolites were derivatized for 90 min at 37°C in 15 μL of 20 mg/ml methoxyamine in pyridine per sample. Subsequently, 15 μL of N-(tert-butyldimethylsilyl)-N-methyl-trifluoroacetamide, with 1% tert-butyldimethylchlorosilane were added to 7.5 μL of each derivative and incubated for 60 min at 60 °C. Polar metabolite fractions containing methylmalonic acid were dried at 4°C in a vacuum concentrator. Methylmalonic acid concentrations were analyzed by gas chromatography (7890A GC system) coupled to mass spectrometry (5975C Inert MS system) from Agilent Technologies. Metabolites were separated with a DB35MS column (30 m, 0.25mm, 0.25 μm) using a carrier gas flow of helium fixed at 1 ml/min. A volume of 1 μL of sample was injected with a split ratio 1 to 3 with an inlet temperature set at 270°C. For the detection of polar metabolites, the gradient was set at 100°C for 1 min ramped to 105°C at 2.5°C/min, then to 240°C at 3.5°C/min and finally to 320°C at 22°C/min. For the measurement of metabolites by mass spectrometry, the temperatures of the quadrupole and the source were set at 150°C and 230°C, respectively. An electron impact ionization energy fixed at 70 eV was applied and scan mode was used for the measurement of polar metabolites ranging from 100 to 600 a.m.u (mass). After the acquisition by GC-MS, an in house Matlab (vR2016B) M-file was used to extract mass distribution vectors and integrated raw ion chromatograms. The natural isotopes distribution were also corrected using the method developed by Fernandez et al, 199649. Peak areas were normalized to those of the internal standard glutaric acid.
Statistical Analysis
Data analyses were performed using Microsoft Excel 2013 and GraphPad Prism7. A two-tailed Student’s t test, a two-way ANOVA and a Mantel-Cox were used to determine significance. In all types of statistical analysis values of p < 0.05 were considered significant. Data are represented as the mean ± SEM (standard error of the mean) of individual data points of at least three independent samples. Number of independent samples and statistical method used in each experiment are reported in the figure legends. For all experiments similar variances between groups were observed. Normal distribution of samples was not determined. In the DAVID functional annotation analyses for the RNA-seq experiments EASE Score, a modified Fisher Exact p-values, were used to determine significance as recommended.
Data Availability
Information about the human serum donors and the data from the metabolomics experiment can be found in Supplementary Table 1. RNA-seq data that support the findings of this study have been deposited in the Gene Expression Omnibus (GEO) (under the accession code GSE127001 on https://www.ncbi.nlm.nih.gov/geo/, as well as presented in Supplementary Table 2. All raw data files, peak lists, and the sequence database for the proteomics analysis have been deposited in the MASSive repository (https://massive.ucsd.edu, ID#: MSV000084974). Source data and scans for the western blots for all experiments are provided. Other data supporting the findings of this study are available from the corresponding authors upon reasonable request.
Code Availability
The quantification of invasion/migration assay images were carried out in an automated way on Fiji/ImageJ v1.52 using a custom macro script. This macro is a basic automation script and cannot be used as a standalone code, but it is available from the corresponding authors upon reasonable requests.
Supplementary Material
Extended Data
Extended Data Fig. 1. Serum of old donors induces a mesenchymal-like phenotype in non-small cell lung cancer cells.
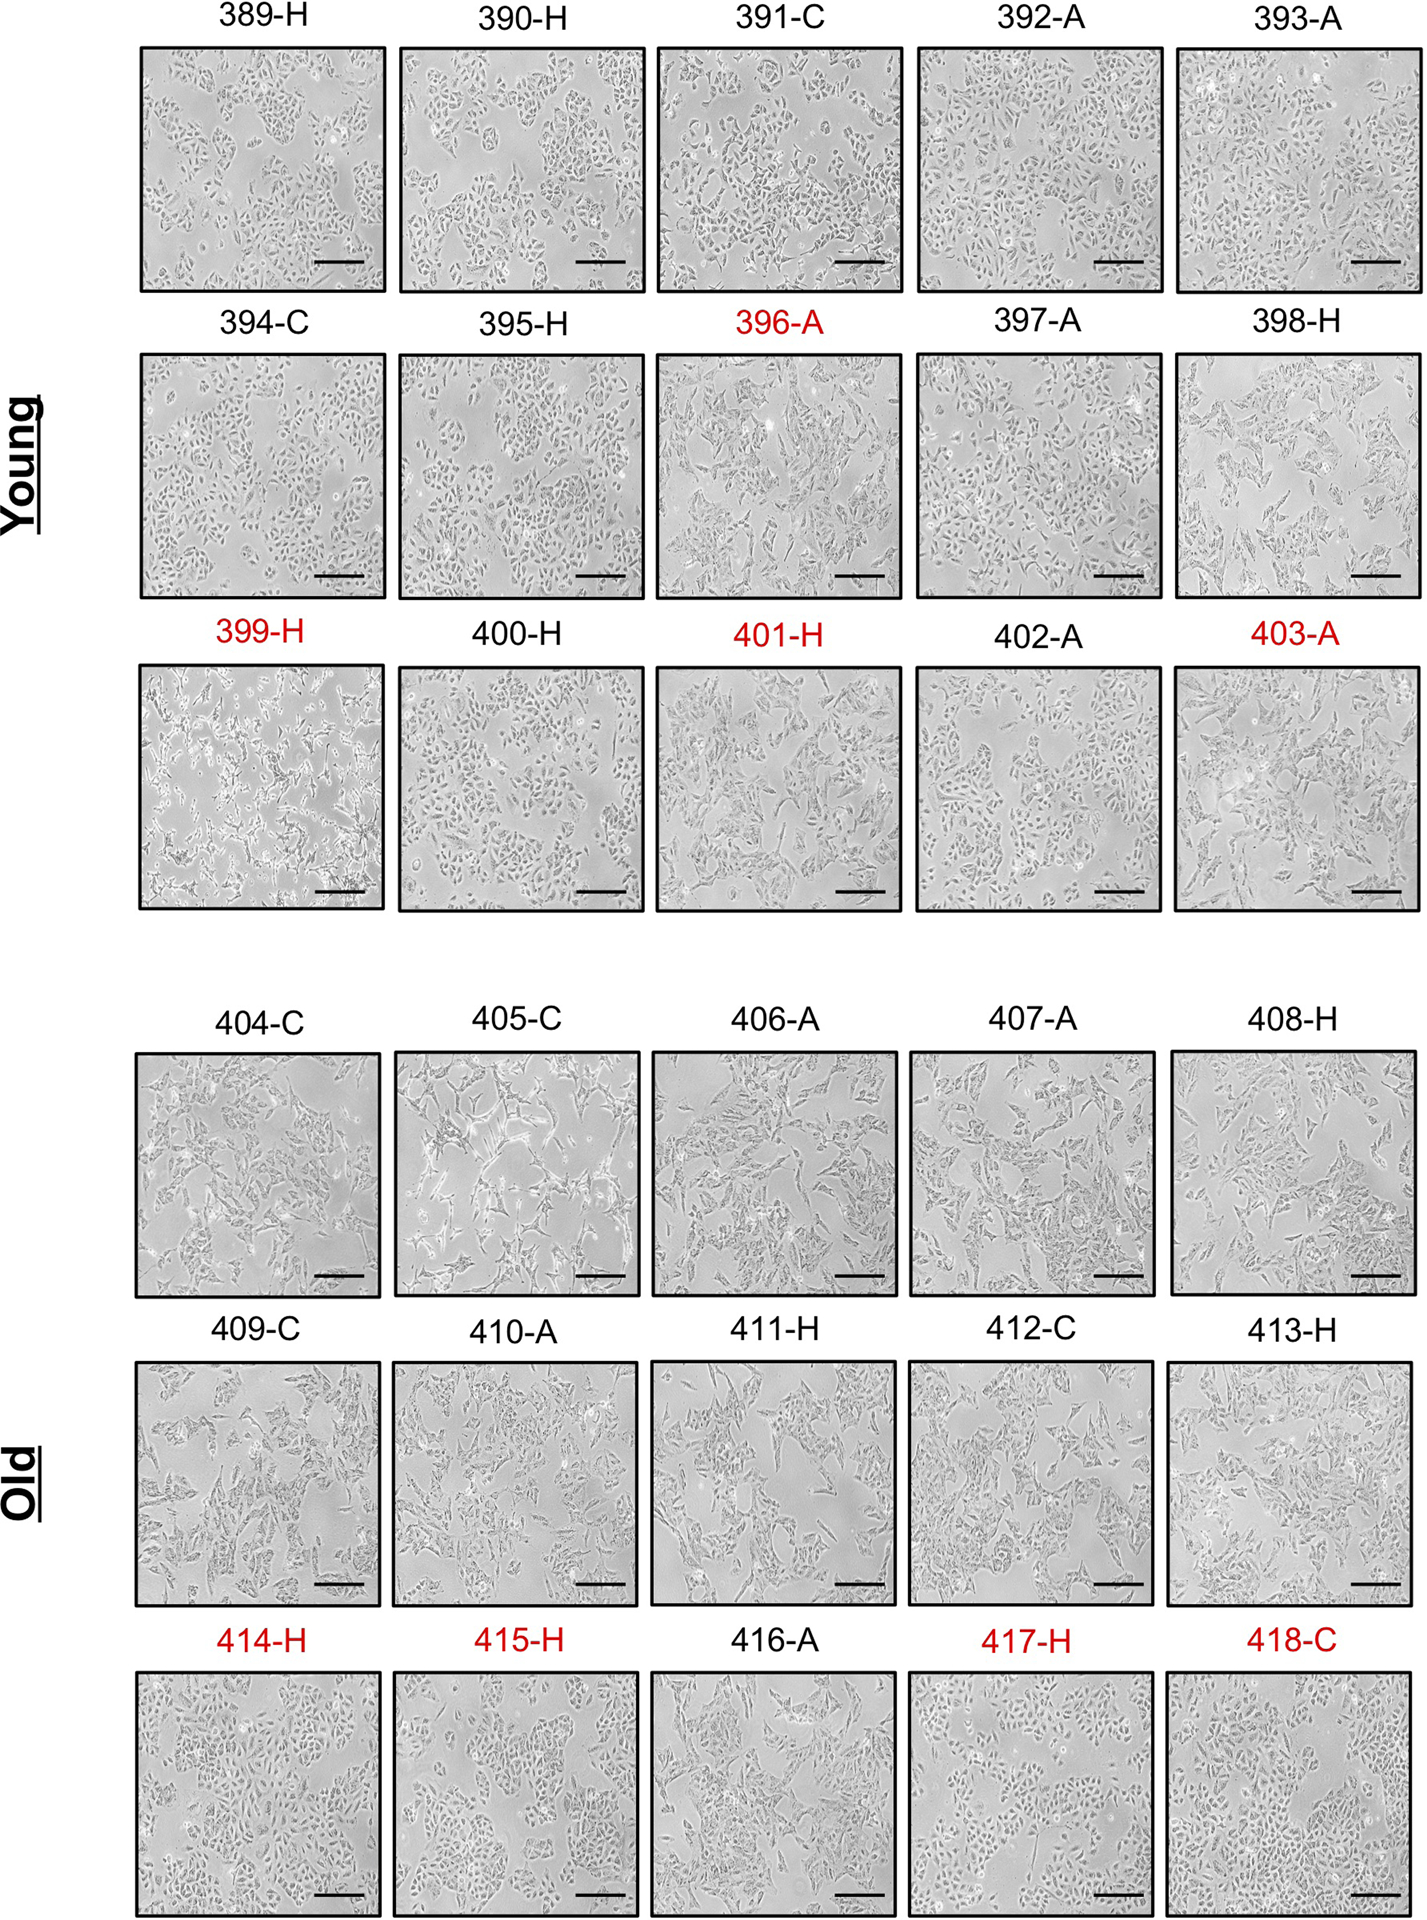
Morphology of A549 cells cultured for 4 days with HS (n=15 biologically independent samples per HS donor group, first batch of donors). Scale bar = 100 μm; red label indicates outlier donors.
Extended Data Fig. 2. Serum of old donors induces an epithelial-to-mesenchymal transition phenotype in non-small cell lung cancer cells.
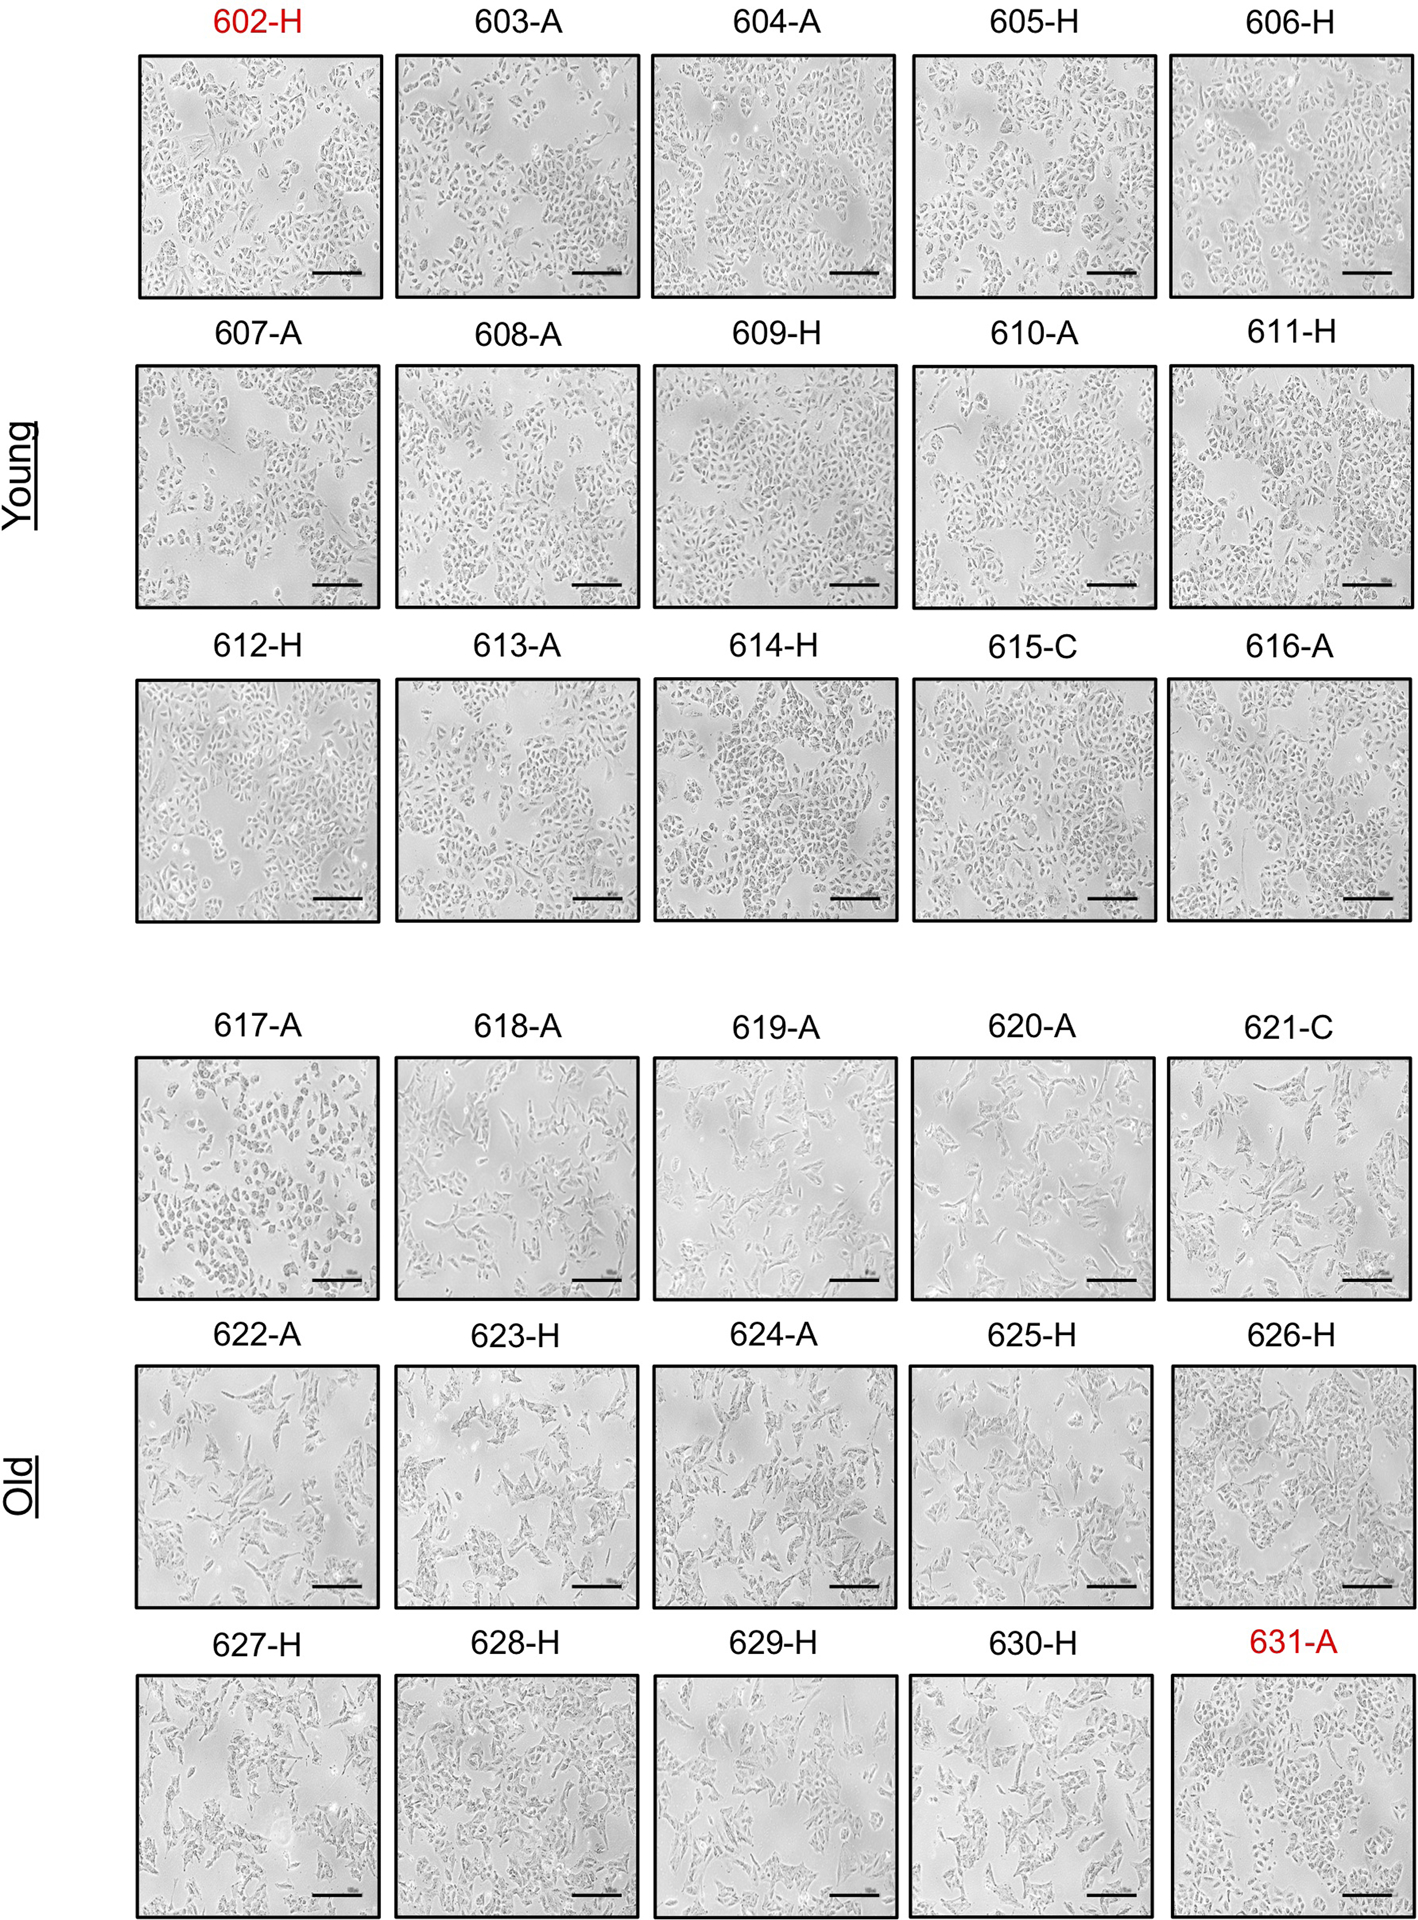
Morphology of A549 cells cultured for 4 days with HS (n=15 biologically independent samples per HS donor group, second batch of donors). Scale bar = 100 μm; red label indicates outlier donors.
Extended Data Fig. 3. Serum of old donors induces a mesenchymal-like phenotype in triple negative breast cancer cells.
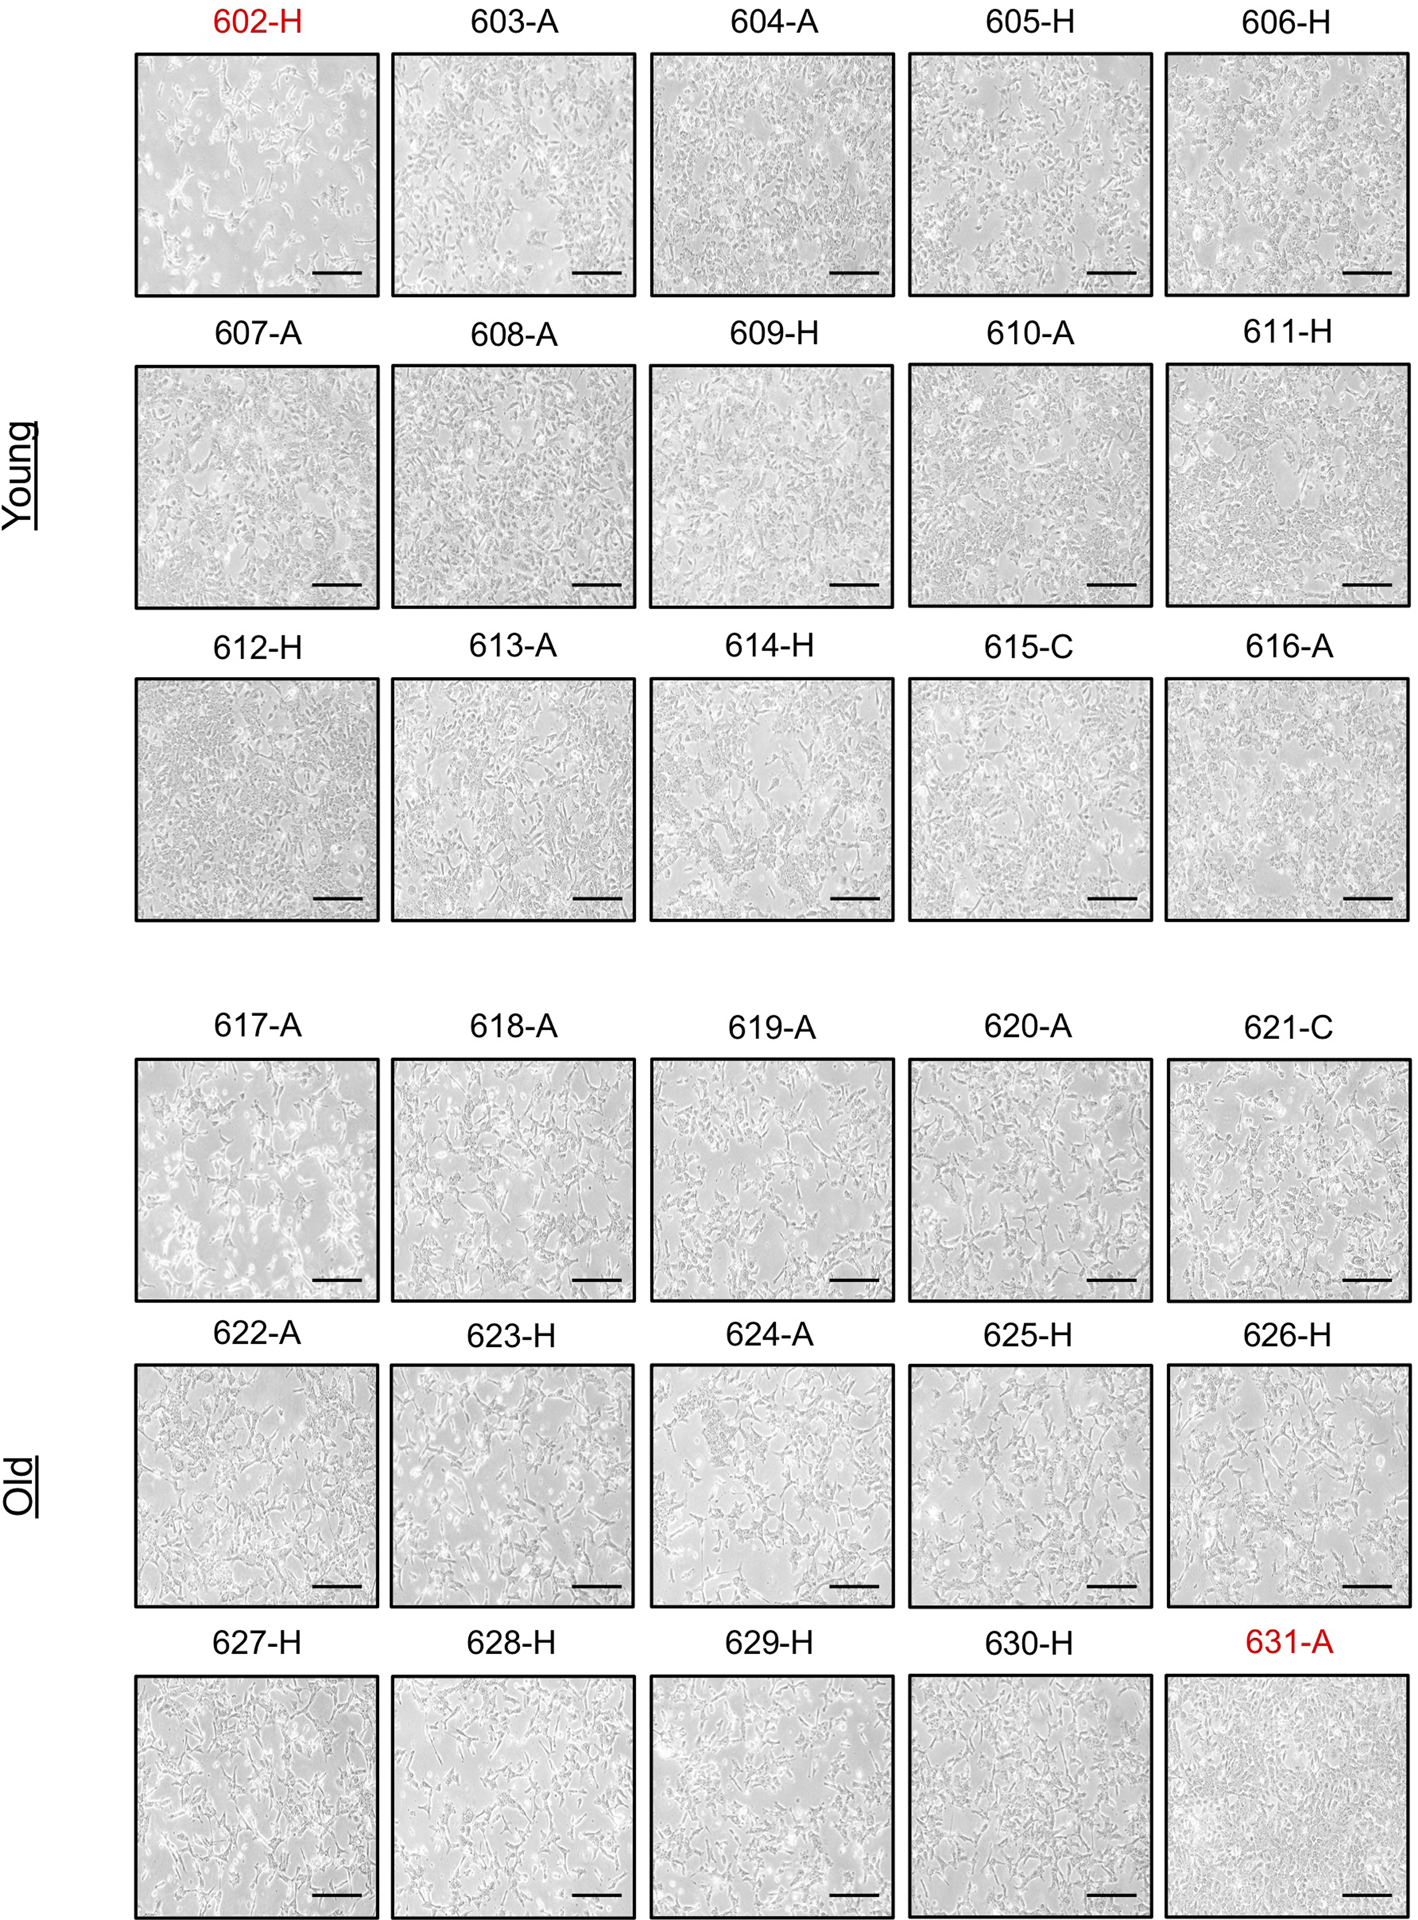
Morphology of HCC1806 cells cultured for 4 days with HS (n=15 biologically independent samples per HS donor group, second batch of donors). Scale bar = 100 μm; red label indicates outlier donors.
Extended Data Fig. 4. Serum of old donors induces aggressive properties in cancer cells and displays a distinct metabolic profile.
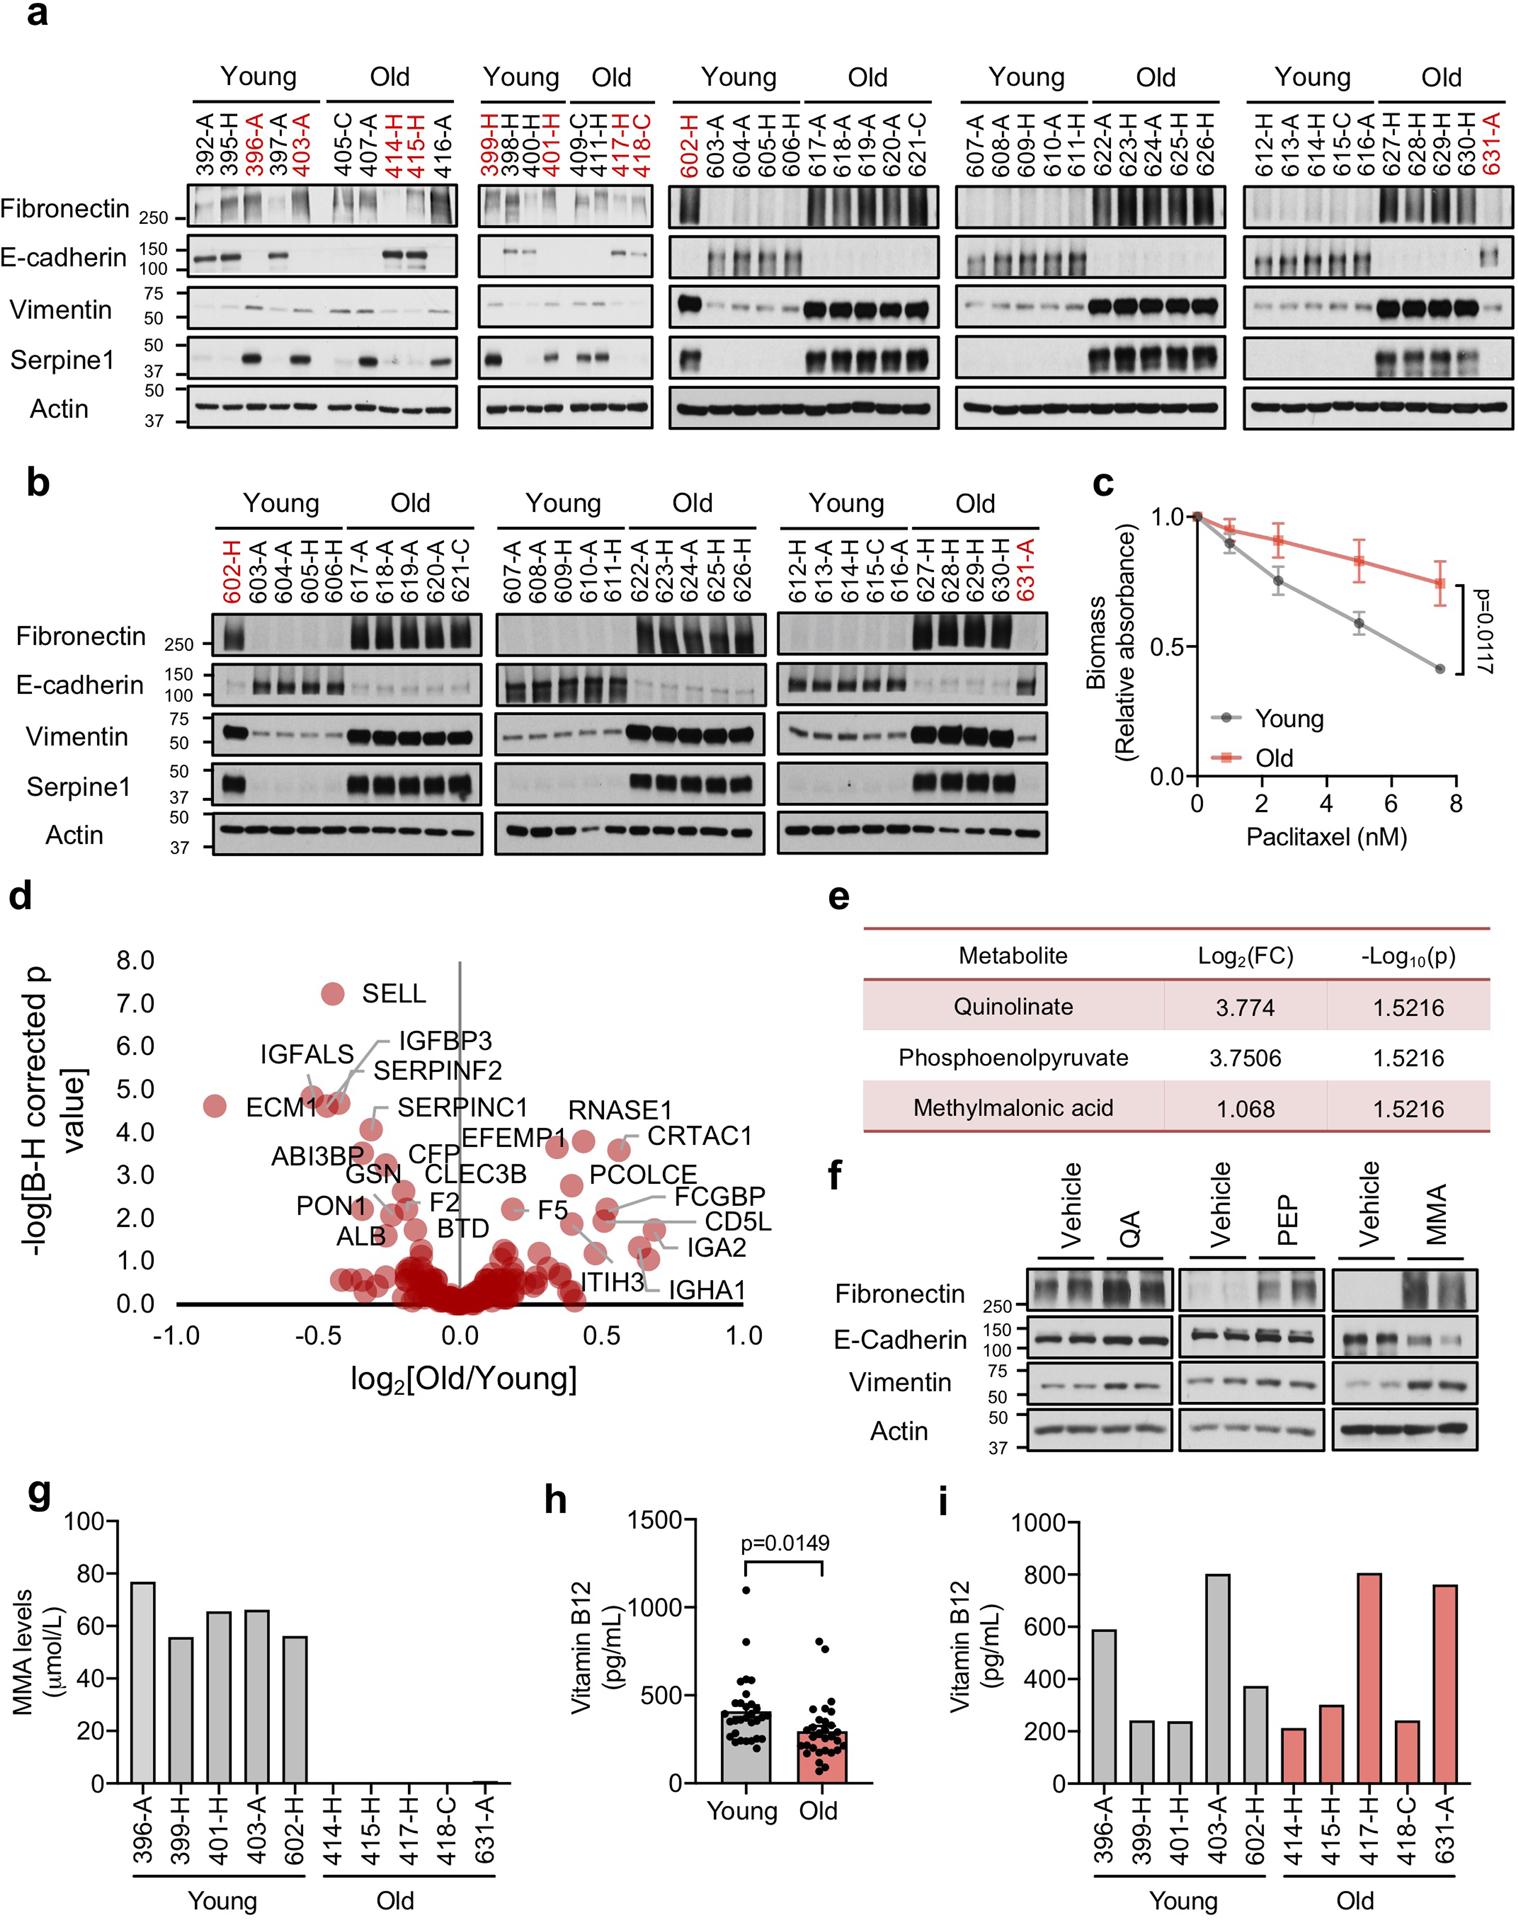
a, b, Immunoblots of A549 (total of n=30 biologically independent samples per HS donor group, see Fig. 1b) (a) and HCC1806 (n=15 biologically independent samples per HS donor group) (b) cells cultured for 4 days with HS c, Resistance to paclitaxel in A549 cells cultured for 4 days with HS (n=15 biologically independent samples per HS donor group, two-way ANOVA). d, Volcano plot summarizing the proteomics analysis of all 60 human serum samples used in this study. e, List of all metabolites that are increased at a statistically significant level in the sera of old donors (n=11 biologically independent HS donors, two-sided t-test). f, Immunoblots of A549 cells treated with 5 mM of each metabolite for 10 days; representative images (n=4 independent experiments; QA: quinolinate, PEP: phosphoenolpyruvate, MMA: methylmalonic acid) g, Concentrations of MMA in 10 outlier human sera (serum from 5 young and 5 old donors, each bar represents the concentration of a single donor) h, i, Concentrations of vitamin B12 in all HS samples (n=30 biologically independent samples per HS donor group, two sided t-test) (h) and 10 outlier human sera (serum from 5 young and 5 old donors, each bar represents the concentration of a single donor) (i). For (c, h) data are presented as mean ± SEM. For gel source data, see Supplementary Fig. 2.
Extended Data Fig. 5. Methylmalonic acid promotes epithelial-to-mesenchymal transition and metastatic-like properties.
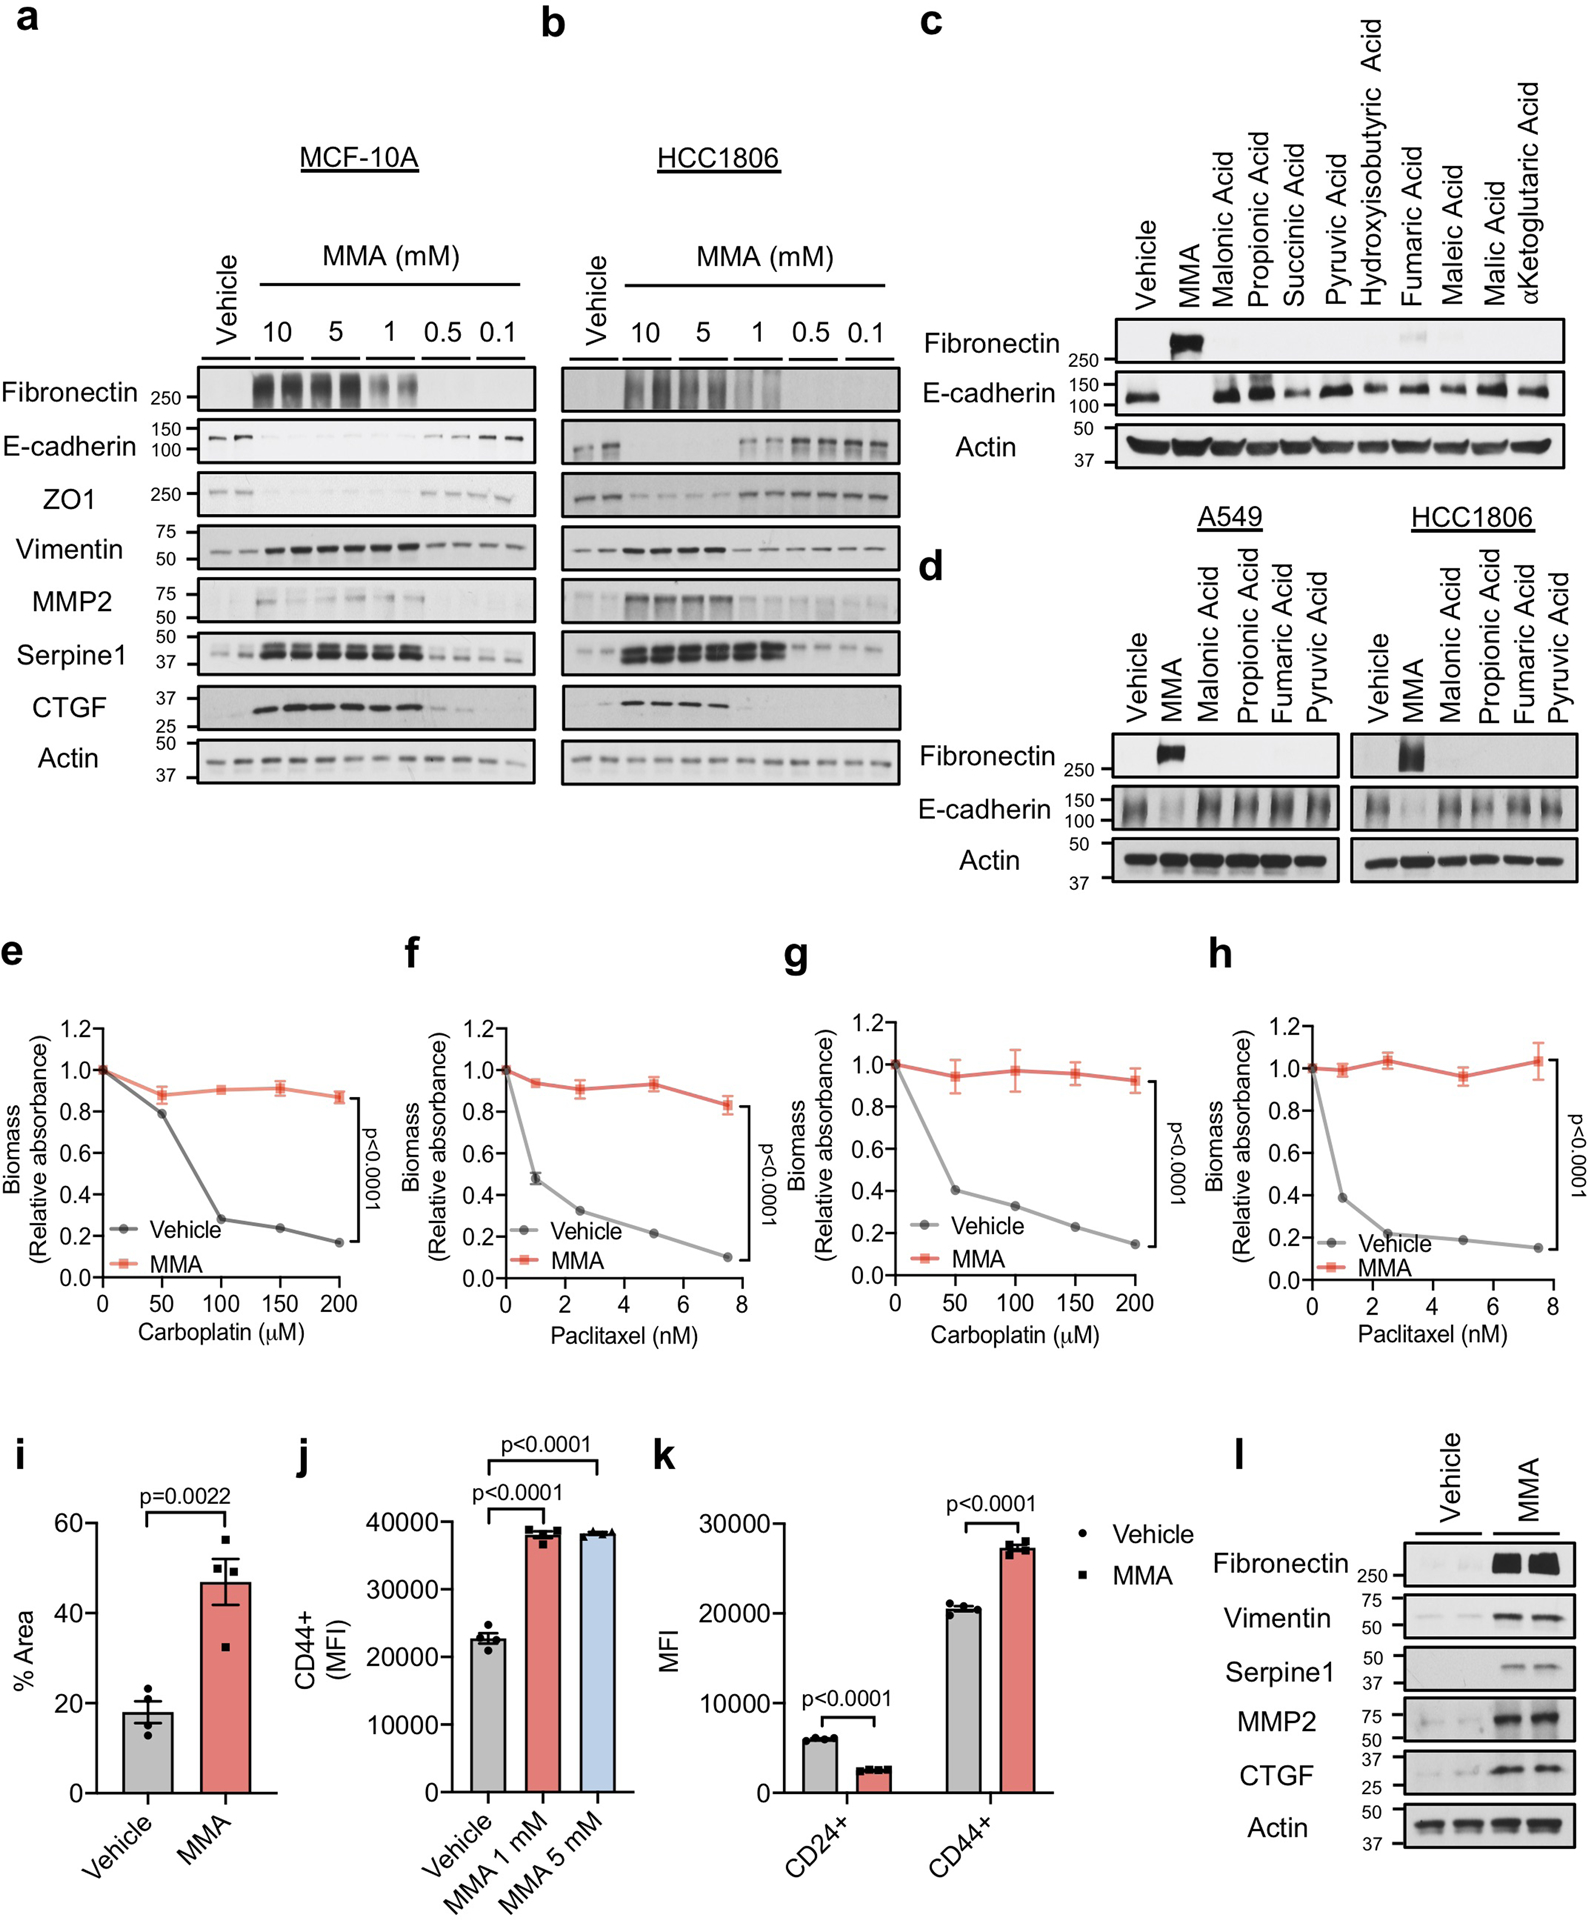
a, b, Immunoblots of MCF-10A (a) and HCC1806 (b) cells treated with MMA for 10 days (n=4 independent experiments). c, d, Immunoblots of MCF-10A (c), A549 and HCC1806 (d) cells treated with 5 mM of the indicated acids for 10 days (n=4 independent experiments). e-h, Resistance to carboplatin and paclitaxel in A549 (e, f) and HCC1806 (g, h) cells treated with 5 mM MMA for 10 days (n=4 independent experiments, two-way ANOVA). i. Transwell migration assay of A549 cells treated with 5 mM MMA for 10 days (n=4 independent experiments, two-sided t test). j, k, Stemness evaluated by the increase in the CD44 marker in MCF-10A cells treated with MMA for 10 days (j) and by the increase in the CD44 marker and the decrease in CD24 marker in A549 cells treated with 5 mM MMA for 10 days (k) (n=4 independent experiments, two-sided t test). l, Immunoblots of MDA-MB-231-luciferase cells treated with 5 mM MMA for 5 days (n=4 independent experiments). For (e-k) data are presented as mean ± SEM; (a-d, l) are representative images. For gel source data, see Supplementary Fig. 2.
Extended Data Fig. 6. Methylmalonic acid delivery is regulated by lipidic structures (LSs) in the sera of old donors.
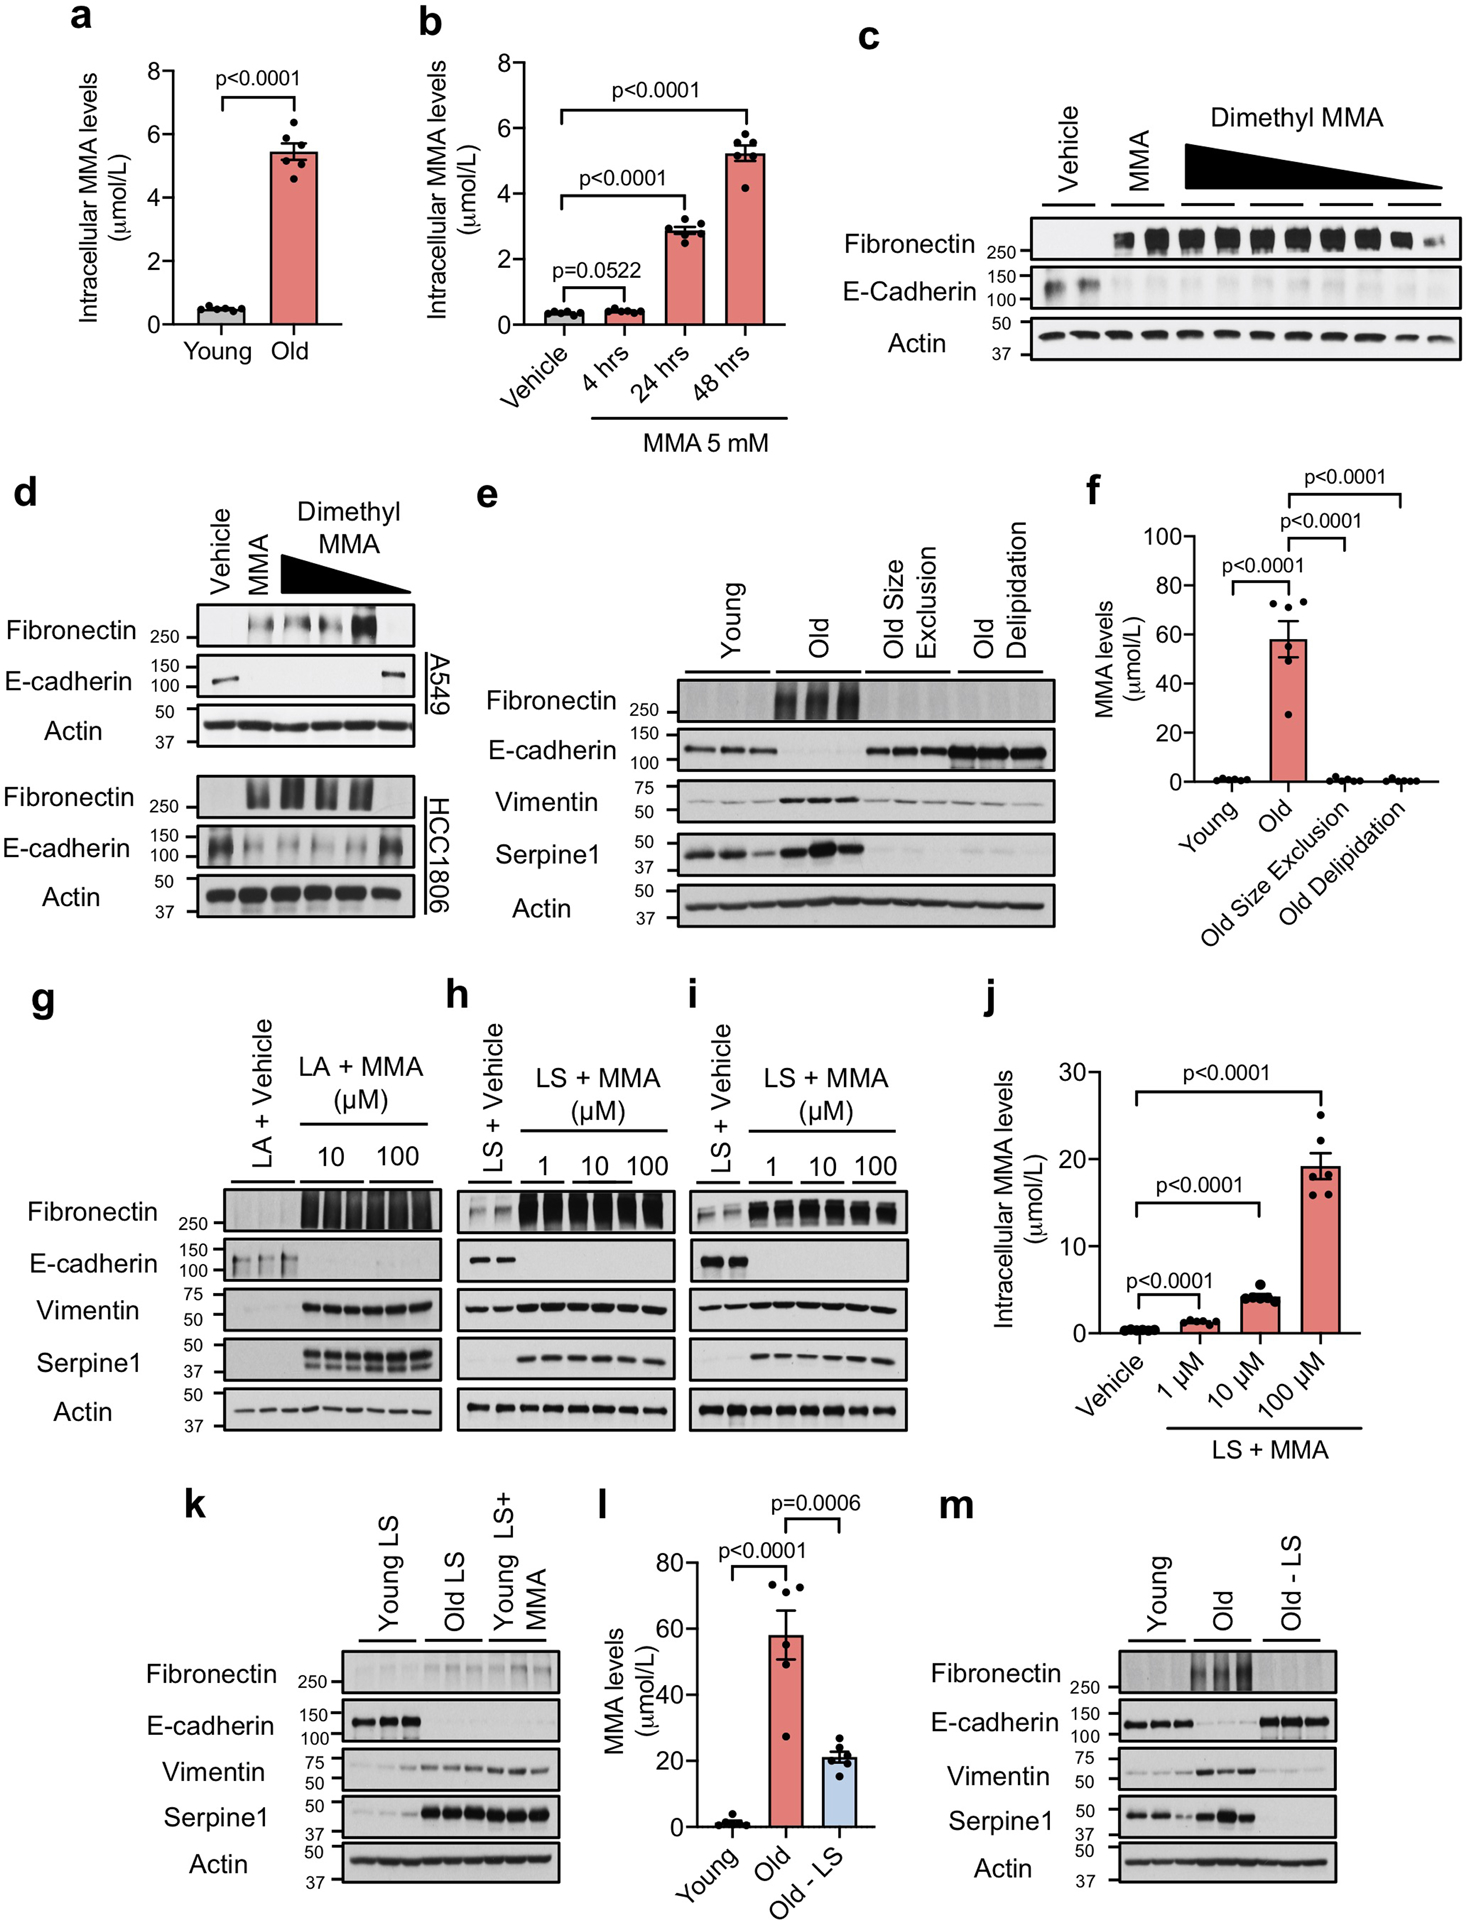
a, b, Intracellular MMA concentrations in A549 cells cultured with HS for 4 hr (n=6 biologically independent samples per HS donor group, two-sided t test) (a) and with 5 mM MMA for indicated time periods (n=6 independent experiments, two-sided t test) (b). c, d, Immunoblots of MCF-10A (c), A549 and HCC1806 (d) cells treated with various concentrations (5–0.001 mM) of dimethyl methylmalonic acid for 10 days (n=4 independent experiments). e, Immunoblots of A549 cells cultured for 4 days with young and old untreated HS, or old HS that was passed through size exclusion columns or delipidated (n=6 biologically independent samples per HS donor group). f, MMA concentrations in the human serum used in (e) (n=6 biologically independent samples per HS donor group, two-sided t test). g-i, Immunoblots of A549 cells treated with complexes of lipofectamine (LA) with indicated amounts of MMA (n=3 independent experiments) (g) and with LSs isolated from FBS that were complexed with indicated amounts of MMA (n=4 independent experiments) (h), or of MCF10A treated with LSs isolated from FBS that were complexed with indicated amounts of MMA (n=4 independent experiments) (i). j, Intracellular MMA concentrations in A549 cells cultured with MMA-loaded FBS lipidic structures (LSs) for 4 hr (n=6 independent experiments, two-sided t test). k, Immunoblots of A549 cells treated with LSs isolated from young/old HS, and MMA-loaded LSs isolated from young HS (10 μM MMA) (n=6 biologically independent samples per HS donor group). l, MMA concentrations in serum from old donors after depletion of LSs compared to control HS (n=6 biologically independent samples per HS donor group, two-sided t test). m, Immunoblots of A549 cells treated for 4 days with HS from old donors after depletion of LSs or from control donors (n=6 biologically independent samples per HS donor group). For (a, b, f, j, l) data are presented as mean ± SEM; (c, d, e, h, i, k, m) are representative images. For gel source data, see Supplementary Fig. 2.
Extended Data Fig. 7. Methylmalonic acid induces tumor progression through regulation of pro-aggressive and poor prognosis genes.
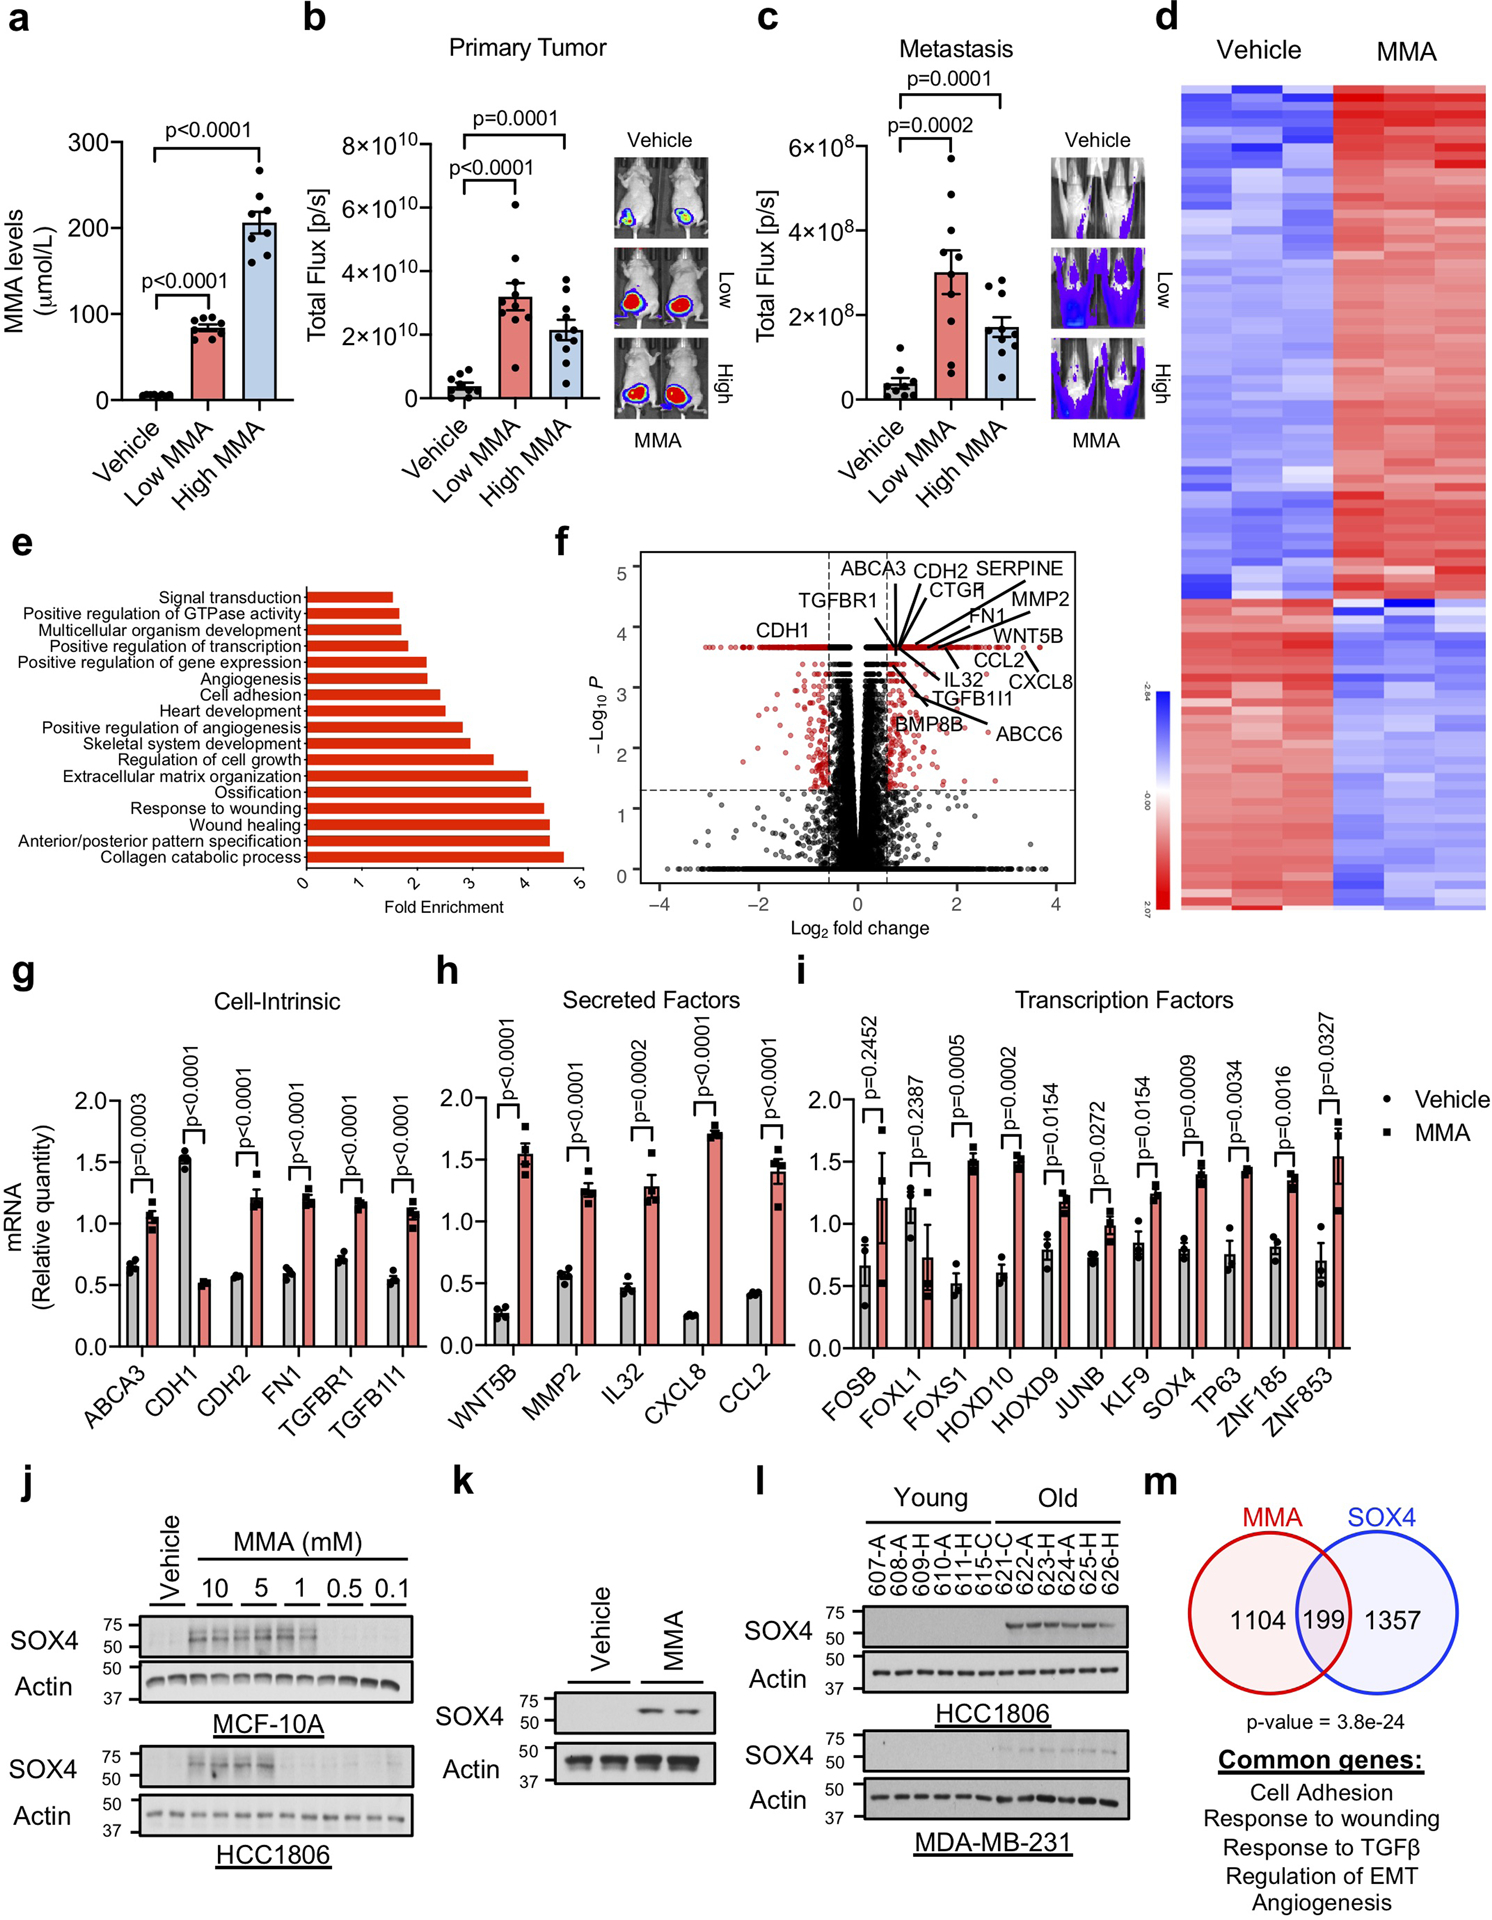
a-c, End-point serum MMA concentrations (n=8 mice per group, two-sided t test) (a), bioluminescence intensity of the primary tumors (n=9 mice on vehicle group and n=10 on Low and High MMA group, two-sided t test) (b), and metastases (n=10 mice per group) (c) in mice that were xenografted with MDA-MB-231-luciferase cells and treated with MMA in their drinking water. d-f, Summary of RNA-seq analysis in A549 cells treated with 5 mM MMA for 10 days: a heatmap representation of hierarchical clustering of the top 100 changed mRNAs (d), functional annotation clustering analysis of the >1.5-fold changed mRNAs detected by RNA-seq analysis in A549 cells treated with 5 mM MMA for 10 days (e), and a volcano plot representation of the complete curated data set (the statistically significantly (FDR≤0.05) altered mRNAs that are changed more than 1.5-fold are displayed in red) (f) (n=3 independent experiments). g, h, mRNA levels of pro-aggressive cell intrinsic factors (g) and secreted factors (h) evaluated by qPCR in A549 cells treated with 5 mM MMA for 10 days (n=4 independent experiments, two-sided t test). i, mRNA levels of transcription factors evaluated by qPCR in A549 cells treated with 5 mM MMA for 3 days (n=3 independent experiments, two-sided t test). j, k, Immunoblots of MCF-10A and HCC1806 cells treated with MMA for 10 days (j) and of MDA-MB-231-luciferase cells treated with 5 mM MMA for 5 days (k) (n=4 independent experiments) l, Immunoblots of HCC1806 and MD-MBA-231-luciferase cells cultured with HS for 4 days (n=6 biologically independent samples per HS donor group) m, Venn diagram showing the overlap of altered mRNAs between A549 cells treated with MMA for 10 days and the genes altered by SOX4 induction28 (Fisher’s exact test). For (a-c, g-i) data are presented as mean ± SEM; (j, k) are representative images. For gel source data, see Supplementary Fig. 2.
Extended Data Fig. 8. SOX4 mediates methylmalonic acid-induced pro-aggressive transcriptional reprogramming.
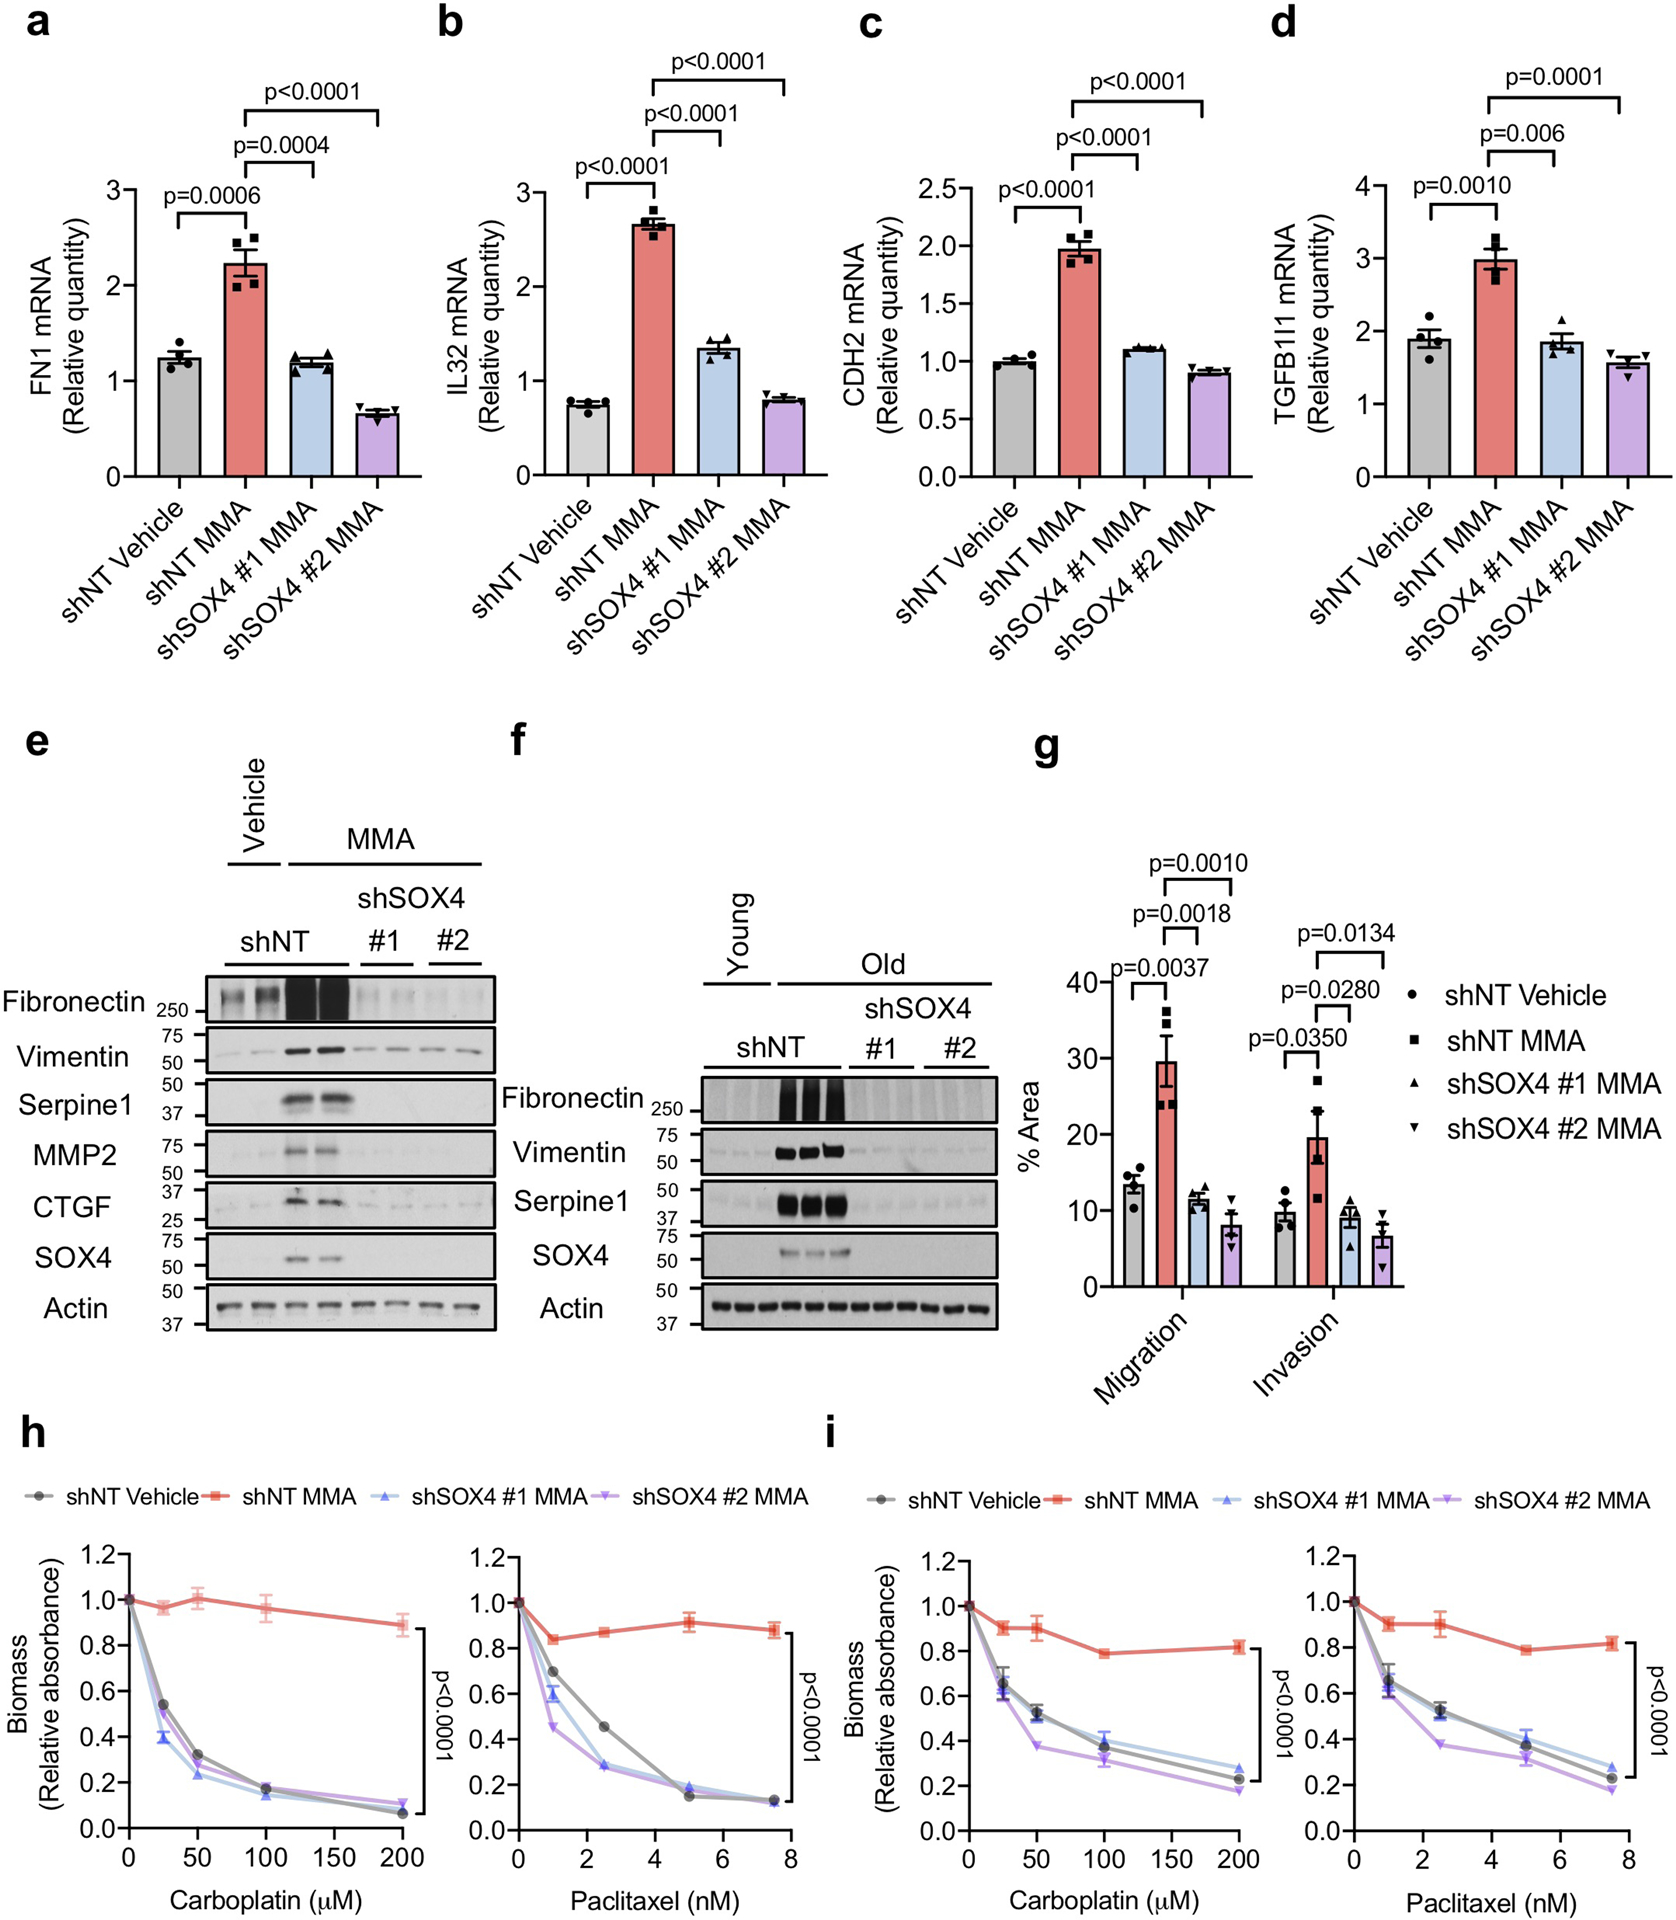
a-d, mRNA levels of fibronectin (FN) (a), IL32 (b), N-cadherin (CDH2) (c) and TGFB1I1 (d) evaluated by qPCR in A549 cells with SOX4 knockdown and treated with 5 mM MMA for 10 days (n=4 independent experiments, two-sided t test). e, f, Immunoblots (e) and transwell migration/invasion assays (f) of MDA-MB-231-luciferase cells with SOX4 knockdown and treated with 5 mM MMA for 5 days (n=4 independent experiments, two-sided t test). g, Immunoblots of MDA-MB-231-luciferase cells with SOX4 knockdown and treated with HS for 5 days (n=6 biologically independent samples per HS donor group) h, i, Resistance to carboplatin and paclitaxel in A549 cells with SOX4 knockdown and treated with 5 mM MMA for 10 days (h) and in MDA-MB-231-luciferase cells with SOX4 knockdown and treated with 5 mM MMA for 5 days (i) (n=4 independent experiments, two-way ANOVA). For (a-d, f, h, i) data are presented as mean ± SEM; (e, g) are representative images. For gel source data, see Supplementary Fig. 2.
Extended Data Fig. 9. Methylmalonic acid induces SOX4 through activation of TGFβ signaling.
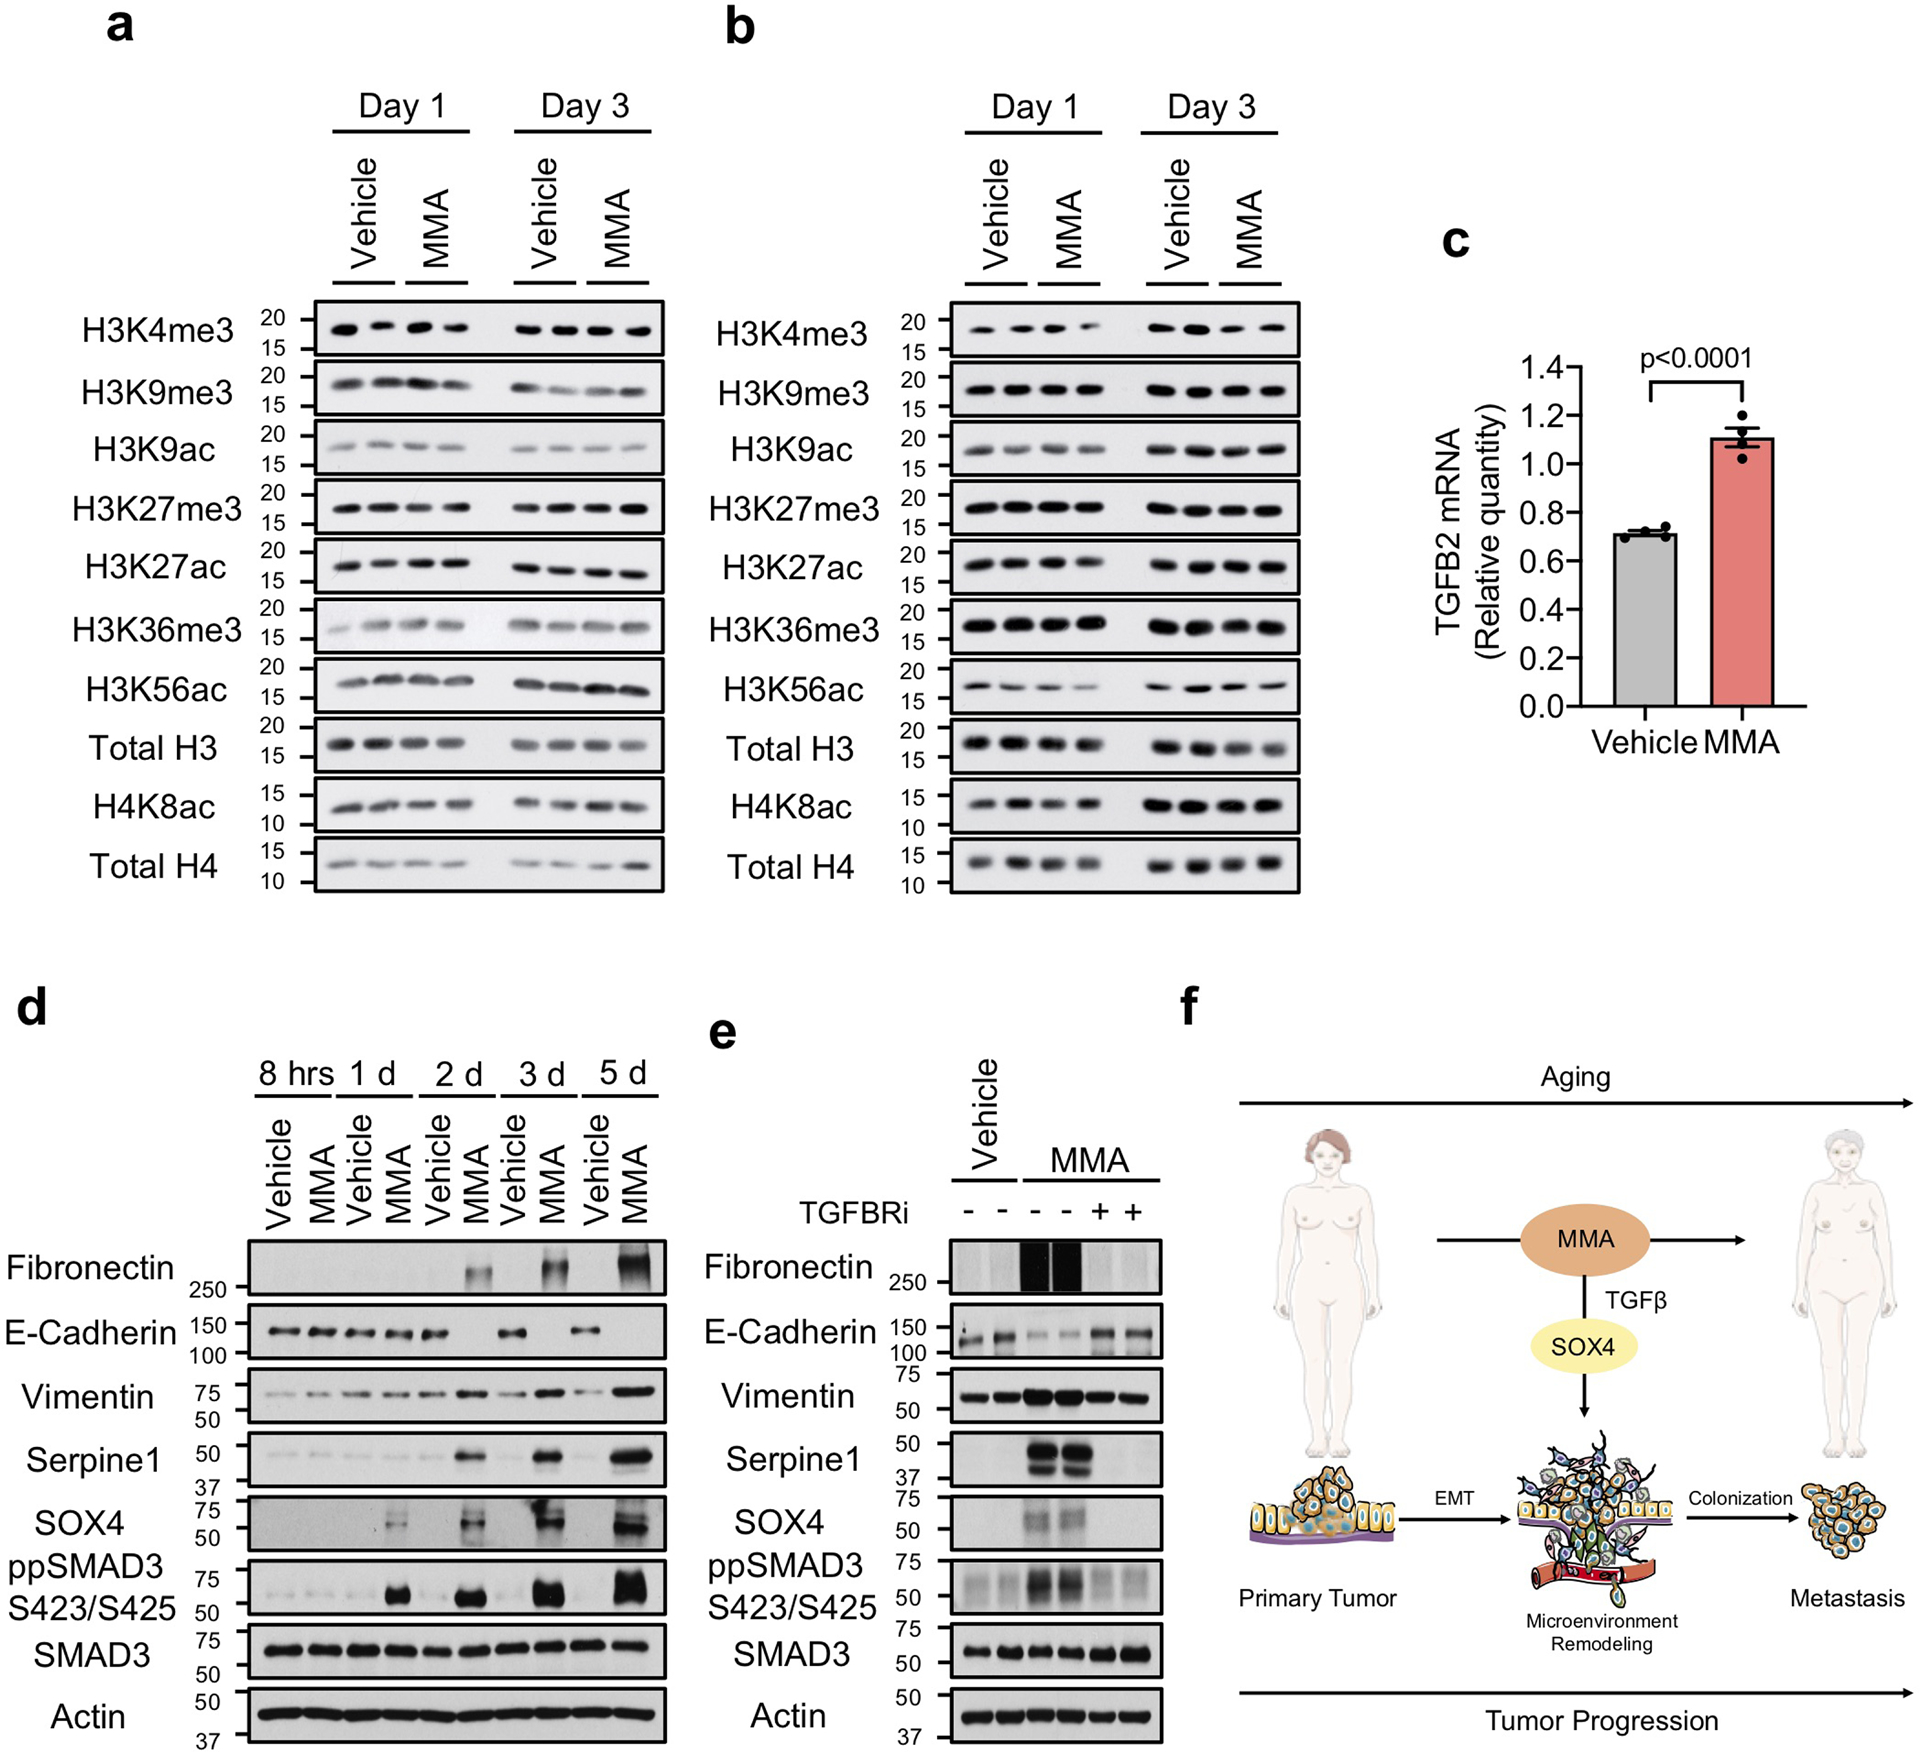
a, b, Immunoblots for histone marks in A549 (a) and MCF-10A (b) cells treated with 5 mM MMA for 1 or 3 days (n=4 independent experiments). c, TGFB2 mRNA levels determined by qPCR in A549 cells treated with 5 mM MMA for 3 days (n=4 independent experiments, two-sided t test). d, e, Immuno-blots of A549 cells treated with 5 mM MMA for the indicated time points (d) or with 5 mM MMA in the presence of TGFBR inhibitor for 5 days (e) (n=4 independent experiments). f, Age-induced accumulation of circulatory MMA induces SOX4 expression through the TGFβ pathway and elicits a transcriptional reprogramming that supports aggressiveness, promoting tumor progression and metastasis formation; This illustration was created using the Smart Servier Medical Art library (https://smart.servier.com/), which is licensed under a Creative Commons Attribution 3.0 Unported License. For (c) data are presented as mean ± SEM; (a, b, d, e) are representative images. For gel source data, see Supplementary Fig. 2.
Acknowledgments
We are grateful to members of the Blenis and Cantley Laboratories for input on this project. We are also thankful to Dr. Paul Coffer for providing the list of SOX4 targets and Robert Pritchard for experimental assistance. A.P.G. is supported by a Susan G. Komen Postdoctoral Fellowship and a Pathway to Independence Award from NCI (K99CA218686-01). T.S. is supported by the NIH F31 pre-doctoral fellowship 1F31CA220750-01. J.F.G. is supported by an FWO fellowship. C.K. was supported by a Medical Scientist Training Program grant from the NIGM/NIH T32GM007739 to the Weill Cornell/Rockefeller/Sloan Kettering Tri-Institutional MD-PhD Program. This research was supported by the NIH grant R01CA46595 to J.B. S.M.F. is funded by the European Research Council under the ERC Consolidator Grant Agreement number 711486 – MetaRegulation, FWO research grants and projects, and KU Leuven Methusalem Co-funding.
Footnotes
Ethics Declaration
L.C.C. owns equity in, receives compensation from, and serves on the Board of Directors and Scientific Advisory Board of Agios Pharmaceuticals and Petra Pharma Corporation. No potential conflicts of interest were disclosed by the other authors.
Additional Information
Supplementary Information is available for this paper.
References
- 1.Wu LE, Gomes AP & Sinclair DA Geroncogenesis: metabolic changes during aging as a driver of tumorigenesis. Cancer Cell 25, 12–19, (2014). [DOI] [PMC free article] [PubMed] [Google Scholar]
- 2.Thigpen T et al. Age as a prognostic factor in ovarian carcinoma. The Gynecologic Oncology Group experience. Cancer 71, 606–614 (1993). [DOI] [PubMed] [Google Scholar]
- 3.Deng F et al. Age is associated with prognosis in serous ovarian carcinoma. J Ovarian Res 10, 36, (2017). [DOI] [PMC free article] [PubMed] [Google Scholar]
- 4.Gloeckler Ries LA, Reichman ME, Lewis DR, Hankey BF & Edwards BK Cancer survival and incidence from the Surveillance, Epidemiology, and End Results (SEER) program. Oncologist 8, 541–552, (2003). [DOI] [PubMed] [Google Scholar]
- 5.White MC et al. Age and cancer risk: a potentially modifiable relationship. Am J Prev Med 46, S7–15, (2014). [DOI] [PMC free article] [PubMed] [Google Scholar]
- 6.Balducci L & Ershler WB Cancer and ageing: a nexus at several levels. Nat Rev Cancer 5, 655–662, (2005). [DOI] [PubMed] [Google Scholar]
- 7.Serrano M & Blasco MA Cancer and ageing: convergent and divergent mechanisms. Nat Rev Mol Cell Biol 8, 715–722, (2007). [DOI] [PubMed] [Google Scholar]
- 8.Migkou M et al. Short progression-free survival predicts for poor overall survival in older patients with multiple myeloma treated upfront with novel agent-based therapy. Eur J Haematol 87, 323–329, (2011). [DOI] [PubMed] [Google Scholar]
- 9.Kasznicki J, Sliwinska A & Drzewoski J Metformin in cancer prevention and therapy. Ann Transl Med 2, 57, (2014). [DOI] [PMC free article] [PubMed] [Google Scholar]
- 10.Li J, Kim SG & Blenis J Rapamycin: one drug, many effects. Cell Metab 19, 373–379, (2014). [DOI] [PMC free article] [PubMed] [Google Scholar]
- 11.De Lorenzo MS et al. Caloric restriction reduces growth of mammary tumors and metastases. Carcinogenesis 32, 1381–1387, (2011). [DOI] [PMC free article] [PubMed] [Google Scholar]
- 12.Ligibel J Lifestyle factors in cancer survivorship. J Clin Oncol 30, 3697–3704, (2012). [DOI] [PubMed] [Google Scholar]
- 13.Ye X & Weinberg RA Epithelial-Mesenchymal Plasticity: A Central Regulator of Cancer Progression. Trends Cell Biol 25, 675–686, (2015). [DOI] [PMC free article] [PubMed] [Google Scholar]
- 14.Wu Y & Zhou BP Inflammation: a driving force speeds cancer metastasis. Cell Cycle 8, 3267–3273, (2009). [DOI] [PMC free article] [PubMed] [Google Scholar]
- 15.Ferrucci L & Fabbri E Inflammageing: chronic inflammation in ageing, cardiovascular disease, and frailty. Nat Rev Cardiol 15, 505–522, (2018). [DOI] [PMC free article] [PubMed] [Google Scholar]
- 16.Zhu Y, Carvey PM & Ling Z Age-related changes in glutathione and glutathione-related enzymes in rat brain. Brain Res 1090, 35–44, (2006). [DOI] [PMC free article] [PubMed] [Google Scholar]
- 17.Tong J et al. Do glutathione levels decline in aging human brain? Free Radic Biol Med 93, 110–117, (2016). [DOI] [PubMed] [Google Scholar]
- 18.Madeo F, Carmona-Gutierrez D, Kepp O & Kroemer G Spermidine delays aging in humans. Aging (Albany NY) 10, 2209–2211, (2018). [DOI] [PMC free article] [PubMed] [Google Scholar]
- 19.Meynial-Denis D Glutamine metabolism in advanced age. Nutr Rev 74, 225–236, (2016). [DOI] [PMC free article] [PubMed] [Google Scholar]
- 20.Chandler RJ & Venditti CP Genetic and genomic systems to study methylmalonic acidemia. Mol Genet Metab 86, 34–43, (2005). [DOI] [PMC free article] [PubMed] [Google Scholar]
- 21.Riekeberg E & Powers R New frontiers in metabolomics: from measurement to insight. F1000Res 6, 1148, (2017). [DOI] [PMC free article] [PubMed] [Google Scholar]
- 22.Baik HW & Russell RM Vitamin B12 deficiency in the elderly. Annu Rev Nutr 19, 357–377, (1999). [DOI] [PubMed] [Google Scholar]
- 23.Zhang J et al. SOX4 induces epithelial-mesenchymal transition and contributes to breast cancer progression. Cancer Res 72, 4597–4608, (2012). [DOI] [PubMed] [Google Scholar]
- 24.Wang L et al. SOX4 is associated with poor prognosis in prostate cancer and promotes epithelial-mesenchymal transition in vitro. Prostate Cancer Prostatic Dis 16, 301–307, (2013). [DOI] [PubMed] [Google Scholar]
- 25.Yang M et al. Estrogen induces androgen-repressed SOX4 expression to promote progression of prostate cancer cells. Prostate 75, 1363–1375, (2015). [DOI] [PubMed] [Google Scholar]
- 26.Liao YL et al. Identification of SOX4 target genes using phylogenetic footprinting-based prediction from expression microarrays suggests that overexpression of SOX4 potentiates metastasis in hepatocellular carcinoma. Oncogene 27, 5578–5589, (2008). [DOI] [PubMed] [Google Scholar]
- 27.Lourenço AR & Coffer PJ SOX4: Joining the Master Regulators of Epithelial-to-Mesenchymal Transition? Trends Cancer 3, 571–582, (2017). [DOI] [PubMed] [Google Scholar]
- 28.Vervoort SJ et al. Global transcriptional analysis identifies a novel role for SOX4 in tumor-induced angiogenesis. Elife 7, (2018). [DOI] [PMC free article] [PubMed] [Google Scholar]
- 29.Wong CC, Qian Y & Yu J Interplay between epigenetics and metabolism in oncogenesis: mechanisms and therapeutic approaches. Oncogene 36, 3359–3374, (2017). [DOI] [PMC free article] [PubMed] [Google Scholar]
- 30.Vervoort SJ, van Boxtel R & Coffer PJ The role of SRY-related HMG box transcription factor 4 (SOX4) in tumorigenesis and metastasis: friend or foe? Oncogene 32, 3397–3409, (2013). [DOI] [PubMed] [Google Scholar]
- 31.Debnath J, Muthuswamy SK & Brugge JS Morphogenesis and oncogenesis of MCF-10A mammary epithelial acini grown in three-dimensional basement membrane cultures. Methods 30, 256–268 (2003). [DOI] [PubMed] [Google Scholar]
- 32.Minn AJ et al. Genes that mediate breast cancer metastasis to lung. Nature 436, 518–524, (2005). [DOI] [PMC free article] [PubMed] [Google Scholar]
- 33.Yuan M, Breitkopf SB, Yang X & Asara JM A positive/negative ion-switching, targeted mass spectrometry-based metabolomics platform for bodily fluids, cells, and fresh and fixed tissue. Nat Protoc 7, 872–881, (2012). [DOI] [PMC free article] [PubMed] [Google Scholar]
- 34.Rappsilber J, Ishihama Y & Mann M Stop and go extraction tips for matrix-assisted laser desorption/ionization, nanoelectrospray, and LC/MS sample pretreatment in proteomics. Anal Chem 75, 663–670 (2003). [DOI] [PubMed] [Google Scholar]
- 35.Erickson BK et al. Active Instrument Engagement Combined with a Real-Time Database Search for Improved Performance of Sample Multiplexing Workflows. J Proteome Res 18, 1299–1306, (2019). [DOI] [PMC free article] [PubMed] [Google Scholar]
- 36.Eng JK, McCormack AL & Yates JR An approach to correlate tandem mass spectral data of peptides with amino acid sequences in a protein database. J Am Soc Mass Spectrom 5, 976–989, (1994). [DOI] [PubMed] [Google Scholar]
- 37.Elias JE & Gygi SP Target-decoy search strategy for increased confidence in large-scale protein identifications by mass spectrometry. Nat Methods 4, 207–214, (2007). [DOI] [PubMed] [Google Scholar]
- 38.Huttlin EL et al. A tissue-specific atlas of mouse protein phosphorylation and expression. Cell 143, 1174–1189, (2010). [DOI] [PMC free article] [PubMed] [Google Scholar]
- 39.Shin S, Dimitri CA, Yoon SO, Dowdle W & Blenis J ERK2 but not ERK1 induces epithelial-to-mesenchymal transformation via DEF motif-dependent signaling events. Mol Cell 38, 114–127, (2010). [DOI] [PMC free article] [PubMed] [Google Scholar]
- 40.Blighe K EnhancedVolcano: Publication-ready volcano plots with enhanced colouring and labeling. R package version 1.0.1. (2019). [Google Scholar]
- 41.Reich M et al. GenePattern 2.0. Nat Genet 38, 500–501, (2006). [DOI] [PubMed] [Google Scholar]
- 42.Dennis G et al. DAVID: Database for Annotation, Visualization, and Integrated Discovery. Genome Biol 4, P3 (2003). [PubMed] [Google Scholar]
- 43.Shen L & Sinai M GeneOverlap: Test and visualize gene overlaps. R package version 1.18.0. (2018). [Google Scholar]
- 44.Oskarsson T et al. Breast cancer cells produce tenascin C as a metastatic niche component to colonize the lungs. Nat Med 17, 867–874, (2011). [DOI] [PMC free article] [PubMed] [Google Scholar]
- 45.Goyenechea E et al. Expression of proinflammatory factors in renal cortex induced by methylmalonic acid. Ren Fail 34, 885–891, (2012). [DOI] [PubMed] [Google Scholar]
- 46.van Gorsel M, Elia I & Fendt S-M in Metabolic Signaling: Methods and Protocols Methods in Molecular Biology (ed Lundt Sophia Fendt Sarah-Maria) Ch. Chapter 4, (Humana Press, 2018). [Google Scholar]
- 47.Elia I et al. Proline metabolism supports metastasis formation and could be inhibited to selectively target metastasizing cancer cells. Nat Commun 8, 15267, (2017). [DOI] [PMC free article] [PubMed] [Google Scholar]
- 48.Lorendeau D et al. Dual loss of succinate dehydrogenase (SDH) and complex I activity is necessary to recapitulate the metabolic phenotype of SDH mutant tumors. Metab Eng 43, 187–197, (2017). [DOI] [PubMed] [Google Scholar]
- 49.Fernandez CA, Des Rosiers C, Previs SF, David F & Brunengraber H Correction of 13C mass isotopomer distributions for natural stable isotope abundance. J Mass Spectrom 31, 255–262, (1996). [DOI] [PubMed] [Google Scholar]
Associated Data
This section collects any data citations, data availability statements, or supplementary materials included in this article.
Supplementary Materials
Data Availability Statement
Information about the human serum donors and the data from the metabolomics experiment can be found in Supplementary Table 1. RNA-seq data that support the findings of this study have been deposited in the Gene Expression Omnibus (GEO) (under the accession code GSE127001 on https://www.ncbi.nlm.nih.gov/geo/, as well as presented in Supplementary Table 2. All raw data files, peak lists, and the sequence database for the proteomics analysis have been deposited in the MASSive repository (https://massive.ucsd.edu, ID#: MSV000084974). Source data and scans for the western blots for all experiments are provided. Other data supporting the findings of this study are available from the corresponding authors upon reasonable request.