

Abstract
Sodium magnetic resonance imaging (23Na‐MRI) is a highly promising imaging modality that offers the possibility to noninvasively quantify sodium content in the tissue, one of the most relevant parameters for biochemical investigations. Despite its great potential, due to the intrinsically low signal‐to‐noise ratio (SNR) of sodium imaging generated by low in vivo sodium concentrations, low gyromagnetic ratio, and substantially shorter relaxation times than for proton (1H) imaging, 23Na‐MRI is extremely challenging. In this article, we aim to provide a comprehensive overview of the literature that has been published in the last 10–15 years and which has demonstrated different technical designs for a range of 23Na‐MRI methods applicable for disease diagnoses and treatment efficacy evaluations. Currently, a wider use of 3.0T and 7.0T systems provide imaging with the expected increase in SNR and, consequently, an increased image resolution and a reduced scanning time. A great interest in translational research has enlarged the field of sodium MRI applications to almost all parts of the body: articular cartilage tendons, spine, heart, breast, muscle, kidney, and brain, etc., and several pathological conditions, such as tumors, neurological and degenerative diseases, and others. The quantitative parameter, tissue sodium concentration, which reflects changes in intracellular sodium concentration, extracellular sodium concentration, and intra–/extracellular volume fractions is becoming acknowledged as a reliable biomarker. Although the great potential of this technique is evident, there must be steady technical development for 23Na‐MRI to become a standard imaging tool. The future role of sodium imaging is not to be considered as an alternative to 1H MRI, but to provide early, diagnostically valuable information about altered metabolism or tissue function associated with disease genesis and progression.
Level of Evidence
1
Technical Efficacy Stage
1
Keywords: sodium, MRI, technical developments, clinical applications
IN VIVO SODIUM MAGNETIC RESONANCE IMAGING (23Na‐MRI) is an advanced imaging modality that offers noninvasive metabolic imaging for early and accurate diagnosis, characterization, and treatment efficacy evaluations of several diseases.
The 23Na ion is one of the most important electrolytes in the human body and it plays a crucial role in osmoregulation and physiology of the cell. 1 A large sodium concentration gradient is required for appropriate function of the cells, and intracellular sodium concentration (ISC) is one‐tenth of that in the extracellular space (ESC) (10–15 vs. 100–150 mmol/L). In healthy tissue, the large concentration gradient between the cells and the extracellular space is maintained primarily by the energy‐dependent sodium–potassium pump (Na+/K+‐ATPase). If the cell membrane or energy metabolism is destroyed, it can drive an impairment of the sodium–potassium pump, which will further increase intracellular sodium concentration and induce cell malfunction and, eventually, cell death. 2
An in vivo 23Na MRI can noninvasively provide valuable information on cell metabolism; however, the technique is extremely challenging. 23Na has a spin of 3/2 and belongs to the group of quadrupole nuclei. The sensitivity of nuclear magnetic resonance (NMR) experiments is given by signal‐to‐noise‐ratio (SNR) and, for 23Na, it is 9.2% that of proton (1H) sensitivity. There are three major factors that limit the SNR of sodium imaging: the concentration of the 23Na ion in vivo is low and is in the range from 15 mM (muscle 15–30 mM) to 350 mM (articular cartilage 250–350 mM); relaxation times of sodium are about two orders of magnitude smaller than those of protons (T1: 15–55 msec, T2short: 0.5–2.5 msec, and T2long: 10–65 msec), and the gyromagnetic ratio of sodium (γNa = 11.26 MHz/T) is approximately four times lower than that for hydrogen (γH = 42.57 MHz/T). 3 Fortunately, most of these limitations were abolished by the introduction of 3.0T (high‐field) and ≥7.0T (ultrahigh‐field) scanners and an essential SNR increase was achieved (SNR ~ B0 1.65). 4 The modern MRI systems are currently equipped with strong gradients and sophisticated electronics, multiarray coils, and fast (non‐Cartesian) sequences that allow further SNR enhancement of 23Na‐MRI. 5
The purpose of this article is to provide readers with an overview of the current literature, including methodological improvements in the 23Na‐MRI technique and its application in preclinical and clinical investigations at 3.0T and 7.0T. Lately, several review articles that cover some important aspects of the technique have been published, including biomedical applications for sodium imaging, evaluations of cartilage repair techniques and osteoarthritis, sodium imaging of the heart and the brain, 23Na‐MRI radiofrequency (RF) systems for brain and musculoskeletal or body imaging, and quantitative sodium imaging, etc. 3 , 6 , 7 , 8 , 9 , 10 , 11 , 12 Considering that the majority of previously published review articles were focused on a single organ or disease, we attempt here to summarize a significant amount of new publications since the last comprehensive sodium review article appeared. In this work, we aim to provide a review of recent 23Na‐MRI findings when applied in nearly all parts of the body and revisit the frontiers of sodium imaging in modern medicine.
Imaging Sequences
23Na in tissue has a biexponential relaxation behavior, which means that most of the 23Na signal is lost within a few milliseconds. The rapid signal loss renders quantitative imaging challenging. The short T1 relaxation time facilitates a short repetition time (TR) and fast averaging, which can partially compensate for the low intrinsic SNR. Imaging with pulse sequences designed in a way that enables measurements with a very short echo time (TE, ~1 msec), such as an ultrashort echo time (UTE) sequence, may overcome the challenge of the very short T2 of sodium nuclei. On the other hand, a short TE will substantially limit the duration of the signal readout and cause image blurring and a decrease in SNR. However, UTE acquisition methods are generally slow compared to echo‐sampled MRI and the sampling of k‐space with high efficacy is an important factor in achieving high SNR and resolution in an acceptable scan time.
The development of non‐Cartesian sequences for sodium imaging that aim to maximize the efficiency of k‐space sampling started in early 1990 and continues today. Hilal et al in 1992 demonstrated the feasibility of a three‐dimensional radial projection (3DRPI) acquisition method in which the center of k‐space is densely sampled, while the edges of k‐space are undersampled. 13 Almost a decade later, Nagel et al developed a pulse sequence, called the density‐adapted three‐dimensional radial projection reconstruction pulse sequence (DA‐3DPR) that was designed on the basis of a conventional 3DPR sequence. The sequence was modified such that the sampling density in the outer part is kept constant, while an inner sphere of k‐space is sampled with no density adaptation. This approach enabled substantially improved image quality and an increase in SNR. 14
In parallel, Boada et al developed the twisted projection imaging (TPI) sampling scheme. 15 This method replaced radial linear gradients with time‐varying gradients with a short radial component to move promptly away from the center of k‐space, followed by a time‐inconstant gradient that dismissed a 3D spiral trajectory. 15 , 16 TPI uses spokes up to a threshold k‐space value, at which point the trajectory transits into a 3D spiral‐like trajectory. 16 This sequence was shown to be the most favorable for in vivo quantitative sodium measurements in brain. 17 Shortly after, Boada's group developed a sequence called the acquisition‐weighted stack of spirals (AWSOS) sequence, which attempts to decrease excitation and acquisition delay by introducing a variable slice‐encoding, and separating slice thickness from in‐plane resolution to lower the number of slice‐encoding steps, while at the same time, using a spiral readout to increase the efficiency of in‐plane acquisition. 18 In addition to the above‐mentioned sequences, other k‐space trajectories, ie, employing distributed spiral trajectories, such as SPRITE (Single‐Point Ramped Imaging with T1‐Enhancement) and FLORET (Fermat Looped, Orthogonally Encoded Trajectories), have been proposed and used for 23Na‐MRI. 19 , 20
The necessity to increase SNR and image resolution of 23Na‐MRI was accompanied by the needs of researchers and clinicians for selective measurements of intracellular sodium changes. Their goal was to develop a method that could provide more specific information and an image biomarker of compromised ionic homeostasis. Biexponential relaxation, typical of sodium nuclei in slow motion in the intracellular space, also observable in the extracellular space, can pass through a state of multiple quantum coherences (MQC). 21 MQ filtering techniques are essentially sensitive to changes in intracellular sodium concentration, and therefore, these techniques are ideally suited for the noninvasive, in vivo observations of ISC level changes. Tsang et al confirmed the possibility of double quantum‐magic angle (DQ‐MA) signal generation from the human brain. 22 Initial experiments, performed with the highest nominal isotropic resolution of (8.4 mm)3 and 48 minutes scanning time, demonstrated the presence of sodium nuclei in ordered environments. Later on, the DQ‐MA method was used to visualize the sodium signal that originates from anisotropic structures, such as muscle fibers. 23
However, the main drawback of the MQ techniques is their low SNR. Using a train of three RF pulses (with the corresponding phase cycling), Hancu et al demonstrated that 3D triple‐quantum‐filtered (TQF) sodium images of the human brain can be acquired at moderate field strengths (3.0T) with examination times acceptable for clinical applications. 24 Tsang et al, however, demonstrated the utilization of sufficiently long RF pulses and a reduced TR that might lead to further SNR enhancement for TQF images. 25
Essentially, low SNR was not the only issue with TQF sequences; they entail a lower power deposition and they are still prone to image artifacts caused by off‐resonances. Therefore, development continued and a method called biexponentially weighted (BW) 23Na‐MRI was developed. The initial results published were very promising, and demonstrated a three times higher image SNR obtained by BW 23Na compared to the six‐step phase‐cycling TQF MRI. 26 For the excitation and detection of MQC, a three‐pulse preparation is applied during the pulse train, and two images are generated: a spin‐density‐weighted image (SDW), and a single‐quantum‐filtered image (SQF). The BW image is derived by subtracting the SQF image from the SDW image and shows the signal from sodium ions with biexponential relaxation. Nagel et al proposed a relaxation‐based (RW) method as a possibility to differentiate the tissue sodium signal based on differences in 23Na relaxation properties in different tissues. 27 Two different approaches based on the DA‐3DPR sequence were provided: the first used an inversion recovery (IR) preparation pulse to exploit T1‐differences of 23Na ions, and the second approach was based on 23Na multiecho sequences to exploit differences in T2*‐relaxation times. However, the relaxation‐weighted 23Na signal describes a compartment defined by 23Na relaxation properties and does not necessarily correspond to the intra‐ or extracellular space. 28
Although several different methods for sodium DQ and TQ coherence discrimination have been proposed in the literature, a clear confirmation that intra‐ and extracellular signals can be separated in vivo is still lacking.. 29 MQC from both the intra‐ and extracellular spaces are similar because of the labile macromolecular interactions that result in comparable relaxation properties (T2 values) of sodium nuclei in different environments. Therefore, the difference between intra‐ and extracellular sodium signals cannot be established based on relaxation time constant characteristics. This is certainly one of the most important topics on which the sodium MRI community should come to a consensus in the future.
Image Reconstruction Methods
MR is fundamentally a low SNR imaging method, and the use of nuclei other than protons for imaging purposes may have a considerable impact on the resulting image SNR. The acceleration of image acquisition allows significant improvements in SNR per unit time.
Pioneering work in this field was done by Qian et al,30 who demonstrated the advantages of parallel imaging with a TPI trajectory. In computer simulations, these authors tested the TPI‐SENSE (sensitivity encoding) method with an applied acceleration factor of 5.53 and simulations were verified on the proton human head studies. The results showed that parallel sodium imaging may reduce scan time substantially compared to the conventional TPI acquisition (3 minutes vs. 16 minutes) without a substantial loss in image quality. 30 Several years later, Benkhedah et al investigated feasibility of the adaptive combination reconstruction (ADC) method for multichannel coil array data combining and found that mean SNR may be increased from 8–50% compared to standard sum‐of‐squares (SOS) image reconstruction. 31 Additionally, an alternative possibility for high‐quality image reconstruction from undersampled datasets is a compressed sensing (CS) method. Gnahm et al recently showed that an anatomically weighted second‐order total variation reconstruction of 23Na MRI using prior information from 1H MRI (AnaWeTV) provides an increase in image quality due to maintained tissue borders and reduced partial volume effects (PVE). 32 A method that uses a 3D, dictionary‐learning CS reconstruction algorithm (3D‐DLCS) for the reconstruction of undersampled 3D radial 23Na data was presented by Behl et al. 33 Using the dictionary, it is possible to learn the sparsifying transform with a K‐singular‐value‐decomposition (K‐SVD) algorithm. The same method was shown to be feasible for tissue sodium concentration (TSC) quantification of skeletal muscle. 34
Quantitative Sodium MRI
A comprehensive review article about the evolving role of quantitative sodium imaging in medicine was recently published by Thulborn. 12 Different applications of 23Na‐MRI for quantitative analysis, particularly of the musculoskeletal system, were reviewed by Bangerter et al. 35
In a study published in 2010, Lu et al presented a flow chart for an image reconstruction and tissue sodium quantification (TSC) process that included B0, B1 mapping, and eddy current corrections, assuming that 1H and 23Na coils have the same eddy current characteristics. 16 These authors investigated the effect of B0 corrections on TSC measurements and found that a substantial improvement in image quality and quantification accuracy can be achieved by introducing B0 corrections in an image postprocessing scheme. The effect of B1 inhomogeneity on absolute 23Na concentration quantification was further studied by Lommen et al, who proposed a method for simultaneous B1 mapping (implemented into the 3D radial projection sequence) and 23Na imaging to increase accuracy and to reduce measurement time. 36 Niesporek et al developed an algorithm for partial volume effect (PVE) corrections and demonstrated a high performance of the method to reduce the discrepancy between the measured and expected sodium concentration value by 11% to a mean PVE‐caused inconsistency of 5.7% after correction. 37
RF Systems for Sodium MRI
RF coils are one of the most important elements for high‐quality, high‐SNR sodium MRI. There are a number of challenges connected to RF coil design, first among them the operating frequencies, which have to be low; consequently, this can lead to problems maintaining good coil loading, and thus, directly limits coil sensitivity. The performances of different RF coil designs for sodium imaging of brain and musculoskeletal applications have been extensively discussed in a review article published by Wiggins et al. 10 The overview of the advantages and disadvantages of various RF coil topologies for sodium body imaging has been reported by Bangerter et al. 11
Because of the very short T2 of sodium, short RF pulses are required to minimize echo time, which drives a highly efficient transmit coil to limit the maximum voltages needed. The benefit of a linear increase in SNR with field strength is diminished by higher specific absorption rates (SARs), which require a lengthening of the RF pulse durations or repetition times.
One of the major demands of clinicians is that the same coil provides proton and sodium imaging within one imaging session. Moreover, to maximize sodium MRI performance, it is important to maximize the uniformity of the main B0 static magnetic field. The most efficient and robust way is to calculate the correct shim currents using proton‐based methods to map the B0 field and then transfer shim parameters to sodium imaging. This involves the use of double‐tuned, multichannel phased array coils. However, the major issue with dual frequency designs is that they degrade the performance at one or both frequencies (1H coil structures have to cope with screening effects as a result of currents induced on the 23Na coil part). 10 Recently, Gast et al developed a 23Na‐MRI‐based method for localized B0 shimming at 7.0T and showed that an external field inhomogeneity can be reduced up to 77% using this approach. 38 Many different coil designs, optimized for improved sodium sensitivity, have been developed and reported in the literature recently, suitable for almost all body parts, such as the knee, the breast, and the brain. 10 , 11 , 39 , 40 , 41 , 42 , 43 , 44 , 45
Sodium Imaging of Cartilage
Cartilage Repair
Within the last two decades, a large number of cartilage repair surgical techniques were developed, such as bone marrow stimulation techniques (Pridie drilling, microfracturing, MFX), first‐, second‐, and third‐generation cell‐based autologous chondrocyte implantation (ACI), autologous osteochondral transplantation (AOT), and cell‐free implant techniques. A recent review article by Zbyn et al provided an extensive overview of different repair techniques evaluations using 23Na‐MRI. 8
Proton MRI allows the morphological assessment of the cartilage and cartilage repair tissue and, more recently, biochemical assessment using the glycosaminoglycan (GAG) chemical exchange saturation transfer (CEST) technique. Information about the fine structure or biochemical composition and the quality of the repair tissue is, however, of particular interest, as it has been demonstrated that the composition of the repair tissue may affect the long‐term outcome. In addition to gagCEST, 23Na‐MRI is able to assess changes in ion content connected to GAG molecules. The GAGs are negatively charged molecules and belong to the group of the most important constituents of cartilage. GAG is the central point of molecular investigations of the cartilage tissue because it has a significant influence on its function and homeostasis. Furthermore, the GAG content significantly correlates with the biomechanical properties of cartilage, in particular, compressive stiffness. 46 In articular cartilage, the negatively charged GAGs are counterbalanced by positively charged sodium ions; thus, the sodium concentration can be used as an indirect indicator of the amount of GAG, which, in turn, can be noninvasively assessed using sodium imaging 47 , 48 (Fig. 1). For quantitative measurements, phantoms with known sodium concentrations may be placed close to the organ under investigation and may provide absolute tissue sodium concentrations.
FIGURE 1.

A 39‐year‐old male patient who had a small cartilage defect less than 15% of the cartilage thickness (ICRS grade 2 lesion) in the proximal trochlear region of the lateral femoral condyle. (a) A fat‐suppressed proton density (FS‐PD) image in a sagittal orientation shows a lesion with intra‐chondral signal alterations. Sodium 23Na‐MRI images generated (b) 3 days and (c) 4 weeks after the defect.
The first study that included patients after cartilage repair treatment was published by Trattnig et al in 2010. 49 Twelve patients were involved in the study and scanned using a 3D‐GRE (gradient echo) sequence with a sodium‐only, birdcage knee coil. Each patient was examined ~56 months after matrix‐associated chondrocyte transplantation (MACT). The normalized values of the sodium normalized signal intensity (NMSI) were significantly lower in transplanted tissue (174 ± 53) than in reference cartilage (267 ± 42) (P < 0.001). When the results were compared with dGEMRIC (delayed Gadolinium Enhanced MRI of cartilage), another GAG‐specific method, the authors concluded that sodium MRI allows the differentiation between MACT repair tissue and native cartilage of patients without the need for contrast agent application. For validation of gagCEST imaging as a new method sensitive to changes in GAG content, Schmitt et al compared gagCEST results at 7.0T with sodium MRI in patients with femoral cartilage repair. 50 Results based on five MFX and seven MACT patients showed a strong correlation between sodium and gagCEST values and demonstrated the feasibility of this method for the cartilage GAG content assessment.
Zbyn et al further investigated the quality of newly developed repair tissue on femoral condyle cartilage after two different repair procedures: bone marrow stimulation (BMS) and MACT. 51 The NMSI of repaired tissue was significantly lower in patients after BMS than in those who underwent a MACT procedure ((164 ± 31) vs. (210 ± 36)) (P = 0.028). However, the properties of the repair tissue, evaluated by the MOCART scoring system based on morphological MR evaluations, 52 were not significantly different between two groups of patients after BMS and after MACT treatments (P = 0.915). The sodium results suggest that a higher GAG content is common for the sophisticated cell‐based MACT technique compared to the more simple BMS technique. This basically means that MACT produces high‐quality repair tissue with a more hyaline‐like composition compared to BMS, which mainly produces fibrous repair tissue with a very low GAG content. Sodium MRI can differentiate between repair tissues with different amounts of GAG, and thus, serve for the noninvasive evaluation of the performance of new cartilage repair techniques.
An article by Chang et al compared sodium MRI results obtained from in 11 patients with and without fluid suppression, after several different procedures of cartilage repair (MFX, MACT, osteochondral grafting, juvenile cartilage implantation). Examinations were done at 7.0T employing a radial UTE sequence, a sodium‐only, birdcage knee coil, and IR sequence with an adiabatic inversion pulse. 53 The results of the study demonstrated that fluid‐suppressed sodium MRI is more robust compared to standard sequences. In addition, sodium concentration in neighboring cartilage to transplanted tissue was significantly lower than in healthy cartilage tissue. This is in agreement with the findings of in vitro studies, which demonstrated that the amount of viable chondrocytes is lower close to the site of injury. 54
Cartilage defects can occur also in the ankle joint, mostly after injury or in patients with osteochondritis dissecans. Cartilage repair procedures used in the knee joint are also performed in the ankle joint. MRI of the ankle joint is particularly challenging for a number of reasons. The cartilage lining is curved, highly congruent, and significantly thinner than in the knee joint, with an average thickness of 1.1 ± 0.18 mm for talar cartilage and 1.16 ± 0.14 mm for the cartilage of the distal tibia. 55 This leads to increasing problems regarding partial volume effects and SNR. The first results of sodium imaging in cartilage repair technique evaluations were promising; therefore, Zbyn et al applied a similar approach to cartilage repair technique evaluations after MFX and MACT in the ankle joint. 48 After biochemical validation of the sodium imaging protocol using ex vivo measurements of ankle joint cadavers, which demonstrated a strong linear correlation between the NMSI and the histochemically assessed GAG content (r = 0.800; P < 0.001; R2 = 0.639), reference values were obtained for healthy volunteers. Subsequently, patients after MFX and MACT of the talar dome were examined. The repair tissue of both treatment groups exhibited significantly lower corrected signal intensities (cSI) compared to healthy cartilage (MFX, P = 0.007; MACT, P = 0.008), indicating a lower GAG content than in healthy reference cartilage of the same patients or the healthy controls, but no significant difference was found between both treatment groups, indicating that cartilage composition and the effect on repair seems to be different in the ankle joint compared to the knee joint (P = 0.185). No significant difference in cSI was found between healthy cartilage of subjects and patients (P = 0.355) as well.
Quantitative TSC imaging of articular cartilage is challenging and its accuracy is limited by several factors, such as the partial volume effect caused by the relatively low spatial resolution, signal loss from T2short decay due to the insufficiently short TE, and T2 blurring due to rapid signal decay during the readout. In the future, protocols for TSC quantification that are feasible for clinical applications should be further developed.
23Na‐MRI in Osteoarthritis (OA)
Proton (1H) MRI methods provide different information about the morphology of the knee joint, but the more valuable diagnostic information is that regarding compositional changes in the joint, which often occur before morphological changes appear (Fig. 2). This gives rise to the need for biochemical and quantitative MRI to reveal the early changes in the complex molecular composition of articular cartilage.
FIGURE 2.

A 50‐year‐old male patient with a lesion in the patellar cartilage in the area crista patellae. (a) A proton density sequence with fat suppression (FS‐PD) demonstrates an early stage degeneration of articular cartilage with a minor chondral signal alteration and a minor reduction of cartilage thickness, and a surface that appears intact (ICRS grade 1 lesion). (b) Yellow arrow shows the corresponding area on the sodium image.
After validation in in vitro studies and in studies on animal models, 56 sodium MRI was employed for the evaluation of OA patients. Wheaton et al performed a study using a surface coil at 4.0T and acquired sodium images with a UTE radial sequence. 57 These authors measured the knees of nine healthy volunteers without and three patients with symptoms of early OA. The mean sodium content measured in the patellae of the volunteers corresponded to a mean fixed charge density (FCD) measurement of –182 ± 9 mmol/L. These authors generated sodium maps for each OA patient, which illustrated cartilage regions with significantly lower FCD (from –108 to –144 mmol/L) when compared to the FCD of healthy volunteers.
Zbyn et al very recently demonstrated that in vivo 23Na‐MRI is a feasible method for the differentiation between low‐grade lesions and normal‐appearing articular cartilage. 58 Morphological MRI at 3.0T and biochemical 23Na‐MRI at 7.0T investigations were performed at four timepoints (baseline, 1 week, 3 months, and 6 months). After every MR session, patients underwent the Knee Injury and Osteoarthritis Outcome Score (KOOS) questionnaire for clinical evaluation. The authors found significantly lower 23Na‐cSI values in all lesions than in healthy cartilage tissue at all timepoints (all P ≤ 0.002). KOOS scores improved in all subscales at the 3‐ and 6‐month visits, with a significant increase observed only in the quality of life subscale (P = 0.004).
The results of all the above‐mentioned publications confirmed that sodium is a feasible and reliable method for the assessment of early OA changes. Findings of the clinical studies support the concept that compositional cartilage changes can develop earlier than progressive morphological changes are detectable. This information may be crucial for early OA discovery and the efficacy of new treatment options in OA.
23Na‐MRI of the Spine
The intervertebral disk shows a characteristic architecture tailored to its biomechanical purpose. The nucleus pulposus (NP) shows a high concentration of proteoglycans (PG) in the extracellular matrix that consists of large complexes of bound GAGs. Those, in turn, have the essential ability to passively store water due to their negatively charged side chains that attract free‐floating, positively charged 23Na ions. Therefore, unlike most other tissues in the human body, cartilage, in general, and the intervertebral disc (IVD), specifically, have the vast majority of 23Na ions present in the extracellular volume. 6
The idea to detect early biochemical changes in the intervertebral disc due to disk degeneration using 23Na‐MRI was conceptualized and measured in vivo using a DQF, a DQF‐MA, as well as a TQF sequence by Ooms et al. 59 , 60 The group identified age‐related changes in 23Na‐MRI of the thoracic and lumbar intervertebral discs. First, the content and the residual quadrupole interaction in the nucleus pulposus and the annulus fibrous differed at different ages. Also, the quadrupole coupling (ωQ) and the relaxation rate of satellite transitions (1/T2f) increased with age.
An ex vivo study published by Wang et al used bovine intervertebral discs and measured the PG content using 1,9‐dimethylmethylene blue (DMMB) assays of 28 nucleus pulposus punch samples. 61 As already shown by Urban et al, a nucleus pulposus without measurable PG content still has a remaining 23Na concentration of about 111.54 mmol/L. 62 Wang et al combined their measurements and the prior work published by Urban et al 62 and showed a correlation coefficient of 0.71 between the PG content measured by DMMB and the 23Na measured by sodium MRI. Simulating the relationship only for a 23Na concentration from 150 mmol/L to 350 mmol/L, a linear correlation coefficient of 0.998 was reached for sodium MRI, making it a very potent imaging biomarker for the indirect quantification of GAGs in the intervertebral disk. 61
Noebauer‐Huhmann et al published an in vivo study confirming that the concept of sodium imaging was a feasible, noninvasive imaging biomarker, and compared it to T2 mapping and morphological grading. 63 As degeneration is also associated with the diminishing synthesis of proteoglycans, sodium imaging might be able to longitudinally depict temporal changes in different disc pathologies. 63 However, those authors did not find a significant correlation of T2 values and 23Na imaging. This was expected, since T2 mapping is mainly related to water content, collagen fiber content, and organization, while sodium imaging correlates with GAG content. In addition, it is known that natural degradation of the disc lowers the measured T2 relaxation times due to the accumulation of lipids and adducts from carbohydrates, which does not affect the 23Na imaging measurements. This allows for the assumption that 23Na‐MRI can distinguish between nondegenerative, age‐related pathological changes in the extracellular matrix of the nucleus pulposus, potentially making it more sensitive to pathophysiological changes than other quantitative MRI methods.
Sodium in Tendons
Sodium MRI is a useful imaging modality for Achilles tendon biochemical investigations. The Achilles tendon connects the calcaneus and the calf muscle and must withstand a remarkable load during movement. To facilitate that, the highly organized collagen matrix provides the base for static biomechanical properties with the aid of proteoglycans (~3.5% of dry weight) responsible for dynamic biomechanical properties. In tendinopathy, due to stimulated proteosynthesis, which helps to overcome disaggregation of the microfibrillar bundles, increased proteoglycan concentration has been observed using biochemical assays. 64 As negatively charged sulfate and carboxyl groups of proteoglycans attract positively charged sodium ions, there is a direct proportion of sodium and proteoglycan concentration in the Achilles tendon. To acquire a 23Na signal from the tendon, typically no dedicated coils are used, but sodium knee coils are used instead—they provide enough space for lower leg placement and satisfactory coil loading. Juras et al showed that the sodium signal can serve as a marker for Achilles tendinopathy, as it provides information about elevated sodium concentration in the tendon. 65 They investigated eight patients with clinical findings of chronic Achilles tendinopathy and scanned them with a 3D‐gradient echo sequence using an in‐plane resolution of 0.89 mm and a total measurement time of about 32 minutes. Mean bulk sodium SNR observed in this study was 4.9 ± 2.1 (a.i.) in healthy control subjects and 9.3 ± 2.3 (a.i.) in patients with Achilles tendinopathy, and these means were statistically significant. Interestingly, these increases were not only local, suggesting that the tendon is completely affected in Achilles tendinopathy. Also, the validation of the sodium signal and sodium content in tendons was investigated in the same study. 65 Using 15 cadaver samples of Achilles tendons, which were analyzed with regard to the proteoglycan content, the Pearson correlation coefficient between the sodium SI and the proteoglycan content in dry weight was 0.71.
In another study, the increased sodium content in the Achilles tendon, after fluoroquinolone antibiotic therapy, was investigated with 23Na‐MRI. 66 It has been previously observed that, after fluoroquinolone treatment, patients can develop Achilles tendinopathy, including all the typical symptoms, such as acute onset of tendon pain, tenderness, and swelling that affects the function of the tendon and, in the worst case, may lead to tendon tear. Seven healthy male subjects underwent voluntary ciprofloxacin treatment (1000 mg/day in two doses: 500 mg in the morning and 500 mg in the evening for 10 days) and were scanned with 23Na MRI at three timepoints: baseline; at 10 days; and at 5 months after the treatment. Here, the variable echo‐time (vTE) sequence adapted to x‐nuclei capabilities was used with an echo of 2.45 msec and a total acquisition time of 15 minutes. Despite the fact that there were no morphologically detectable changes in these volunteers after the treatment, the NMSI decreased by almost 25% (from 130 ± 8 to 98 ± 5 a.u.) and then reached 116 ± 10 a.u. after 5 months. The results provide evidence that sodium MRI is a technique robust and sensitive enough to detect the changes in the sodium content in the Achilles tendon, which could be associated with altered proteoglycan content and may pose the tendon to risk for tendinopathy and tear.
Muscle
Recent studies demonstrated that 23Na‐MRI of a lower leg muscle can be a useful imaging modality for the detection of sodium content changes during exercise or disease. 67 , 68 The sodium concentration increase or decrease in the body manifests as a condition known as hypernatremia or hyponatremia, which may be induced by a hormonal imbalance or related diseases, such as diabetes mellitus, hypertension, and acute heart failure. 23Na concentrations alterations in calf muscle, however, may be closely related to developed pathologies of the muscle tissue, such as channelopathy and muscular dystrophy. Several studies confirmed the reproducibility and repeatability of quantitative sodium imaging in the lower leg muscle, which is considered a basic condition for an accurate evaluation of several different muscle pathologies in patients. 69 , 70
Sodium Evaluations in Diabetic Patients
Na+/K+‐ATPase activity is decreased in patients suffering from diabetes. A sufficiently high concentration of hormone insulin in the blood will directly enhance sodium/potassium pump activity in muscle, kidney, liver, etc. 71 Chang et al evaluated the signal intensity (SI) of sodium pre‐ and postexercise. The sodium signal was assessed in patients with diabetes and in healthy subjects, in all three compartments of the calf muscle: tibialis anterior (TA), soleus (S), and the gastrocnemius (G) muscles. It was found that the sodium signal intensity in the S and G immediately increased significantly after exercise for both diabetic patients and healthy subjects. However, the signal intensity decrease to baseline was slower in diabetics. An explanation for this can be supported by the fact that, in patients with diabetes mellitus, muscle function is reduced and accompanied by impaired functioning of the Na+ /K+ pump.
Muscular Channelopathy and Muscular Dystrophy
Muscular channelopathies are a group of nondystrophic myopathies, which are caused by gene mutations that result in a malfunction of the ionic channels of the muscle. Nagel et al, as a clinical model, chose patients with hypokalemic periodic paralysis (hypoPP) and paramyotonia congenita (PC). 72 The purpose of the study was to investigate which of three different sequences: 23Na‐TSC; T1‐weighted sodium imaging (23Na‐T1); or 23Na‐IR would provide the strongest weighting toward intracellular sodium. All three sequences demonstrated significantly higher signal intensities in hypoPP compared to those in PC patients and healthy subjects. However, after inducing a provocation in PC patients, a significant (P = 0.007) increase (>20%) in the muscular 23Na‐IR signal and a corresponding decrease of muscle strength was detected. These results provide strong evidence that 23Na‐IR substantially advances weighting toward intracellular sodium and enables an improved evaluation of pathophysiological changes of muscles in patients suffering from rare diseases.
In contrast to skeletal muscle channelopathies, which are rare, inherited childhood‐onset disorders, myotonic dystrophy (DM) is the most common form of muscular dystrophy that begins in adulthood. A special severe type of DM, investigated with 23Na‐MRI, is Duchenne's muscular dystrophy (DMD) that is usually diagnosed in childhood. DMD is caused by a mutation in the dystrophin gene, which leads to progressive muscle weakness and destruction and is associated with ion homeostasis dysregulation and chronic inflammation. 73 Gerhalter et al studied 13 patients with DMD and found that TSC (26.0 ± 1.3 mM, P < 0.05) and ICS (0.69 ± 0.05 a.u., P < 0.05) were elevated in DMD compared to healthy controls (16.5 ± 1.3 mM and 0.47 ± 0.04 a.u.). The ICS was frequently abnormal in DMD compared to heathy controls, and was present even in the absence of fatty degenerative changes and water T2 increases 73 (Fig. 3). One explanation for the observed increased ICS and TSC values despite normal water T2 values might be that sodium MRI is more sensitive in the detection of dystrophic changes. Since there were no significant changes in the ICS/TSC ratio between the healthy and dystrophic muscle, this observation could be compatible with two concurrent phenomena: an increase in the intracellular sodium and an increase of the extracellular volume fraction.
FIGURE 3.

Illustration of (a) fat fraction maps, (b) water T2 maps, (c) DW 23Na images, and (d) IR 23Na images in the leg of 7‐year‐old, 9‐year‐old, and 11‐year‐old DMD patients, as well as a 10‐year‐old control. For 23Na MRI, four reference tubes were used (1, 40 mM NaCl; 2, 40 mM NaCl, and 5% agarose gel; 3, 20 mM NaCl; 4, 20 mM NaCl, and 5% agarose gel). The leg muscles of DMD patients showed generally elevated FF, water T2, and sodium signals compared with age‐matched controls. While the 7‐year‐old DMD patient exhibited slightly elevated FF (mean FF 0.08 ± 0.04), the FF was much higher in the muscles of the 11‐year‐old DMD patient (mean FF 0.19 ± 0.1), who was not able to walk more than 10 m without human assistance. Increased total sodium and intracellular‐weighted sodium signals are also visible in the dystrophic muscle tissue with normal T2 and FF values (figure reproduced from Ref. 73 with permission from Wiley).
Hypertension
Quantitative 23Na‐MRI in muscle may be used to assess an increase in body sodium content due to high blood pressure (HBP). Kopp et al found a 29% increase in 23Na content in patients with aldosteronism associated with hypertension compared to healthy subjects. 74 , 75 Although the authors stated that the achieved resolution (3 × 3 × 30) mm3 was adequate, they considered it as unsatisfactory for the skin sodium concentration evaluations. However, the authors' aim was to test the basic hypothesis about Na+ storage in muscle, and particularly, in skin, without apparent accompanying fluid retention. Linz et al developed a dedicated, two‐channel transceiver RF coil array for skin measurements and performed sodium imaging in humans with a gradient echo sequence and 0.9 × 0.9 × 30 mm3 resolution at 7.0T. 76 Skin sodium concentration results showed a discrepancy between the Na+ content obtained in vivo at 3.0T vs. 7.0T. The inconsistency could be the result of the higher spatial resolution at 7.0T, which may compensate for the PVE that occurred at the lower field strength. Submillimeter image resolution, achievable on ultrahigh MR systems, should provide a better understanding of the physiological processes related to HBP in the future.
Cardiac 23Na MRI
Technical Considerations
Sodium is an essential ion for myocyte function and integrity. It plays an important role in balancing osmotic pressure through the sodium–potassium pump. The concentration of extracellular sodium is ~10 times higher than that of the intracellular concentration to provide proper muscle excitation, conduction, and contraction. The pathological change in TSC and the impairment of sodium flux often occurs in hypertrophic myopathies, ischemic cardiac diseases, and infarction. Hence, 23Na‐MRI provides a valuable and powerful imaging tool for the detection of sodium concentration in heart muscle in vivo. However, similar to other sodium MR applications, cardiac sodium MR faces many issues related to physical and technical obstacles. An article published by Bottomley provided a critical review of the properties, methods, and potential clinical applications of 23Na‐MRI in the human heart. 7
Cardiac 23Na‐MRI studies may be performed on MRI scanners from 1.5–7.0T with a spatial resolution in the range of 100–1000 mm3, typically 160 mm3 at 3.0T in a 10‐minute measurement time. 7 , 77 The relatively short T1 relaxation in heart muscle allows for further scan time shortening by increasing the number of signal averages. The 23Na signal in heart tissue usually exhibits a bicomponent decay, with an ~40% fast component (T2f, ranging from 0.5–4 msec) and a 60% slow component (T2s, ranging from 12–32 msec). 78 , 79 , 80 With conventional MR techniques using an echo time (TE) longer than 3 msec, the majority of T2f is lost; however, using short‐ and ultrashort MR sequences, the TSC can be measured quite precisely and the values match the assay. 78
For clinical applications, it would be desirable to separate intracellular sodium, typically 10–15 mM and extracellular sodium, typically 135–150 mM. The theory that attributes intra‐ and extracellular sodium to T2f and T2s is controversially discussed in the literature, as there is a lack of solid evidence to prove this theory. There is even some evidence against this theory, suggesting that, from an NMR point of view, the 23Na ion is similar inside the cell and outside the cell. 81 The sodium signal is a relative value determined by a combination of many factors, such as T1, T2, B1,, and B0 field homogeneity, and is linearly correlated with sodium concentration in heart muscle tissue. It is also possible to measure absolute TSC in the heart using reference tubes with a known sodium concentration. These reference tubes are scanned either separately with the same protocol or in the field of view of an actual 23 Na‐MRI measurement of the heart, taking into account the coil sensitivity. There have also been attempts to use an internal reference that does not change between subjects, eg, myocardial and ventricular blood ratio; however, a direct relation to TSC has not, as yet, been validated. 82 To acquire the best possible 23Na signal, dedicated transmit/receive resonators should be used. Some of these are commercially available, 83 , 84 but many research groups rely on custom‐made, dedicated cardiac coils. 7 , 64 , 85 Boehmert et al built a dedicated 4/4 channel 1H/23Na coil with high B1 + homogeneity and penetration depth to investigate the cardiorenal syndrome. 86 The complexity of the dedicated resonators grows with the field strength. Typically, a surface coil design is preferred, with the diameter approximately equal to the depth of interest, which is 10–15 cm. Another option for increasing 23Na SNR is phased array surface coils; however, multichannel 23Na‐MRI is required, which is available on only a small number of MR scanners installed worldwide. 85 , 87
To acquire the maximum sodium signal from the heart and allow for TSC quantification, MR sequences with short TEs are necessary. 64 , 77 , 79 Typically, 3D projection reconstruction techniques are used, with a hard excitation pulse followed by a constant gradient. To acquire an optimal SNR, the projection increment is 111°, referred to as the “golden ratio.” 79 , 88 Other possible trajectories are twisted projection imaging 16 and spiral imaging. 89 As hard pulses are very sensitive to B1 inhomogeneity, adiabatic pulses are alternatively used to provide a B1‐independent excitation. Cardiac motion is also a pitfall for 23Na‐MRI sequences, and electrocardiography (ECG) gating, as often used in 1H cardiac imaging, is not helpful because the advantage of the short T1 of 23Na would be lost. Therefore, either only motion‐quiet frames are acquired 84 , 90 or retrospective ECG gating is used. 90 , 91
Preclinical and Clinical Studies
Animal models provide an important step toward understanding the physiology and pathology of sodium in the heart, although the small structures present considerable technical challenges. 78 , 92 , 93 , 94 However, it is possible to compensate for the lower SNR by using small‐bore, ultrahigh‐field MR scanners. Neuberger et al used a 17.6T animal scanner to acquire high‐resolution sodium images of the mouse heart. 93 The sodium SNR in the left ventricle, the right ventricle, the left ventricular free wall, and the septum was found to be 9.2 ± 2.3, 8.3 ± 2.06, 3.8 ± 1.0, and 5.6 ± 1.4, respectively. In another study, sodium imaging and spectroscopy was investigated for use as a potential marker with which to assess viability after low‐flow ischemia, using a rat heart model. 92 Intracellular sodium image intensity increased significantly during ischemia of the left side, whereas that of the right side remained unchanged; however, total sodium image intensity remained unchanged in both sides of the heart.
23Na‐MRI offers a tool with which to study myocardial ion homeostasis in vivo and can be used for different areas of cardiovascular disease. Most of the clinical studies are related to the investigation of sodium levels in myocardial infarction (MI). In a feasibility study by Standstede et al, the elevated sodium signal was observed in the myocardium affected by acute infarction (60.6 ± 21.6) compared to healthy controls (37.2 ± 12.8); however, no statistically significant increase was measured in infarcted myocardium in the subacute and the chronic groups. 95 To acquire the sodium signal from the heart, an ECG‐triggered, 3D, spoiled gradient‐echo (fast low‐angle shot) sequence with a TE of 3.1 msec was used. In a follow‐up study, the same authors monitored 12 patients on days 4, 14, and 90 after infarction and found an increase in the sodium signal of 39 ± 18, 31 ± 17, and 28 ± 13 [%], respectively, suggesting that 23Na‐MRI may be an applicable method for imaging nonviable myocardium in vivo. 84 Absolute TSC was measured in 20 patients with a history of prior MI using a 150 mmol/L Na+ concentration reference and a coregistration to 1H images acquired with a contrast agent. 90 Although the TSC was elevated by ~30% in patients compared to healthy controls, TSC does not appear to be linked to infarct age or size or to global ventricular function. Quantitative sodium MRI is heavily influenced by cardiac and respiratory motion, PVEs, and inhomogeneity of the static magnetic field, as well as of the transmit and receive field. Lott et al showed that a thorough correction for these influences provides more accurate TSC results from the heart, albeit somewhat lower compared to uncorrected values (Fig. 4). 96 Christa et al measured increased myocardial sodium SI in Conn's syndrome, which is manifested by hyperaldosteronemia that results in an alteration of sodium and potassium levels. 97 They used a 3D gradient echo sequence with a TR of 100 msec; a TE of 2.01 msec; flip angle 90°; field of view (FOV) 500 × 500 × 200 mm3; which provided an acquisition matrix of 128 × 128 × 10, with a resolution of 3.9 × 3.9 × 20 mm3; and eight signal averages; resulting in a total acquisition time of 17 minutes. Patients with Conn's syndrome exhibited significantly higher relative sodium signal intensities in the myocardium compared to healthy controls (0.31, ranging from 0.26–0.34) vs. 0.24 (ranging from 0.20–0.27). The results suggest that the myocardium is, along with skeletal muscle and skin, another possible sodium storage site, and 23Na MRI can be used to monitor patients who are undergoing treatment for an aldosterone excess.
FIGURE 4.

An example of proton and sodium images with segmentation masks used for quantification and postprocessing. (a) 1H MRI image (with navigator stripes) before registration. (b) 23Na MRI with corresponding masks (red = blood mask, green = myocardial mask) based on the 1H image. (c) Simulated 23Na MRI of the heart based on 1H masks. (d) 1H MRI image after registration. (e) Registered 1H image with cardiac 23Na MRI as an overlay. (f) Cardiac 23Na MRI (figure adapted from Ref. 96 and reproduced with permission from Wiley).
23Na ‐MRI in Kidney Function Evaluation
The most important role of the kidney is to maintain the overall fluid balance in the body. Renal function is determined by a proper regulation of extracellular sodium in the kidney, established by a sodium concentration gradient from the cortex to the medulla. The malfunction of the sodium concentration gradient may be caused by several different renal diseases, such as nephropathy, acute kidney failure, or irregular kidney function after transplantation.
A study by Haneder et al demonstrated the feasibility of in vivo 23Na imaging of human kidneys on a whole‐body, ultrahigh‐field MR system at 7.0T. Heathy subjects were examined using a 3D Cartesian spoiled gradient echo sequence with a variable echo time scheme with a nominal in‐plane resolution of 4 × 4 mm2 and a slice thickness of 5 mm. 98 These authors confirmed the validity of the concept of increasing the 23Na SNR or 23Na concentration from the renal cortex in the direction of the medullary pyramid. This concentration change is called the corticomedullary 23Na gradient and it is highly important for proper kidney function evaluation and for the detection of abnormalities.
Breast Tumors
Ultrasound (US) and mammography are the most‐used imaging modalities for breast lesion detection and characterization. However, the diagnostic accuracy of breast sonography examinations is low, and thus, US is usually recommended as a complementary technique to mammography or other imaging techniques. Mammography, however, is primarily advised for patients over 50 with less dense breast tissue. Low sensitivity and specificity, as well as accompanying ionizing radiation, are strong limitations of this imaging method. The development of noninvasive biochemical MRI techniques is, therefore, necessary, especially those that can define predictive biomarkers for breast cancer diagnosis and characterization with high sensitivity and specificity. One of those techniques that could provide supplementary information to conventional MRI, such as contrast‐based imaging techniques, is 23Na‐MRI, which is sensitive to sodium concentration changes in tissue as a reliable biomarker for cell viability and function. Thus, 23Na‐MRI may increase overall diagnostic accuracy and contribute to other established imaging methods for the monitoring of treatment efficacy. The technique has been shown to be feasible for the differentiation between malignant and healthy breast tissue and may prevent false‐positive and false‐negative findings in patients at high risk for malignancy (Fig. 5). Zaric et al recently showed that the increased field strength provides the increased sensitivity necessary to achieve an acceptable spatial resolution for the metabolic interpretation of the tissue under investigation. 99 These authors showed that the low 23Na content in healthy glandular breast tissue can be assessed using improved imaging techniques and hardware at 7.0T. The quantitative sodium MRI was performed using an AWSOS sequence. The measurement protocol was optimized, and sodium images with a 1.5 mm in‐plane resolution were acquired in ~16 minutes. It was shown that TSC in carcinomas is 28% and 49% higher compared to benign tumors and healthy glandular tissue, respectively. Lachner et al proposed an advanced CS reconstruction algorithm for radial 23Na multicoil data, applied to simulated and measured breast datasets. 100 For data acquisition, a DA‐3DPR pulse sequence, which enables more efficient k‐space sampling, can be used, as well as multicoil arrays that can further enhance the SNR. For the first time, CS was used for undersampled breast sodium data reconstruction. It was demonstrated that CS can be successfully implemented to reduce acquisition time and enhance image quality. Although CS reconstruction could utilize a conventional total variation (TV) denoising technique, it was shown that not only artifacts and noise are diminished, but also small‐tissue structures. As a possible solution, the authors proposed a method that adapts the TV using anatomical weighting factors, which represent known tissue boundaries (AnaWeTV). After inclusion of prior information from proton (1H) MRI into the CS reconstruction, image quality was further increased due to preserved tissue boundaries and PV effects. Since proton and sodium images are highly correlated, these weighting factors could be obtained from a high‐resolution 1H MR image and then transferred to 23Na images. Applied like this, CS reconstruction simultaneously maintained known tissue boundaries and reduced image artifacts. The method still has to be applied and validated in patients with breast lesions.
FIGURE 5.

A 60‐year‐old female patient with invasive ductal carcinoma (IDC) and a grade 3 proliferation (G3) in the lateral part of the left breast. (a) DIXON water image shows a heterogeneous lesion with irregular margins typical of malignant tumors, and (b) a corresponding color‐coded bilateral 23Na image corrected for coil sensitivity and obtained with a 3D radial projection sequence (DA‐3DPR).
Brain
The first clinical NMR images of cerebral sodium distribution in normal volunteers and in patients with a variety of pathological lesions were shown by Hilal et al in 1985. 101 Subsequently, many different studies explored the potential of using sodium MRI as a noninvasive imaging modality for biochemical investigations of brain tumors, stroke, and neurological disorders. The potential of a combination of sodium imaging with other imaging modalities, such as positron emission tomography (PET) in metabolic change studies connected with human brain pathologies, have been discussed in a review article by Shah et al. 9 High reproducibility and repeatability of cerebral 23Na‐MRI was recently reported by Meyer et al. 102
Brain Tumors
Two main histological properties of malignant tumors are increased angiogenesis and cell proliferation. Unregulated Na+/H+ exchange kinetics and altered Na+/K+‐ATPase activity may increase the number of cells, which then will lead to tumor genesis and growth. The amount of sodium inside the cell will rise and may be considered a biomarker of tumor malignancy. 103 One of the first 23Na‐MRI studies included 20 patients with brain gliomas, which reported elevated TSC levels for both tumors and surrounding tissues. 104 , 105 However, the changes in TSC in a tissue of interest may provide low specificity information on the origin of sodium signal changes and their connection to tumor malignancy. 106 Intracellular sodium signal that originates from Na+ ions with restricted mobility may be distinguished from extracellular sodium signal utilizing TQF sequences. There is currently a controversial discussion within the sodium MRI community regarding the last statement. According to Burstein et al, the intracellular sodium signal cannot be separated from extracellular sodium in human tissue. 29 The authors explain that, based on chemical kinetics principles, sodium ions in biological systems are not in a “bound” or a “mobile” state due to the fast relaxation rate constants they have.
To date, there is a limited number of publications that have dealt with an application of TQF 23Na imaging in patients with brain tumors. Initial reports have suggested a promising role for TQF 23Na‐MRI in discriminating vital parts of tumor, with high cell proliferation from areas of tumor necrosis. 24 , 107 One method allows simultaneous acquisition of TSC‐weighted, as well as TQF images (SISTINA), utilizing a sequence that interleaves an ultrashort TE, radial projection readout into the three‐pulse, triple‐quantum preparation, and was developed by Fiege et al. 107 A drawback of the SISTINA method was limited SNR and resolution; tumor images could not be analyzed without a proton reference image. Significant improvements of this technical issue can be achieved with improved readouts, such as DA‐3DPR or TPI sequences. Based on the DA‐3DPR sequence, Nagel et al earlier proposed a relaxation‐weighted (RW) 23Na‐MRI and applied it in patients with brain carcinomas. The results showed that RW 23Na imaging allows excellent differentiation between grade I–III and grade IV gliomas. 28 Neto et al recently performed a study with eight brain carcinoma patients before surgical, chemo, or radiation therapy treatment. Patients were scanned at 3.0T using a custom‐made double‐tuned (23Na/1H) head coil and a FLORET sequence, with and without fluid suppression by inversion recovery (IR). The authors generated maps of pseudo‐intracellular sodium concentration (C1), pseudo‐extracellular volume fraction (α2), apparent intracellular sodium concentration (aISC), and apparent total sodium concentration (aTSC). These parameters were significantly elevated in the normal‐appearing putamen compared to NAWM. Analysis of all solid tumors demonstrated a significant increase of aTSC and α2, and a significant decrease of aISC when compared with NAWM. 108 In a study published by Biller et al, 34 patients with brain tumors were examined with 23Na‐MRI, performed using a 7.0T MR system and a double‐tuned (1H/23Na) quadrature birdcage head coil, and the DA‐3DPR technique. 109 The results demonstrated that the initial sodium signal, measured in a brain tumor patient without any previous treatment, is a valuable predictor of isocitrate dehydrogenase (IDH) mutation status and tumor progression. The study confirmed a great potential for 23Na‐MRI for an improved and individualized approach in neuro‐oncology.
Ischemic Stroke
Changes in intracellular 23Na concentration are known to occur shortly after an ischemic insult due to impaired functioning of Na+/K+‐ATPase, which is responsible for human homeostasis. The role of 23Na‐MRI in identifying patients suitable for therapeutic intervention immediately after stroke may be crucial (Fig. 6). 16 , 110 , 111 , 112
FIGURE 6.
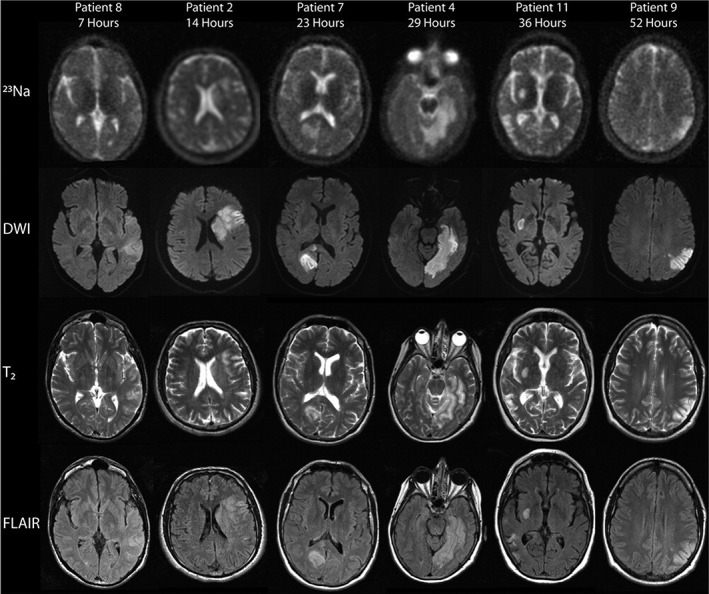
Representative sodium (23Na), diffusion‐weighted (DWI), T2‐weighted, and fluid‐attenuated inversion recovery (FLAIR) images from patients 7 to 52 hours after ischemic stroke onset. Areas of sodium signal intensity increase correspond to the lesions identified on DWI. The sodium signal intensity in the areas of ischemia qualitatively increased with time (figure reproduced from Ref. 112 with permission from Wiley).
Sodium MRI in Neurological Disorders
Multiple sclerosis (MS) is an inflammatory demyelinating disease that causes the development of focal and diffuse lesions in white matter (WM) and gray matter (GM). Chronically demyelinated MS lesions are accompanied by a substantially reduced axonal Na+/K+‐ATPase expression. 113 In vivo MRI studies using 23Na imaging showed increased brain TSC in patients with MS. Inglese et al performed a sodium MRI study at 3.0T, including patients with advanced relapsing–remitting MS, and applying a 3D radial gradient‐echo UTE sequence. 114 These authors quantified absolute TSC in a patient's lesions and several brain regions with normal‐appearing white and gray matter (NAWM and NAGM). The same measurement was performed in corresponding areas in controls. In MS patients, TSCs were higher in MS lesions compared to areas of NAWM. Also, TSC measured in NAWM were also significantly higher than those in corresponding WM regions in healthy controls. Further studies confirmed these findings. 115 , 116 , 117 , 118 In order to obtain more specific information, Petracca et al used a method that combined SQ and TQF MRI, to quantify TSC and the intracellular sodium molar fraction (ISMF) and then derived ISC and ISVF, an indirect measure of ESC. The results generated from 19 relapsing–remitting MS patients and 17 heathy controls showed that global TSC and ISC evaluated in GM were higher, while GM and WM ISVF (indirect measure of extracellular sodium concentration) were lower in patients compared with healthy controls. 119 In 11 patients with acute MS lesions, 1H and 23Na‐MRI examinations were performed at 3.0T. 120 Initial examinations showed that contrast‐enhancing lesions had high TSC, while, 4 weeks later, MRI TSC in these lesions was reduced. The authors of the study concluded that tissue structure is relatively preserved in the early stage of lesion progression. Stobbe et al investigated potential errors in TSC quantification in patients with primary progressive MS disease, often characterized by small lesions. 121 The authors found that signal from volumes‐of‐interest (VOIs) in large spheres (~10 cm3) was 20% higher than expected. In smaller VOIs (~0.35 cm3), the 23Na signal was even more underestimated (40–60%). This may be one of the most critical limitations of low‐resolution quantitative methods applied in evaluation of small lesions. A case–control study that included patients who suffered migraines was recently published by Meyer et al. 122 The results showed a significantly higher sodium concentration in cerebrospinal fluid (CSF) in migraine and tension‐type headache (TTH) patients compared with healthy controls (P = 0.007, P < 0.001, respectively). Alzheimer's disease (AD) is a chronic neurodegenerative disease accompanied by alterations of the sodium levels in brain due to cell death or loss of functional characteristics. The pathophysiological changes in a brain affected by AD can be measured with sodium MRI and may provide valuable additional information for early discovery of the disease. A small study of AD patients (n = 5) reported a 7.5% brain TSC increase with an inverse correlation to the volume of the hippocampus. 123 Another possible application for 23Na‐MRI is in Huntington's disease diagnosis. In patients with this neurological condition, the highest TSC was found in the caudate nucleus, which correlated with GM atrophy. 124 In a group of healthy subjects, neuroglial‐vascular mechanisms were studied by dynamic sodium imaging using a triple‐echo, 3D‐center‐out radial sequence at 7.0T. These authors demonstrated an activation in the left central regions, the supplementary motor areas, and the left cerebellum, manifested as an increase of the sodium signal at an ultrashort TE and a decrease of the signal at a long TE. 125 The presumption of the existence of “restricted” and “mobile” sodium ions and differences in the T2 relaxation times of sodium nuclei in the intra‐ and extracellular space is, however, still controversial. 29
Conclusion
The great potential of 23Na‐MRI has been extensively demonstrated. Several hundred publications have presented methodological and feasibility studies showing that 23Na‐MRI can serve as a reliable imaging tool for the diagnosis and treatment monitoring of many diseases. The future task of the scientific community is to continue to work on technical improvements of the technique to enable 23Na‐MRI to become an approved imaging modality for biochemical clinical investigations and to provide a better understanding of different pathophysiological conditions.
Acknowledgments
This study was funded by the Vienna Science and Technology Fund (WWTF; Project LS14‐096), the Austrian Science Fund (FWF, Project: KLIF 541‐B30), and VEGA2/0003/20 of the Scientific Grant Agency of the Ministry of Education, Science, Research, and Sports of the Slovak Republic and the Slovak Academy of Sciences.
References
- 1. Clausen MJ, Poulsen H. Sodium/potassium homeostasis in the cell. Met Ions Life Sci 2013;12:41‐67. [DOI] [PubMed] [Google Scholar]
- 2. McCarthy JV, Cotter TG. Cell shrinkage and apoptosis: A role for potassium and sodium ion efflux. Cell Death Differ 1997;4(8):756‐770. [DOI] [PubMed] [Google Scholar]
- 3. Bottomley PA. Sodium MRI in man: Technique and findings. eMagRes 2012;1:353‐366. [Google Scholar]
- 4. Pohmann R, Speck O, Scheffler K. Signal‐to‐noise ratio and MR tissue parameters in human brain imaging at 3, 7, and 9.4 Tesla using current receive coil arrays. Magn Reson Med 2016;75(2):801‐809. [DOI] [PubMed] [Google Scholar]
- 5. Ugurbil K. Magnetic resonance imaging at ultrahigh fields. IEEE Trans Biomed Eng 2014;61(5):1364‐1379. [DOI] [PMC free article] [PubMed] [Google Scholar]
- 6. Madelin G, Regatte RR. Biomedical applications of sodium MRI in vivo. J Magn Reson Imaging 2013;38(3):511‐529. [DOI] [PMC free article] [PubMed] [Google Scholar]
- 7. Bottomley PA. Sodium MRI in human heart: A review. NMR Biomed 2016;29(2):187‐196. [DOI] [PMC free article] [PubMed] [Google Scholar]
- 8. Zbyn S, Mlynárik V, Juras V, Szomolanyi P, Trattnig S. Evaluation of cartilage repair and osteoarthritis with sodium MRI. NMR Biomed 2016;29(2):206‐215. [DOI] [PubMed] [Google Scholar]
- 9. Shah NJ, Worthoff WA, Langen KJ. Imaging of sodium in the brain: A brief review. NMR Biomed 2016;29(2):162‐174. [DOI] [PubMed] [Google Scholar]
- 10. Wiggins GC, Brown R, Lakshmanan K. High‐performance radiofrequency coils for (23)Na MRI: Brain and musculoskeletal applications. NMR Biomed 2016;29(2):96‐106. [DOI] [PMC free article] [PubMed] [Google Scholar]
- 11. Bangerter NK, Kaggie JD, Taylor MD, Hadley JR. Sodium MRI radiofrequency coils for body imaging. NMR Biomed 2016;29(2):107‐118. [DOI] [PubMed] [Google Scholar]
- 12. Thulborn KR. Quantitative sodium MR imaging: A review of its evolving role in medicine. Neuroimage 2018;168:250‐268. [DOI] [PMC free article] [PubMed] [Google Scholar]
- 13. Hilal SK, Oh CH, Mun IK, Silver AJ. Sodium imaging. In: Stark DD, Bradley WG, editors. Magnetic resonance imaging. St Louis: Mosby; 1992. p 1091‐1110. [Google Scholar]
- 14. Nagel AM, Laun FB, Weber MA, Matthies C, Semmler W, Schad LR. Sodium MRI using a density‐adapted 3D radial acquisition technique. Magn Reson Med 2009;62(6):1565‐1573. [DOI] [PubMed] [Google Scholar]
- 15. Boada FE, Gillen JS, Shen GX, Chang SY, Thulborn KR. Fast three dimensional sodium imaging. Magn Reson Med 1997;37(5):706‐715. [DOI] [PubMed] [Google Scholar]
- 16. Lu AM, Atkinson IC, Claiborne TC, Damen FC, Thulborn KR. Quantitative sodium imaging with a flexible twisted projection pulse sequence. Magn Reson Med 2010;63(6):1583‐1593. [DOI] [PMC free article] [PubMed] [Google Scholar]
- 17. Romanzetti S, Mirkes CC, Fiege DP, Celik A, Felder J, Shah NJ. Mapping tissue sodium concentration in the human brain: A comparison of MR sequences at 9.4Tesla. Neuroimage 2014;96:44‐53. [DOI] [PubMed] [Google Scholar]
- 18. Qian Y, Boada FE. Acquisition‐weighted stack of spirals for fast high‐resolution three‐dimensional ultra‐short echo time MR imaging. Magn Reson Med 2008;60(1):135‐145. [DOI] [PMC free article] [PubMed] [Google Scholar]
- 19. Romanzetti S, Halse M, Kaffanke J, Zilles K, Balcom BJ, Shah NJ. A comparison of three SPRITE techniques for the quantitative 3D imaging of the 23Na spin density on a 4T whole‐body machine. J Magn Reson 2006;179(1):64‐72. [DOI] [PubMed] [Google Scholar]
- 20. Pipe JG, Zwart NR, Aboussouan EA, Robison RK, Devaraj A, Johnson KO. A new design and rationale for 3D orthogonally oversampled k‐space trajectories. Magn Reson Med 2011;66(5):1303‐1311. [DOI] [PubMed] [Google Scholar]
- 21. Pekar J, Renshaw PF, Leigh JS. Selective detection of intracellular sodium by coherence‐transfer NMR. J Magn Reson 1987;72:159‐161. [Google Scholar]
- 22. Tsang A, Stobbe RW, Beaulieu C. In vivo double quantum filtered sodium magnetic resonance imaging of human brain. Magn Reson Med 2015;73(2):497‐504. [DOI] [PubMed] [Google Scholar]
- 23. Gast LV, Gerhalter T, Hensel B, Uder M, Nagel AM. Double quantum filtered (23) Na MRI with magic angle excitation of human skeletal muscle in the presence of B0 and B1 inhomogeneities. NMR Biomed 2018;31(12):e4010. [DOI] [PubMed] [Google Scholar]
- 24. Hancu I, Boada FE, Shen GX. Three‐dimensional triple‐quantum‐filtered (23)Na imaging of in vivo human brain. Magn Reson Med 1999;42(6):1146‐1154. [DOI] [PubMed] [Google Scholar]
- 25. Tsang A, Stobbe RW, Beaulieu C. Triple‐quantum‐filtered sodium imaging of the human brain at 4.7 T. Magn Reson Med 2012;67(6):1633‐1643. [DOI] [PubMed] [Google Scholar]
- 26. Benkhedah N, Bachert P, Semmler W, Nagel AM. Three‐dimensional biexponential weighted (23)Na imaging of the human brain with higher SNR and shorter acquisition time. Magn Reson Med 2013;70(3):754‐765. [DOI] [PubMed] [Google Scholar]
- 27. Stobbe R, Beaulieu C. In vivo sodium magnetic resonance imaging of the human brain using soft inversion recovery fluid attenuation. Magn Reson Med 2005;54(5):1305‐1310. [DOI] [PubMed] [Google Scholar]
- 28. Nagel AM, Bock M, Hartmann C, et al. The potential of relaxation‐weighted sodium magnetic resonance imaging as demonstrated on brain tumors. Invest Radiol 2011;46(9):539‐547. [DOI] [PubMed] [Google Scholar]
- 29. Burstein D, Springer CS Jr. Sodium MRI revisited. Magn Reson Med 2019;82(2):521‐524. [DOI] [PubMed] [Google Scholar]
- 30. Qian Y, Stenger VA, Boada FE. Parallel imaging with 3D TPI trajectory: SNR and acceleration benefits. Magn Reson Imaging 2009;27(5):656‐663. [DOI] [PMC free article] [PubMed] [Google Scholar]
- 31. Benkhedah N, Hoffmann SH, Biller A, Nagel AM. Evaluation of adaptive combination of 30‐channel head receive coil array data in 23Na MR imaging. Magn Reson Med 2016;75(2):527‐536. [DOI] [PubMed] [Google Scholar]
- 32. Gnahm C, Nagel AM. Anatomically weighted second‐order total variation reconstruction of 23Na MRI using prior information from 1H MRI. Neuroimage 2015;105:452‐461. [DOI] [PubMed] [Google Scholar]
- 33. Behl NG, Gnahm C, Bachert P, Ladd ME, Nagel AM. Three‐dimensional dictionary‐learning reconstruction of (23)Na MRI data. Magn Reson Med 2016;75(4):1605‐1616. [DOI] [PubMed] [Google Scholar]
- 34. Utzschneider M, Behl NGR, Lachne S, et al. [Formula: see text] Accelerated quantification of tissue sodium concentration in skeletal muscle tissue: Quantitative capability of dictionary learning compressed sensing. Magnetic Resonance Materials in Physics, Biology and Medicine 2020;33:495‐505. epub ahead of print. [DOI] [PubMed] [Google Scholar]
- 35. Bangerter NK, Tarbox GJ, Taylor MD, Kaggie JD. Quantitative sodium magnetic resonance imaging of cartilage, muscle, and tendon. Quant Imaging Med Surg 2016;6(6):699‐714. [DOI] [PMC free article] [PubMed] [Google Scholar]
- 36. Lommen J, Konstandin S, Krämer P, Schad LR. Enhancing the quantification of tissue sodium content by MRI: Time‐efficient sodium B1 mapping at clinical field strengths. NMR Biomed 2016;29(2):129‐136. [DOI] [PubMed] [Google Scholar]
- 37. Niesporek SC, Hoffmann SH, Berger MC, et al. Partial volume correction for in vivo (23)Na‐MRI data of the human brain. Neuroimage 2015;112:353‐363. [DOI] [PubMed] [Google Scholar]
- 38. Gast LV, Henning A, Hensel B, Uder M, Nagel AM. Localized B0 shimming based on (23) Na MRI at 7 T. Magn Reson Med 2020;83(4):1339‐1347. [DOI] [PubMed] [Google Scholar]
- 39. Brown R, Madelin G, Lattanzi R, et al. Design of a nested eight‐channel sodium and four‐channel proton coil for 7T knee imaging. Magn Reson Med 2013;70(1):259‐268. [DOI] [PMC free article] [PubMed] [Google Scholar]
- 40. Brown R, Lakshmanan K, Madelin G, et al. A flexible nested sodium and proton coil array with wideband matching for knee cartilage MRI at 3T. Magn Reson Med 2016;76(4):1325‐1334. [DOI] [PMC free article] [PubMed] [Google Scholar]
- 41. Ianniello, C. , Madelin G, Lakshmanan K, Zhang B, Moy L, Brown R, Design and performance of a dual tuned 7 T proton/sodium breast coil. In: 2017 International Conference on Electromagnetics in Advanced Applications (ICEAA). Verona, Italy: Institute of Electrical and Electronics Engineers (IEEE); 2017:1890‐1893. [Google Scholar]
- 42. Ianniello C, Madelin G, Moy L, Brown R. A dual‐tuned multichannel bilateral RF coil for (1) H/(23) Na breast MRI at 7 T. Magn Reson Med 2019;82(4):1566‐1575. [DOI] [PMC free article] [PubMed] [Google Scholar]
- 43. Lakshmanan K, Brown R, Madelin G, Qian Y, Boada F, Wiggins GC. An eight‐channel sodium/proton coil for brain MRI at 3 T. NMR Biomed 2018;31(2):1‐9. [DOI] [PMC free article] [PubMed] [Google Scholar]
- 44. Wetterling F, Corteville DM, Kalayciyan R, et al. Whole body sodium MRI at 3T using an asymmetric birdcage resonator and short echo time sequence: First images of a male volunteer. Phys Med Biol 2012;57(14):4555‐4567. [DOI] [PubMed] [Google Scholar]
- 45. Shajan G, Mirkes C, Buckenmaier K, Hoffmann J, Pohmann R, Scheffler K. Three‐layered radio frequency coil arrangement for sodium MRI of the human brain at 9.4 Tesla. Magn Reson Med 2016;75(2):906‐916. [DOI] [PubMed] [Google Scholar]
- 46. Kempson GE, Muir H, Swanson SA, Freeman MA. Correlations between stiffness and the chemical constituents of cartilage on the human femoral head. Biochim Biophys Acta 1970;215(1):70‐77. [DOI] [PubMed] [Google Scholar]
- 47. Mankin HJ. Biochemical and metabolic aspects of osteoarthritis. Orthop Clin North Am 1971;2(1):19‐31. [PubMed] [Google Scholar]
- 48. Zbyn S, Brix MO, Juras V, et al. Sodium magnetic resonance imaging of ankle joint in cadaver specimens, volunteers, and patients after different cartilage repair techniques at 7 T: Initial results. Invest Radiol 2015;50(4):246‐254. [DOI] [PMC free article] [PubMed] [Google Scholar]
- 49. Trattnig S, Welsch GH, Juras V, et al. 23Na MR imaging at 7 T after knee matrix‐associated autologous chondrocyte transplantation preliminary results. Radiology 2010;257(1):175‐184. [DOI] [PubMed] [Google Scholar]
- 50. Schmitt B, Zbýň Š, Stelzeneder D, et al. Cartilage quality assessment by using glycosaminoglycan chemical exchange saturation transfer and (23)Na MR imaging at 7 T. Radiology 2011;260(1):257‐264. [DOI] [PubMed] [Google Scholar]
- 51. Zbyn S, Stelzeneder D, Welsc GH, et al. Evaluation of native hyaline cartilage and repair tissue after two cartilage repair surgery techniques with 23Na MR imaging at 7 T: Initial experience. Osteoarthr Cartil 2012;20(8):837‐845. [DOI] [PubMed] [Google Scholar]
- 52. Marlovits S, Singer P, Zeller P, Mandl I, Haller J, Trattnig S. Magnetic resonance observation of cartilage repair tissue (MOCART) for the evaluation of autologous chondrocyte transplantation: Determination of interobserver variability and correlation to clinical outcome after 2 years. Eur J Radiol 2006;57(1):16‐23. [DOI] [PubMed] [Google Scholar]
- 53. Madelin G, Lee JS, Inati S, Jerschow A, Regatte RR. Sodium inversion recovery MRI of the knee joint in vivo at 7T. J Magn Reson 2010;207(1):42‐52. [DOI] [PMC free article] [PubMed] [Google Scholar]
- 54. Tochigi Y, Buckwalter JA, Martin JA, et al. Distribution and progression of chondrocyte damage in a whole‐organ model of human ankle intra‐articular fracture. J Bone Joint Surg Am 2011;93(6):533‐539. [DOI] [PMC free article] [PubMed] [Google Scholar]
- 55. Millington SA, Li B, Tang J, et al. Quantitative and topographical evaluation of ankle articular cartilage using high resolution MRI. J Orthop Res 2007;25(2):143‐151. [DOI] [PubMed] [Google Scholar]
- 56. Wheaton AJ, Borthakur A, Dodge GR, Kneeland JB, Schumacher HR, Reddy R. Sodium magnetic resonance imaging of proteoglycan depletion in an in vivo model of osteoarthritis. Acad Radiol 2004;11(1):21‐28. [DOI] [PubMed] [Google Scholar]
- 57. Wheaton AJ, Borthakur A, Shapiro EM, et al. Proteoglycan loss in human knee cartilage: Quantitation with sodium MR imaging–feasibility study. Radiology 2004;231(3):900‐905. [DOI] [PubMed] [Google Scholar]
- 58. Zbyn S, Schreiner M, Juras V, et al. Assessment of low‐grade focal cartilage lesions in the knee with sodium MRI at 7 T: Reproducibility and short‐term, 6‐month follow‐up data. Investigative Radiology 2020;55 (7):430‐437. [DOI] [PubMed] [Google Scholar]
- 59. Ooms KJ, Cannella M, Vega AJ, Marcolongo M, Polenova T. 23Na TQF NMR imaging for the study of spinal disc tissue. J Magn Reson 2008;195(1):112‐115. [DOI] [PMC free article] [PubMed] [Google Scholar]
- 60. Ooms KJ, Cannella M, Vega AJ, Marcolongo M, Polenova T. The application of 23Na double‐quantum‐filter (DQF) NMR spectroscopy for the study of spinal disc degeneration. Magn Reson Med 2008;60(2):246‐252. [DOI] [PMC free article] [PubMed] [Google Scholar]
- 61. Wang C, McArdle E, Fenty M, et al. Validation of sodium magnetic resonance imaging of intervertebral disc. Spine (Phila Pa 1976) 2010;35(5):505‐510. [DOI] [PMC free article] [PubMed] [Google Scholar]
- 62. Urban JP, Winlove CP. Pathophysiology of the intervertebral disc and the challenges for MRI. J Magn Reson Imaging 2007;25(2):419‐432. [DOI] [PubMed] [Google Scholar]
- 63. Noebauer‐Huhmann IM, Juras V, Pfirrmann CWA, et al. Sodium MR imaging of the lumbar intervertebral disk at 7 T: Correlation with T2 mapping and modified Pfirrmann score at 3 T—Preliminary results. Radiology 2012;265(2):555‐564. [DOI] [PubMed] [Google Scholar]
- 64. Ouwerkerk R, Weiss RG, Bottomley PA. Measuring human cardiac tissue sodium concentrations using surface coils, adiabatic excitation, and twisted projection imaging with minimal T‐2 losses. J Magn Reson Imaging 2005;21(5):546‐555. [DOI] [PubMed] [Google Scholar]
- 65. Juras V, Zbýň Š, Pressl C, et al. Sodium MR imaging of Achilles tendinopathy at 7 T: Preliminary results. Radiology 2012;262(1):199‐205. [DOI] [PubMed] [Google Scholar]
- 66. Juras V, Winhofer Y, Szomolanyi P, et al. Multiparametric MR imaging depicts glycosaminoglycan change in the Achilles tendon during ciprofloxacin administration in healthy men: Initial observation. Radiology 2015;275(3):763‐771. [DOI] [PMC free article] [PubMed] [Google Scholar]
- 67. Bansal N, Szczepaniak L, Ternullo D, Fleckenstein JL, Malloy CR. Effect of exercise on (23)Na MRI and relaxation characteristics of the human calf muscle. J Magn Reson Imaging 2000;11(5):532‐538. [DOI] [PubMed] [Google Scholar]
- 68. Constantinides CD, Gillen JS, Boada FE, Pomper MG, Bottomley PA. Human skeletal muscle: Sodium MR imaging and quantification‐potential applications in exercise and disease. Radiology 2000;216(2):559‐568. [DOI] [PubMed] [Google Scholar]
- 69. Dyke JP, Meyring‐Wösten A, Zhao Y, Linz P, Thijssen S, Kotanko P. Reliability and agreement of sodium ((23)Na) MRI in calf muscle and skin of healthy subjects from the US. Clin Imaging 2018;52:100‐105. [DOI] [PubMed] [Google Scholar]
- 70. Gerhalter T, Gast LV, Marty B, Uder M, Carlier PG, Nagel AM. Assessing the variability of (23) Na MRI in skeletal muscle tissue: Reproducibility and repeatability of tissue sodium concentration measurements in the lower leg at 3 T. NMR Biomed 2020;33(5):e4279. [DOI] [PubMed] [Google Scholar]
- 71. Chang G, Wang L, Schweitzer ME, Regatte RR. 3D 23Na MRI of human skeletal muscle at 7 Tesla: Initial experience. Eur Radiol 2010;20(8):2039‐2046. [DOI] [PMC free article] [PubMed] [Google Scholar]
- 72. Nagel AM, Amarteifio E, Lehmann‐Horn F, et al. 3 Tesla sodium inversion recovery magnetic resonance imaging allows for improved visualization of intracellular sodium content changes in muscular channelopathies. Invest Radiol 2011;46(12):759‐766. [DOI] [PubMed] [Google Scholar]
- 73. Gerhalter T, Gast LV, Marty B, et al. (23) Na MRI depicts early changes in ion homeostasis in skeletal muscle tissue of patients with Duchenne muscular dystrophy. J Magn Reson Imaging 2019;50(4):1103‐1113. [DOI] [PubMed] [Google Scholar]
- 74. Kopp C, Linz P, Dahlmann A, et al. 23Na magnetic resonance imaging‐determined tissue sodium in healthy subjects and hypertensive patients. Hypertension 2013;61(3):635‐640. [DOI] [PubMed] [Google Scholar]
- 75. Kopp C, Linz P, Wachsmuth L, et al. (23)Na magnetic resonance imaging of tissue sodium. Hypertension 2012;59(1):167‐172. [DOI] [PubMed] [Google Scholar]
- 76. Linz P, Santoro D, Renz W, et al. Skin sodium measured with (2)(3)Na MRI at 7.0T. NMR Biomed 2015;28(1):54‐62. [DOI] [PubMed] [Google Scholar]
- 77. Gai ND, Rochitte C, Nacif MS, Bluemke DA. Optimized three‐dimensional sodium imaging of the human heart on a clinical 3T scanner. Magn Reson Med 2015;73(2):623‐632. [DOI] [PMC free article] [PubMed] [Google Scholar]
- 78. Constantinides CD, Kraitchman DL, O'Brien KO, Boada FE, Gillen J, Bottomley PA. Noninvasive quantification of total sodium concentrations in acute reperfused myocardial infarction using Na‐23 MRI. Magn Reson Med 2001;46(6):1144‐1151. [DOI] [PubMed] [Google Scholar]
- 79. Konstandin S, Schad LR. Two‐dimensional radial sodium heart MRI using variable‐rate selective excitation and retrospective electrocardiogram gating with golden angle increments. Magn Reson Med 2013;70(3):791‐799. [DOI] [PubMed] [Google Scholar]
- 80. Pabst T, Sandstede J, Beer M, Kenn W, Neubauer S, Hahn D. Sodium T‐2* relaxation times in human heart muscle. J Magn Reson Imaging 2002;15(2):215‐218. [DOI] [PubMed] [Google Scholar]
- 81. Chang DC, Woessner DE. Spin‐echo study of Na‐23 relaxation in skeletal‐muscle — Evidence of sodium ion binding inside a biological cell. J Magn Reson 1978;30(2):185‐191. [Google Scholar]
- 82. Pabst T, Sandstede J, Beer M, et al. Optimization of ECG‐triggered 3D Na‐23 MRI of the human heart. Magn Reson Med 2001;45(1):164‐166. [DOI] [PubMed] [Google Scholar]
- 83. Nielles‐Vallespin S, Weber MA, Bock M, et al. 3D radial projection technique with ultrashort echo times for sodium MRI: Clinical applications in human brain and skeletal muscle. Magn Reson Med 2007;57(1):74‐81. [DOI] [PubMed] [Google Scholar]
- 84. Sandstede JJW, Hillenbrand H, Beer M, et al. Time course of Na‐23 signal intensity after myocardial infarction in humans. Magn Reson Med 2004;52(3):545‐551. [DOI] [PubMed] [Google Scholar]
- 85. Lee RF, Giaquinto R, Constantinides C, Souza S, Weiss RG, Bottomley PA. A broadband phased‐array system for direct phosphorus and sodium metabolic MRI on a clinical scanner. Magn Reson Med 2000;43(2):269‐277. [DOI] [PubMed] [Google Scholar]
- 86. Boehmert L, Waiczies H, Kuehne A, et al. Cardiorenal sodium MRI in small rodents using a quadrature birdcage volume resonator at 9.4 T. Magnetic Resonance Materials in Physics, Biology and Medicine 2019;33:121‐130. [DOI] [PubMed] [Google Scholar]
- 87. Noeske R, Seifert F, Rhein KH, Rinneberg H. Human cardiac imaging at 3 T using phased array coils. Magn Reson Med 2000;44(6):978‐982. [DOI] [PubMed] [Google Scholar]
- 88. Winkelmann S, Schaeffter T, Koehler T, Eggers H, Doessel O. An optimal radial profile order based on the golden ratio for time‐resolved MRI. IEEE Trans Med Imaging 2007;26(1):68‐76. [DOI] [PubMed] [Google Scholar]
- 89. Foltz WD, al‐Kwifi O, Sussman MS, Stainsby JA, Wright GA. Optimized spiral imaging for measurement of myocardial T‐2 relaxation. Magn Reson Med 2003;49(6):1089‐1097. [DOI] [PubMed] [Google Scholar]
- 90. Ouwerkerk R, Bottomley PA, Solaiyappan M, et al. Tissue sodium concentration in myocardial infarction in humans: A quantitative Na‐23 MR imaging study. Radiology 2008;248(1):88‐96. [DOI] [PMC free article] [PubMed] [Google Scholar]
- 91. Resetar A, Hoffmann SH, Graessl A, et al. Retrospectively‐gated CINE Na‐23 imaging of the heart at 7.0 Tesla using density‐adapted 3D projection reconstruction. Magn Reson Imaging 2015;33(9):1091‐1097. [DOI] [PubMed] [Google Scholar]
- 92. Jansen MA, van Emous JG, Nederhoff MGJ, van Echteld CJA. Assessment of myocardial viability by intracellular Na‐23 magnetic resonance imaging. Circulation 2004;110(22):3457‐3464. [DOI] [PubMed] [Google Scholar]
- 93. Neuberger T, Greiser A, Nahrendorf M, Jakob PM, Faber C, Webb AG. Na‐23 microscopy of the mouse heart in vivo using density‐weighted chemical shift imaging. Magn Reson Mater Phys Biol Med 2004;17(3–6):196‐200. [DOI] [PubMed] [Google Scholar]
- 94. Vanechteld CJA, Kirkels JH, Eijgelshoven MHJ, van der Meer P, Ruigrok TJC. Intracellular sodium during ischemia and calcium‐free perfusion — A Na‐23 NMR‐study. J Mol Cell Cardiol 1991;23(3):297‐307. [DOI] [PubMed] [Google Scholar]
- 95. Sandstede JJ, Pabst T, Beer M, et al. Assessment of myocardial infarction in humans with (23)Na MR imaging: Comparison with cine MR imaging and delayed contrast enhancement. Radiology 2001;221(1):222‐228. [DOI] [PubMed] [Google Scholar]
- 96. Lott J, Platt T, Niesporek SC, et al. Corrections of myocardial tissue sodium concentration measurements in human cardiac Na‐23 MRI at 7 Tesla. Magn Reson Med 2019;82(1):159‐173. [DOI] [PubMed] [Google Scholar]
- 97. Christa M, Weng AM, Geier B, et al. Increased myocardial sodium signal intensity in Conn's syndrome detected by Na‐23 magnetic resonance imaging. Eur Heart J‐Cardiovasc Imag 2019;20(3):263‐270. [DOI] [PMC free article] [PubMed] [Google Scholar]
- 98. Haneder S, Juras V, Michaely HJ, et al. In vivo sodium (Na‐23) imaging of the human kidneys at 7 T: Preliminary results. Eur Radiol 2014;24(2):494‐501. [DOI] [PubMed] [Google Scholar]
- 99. Zaric O, Pinker K, Zbyn S, et al. Quantitative sodium MR imaging at 7 T: Initial results and comparison with diffusion‐weighted imaging in patients with breast tumors. Radiology 2016;280(1):39‐48. [DOI] [PubMed] [Google Scholar]
- 100. Lachner S, Zaric O, Utzschneider M, et al. Compressed sensing reconstruction of 7 Tesla (23)Na multichannel breast data using (1)H MRI constraint. Magn Reson Imaging 2019;60:145‐156. [DOI] [PubMed] [Google Scholar]
- 101. Hilal SK, Maudsley AA, Ra JB, et al. Invivo NMR imaging of Na‐23 in the human head. J Comput Assist Tomogr 1985;9(1):1‐7. [DOI] [PubMed] [Google Scholar]
- 102. Meyer MM, Haneder S, Konstandin S, et al. Repeatability and reproducibility of cerebral (23)Na imaging in healthy subjects. BMC Med Imaging 2019;19(1):26. [DOI] [PMC free article] [PubMed] [Google Scholar]
- 103. Boada FE, LaVerde G, Jungreis C, Nemoto E, Tanase C, Hancu I. Loss of cell ion homeostasis and cell viability in the brain: What sodium MRI can tell us. Curr Top Dev Biol 2005;70:77‐101. [DOI] [PubMed] [Google Scholar]
- 104. Ouwerkerk R, Bleich KB, Gillen JS, Pomper MG, Bottomley PA. Tissue sodium concentration in human brain tumors as measured with Na‐23 MR imaging. Radiology 2003;227(2):529‐537. [DOI] [PubMed] [Google Scholar]
- 105. Ouwerkerk R, Pomper MG, Bottomley PA. Quantitative 3D sodium MRI of brain tumors. Radiology 2001;221:294‐294. [Google Scholar]
- 106. Gilles A, Nagel AM, Madelin G. Multipulse sodium magnetic resonance imaging for multicompartment quantification: Proof‐of‐concept. Sci Rep 2017;7(1):17435. [DOI] [PMC free article] [PubMed] [Google Scholar]
- 107. Fiege DP, Romanzetti S, Mirkes CC, Brenner D, Shah NJ. Simultaneous single‐quantum and triple‐quantum‐filtered MRI of 23Na (SISTINA). Magn Reson Med 2013;69(6):1691‐1696. [DOI] [PubMed] [Google Scholar]
- 108. Neto LPN, Madelin G, Sood TP, et al. Quantitative sodium imaging and gliomas: A feasibility study. Neuroradiology 2018;60(8):795‐802. [DOI] [PMC free article] [PubMed] [Google Scholar]
- 109. Biller A, Badde S, Nagel A, et al. Improved brain tumor classification by sodium MR imaging: Prediction of IDH mutation status and tumor progression. AJNR Am J Neuroradiol 2016;37(1):66‐73. [DOI] [PMC free article] [PubMed] [Google Scholar]
- 110. Tsang A, Stobbe RW, Asdaghi N, et al. Relationship between sodium intensity and perfusion deficits in acute ischemic stroke. J Magn Reson Imaging 2011;33(1):41‐47. [DOI] [PubMed] [Google Scholar]
- 111. Thulborn KR, Davis D, Snyder J, Yonas H, Kassam A. Sodium MR imaging of acute and subacute stroke for assessment of tissue viability. Neuroimaging Clin N Am 2005;15(3):639‐653. [DOI] [PubMed] [Google Scholar]
- 112. Hussain MS, Stobbe RW, Bhagat YA, et al. Sodium imaging intensity increases with time after human ischemic stroke. Ann Neurol 2009;66(1):55‐62. [DOI] [PubMed] [Google Scholar]
- 113. Young EA, Fowler CD, Kidd GJ, et al. Imaging correlates of decreased axonal Na+/K+ ATPase in chronic multiple sclerosis lesions. Ann Neurol 2008;63(4):428‐435. [DOI] [PubMed] [Google Scholar]
- 114. Inglese M, Madelin G, Herbert J. Quantitative tissue sodium concentration mapping in multiple sclerosis with sodium magnetic resonance imaging. Neurology 2008;70(11):A6‐A6. [Google Scholar]
- 115. Zaaraoui W, Konstandin S, Audoin B, et al. Distribution of brain sodium accumulation correlates with disability in multiple sclerosis: A cross‐sectional 23Na MR imaging study. Radiology 2012;264(3):859‐867. [DOI] [PubMed] [Google Scholar]
- 116. Huhn K, Mennecke A, Linz P, et al. (23)Na MRI reveals persistent sodium accumulation in tumefactive MS lesions. J Neurol Sci 2017;379:163‐166. [DOI] [PubMed] [Google Scholar]
- 117. Huhn K, Engelhorn T, Linker RA, Nagel AM. Potential of sodium MRI as a biomarker for neurodegeneration and Neuroinflammation in multiple sclerosis. Front Neurol 2019;10:84. [DOI] [PMC free article] [PubMed] [Google Scholar]
- 118. Maarouf A, Audoin B, Konstandin S, et al. Topography of brain sodium accumulation in progressive multiple sclerosis. MAGMA 2014;27(1):53‐62. [DOI] [PubMed] [Google Scholar]
- 119. Petracca M, Vancea RO, Fleysher L, Jonkman LE, Oesingmann N, Inglese M. Ultra‐high field MRI of intra‐ and extra‐cellular sodium concentration in multiple sclerosis. Mult Scler J 2014;20:276‐276. [Google Scholar]
- 120. Eisele P, Konstandin S, Szabo K, et al. Temporal evolution of acute multiple sclerosis lesions on serial sodium ((23)Na) MRI. Mult Scler Relat Disord 2019;29:48‐54. [DOI] [PubMed] [Google Scholar]
- 121. Stobbe RW, Beaulieu C. Calculating potential error in sodium MRI with respect to the analysis of small objects. Magn Reson Med 2018;79(6):2968‐2977. [DOI] [PubMed] [Google Scholar]
- 122. Meyer MM, Schmidt A, Benrath J, et al. Cerebral sodium ((23)Na) magnetic resonance imaging in patients with migraine —A case‐control study. Eur Radiol 2019;29(12):7055‐7062. [DOI] [PMC free article] [PubMed] [Google Scholar]
- 123. Mellon EA, Pilkinton DT, Clark CM, et al. Sodium MR imaging detection of mild Alzheimer disease: Preliminary study. AJNR Am J Neuroradiol 2009;30(5):978‐984. [DOI] [PMC free article] [PubMed] [Google Scholar]
- 124. Reetz K, Romanzetti S, Dogan I, et al. Increased brain tissue sodium concentration in Huntington's disease — A sodium imaging study at 4 T. Neuroimage 2012;63(1):517‐524. [DOI] [PubMed] [Google Scholar]
- 125. Bydder M, Zaaraoui W, Ridley B, et al. Dynamic (23)Na MRI — A non‐invasive window on neuroglial‐vascular mechanisms underlying brain function. Neuroimage 2019;184:771‐780. [DOI] [PubMed] [Google Scholar]