

Abstract
BACKGROUND/OBJECTIVES:
Several longitudinal studies in high-income countries suggest that depression increases stroke risk. However, few prior studies have evaluated this association in low- and middle-income countries (LMICs), where rapidly aging populations may have markedly different vascular risk profiles.
DESIGN:
Prospective cohort study.
SETTING:
The Mexican Health and Aging Study is a national population-based study of older adults in Mexico.
PARTICIPANTS:
A total of 10,693 Mexican adults aged 50 and older enrolled in 2001 with no history of prior stroke.
MEASUREMENTS:
Depressive symptoms were assessed with a modified 9-item Centers for Epidemiologic Studies Depression Scale (elevated depressive symptom cutoff ≥5) in 2001 and 2003. We evaluated associations between baseline and short-term (2-year) changes in elevated depressive symptoms (categorized as stable low, recently remitted, recent-onset, or stable high symptoms) with incident self-reported or next-of-kin reported doctor-diagnosed stroke through 2015 using Cox proportional hazards models and sensitivity analyses applying inverse probability weights.
RESULTS:
Over an average follow-up of 11.4 years (standard deviation = 4.2), 10,693 respondents reported 546 incident strokes. Individuals with elevated baseline depressive symptoms experienced a moderately higher hazard of incident stroke (hazard ratio [HR] = 1.13; 95% confidence interval [CI] = .95–1.36) compared with those without elevated baseline depressive symptoms. In analyses of short-term changes in elevated depressive symptoms (n = 8,808; 414 incident stokes), participants with recent-onset (HR = 1.38; 95% CI = 1.06–1.81) or stable high (HR = 1.42; 95% CI = 1.10–1.84) elevated depressive symptoms had a greater hazard of incident stroke compared to those with stable low/no depressive symptoms, whereas recently remitted (HR = 1.01; 95% CI = .74–1.37) symptoms was not associated with stroke hazard.
CONCLUSION:
Strategies to reduce depressive symptoms merit evaluation as approaches to prevent stroke in middle-income countries. Findings are similar to those in high-income countries but should be replicated in other LMICs.
Keywords: aging, depression, epidemiology, stroke
Stroke is a leading cause of death and disability worldwide.1 Depression may contribute to increased stroke risk through several potential physiological pathways including neuroendocrine effects (eg, sympathetic nervous system activation, dysregulation of the hypothalamic–pituitary-adrenocortical axis, platelet aggregation dysfunction),2 behavioral changes, and immunological/inflammatory effects (eg, C-reactive protein, interleukin [IL]-1 and IL-6)3–5 resulting from depression. The association between depressive symptoms and increased risk of stroke in older adults has been well documented across previous studies but evaluated exclusively in high-income countries.6–10
Associations between depression and stroke documented in high-income countries may not generalize to low- and middle-income countries (LMICs) due to different vascular risk-factor patterns. For example, the prevalence of major stroke risk factors such as diabetes and hypertension has increased in LMICs in recent decades.11,12 Additionally, although stroke incidence decreased by 12% in high-income countries between 1990 and 2010, incidence increased by 12% in LMICs during the same period.13 Although depression has been examined among other risk factors for stroke in LMICs,14 no prospective studies have focused specifically on evaluating the effect of depressive symptoms on stroke. An understanding of the impacts of elevated depressive symptoms on stroke is critical for informing strategies and interventions for reducing stroke risk in LMICs experiencing a growing burden of chronic disease morbidity and facing limited resources for access to mental health care.15
The objective of this study was to analyze the effect of elevated depressive symptoms on the incidence of stroke using data from a national population-based study of older Mexican adults followed for up to 14 years. Following recent U.S.-based work, we also evaluated how changes in depressive symptoms relate to stroke risk, to better understand how interventions that treat depression may influence stroke risk.9,10 Specifically, we evaluated the effect of short-term patterns of change or stability in elevated depressive symptoms on incident stroke among older Mexican adults over a 12-year follow-up period.
Based on previous work in U.S.-based cohorts, we hypothesized that elevated depressive symptoms at baseline would be associated with elevated risk of incident stroke. We further expected greater stroke hazard among those with stable and remitted elevated depressive symptoms, with a smaller magnitude of association for those with remitted, compared with those with stable low/no elevated depressive symptoms over a 2-year period.
METHODS
Sample
Data were from the Mexican Health and Aging Study (MHAS), a national population-based cohort study of middle-aged and older Mexican adults.16 The 2001 baseline wave of the MHAS included a national sample of adults born before 1951, with follow-up interviews conducted in 2003, 2012, and 2015.
Full details of MHAS study design and implementation were previously published.16 Briefly, households with adults aged 50 and older were selected based on a multistage area probability sample; households were oversampled in Mexican states with high rates of outmigration to the United States.16 Within households, a target respondent and their spouse/cohabitating partner (regardless of age) were selected; proxy informants answered for respondents who could not respond on their own.
A total of 15,186 individuals were interviewed at baseline in 2001. We excluded individuals under 50 years of age (n = 1,723) and respondents whose questionnaires were completed by proxy informants at baseline (n = 978) because proxy informants did not answer questions about respondents’ depressive symptoms (Supplementary Figure S1). Respondents were also excluded if they self-reported a doctor-diagnosed stroke before baseline (n = 361), were missing baseline stroke information (n = 46), or reported never having seen a doctor in their lifetime and were therefore not asked about doctor-diagnosed stroke (n = 307).
For the baseline depressive symptoms analysis, we excluded respondents missing data on baseline depressive symptoms or covariates (n = 423) as well as participants who were lost to follow-up after the baseline interview and had no information about stroke incidence (n = 628). For the 2-year patterns of elevated depressive symptoms analysis, we further excluded participants that reported a stroke or had missing stroke information at 2-year follow-up (n = 90), respondents missing data on depressive symptoms at 2-year follow-up (n = 1,210), and those lost to follow-up after the 2-year follow-up interview (n = 573).
Study Measures
Depressive symptoms were measured using a 9-item version of the Center for Epidemiologic Studies Depression Scale (CES-D).17 The adaptation of the original 20-item CES-D scale for use in the MHAS follows changes made for the Health and Retirement Study (HRS) in the United States.18 For instance, the MHAS version includes a question about having “a lot of energy” that was added to the abbreviated eight-item version used in the HRS but is not part of the original CES-D scale. The MHAS version also uses a binary “yes/no” response rather than the four original response categories. Summary scores ranged from 0 to 9 with higher scores indicating more depressive symptoms. We generated a binary measure of elevated depressive symptoms using a cutoff of five symptoms (vs less than 5). The cutoff was based on a validation study of the 9-item adapted version using the Diagnostic and Statistical Manual of Mental Disorders. Fourth Edition, Text Revision in a separate clinic-based sample of older Mexican adults that showed optimal sensitivity (80.7%) and specificity (68.7%) for clinical depression diagnosis.19
We further assessed the effect of short-term patterns of elevated depressive symptoms by evaluating depressive symptoms at both baseline and 2-year follow-up. We classified respondents into four groups: (1) stable low/no (ie, no elevated depressive symptoms in either wave); (2) recently remitted (ie, elevated depressive symptoms at baseline but not 2-year follow-up); (3) new onset (ie, elevated depressive symptoms at 2-year follow-up but not baseline); and (4) stable high (ie, elevated depressive symptoms at both waves).
Incident doctor-diagnosed strokes were self-reported at each follow-up interview; prior research indicates high validity of self-reported stroke relative to medical records.20 Participants were asked, “Has a doctor or medical personnel ever told you that you have had a stroke?” Participants who responded “yes” were then asked to report the year of stroke. Survival time was defined as the number of years from baseline to year of incident stroke. When respondents reported having a stroke but did not report the year (n = 35), the interview year in which they reported the stroke was used as the stroke year. Participants who refused to answer or did not know whether they had been diagnosed with a stroke at their last interview (n = 19) were assigned person-time based on their last definitive report of stroke. In the case that a baseline study participant was not available for a direct interview at follow-up (due to illness or impairment), a proxy interview was conducted. If a baseline participant had died, a next-of-kin interview was conducted with an informed respondent. These individuals were asked to report doctor-diagnosed strokes and year of the most recent stroke for the deceased.
Potential confounders considered included respondent’s sex, age at baseline (in years), marital status (currently married/in a union vs widowed, divorced, or single), and highest level of education completed (none, some primary to primary, secondary or higher), individual-level monthly income quartile, whether their residential community was considered urban (≥100,000 population), and whether they were living in one of the six states with historically high outmigration to the United States, all collected at baseline.
We also considered indicators of self-reported doctor-diagnosed hypertension and diabetes at baseline as potential confounders. Although previous studies suggest that major metabolic diseases including hypertension and diabetes mellitus could partially mediate the association between major depressive disorder and all-cause stroke,21 temporality of exposure and these self-reported measures at baseline could not be established in our data. Therefore, we chose to account for potential confounding by variables that may also serve as mediators between depressive symptoms and stroke (ie, income, self-reported hypertension, and diabetes at baseline) via stabilized inverse probability of exposure weights described under sensitivity analyses.
Primary Analysis: Conventional Cox Proportional Hazards Models
We generated a log-minus-log Kaplan-Meier plot of stroke incidence by depressive symptoms and ran a Schoenfeld test to confirm the proportional hazards assumption (P = .37). We examined the distribution of demographic variables and verified that there were no influential observations.
We estimated the risk of incident stroke associated with depressive symptoms through two series of Cox proportional hazards models. The first series estimated hazard ratios (HRs) for baseline depressive symptoms and incident stroke adjusting for covariates through direct inclusion in models. The models sequentially adjusted for age and sex (model 2), and for additional demographic factors (education, marital status, urbanicity, and state of residence) measured at baseline (model 3). Follow-up for incident stroke began the year of the baseline interview. The second series of Cox models examined the association between 2-year (2001–2003) patterns of elevated depressive symptoms and incident stroke, again sequentially adjusting for age and sex (model 2) and additional demographics measured at baseline (model 3). For these models, follow-up for incident stroke began in 2003. Additional models evaluated heterogeneity by sex and age (<65 vs ≥65 years) at baseline. Follow-up time ended at the earliest year of self- or proxy-reported stroke, year of death for those who died without stroke, or last available interview for people who left the study without a stroke. All analyses were conducted using Stata v.15.
Sensitivity Analyses
To account for potential confounders that could have also been outcomes of elevated depressive symptoms, including income, hypertension, and diabetes, we re-estimated Cox models with stabilized inverse probability weighting (IPW).22 To account for selective survival and attrition, we applied IPW of attrition, and survival weights to a discrete-time survival model (ie, pooling each wave of outcome data and estimating a logistic regression model). (Supplementary Text S1 and S2 provide full details regarding IPWs and their implementation in these analyses.)
In ancillary analyses, we also evaluated associations between elevated depressive symptoms in 2003 and 12-year stroke risk to assess whether the results of analyses evaluating 2-year patterns of elevated depressive symptoms were driven by the stronger influence of elevated depressive symptoms in 2003 compared with 2001. Lastly, we assessed our models using an alternative threshold set at CES-D score of 6 or higher (vs <6). These results are reported in Supplementary - Tables S4 and S8 because they did not differ from our primary findings.
RESULTS
Baseline Elevated Depressive Symptoms and Incident Stroke
Analyses of baseline elevated depressive symptoms included 10,693 individuals (127,803 person-years) and 546 incident strokes over a 14-year follow-up period. About 35% of participants reported elevated depressive symptoms at baseline (Table 1). Participants with elevated depressive symptoms at baseline were 67% female and reported higher rates of hypertension (48% vs 32%) and diabetes (20% vs 14%) than those without elevated depressive symptoms.
Table 1.
Baseline Characteristics of Sample Population, MHAS Stratified by Elevated Depressive Symptoms (n = 10,720)
| No elevated depressive symptoms at baseline | Elevated depressive symptoms at baseline | |||
|---|---|---|---|---|
| Characteristic | Overall | % | Overall | % |
| n | 6,948 | 65 | 3,772 | 35 |
| Age, mean (SD) | 61.3 | (8.9) | 63.4 | (9.9) |
| Female | 3,340 | 48.1 | 2,539 | 67.3 |
| Education completed | ||||
| No primary | 1,411 | 20.3 | 1,194 | 31.7 |
| Primary | 3,752 | 54.0 | 2,049 | 54.3 |
| Secondary or higher | 1,785 | 25.7 | 529 | 14.0 |
| Marital status | ||||
| Married/in union | 5,159 | 74.3 | 2,282 | 60.5 |
| Monthly income (individual-level Mex $) | ||||
| 1st quartile (<$123) | 1,701 | 24.5 | 1,031 | 27.3 |
| 2nd quartile ($124–1,225) | 1,574 | 22.7 | 1,128 | 29.9 |
| 3rd quartile ($1,226–3,465) | 1,782 | 25.6 | 896 | 23.8 |
| 4th quartile (>$3,466) | 1,891 | 27.2 | 717 | 19.0 |
| Community of residence | ||||
| Less urbanized region | 2,208 | 31.8 | 1,401 | 37.1 |
| More urbanized regiona | 4,740 | 68.2 | 2,371 | 62.9 |
| High outmigration state | ||||
| No | 5,135 | 73.9 | 2,582 | 68.5 |
| Yesb | 1,813 | 26.1 | 1,190 | 31.5 |
| Cardiovascular risk factors | ||||
| Hypertension | 2,251 | 32.4 | 1,828 | 48.4 |
| Diabetes | 947 | 13.6 | 771 | 20.4 |
| Depressive symptoms | ||||
| CES-D score 0–9, mean (SD) | 1.9 | (1.3) | 6.7 | (1.4) |
Abbreviations: CES-D,Center for Epidemiologic Studies Depression Scale; SD, standard deviation.
More urbanized region defined as ≥100,000 population.
Durango, Guanajuato, Jalisco, Michoacán, Nayarit, and Zacatecas were the six states with highest outmigration to the United States between 1990 and 1995.
Compared with participants reporting no elevated depressive symptoms at baseline, those reporting elevated depressive symptoms had a moderately increased risk of incident stroke after adjusting for age and sex (Figure 1, model 2; HR = 1.16; 95% CI = .97, 1.39). Results were similar after full adjustment for demographic factors (Figure 1, model 3; HR = 1.13; 95% CI = .95, 1.36).
Figure 1.
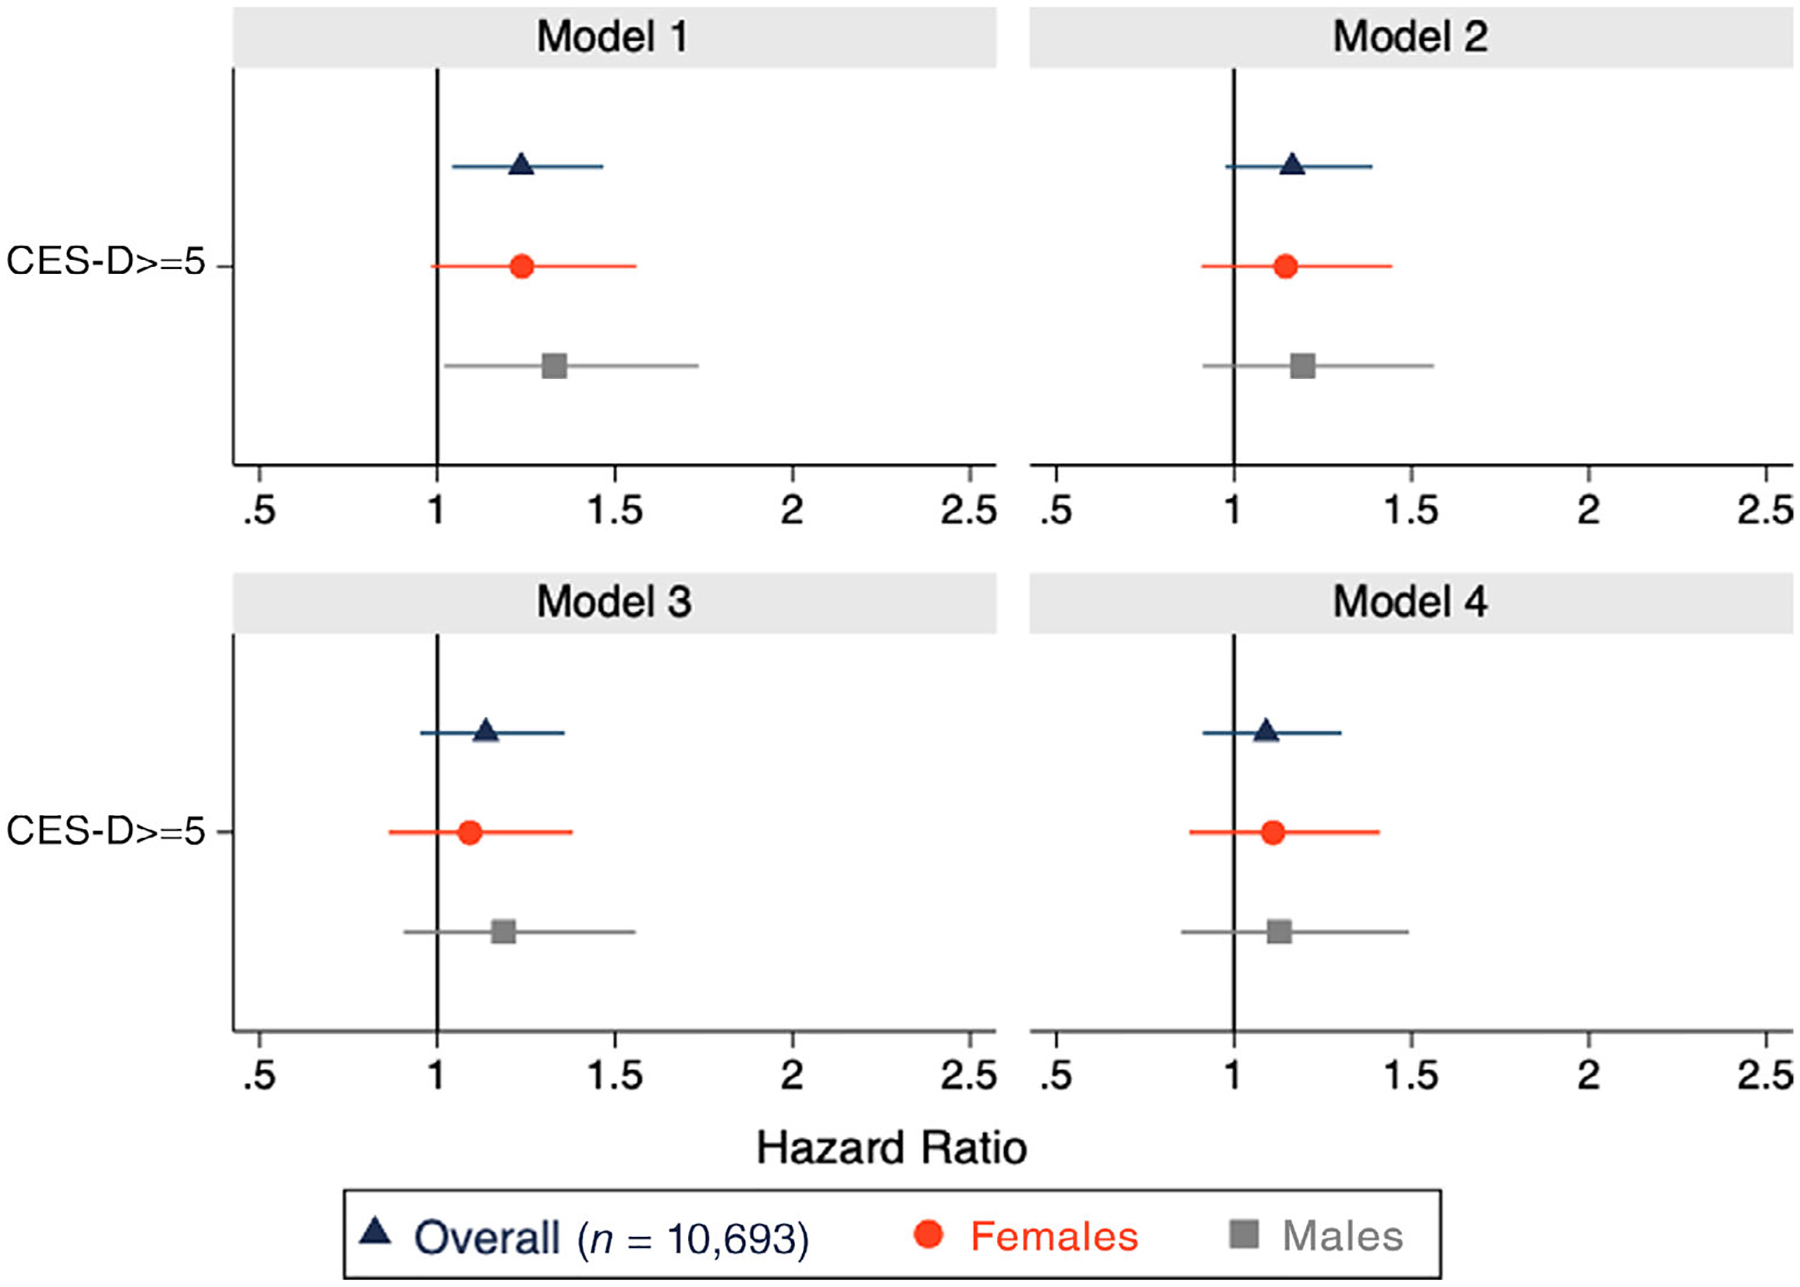
Hazard ratios (HRs) for elevated depressive symptoms (Center for Epidemiologic Studies Depression Scale [CES-D] score ≥ 5) at baseline (in 2001) and risk of incident stroke. Reference: low/no elevated depressive symptoms. Model 1: unadjusted; Model 2: adjusted for age and sex; Model 3: additionally adjusted for education, marital status, urbanicity, and state of residence; Model 4: inverse probability weighted Model 1 adjusted for age and sex (inverse probability of exposure weights account for education, marital status, urbanicity, state of residence, income, hypertension, and diabetes) (Supplementary Table S2 provides HR estimates).
Weighted models that additionally accounted for baseline income, hypertension and diabetes (Figure 1, Model 4) yielded a null estimate (HR = 1.01; 95% CI = .84, 1.22). Pooled logistic regression model estimates additionally incorporating weights to account for time-varying predictors of mortality and attrition were attenuated, albeit less precise than those generated from the unweighted Cox model (HR = 1.06; 95% CI = .71–1.60) (Supplementary Table S2). There was no evidence of multiplicative interaction by sex (P = .81) or by age (<65 vs ≥65 years) at baseline (P = .35) in fully adjusted models (Supplementary Table S3).
Short-term (2001–2003) Patterns of Elevated Depressive Symptoms and Incident Stroke
Analyses that examined patterns of elevated depressive symptoms from baseline to 2-year follow-up and incident stroke over a 12-year follow-up period included 8,808 individuals (97,775 person-years) and 414 incident strokes. The average age for this group was 61.6 years, and 56% of the sample was female (Table 2). Overall, stable low/no elevated depressive symptoms were the most common pattern (49%) followed by stable high (20%). Compared with male, female showed a higher prevalence of recently remitted (17% vs 13%), recent onset (17% vs 15%), and stable high (26% vs 11%) depressive symptoms.
Table 2.
Prevalence of Short-Term Patterns of Change or Stability in Elevated Depressive Symptoms among Middle-Aged and Older Mexican Adults in Short-Term Changes Analysis
| Total | % | Female | % | Male | % | |
|---|---|---|---|---|---|---|
| n | 8,808 | 4,941 | 56 | 3,867 | 44 | |
| Age, mean (SD) | 61.6 | (8.9) | 61.3 | (8.8) | 61.9 | (9.1) |
| Changes in depressive symptoms | ||||||
| Stable low/No | 4,341 | 49.3 | 1,983 | 40.1 | 2,358 | 61.0 |
| Recently remitted | 1,314 | 14.9 | 826 | 16.7 | 488 | 12.6 |
| Recent onset | 1,426 | 16.2 | 845 | 17.1 | 581 | 15.0 |
| Stable high | 1,727 | 19.6 | 1,287 | 26.1 | 440 | 11.4 |
Abbreviation: SD, standard deviation.
Compared with participants with stable low/no elevated depressive symptoms, those with recent-onset or stable high depressive symptoms had significantly elevated risk of incident stroke (HR = 1.38; 95% CI = 1.06–1.81 and HR = 1.42; 95% CI = 1.10–1.84) after adjusting for demographic characteristics (Figure 2, model 3). Estimates from weighted Cox models were similar for recent onset (Figure 2, model 4; HR = 1.36; 95% CI = 1.03–1.78) and stable high depressive symptoms (HR = 1.29; 95% CI = .97–1.72), compared with the reference group with stable low/no elevated depressive symptoms. Having recently remitted elevated depressive symptoms was not associated with risk of incident stroke (Figure 2, model 4; HR = .93; 95% CI = .67–1.27).
Figure 2.

Hazard ratios (HRs) for short-term (2001–2003) patterns of elevated depressive symptoms (CES-D score ≥ 5) and risk of incident stroke. Reference: stable low/no elevated depressive symptoms. Model 1: unadjusted; Model 2: adjusted for age and sex; Model 3: additionally, adjusted for education, marital status, urbanicity, and state of residence; Model 4: inverse probability weighted Model 1 adjusted for age and sex (inverse probability of exposure weights account for education, marital status, urbanicity, state of residence, income, hypertension, and diabetes). (Supplementary Table S6 provides HR estimates).
Results showed evidence of effect modification by age (P = .06) but not by sex (P = .64). Compared with stable low/no depressive symptoms, recent onset of elevated depressive symptoms was significantly associated with a greater hazard of incident stroke (HR = 1.92; 95% CI = 1.34–2.76) for respondents aged 65 and older at baseline, and stable high elevated depressive symptoms were significantly associated with a greater hazard of incident stroke (HR = 1.44; 95% CI = 1.02–2.04) for those aged 65 and younger at baseline.
Estimates of association between elevated depressive symptoms measured at 2-year follow-up (2003) and 12-year incident stroke were substantially larger (Supplementary Table S5, model 3; HR = 1.40; 95% CI = 1.15–1.71) compared with those observed for our analysis at baseline (2001) and 14-year incident stroke (Supplementary Table S2, model 3: HR = 1.13; 95% CI = .95–1.36). However, the differences between our estimates were consistent with chance (P = .26).23
DISCUSSION
In a large population-based cohort of older Mexican adults followed for up to 14 years, we found evidence of moderately increased risk of incident stroke for those reporting elevated depressive symptoms at study baseline. Acknowledging that depressive symptoms may be dynamic, and to inform interventions to reduce depression in late life, we additionally evaluated short-term patterns of elevated depressive symptoms and incident stroke. We found that compared with those with stable low/no depressive symptoms, respondents who reported stable high and recent onset of elevated depressive symptoms had significantly higher risk of incident stroke, whereas those who reported recently remitted symptoms showed no significant difference in the risk of incident stroke over a 12-year period.
Recent meta-analyses of the relationship between depression and incident stroke have reported an adjusted HR of 1.45 (95% CI = 1.29–1.63)6 and an adjusted relative risk of 1.34 (95% CI = 1.17–1.54).7 Our findings for analogous estimates of the association between elevated depressive symptoms at baseline and 14-year stroke risk in the MHAS showed a slightly increased risk, although our estimates were of lower magnitude than previously reported results and were not statistically significant at conventional P-value thresholds. However, our results evaluating short-term change patterns of elevated depressive symptoms align with previous U.S.-based research findings. Consistent with our findings, a study of adults aged 65 and older in the Cardiovascular Health Study reported that those with stable high and recent onset of elevated depressive symptoms across two consecutive annual assessments were estimated to have a greater hazard of incident stroke, 77% and 50%, respectively, compared with respondents with stable low/no elevated depressive symptoms.10 Similarly, another study of adults aged 50 and older in the HRS found that respondents with stable high depressive symptoms had double the risk of incident stroke compared with individuals with stable low depressive symptoms.9 Yet unlike our findings, this study showed that those with remitted elevated depressive symptoms remained at an increased risk of incident stroke. Also consistent with our findings, the HRS study found that stable high elevated depressive symptoms were significantly associated with higher risk of stroke among participants aged 65 and younger. However, in contrast to our findings, they did not see a significant association between recent onset and higher risk of stroke among participants aged 65 and older.
One key driver of differences in our study could be due to relatively uneven follow-up intervals in the MHAS that restricted our ability to evaluate associations between elevated depressive symptoms and risk of stroke over smaller time windows, as is common in prior research. In fact, sensitivity analyses uncovered a stronger magnitude of association between elevated depressive symptoms at 2-year follow-up and 12-year incident stroke relative to associations observed between baseline elevated depressive symptoms and 14-year incident stroke. This may indicate that more recent elevated depressive symptoms could be more important drivers of stroke risk than depressive symptoms experienced earlier in time, and explain stronger associations observed in prior studies with shorter follow-up intervals. Additionally, recent onset of depressive symptoms may reflect higher prevalence of sudden late-life stressors (ie, financial instability after retirement, death of friends and family, not being able to live independently) or an accumulation of these that occur with advancing age. Further, vascular and other comorbidities also increase with age that may make older adults more vulnerable to adverse sequelae of depressive symptoms. These stressors may also be risk factors for stroke, either independently or mediated via depressive symptoms.
To our knowledge, this is the first study to evaluate associations between depressive symptoms and incident stroke in Mexico, a middle-income country, which, like many LMICs, is experiencing rapid aging and limited behavioral health infrastructure. LMICs are also more likely to lack financial resources and infrastructure for integrated primary care and adequate access to behavioral health services that could otherwise offer support for older adults’ mental health. For instance, a study in primary care clinics in Mexico showed that less than 15% of primary care staff reported any training in addressing mental health concerns. The study also identified problems with poor healthcare coverage, language/cultural issues, and lack of knowledge and information related to mental health services as additional barriers for implementing mental health services at the primary care level.24 Nevertheless, no prior studies have prospectively evaluated the effects of depressive symptoms on stroke nor how the association between changes in depressive symptoms may impact risk of stroke in LMICs. Additional strengths of the current study include its use of a large national sample, with substantial follow-up, and the use of IPWs to account for time-varying predictors of mortality and attrition.
One limitation of our study involves the use of a binary threshold (CES-D score ≥5) to define elevated depressive symptoms. Our cutoff was informed by recommendations from a validation study in a geriatric clinic in Mexico City.19 Although the recommended cutoff threshold has relatively low specificity (68.7%), we chose to optimize sensitivity (80.7%) and increase our statistical power. Additionally, results did not differ when we evaluated an alternative cutoff. However, the selected cutoff did result in a higher apparent prevalence of elevated depressive symptoms in MHAS respondents relative to other global older-adult population-based studies. For example, a study using nationally representative data on older adults from six LMICs (China, Ghana, India, Mexico, Russia, and South Africa) found that depression prevalence ranged from 2.1% in China to 18.5% in India.25 The high prevalence of elevated depressive symptoms reported in the MHAS may be attributable to the low specificity of the threshold that could also have attenuated estimates of association with stroke risk. Although elevated CES-D scores could indicate underlying clinical depression, they may also reflect other mental health conditions including anxiety disorders or other nonspecific emotional distress. More focused research to evaluate specific clinical conditions and stroke in LMICs would be valuable but will be logistically challenging to implement.
Second, the study used for the present analysis did not contain medical record information on stroke outcomes, and stroke classification was based on self-reported or next-of-kin (in the case of deceased participants) respondents with no additional information of stroke subtype. Although this measure is vulnerable to misreporting due to incorrect recall or undiagnosed events, a previous study on the validity of self-reported stroke showed no evidence of systematic misreporting for self-reported stroke.20 To the extent that there were differences in the measurement of the outcome, this would further result in attenuation of the estimated effect and reduced power, and is unlikely to account for our results.
Lastly, the potential for reverse causation should also be considered a key concern when interpreting our results. The vascular depression hypothesis26 suggests that early cerebrovascular damage could lead to late-life depression. Clinical and magnetic resonance imaging studies suggest that vascular lesions may disrupt frontal-subcortical-limbic networks involved in mood regulation and lead to depression; however, the relationship between brain changes, vascular lesions, and late-life depression remains unclear.27 Additional studies beginning earlier in life could provide further insight on the temporal association between cerebrovascular risk factors, depression, and stroke.
In conclusion, these results overall provide evidence that recent onset and stable high elevated depressive symptoms are associated with a significantly increased risk of 12-year incident stroke in a population-based study of adults aged 50 and older in Mexico. Our findings are an important contribution to the limited research on this association in LMICs and the scarce research on stroke in Mexico. As Mexico continues to experience rapid aging and growing burden of chronic morbidity and mortality, the need for resources to support integrated primary care and address mental health in a timely manner will become imperative to prevent cumulative risk of adverse health outcomes including stroke incidence in older populations.
Supplementary Material
Supplementary Figure S1: Flowchart of Analytic Sample for Baseline Analysis.
Supplementary Figure S2: Flowchart of Analytic Sample for Short-term (2001–2003) Patterns of Elevated Depressive Symptoms Analysis.
Supplementary Figure S3: Stroke-free Survival for Participants with Elevated Depressive Symptoms (CES-D score ≥ 5) Compared witho No Elevated Depressive Symptoms (CES-D score < 5) Over a 14-year Follow-up Period.
Supplementary Figure S4: Stroke-free Survival for Short-term (2001–2003) Patterns of Elevated Depressive Symptoms (CES-D score ≥ 5) Over a 12-year Follow-up Period.
Supplementary Table S1: Baseline Characteristics of Sample Population, MHAS Stratified by Baseline Elevated Depressive Symptoms (CES-D score ≥ 5) and Sex (n = 10,720).
Supplementary Table S2: Cox Proportional Hazard Ratios for Elevated Depressive Symptoms (CES-D score ≥ 5) at Baseline (in 2001) and Risk of Incident Stroke.
Supplementary Table S3: Cox Proportional Hazard Ratios for Elevated Depressive Symptoms (CES-D score ≥ 5) at Baseline (in 2001) and Risk of Incident Stroke, Stratified by Age.
Supplementary Table S4: Cox Proportional Hazard Ratios for Elevated Depressive Symptoms (setting CES-D score ≥ 6) at Baseline (in 2001) and Risk of Incident Stroke.
Supplementary Table S5: Cox Proportional Hazard Ratios for Elevated Depressive Symptoms (CES-D score ≥ 5) in 2003 and Risk of Incident Stroke.
Supplementary Table S6: Cox Proportional Hazard Ratios for Short-term (2001–2003) Patterns of Elevated Depressive Symptoms (CES-D score ≥ 5) and Risk of Incident Stroke.
Supplementary Table S7: Cox Proportional Hazard Model for Short-term (2001–2003) Patterns of Elevated Depressive Symptoms (CES-D score ≥ 5) and Risk of Incident Stroke, Stratified by Age.
Supplementary Table S8: Cox Proportional Hazard Ratios for Short-term (2001–2003) Patterns of Elevated Depressive Symptoms (setting CES-D score ≥ 6) and Risk of Incident Stroke.
Supplementary Text S1: Details of Process to Generate Stabilized Inverse Probability Weights.
Supplementary Text S2: Sensitivity Analysis using Pooled Logistic Regression for Elevated Depressive Symptoms at Baseline.
ACKNOWLEDGMENTS
Financial Disclosure: This work was supported by the National Institute on Aging’s Research in Aging and Chronic Disease training grant [T32AG049663], K01AG056602 to Jacqueline M. Torres, R00AG058799 to Joseph L. Sáenz, and RF1AG055486 to Medellena Maria Glymour. The Mexican Health and Aging Study (MHAS) is a collaborative effort among researchers at the University of Texas Medical Branch, the Instituto Nacional de Estadística y Geografía (INEGI, Mexico), the University of Wisconsin, the Instituto Nacional de Geriatría (Mexico), and the Instituto Nacional de Salud Pública (Mexico). MHAS is partly supported by the National Institutes of Health/National Institute on Aging (R01AG018016, R. Wong, principal investigator) and the INEGI in Mexico. Data files and documentation are public use and available at www.MHASweb.org.
Footnotes
Conflict of Interest: The authors have declared no conflicts of interest for this article.
SUPPORTING INFORMATION
Additional Supporting Information may be found in the online version of this article.
REFERENCES
- 1.Johnson W, Onuma O, Owolabi M, Sachdev S. Stroke: a global response is needed. Bulletin of the World Health Organization; 2016. August 19, 2019. [DOI] [PMC free article] [PubMed] [Google Scholar]
- 2.Musselman DL, Evans DL, Nemeroff CB. The relationship of depression to cardiovascular disease: epidemiology, biology, and treatment. Arch Gen Psychiatry. 1998;55(7):580–592. [DOI] [PubMed] [Google Scholar]
- 3.Shimbo D, Chaplin W, Crossman D, Haas D, Davidson KW. Role of depression and inflammation in incident coronary heart disease events. Am J Cardiol. 2005;96(7):1016–1021. [DOI] [PubMed] [Google Scholar]
- 4.Howren MB, Lamkin DM, Suls J. Associations of depression with c-reactive protein, IL-1, and IL-6: a meta-analysis. Psychosom Med. 2009;71(2):171–186. [DOI] [PubMed] [Google Scholar]
- 5.Kaptoge S, Di Angelantonio E, Lowe G, et al. C-reactive protein concentration and risk of coronary heart disease, stroke, and mortality: an individual participant meta-analysis. Lancet. 2010;375(9709):132–140. [DOI] [PMC free article] [PubMed] [Google Scholar]
- 6.Pan A, Sun Q, Okereke OI, Rexrode KM, Hu FB. Depression and risk of stroke morbidity and mortality: a meta-analysis and systematic review. JAMA. 2011;306(11):1241–1249. [DOI] [PMC free article] [PubMed] [Google Scholar]
- 7.Dong JY, Zhang YH, Tong J, Qin LQ. Depression and risk of stroke: a meta-analysis of prospective studies. Stroke. 2012;43(1):32–37. [DOI] [PubMed] [Google Scholar]
- 8.Glymour MM, Patton KK, Capistrant BD, Kosheleva A, Yen JJ, Moon JR. Elevated depressive symptoms and incident stroke in hispanic, African-American, and White older Americans. J Behav Med. 2012;35(2):211–220. [DOI] [PMC free article] [PubMed] [Google Scholar]
- 9.Gilsanz P, Walter S, Tchetgen Tchetgen EJ, et al. Changes in depressive symptoms and incidence of first stroke among middle-aged and older US adults. J Am Heart Assoc. 2015;4(5):1–7. [DOI] [PMC free article] [PubMed] [Google Scholar]
- 10.Gilsanz P, Kubzansky LD, Tchetgen EJT, et al. Changes in depressive symptoms and subsequent risk of stroke in the cardiovascular health study. Stroke. 2017;48(1):43–48. [DOI] [PMC free article] [PubMed] [Google Scholar]
- 11.Naghavi M, Abajobir AA, Abbafati C, et al. Global, regional, and national age-sex specifc mortality for 264 causes of death, 1980–2016: a systematic analysis for the global burden of disease study 2016. Lancet. 2017;390 (10100):1151–1210. [DOI] [PMC free article] [PubMed] [Google Scholar]
- 12.Mills KT, Stefanescu A, He J. The global epidemiology of hypertension. Nat Rev Nephrol. 2020;16(4):223–237. [DOI] [PMC free article] [PubMed] [Google Scholar]
- 13.Feigin VL, Forouzanfar MH, Krishnamurthi R, et al. Global and regional burden of stroke during 1990–2010: findings from the global burden of disease study 2010. Lancet. 2014;383(9913):245–255. [DOI] [PMC free article] [PubMed] [Google Scholar]
- 14.O’Donnell MJ, Denis X, Liu L, et al. Risk factors for ischaemic and intracerebral haemorrhagic stroke in 22 countries (the INTERSTROKE study): a case-control study. Lancet. 2010;376(9735):112–123. [DOI] [PubMed] [Google Scholar]
- 15.Guerra M, Ferri CP, Sosa AL, et al. Late-life depression in Peru, Mexico and Venezuela: the 10/66 population-based study. Br J Psychiatry. 2009;195(6):510–515. [DOI] [PMC free article] [PubMed] [Google Scholar]
- 16.Wong R, Michaels-Obregon A, Palloni A. Cohort profile: the Mexican health and aging study (MHAS). Int J Epidemiol. 2017;46(2):1–10. [DOI] [PMC free article] [PubMed] [Google Scholar]
- 17.Radloff LS. The CES-D scale: a self-report depression scale for research in the general population. Appl Psychol Measur. 1977;1(3):385–401. [Google Scholar]
- 18.Irwin M, Artin KH, Oxman MN. Screening for depression in the older adult: criterion validity of the 10-Item Center for Epidemiological Studies Depression Scale (CES-D). Arch Intern Med. 1999;159(15):1701–1704. [DOI] [PubMed] [Google Scholar]
- 19.Aguilar-Navarro SG, Fuentes-Cantú A, Ávila-Funes JA, García-Mayo EJ. Validez y confiabilidad del cuestionario del ENASEM para la depresión en adultos mayores Artemisa medigraphic en línea. Salud Publica Mex. 2007;49(4):256–262. [DOI] [PubMed] [Google Scholar]
- 20.Glymour MM, Avendano M. Can self-reported strokes be used to study stroke incidence and risk factors? Evidence from the health and retirement study. Stroke. 2009;40(3):873–879. [DOI] [PubMed] [Google Scholar]
- 21.Li CT, Bai YM, Tu PC, et al. Major depressive disorder and stroke risks: a 9-year follow-up population-based, matched cohort study. PLOS ONE. 2012;7(10):1–9. [DOI] [PMC free article] [PubMed] [Google Scholar]
- 22.Cole SR, Hernán MA. Constructing inverse probability weights for marginal structural models. Am J Epidemiol. 2008;168(6):656–664. [DOI] [PMC free article] [PubMed] [Google Scholar]
- 23.Goldstein H, Healy MJR. The graphical presentation of a collection of means. J Royal Stat Soc. 1995;158(1):175–177. [Google Scholar]
- 24.Martinez W, Galván J, Saavedra N, Berenzon S. Barriers to integrating mental health services in community-based primary care settings in Mexico city: a qualitative analysis. Psychiatr Serv. 2017;68(5):497–502. [DOI] [PMC free article] [PubMed] [Google Scholar]
- 25.Arokiasamy P, Uttamacharya KP, et al. Chronic noncommunicable diseases in 6 low- and middle-income countries: findings from wave 1 of the world health organization’s study on global ageing and adult health (SAGE). Am J Epidemiol. 2017;185(6):414–428. [DOI] [PMC free article] [PubMed] [Google Scholar]
- 26.Alexopoulos GS. Depression in the elderly. Lancet. 2005;365(9475):1961–1970. [DOI] [PubMed] [Google Scholar]
- 27.Aizenstein HJ, Baskys A, Boldrini M, et al. Vascular depression consensus report—a critical update. BMC Med. 2016;14(1):161 10.1186/s12916-016-0720-5 [DOI] [PMC free article] [PubMed] [Google Scholar]
Associated Data
This section collects any data citations, data availability statements, or supplementary materials included in this article.
Supplementary Materials
Supplementary Figure S1: Flowchart of Analytic Sample for Baseline Analysis.
Supplementary Figure S2: Flowchart of Analytic Sample for Short-term (2001–2003) Patterns of Elevated Depressive Symptoms Analysis.
Supplementary Figure S3: Stroke-free Survival for Participants with Elevated Depressive Symptoms (CES-D score ≥ 5) Compared witho No Elevated Depressive Symptoms (CES-D score < 5) Over a 14-year Follow-up Period.
Supplementary Figure S4: Stroke-free Survival for Short-term (2001–2003) Patterns of Elevated Depressive Symptoms (CES-D score ≥ 5) Over a 12-year Follow-up Period.
Supplementary Table S1: Baseline Characteristics of Sample Population, MHAS Stratified by Baseline Elevated Depressive Symptoms (CES-D score ≥ 5) and Sex (n = 10,720).
Supplementary Table S2: Cox Proportional Hazard Ratios for Elevated Depressive Symptoms (CES-D score ≥ 5) at Baseline (in 2001) and Risk of Incident Stroke.
Supplementary Table S3: Cox Proportional Hazard Ratios for Elevated Depressive Symptoms (CES-D score ≥ 5) at Baseline (in 2001) and Risk of Incident Stroke, Stratified by Age.
Supplementary Table S4: Cox Proportional Hazard Ratios for Elevated Depressive Symptoms (setting CES-D score ≥ 6) at Baseline (in 2001) and Risk of Incident Stroke.
Supplementary Table S5: Cox Proportional Hazard Ratios for Elevated Depressive Symptoms (CES-D score ≥ 5) in 2003 and Risk of Incident Stroke.
Supplementary Table S6: Cox Proportional Hazard Ratios for Short-term (2001–2003) Patterns of Elevated Depressive Symptoms (CES-D score ≥ 5) and Risk of Incident Stroke.
Supplementary Table S7: Cox Proportional Hazard Model for Short-term (2001–2003) Patterns of Elevated Depressive Symptoms (CES-D score ≥ 5) and Risk of Incident Stroke, Stratified by Age.
Supplementary Table S8: Cox Proportional Hazard Ratios for Short-term (2001–2003) Patterns of Elevated Depressive Symptoms (setting CES-D score ≥ 6) and Risk of Incident Stroke.
Supplementary Text S1: Details of Process to Generate Stabilized Inverse Probability Weights.
Supplementary Text S2: Sensitivity Analysis using Pooled Logistic Regression for Elevated Depressive Symptoms at Baseline.