

Abstract
Background
Real‐world healthcare data are an important resource for epidemiologic research. However, accurate identification of patient cohorts—a crucial first step underpinning the validity of research results—remains a challenge. We developed and evaluated claims‐based case ascertainment algorithms for pulmonary hypertension (PH), comparing conventional decision rules with state‐of‐the‐art machine‐learning approaches.
Methods and Results
We analyzed an electronic health record‐Medicare linked database from two large academic tertiary care hospitals (years 2007–2013). Electronic health record charts were reviewed to form a gold standard cohort of patients with (n=386) and without PH (n=164). Using health encounter data captured in Medicare claims (including patients’ demographics, diagnoses, medications, and procedures), we developed and compared 2 approaches for identifying patients with PH: decision rules and machine‐learning algorithms using penalized lasso regression, random forest, and gradient boosting machine. The most optimal rule‐based algorithm—having ≥3 PH‐related healthcare encounters and having undergone right heart catheterization—attained an area under the receiver operating characteristic curve of 0.64 (sensitivity, 0.75; specificity, 0.48). All 3 machine‐learning algorithms outperformed the most optimal rule‐based algorithm (P<0.001). A model derived from the random forest algorithm achieved an area under the receiver operating characteristic curve of 0.88 (sensitivity, 0.87; specificity, 0.70), and gradient boosting machine achieved comparable results (area under the receiver operating characteristic curve, 0.85; sensitivity, 0.87; specificity, 0.70). Penalized lasso regression achieved an area under the receiver operating characteristic curve of 0.73 (sensitivity, 0.70; specificity, 0.68).
Conclusions
Research‐grade case identification algorithms for PH can be derived and rigorously validated using machine‐learning algorithms. Simple decision rules commonly applied in published literature performed poorly; more complex rule‐based algorithms may potentially address the limitation of this approach. PH research using claims data would be considerably strengthened through the use of validated algorithms for cohort ascertainment.
Keywords: computable phenotype, machine learning, pulmonary hypertension
Subject Categories: Pulmonary Hypertension
Nonstandard Abbreviations and Acronyms
- ICD‐9
International Classification of Diseases, Ninth Revision
- PAH
pulmonary arterial hypertension
- PH
pulmonary hypertension
- RHC
right heart catheterization
Clinical Perspective
What Is New?
We found that conventional, rule‐based approaches for identifying individuals with pulmonary hypertension (PH) in Medicare claims data performed poorly – these methods could not achieve an acceptable balance of specificity and sensitivity.
State‐of‐the‐art machine‐learning methods outperformed rules‐based approaches for identifying individuals with PH in Medicare claims data by a large margin, providing both sensitive and specific research‐grade case identification for conducting claims‐based studies in PH cohorts.
What Are the Clinical Implications?
The imprecision of rule‐based PH subject identification algorithms may substantially bias the results of claims‐based observational studies that rely solely upon this method for cohort selection.
The use of validated methods for PH cohort ascertainment, and in particular the application of validated, machine‐learning approaches such as those we tested, has the potential to considerably reduce cohort selection biases in observational PH research using claims data and electronic health record sources.
Administrative databases capturing longitudinal patterns of medical care, such as Medicaid and Medicare administrative claims databases, provide a rich real‐world healthcare data resource for performing epidemiologic research at the population level, and are increasingly used for the study of pulmonary hypertension (PH). The accurate identification of PH patient cohorts from administrative claims—a critical first step underpinning the validity of subsequent research results—has, however, undergone only limited study and systematic validation. Published studies using administrative databases have primarily relied upon each investigator’s a priori definition of diagnostic and procedural codes for cohort ascertainment, with wide variation in case definition algorithms used for identifying PH between studies. 1 Furthermore, the accuracy of published PH cohort identification algorithms has undergone limited to no validation, bringing into question the fidelity of any individual definition used; as such, meaningful evaluation and quantitative comparisons between the results of such studies are also challenging. A recent study by Papani et al, 2 which validated claims‐based algorithms to distinguish pulmonary arterial hypertension (PAH) from other PH subtypes, is illustrative: Although the study focused on identifying patients with PAH within a cohort of patients with PH and did not address the identification of patients with PH, it clearly demonstrated that case definition algorithms derived from diagnostic codes alone could not provide accurate estimates of the disease phenotype of interest.
Within the realm of electronic health record (EHR) analyses, however, a recent study by Geva et al 3 developed and validated a high‐fidelity computable phenotype for identifying children with PH. Although this study employed an approach not directly translatable to claims‐based studies—a combination of chart review, natural language processing of clinical notes, and machine‐based learning of institution‐specific codes not captured in administrative claims—the success of this approach supports the utility of machine‐learning algorithms for identifying and validating PH cohorts. Here, we leverage a linked set of EHR and Medicare data to develop and validate claims‐based algorithms for identifying patients with PH. Likewise, in other realms, machine‐learning approaches have been increasingly applied to develop algorithms for patient cohort identification, 4 , 5 often outperforming decision rules in identifying the cohort of interest. 6 , 7
The availability of EHR‐linked Medicare data enables a gold standard cohort to be identified through chart review on which claims‐based definitions can be validated. Claims‐based algorithms for cohort ascertainment are typically defined by a set of decision rules (eg, having ≥2 healthcare encounters with the diagnostic code of interest). We therefore developed, applied, and compared the use of decision rules and machine‐learning algorithms to identify patients with PH in administrative claims.
Methods
The authors declare that all analytic methods are described within the article. Because of the sensitive nature of the clinical data and risk of reidentification, the study data set cannot be made available to other researchers.
Data Source and Study Cohort
We analyzed an EHR‐Medicare‐linked database with patients from 2 large academic tertiary care hospitals (Massachusetts General Hospital and Brigham and Women’s Hospital), belonging to the Partners HealthCare system. Study subjects included patients enrolled in Medicare between the years 2007 and 2013. An initial cohort of patients with a PH‐related healthcare visit, identified using International Classification of Diseases (ICD) diagnostic codes for PH (International Classification of Diseases, Ninth Revision [ICD-9] 416.0, 416.8). To ensure adequate follow‐up, we confined the study cohort to those who were seen at Partners Healthcare at least twice within the first 12 months of the initial PH‐related encounter (index PH diagnosis). The medical records of a subset of randomly selected patients (n=550) were reviewed to confirm the diagnosis of PH. The criterion for diagnosis of PH was a mean pulmonary artery pressure ≥25 mm Hg at rest as measured by right heart catheterization (RHC). 8 Criteria for assignment to the control cohort was a mean pulmonary artery pressure <25 mm Hg. Although the hemodynamic criterion for PH has recently been redefined to having a mean pulmonary artery pressure of >20 mm Hg, 9 we did not apply the new criterion since the study data set was collected before the new diagnostic guidelines.
The Partner’s HealthCare Research Review Committee approved the study and granted a waiver of consent (protocol approval number: 2014P001971).
Rule‐Based Algorithms for Cohort Ascertainment
We first evaluated rule‐based algorithms commonly applied in existing PH research that uses administrative claims. The primary outcome was the gold standard PH status ascertained through chart review (ie, mean pulmonary artery pressure ≥25 mm Hg at rest measured by RHC). To derive rule‐based algorithms, we first identified claims‐based variables (including PH‐related diagnoses, procedures, medications, and comorbidities) that were significantly associated with PH status in bivariate analysis; we then used these variables to derive decision rules for identifying patients with PH, including the following rules and combinations thereof: (1) ≥2 healthcare encounters with PH‐related diagnoses, (2) evidence for having undergone PH‐related procedures (RHC, echocardiography), (3) use of PAH medications, and (4) presence of comorbidities associated with PH. Variables corresponding to rules terms were extracted from claims data as follows: PH‐related encounters were identified using ICD diagnostic codes for PH (ICD-9 416.0, 416.8); procedures were identified using Current Procedural Terminology codes (Table S1); PAH medications were identified in text descriptions and included epoprostenol, iloprost, treprostinil, bosentan, ambrisentan, macitentan, sildenafil, tadalafil, vardenafil, and riociguat. We quantified the performance of these algorithms using the following measures: sensitivity, specificity, positive predictive value, negative predictive value, and area under the receiver operating characteristic curve (AUC). As a secondary outcome, we compared the sensitivity of the algorithms in detecting cases of PAH and other PH subtypes. PAH cases were defined as having a mean pulmonary artery pressure ≥25 mm Hg at rest in the presence of a pulmonary capillary wedge pressure ≤15 mm Hg and pulmonary vascular resistance >3.0 Wood Units, as measured by RHC. We further conducted in‐depth chart review and excluded patients presenting with comorbid cardiac, parenchymal lung, thromboembolic, and other diseases predispose to abnormal cardiopulmonary hemodynamics. 10 Because multiple PH subtypes can co‐occur simultaneously, 11 , 12 we did not exclude patients with coexisting cardiopulmonary conditions who satisfied the hemodynamic criteria for PAH and had a physician‐confirmed PAH diagnosis as stated in the medical charts.
Machine‐Learning Algorithms for Cohort Ascertainment
We further developed case identification algorithms using machine‐learning approaches and compared their performance against the rule‐based algorithms. We applied and compared several machine‐learning methods: penalized lasso regression, random forest, and gradient boosting machine. Penalized regression methods have been shown to outperform traditional regression analysis in the presence of a large number of highly correlated covariates, 13 while providing models that are human interpretable. Random forest and gradient boosting machine are ensemble machine‐learning algorithms that train and combine multiple tree‐based models to predict the outcome of interest. The performance of an ensemble often exceeds that of a single model, and these techniques are particularly robust to the noisy data that typically characterize administrative claims and EHR data sets. 14
For each model, we divided the full data set into a training set, which was a random sample of 60% of the full data set to guide the building of the models, and a test set composed of the remaining 40% to assess the performance of the models. Inputs to the models included the following data elements captured in Medicare claims: patient demographics (sex, age), the number of PH‐related healthcare visits (in the year following the index PH diagnosis), PAH medication prescriptions or infusions, and procedures commonly performed for diagnosing and managing PH and other related conditions, including RHC, echocardiography, electrocardiography, endomyocardial biopsy, intra‐arterial balloon, lung or heart transplantation, cardiac computed tomography angiography, ventilation‐perfusion scan, and pulmonary function test. We further incorporated common comorbid conditions of PH as model inputs, including valvular heart disease, heart failure, cardiomyopathy, angina, myocardial infarction, interstitial lung disease, chronic obstructive pulmonary disease, obstructive sleep apnea, dyspnea, thromboembolism, pulmonary embolism, portal hypertension, chronic liver disease, hemolytic anemia, connective tissue disease, diabetes mellitus, and essential hypertension. Procedures and comorbid conditions were expressed as continuous variables representing the number of health encounters associated with each procedure/condition in the year before and after the index PH diagnosis.
The primary performance metric used for evaluating the performance of a model was the AUC. To select model parameters, 10‐fold cross validation with 3 repetitions was conducted to tune the models using a range of parameters to optimize the AUC. In the development of penalized regression models, we evaluated the performance of varying penalty parameters ranging from 5 × 10⁻⁵ to 1.00. In the development of a model based on the random forest algorithm, we varied the number of variables randomly sampled as candidates at each tree split. In the development of a gradient boosting machine, we varied the maximum depth of each tree, as well as the learning rate. In addition to AUC, we also evaluated the sensitivity, specificity, positive predictive value, and negative predictive value of each model, and compared the sensitivity of the models in detecting PAH cases and other PH subtypes. To compare the performance of rule‐based and machine‐learning algorithms, we compared the receiver operating characteristic curves of the algorithms using a bootstrap approach described by Hanley and McNeil. 15
Analyses were conducted using the R statistical software (version 3.6.1) and machine‐learning algorithms were developed using the R package caret (version 6.0‐84). The Figure summarizes the study methods.
Figure 1. Study overview.
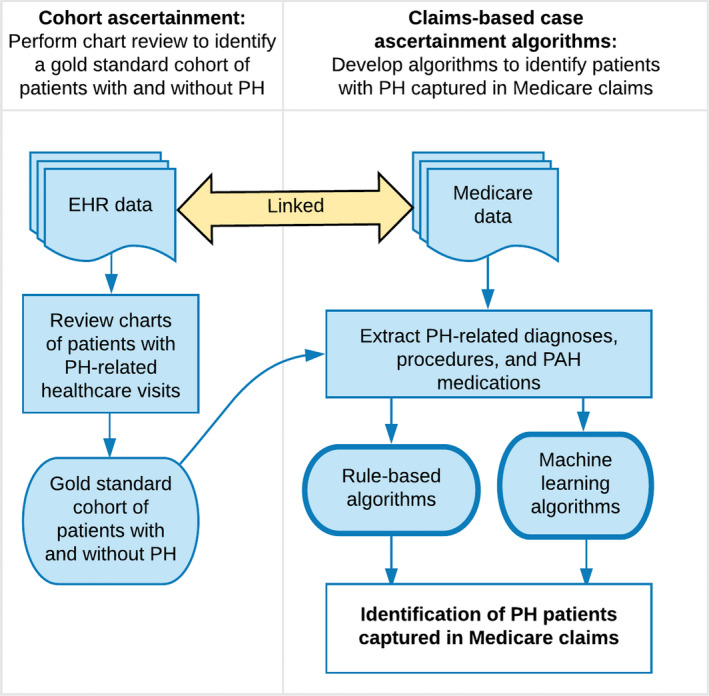
EHR indicates electronic health record; PAH, pulmonary arterial hypertension; and PH, pulmonary hypertension.
Results
Reviewing EHR charts for positive RHC findings, we identified 550 study participants with ≥1 PH‐related healthcare visits for whom RHC results were available; 389 were confirmed to have PH, and PH was ruled out in 161 patients using negative RHC findings (Table 1). Patients with PH had a higher number of PH‐related healthcare encounters, PAH medications, and echocardiograms. Patients with PH were also more likely to have heart failure, cardiomyopathy, myocardial infarction, interstitial lung disease, chronic liver disease, and diabetes mellitus.
Table 1.
Demographics (n=550)
| Attributes | PH (n=389) | No PH (n=161) | P Value |
|---|---|---|---|
| Sex, n (%) | 0.614 | ||
| Male | 209 (53.7) | 82 (50.9) | |
| Female | 180 (46.3) | 79 (49.1) | |
| Age, mean | 74.3 | 73.1 | 0.076 |
| PH subtypes, n (%) | |||
| PAH | 75 (19.3) | NA | |
| Other PH subtypes | 314 (80.7) | NA | |
| PH‐related healthcare encounters, mean | 8.8 | 3.3 | <0.001 |
| PAH medications, mean | 2.5 | 0.3 | <0.001 |
| Procedures, n (%) | |||
| Echocardiography | 380 (97.7) | 151 (93.8) | 0.043 |
| Lung/heart transplant | 4 (1.0) | 4 (2.5) | 0.365 |
| Cardiac computed tomography | 15 (3.9) | 3 (1.9) | 0.351 |
| Ventilation/perfusion lung scan | 24 (6.2) | 10 (6.2) | 1.000 |
| Angiography | 143 (36.8) | 51 (31.7) | 0.300 |
| Electrocardiography | 287 (73.8) | 122 (75.8) | 0.703 |
| Endomyocardial biopsy | 13 (3.3) | 7 (4.3) | 0.747 |
| Intra‐arterial balloon | 18 (4.6) | 3 (1.9) | 0.196 |
| Pulmonary function test | 52 (13.4) | 19 (11.8) | 0.720 |
| Comorbidities, n (%) | |||
| Valvular heart disease | 306 (78.7) | 120 (74.5) | 0.346 |
| Heart failure | 344 (88.4) | 118 (73.3) | <0.001 |
| Cardiomyopathy | 218 (56.0) | 66 (41.0) | 0.002 |
| Angina | 77 (19.8) | 36 (22.4) | 0.574 |
| Myocardial infarction | 143 (36.8) | 32 (19.9) | <0.001 |
| Interstitial lung disease | 80 (20.6) | 52 (32.3) | 0.009 |
| Chronic obstructive lung disease | 47 (12.1) | 26 (16.1) | 0.254 |
| Obstructive sleep apnea | 81 (20.8) | 35 (21.7) | 1.000 |
| Dyspnea | 371 (95.4) | 146 (90.7) | 0.056 |
| Thromboembolism or pulmonary embolism | 88 (22.6) | 31 (19.3) | 0.448 |
| Portal hypertension | 9 (2.3) | 4 (2.5) | 1.000 |
| Chronic liver disease | 48 (12.3) | 10 (6.2) | 0.048 |
| Hemolytic anemia | 7 (1.8) | 1 (0.6) | 0.510 |
| Connective tissue disease | 19 (4.9) | 11 (6.8) | 0.478 |
| Diabetes mellitus | 209 (53.7) | 60 (37.3) | <0.001 |
| Essential hypertension | 366 (94.1) | 148 (91.9) | 0.457 |
| Diagnostic codes for PH,* n (%) | |||
| Primary PH (ICD-9 416.0) | 220 (56.6) | 84 (52.2) | 0.398 |
| Secondary PH (ICD-9 416.8) | 358 (92.0) | 121 (75.2) | <0.001 |
| Other PH (ICD-9 416.9) | 94 (24.2) | 27 (16.8) | 0.073 |
ICD-9 indicates International Classification of Diseases, Ninth Revision; NA, not applicable; PAH pulmonary arterial hypertension; and PH, pulmonary hypertension.
There was substantial overlap in the use of PH diagnostic codes—233 patients had diagnostic codes for both primary and secondary PH; 96 patients had diagnostic codes for both primary and other PH.
Rule‐Based Algorithms
Rule‐based algorithms performed poorly (Table 2). Defining PH as having ≥2 PH‐related healthcare encounters achieved an AUC of 0.61, with a high sensitivity (0.76) but poor specificity (0.47). Increasing the number of PH‐related healthcare encounters in the case definition improved specificity but substantially reduced sensitivity. Similarly, algorithms that considered multiple diagnoses and PAH medications performed poorly. The algorithm that achieved the highest AUC defined PH as having ≥3 PH‐related healthcare encounters and having undergone RHC (AUC, 0.64). Inclusion of comorbidities associated with PH (including heart failure, cardiomyopathy, myocardial infarction, interstitial lung disease, chronic liver disease, and diabetes mellitus [Table 1]) did not improve the performance of the algorithm. All rule‐based algorithms were able to identify PAH cases more accurately than other PH subtypes (Table 2).
Table 2.
Performance of Rule‐Based Algorithms
| Algorithm | Sensitivity | Specificity | PPV | NPV | AUC | Sensitivity (PAH) | Sensitivity (Other subtypes) |
|---|---|---|---|---|---|---|---|
| ≥2 PH diagnoses+RHC | 0.76 | 0.47 | 0.77 | 0.44 | 0.61 | 0.92 | 0.72 |
| ≥3 PH diagnoses+RHC | 0.63 | 0.65 | 0.81 | 0.42 | 0.64 | 0.83 | 0.58 |
| ≥4 PH diagnoses+RHC | 0.53 | 0.72 | 0.82 | 0.39 | 0.63 | 0.77 | 0.48 |
| ≥2 PH diagnosis+RHC+echocardiography | 0.74 | 0.50 | 0.78 | 0.45 | 0.62 | 0.88 | 0.74 |
| ≥3 PH diagnosis+RHC+echocardiography | 0.61 | 0.66 | 0.81 | 0.41 | 0.64 | 0.79 | 0.61 |
| ≥1 PH diagnosis+RHC+PAH medications | 0.15 | 0.98 | 0.94 | 0.32 | 0.56 | 0.56 | 0.06 |
| ≥3 PH diagnoses+RHC, or ≥1 PH diagnosis+RHC+PAH medications | 0.63 | 0.65 | 0.81 | 0.42 | 0.64 | 0.84 | 0.58 |
| ≥3 PH diagnoses+RHC, or ≥2 PH diagnosis+RHC+one or more comorbidities associated with PH* | 0.74 | 0.51 | 0.79 | 0.45 | 0.63 | 0.88 | 0.57 |
AUC indicates area under the receiver operating characteristic curve; NPV, negative predictive value; PAH, pulmonary arterial hypertension; PPV, positive predictive value; and RHC, right heart catheterization.
Comorbidities were selected based on bivariate analysis and included heart failure, cardiomyopathy, myocardial infarction, interstitial lung disease, chronic liver disease, and diabetes mellitus (see Table 1).
Machine‐Learning Approaches
Machine‐learning approaches outperformed the best‐performing rule‐based algorithm, with all 3 algorithms achieving a significantly improved AUC when tested on the validation set (P<0.0001). Random forest attained the highest AUC (0.88), with a positive predictive value of 0.88, a specificity of 0.70, and a sensitivity of 0.87. The algorithm detected 83% of PAH cases and 88% of all other PH subtypes (Table 3). Gradient boosting machine achieved comparable performance (AUC, 0.85). The model based on lasso regression achieved a lower AUC (AUC, 0.73) compared with random forest and gradient boosting machine, but the difference in AUC between models did not reach statistical significance. The “importance” and “relative influence” of individual variables in each model are provided in Tables 4, 5, 6.
Table 3.
Performance of Machine Learning Algorithms
| Algorithm | Sensitivity | Specificity | PPV | NPV | AUC | Sensitivity (PAH) | Sensitivity (Other Subtypes) |
|---|---|---|---|---|---|---|---|
| Training set | |||||||
| Lasso regression | 0.77 | 0.87 | 0.86 | 0.79 | 0.90 | 0.76 | 0.77 |
| Random forest | 1.00 | 1.00 | 1.00 | 1.00 | 1.00 | 1.00 | 1.00 |
| Gradient boosting machine | 1.00 | 1.00 | 1.00 | 1.00 | 1.00 | 1.00 | 1.00 |
| Validation set | |||||||
| Lasso regression | 0.70 | 0.68 | 0.85 | 0.48 | 0.73 | 0.73 | 0.69 |
| Random forest | 0.87 | 0.70 | 0.88 | 0.69 | 0.88 | 0.83 | 0.88 |
| Gradient boosting machine | 0.87 | 0.70 | 0.88 | 0.68 | 0.85 | 0.90 | 0.86 |
AUC indicates area under the receiver operating characteristic curve; NPV, negative predictive value; PAH, pulmonary arterial hypertension; and PPV, positive predictive value.
Table 4.
The Top 15 Most Important Variables in the Construction of a Lasso Regression Model for Identifying PH Cases
| Variable | Importance |
|---|---|
| Age | 100.0 |
| Heart failure | 87.1 |
| Primary PH | 79.8 |
| PH‐related health encounters (either primary or secondary PH) | 71.1 |
| Number of PAH medication prescriptions | 68.3 |
| Dyspnea | 63.4 |
| Interstitial lung disease | 53.9 |
| Hemolytic anemia | 37.1 |
| Obstructive sleep apnea | 31.1 |
| Heart/lung transplant | 27.9 |
| Echocardiography | 26.5 |
| Electrocardiography | 24.7 |
| Chronic liver disease | 23.5 |
| Male | 21.6 |
| Diabetes mellitus | 20.9 |
PAH indicates pulmonary arterial hypertension; and PH, pulmonary hypertension.
Table 5.
The Top 15 Most Important Variables in the Construction of a Random Forest Model for Identifying PH Cases
| Variable | Importance |
|---|---|
| Age | 100.0 |
| Heart failure | 94.5 |
| Primary PH | 57.5 |
| Valvular heart disease | 52.6 |
| PH‐related health encounters (either primary or secondary PH) | 52.2 |
| Secondary PH | 47.5 |
| Echocardiography | 45.0 |
| Dyspnea | 42.4 |
| Hypertension | 38.6 |
| Electrocardiography | 35.3 |
| Diabetes mellitus | 34.4 |
| Interstitial lung disease | 24.8 |
| Myocardial infarction | 21.8 |
| Obstructive sleep apnea | 20.4 |
| Cardiomyopathy | 20.0 |
PH indicates pulmonary hypertension.
Table 6.
The Top 15 Most Important Variables in the Construction of a Gradient Boosting Model for Identifying PH Cases
| Variable | Relative Influence |
|---|---|
| Heart failure | 16.7 |
| Age | 12.4 |
| Primary PH | 8.4 |
| PH‐related health encounters (either primary or secondary PH) | 7.9 |
| Echocardiography | 6.5 |
| Dyspnea | 6.4 |
| Valvular heart disease | 5.5 |
| Electrocardiography | 5.4 |
| Essential hypertension | 4.8 |
| Diabetes mellitus | 4.6 |
| Interstitial lung disease | 4.6 |
| Secondary PH | 3.1 |
| Obstructive sleep apnea | 2.3 |
| Right heart catheterization | 1.6 |
| Cardiomyopathy | 1.6 |
PH indicates pulmonary hypertension.
Discussion
The availability of Medicare data linked with EHR data has enabled us to demonstrate that administrative claims‐based definitions of PH can be rigorously validated and refined to high fidelity. Specifically, the machine‐learning approaches we have developed offer clear evidence that codified data captured in administrative claims can be used to derive research‐grade case identification algorithms for PH, to our knowledge for the first time in this domain, with both reasonable sensitivity and specificity.
Machine‐learning approaches outperformed decision rules in the identification of both PAH and other PH subtypes. The most optimal rule‐based algorithm—having ≥3 PH‐related healthcare encounters and having undergone RHC—attained an AUC of 0.64. In comparison, machine‐learning algorithms derived from random forest and gradient boosting machine achieved AUCs of 0.88 and 0.85, respectively. A trade‐off between specificity and sensitivity often prevents any model from having good predictive ability on all measures, which is evident in the performance of the rule‐based algorithms evaluated in our analysis, wherein increasing the stringency of the inclusion criteria improved model specificity and positive predictive value at the expense of sensitivity and negative predictive value. Although we chose to optimize AUC as the performance measure of interest in refinement of machine‐learning algorithms, naturally the model of choice should ultimately be determined by the intended use of the algorithm; by using machine‐learning techniques, it is straightforward to adapt model construction accordingly. For example, if the algorithm is intended as a screening tool to capture all possible patients with PH, optimizing sensitivity may be a more appropriate goal in model construction.
Consistent with published research in other disease areas, 16 , 17 , 18 our analyses demonstrate the shortcomings of relying on rule‐based PH diagnostic codes alone for cohort ascertainment and that more reliable algorithms can be attained by combining diagnostic codes with PH‐related workup and treatments (eg, RHC and PAH medications). Our analyses further showed that rule‐based algorithms were able to detect PAH cases more accurately than other PH subtypes, particularly when use of PAH medications was an inclusion criterion. Incorporating comorbid conditions in the case definition did not appear to address this imbalance. Application of these algorithms will therefore create a biased cohort that is primarily composed of patients with PAH. This limitation was not observed in models based on machine‐learning algorithms.
Our study evaluated only a limited set of rule‐based algorithms, guided by algorithms commonly applied in published literature. We acknowledge that there may be other more complex and performant decision rules that we have not considered. A limitation of rule‐based approaches is that the search for the most optimal algorithm requires a trial‐and‐error approach, a challenging task when there is a large number of variables and different permutations of potential rules. In our analyses, we have reduced this “search space” by focusing only on variables that were significantly associated with PH status. To further explore whether the addition of other variables improved the performance of rule‐based models, we conducted additional analyses that combined the best‐performing rule‐based algorithm using the method described above (ie, ≥3 PH diagnosis+RHC) with each PH‐related procedure and comorbidity under study, including those that were not significantly associated with PH status. As shown in Table S2, the results were not substantially different from the original algorithm. In contrast to rule‐based approaches, machine‐learning methods are capable of empirically identifying the most optimal set of variables and classification rules that are difficult to discern by human judgment, particularly in the context of high‐dimensional data.
Although the machine‐learning algorithms developed in the current study achieved good performance, there remained patients who were not readily identifiable. Heterogeneity of clinical presentations may have impacted the performance of the algorithms, with less common PH subtypes (eg, chronic thromboembolic PH) likely to be underdetected. Furthermore, published studies have shown poor adherence to recommended standards of care for patients with PH. McLaughlin et al 19 reported poor uptake in the use of recommended diagnostic tests for PAH across the United States, with only 6% of patients receiving a guideline‐recommended diagnostic workup. A multicenter study reported that 30% of patients received PAH‐specific medications before referral to PH centers for diagnostic workup, and 57% of the prescriptions did not conform to published guidelines. 20 Because PH‐related diagnostic workup and treatments were key input variables to the construction of the case identification algorithms, inconsistencies in their use may have hampered the performance of the algorithms. Importantly, subjects identified through these algorithms may be more likely to receive diagnostic workup and treatments, potentially introducing ascertainment bias, as patients who received suboptimal care were more likely to be left out. To address this limitation, we incorporated common comorbidities associated with PH in model construction. Our analysis showed that comorbid conditions were important predictors for PH cases (Tables 4, 5, 6). To further improve accurate determination of PH status, it may be necessary to access other data sources, such as clinical notes captured in EHRs. The application of natural language processing to these unstructured text records has been shown to substantially improve cohort ascertainment. 21 , 22 , 23 Nonetheless, the performance of the case identification algorithms we developed is comparable to published algorithms that are widely used in other claims‐based research in other diseases.
Study Limitations
Our findings and conclusions should be interpreted in light of several limitations. First, this work was performed at 2 separate academic medical centers within a single organization, raising the possibility that organization‐specific coding and center‐specific clinical practice patterns may affect the generalizability of the models. Retraining of the models will be necessary if the distribution of the underlying data, such as differences in coding practices, differs by sites. Second, we focused our analyses on identifying patients with PH among those with known PH‐related healthcare visits, as is the standard approach of case ascertainment in claims‐based studies, and those with RHC results to ensure accurate case ascertainment. Thus, patients with PH but without the appropriate diagnosis codes and those who did not undergo RHC will not be captured in our algorithms. To evaluate the extent to which limiting the study cohort to those who underwent RHC may have biased the study findings, we examined the proportion of patients with PH‐related healthcare visits who underwent RHC. Of 7504 patients with ≥1 PH‐related healthcare visits during the study period, 7124 (94.9%) underwent at least 1 RHC. We therefore believe that the number of patients missed is likely to be minimal. Third, our current algorithms rely on ICD-9 codes; additional work will be needed to adapt the present algorithms to International Classification of Diseases, Tenth Revision (ICD-10) coding system to support analyses of more recent data. Nonetheless, the algorithms remain relevant in longitudinal studies involving data before the introduction of ICD-10, particularly as PH is a relatively rare condition and inclusion of multiyear data is often necessary to ensure adequate statistical power. Our analysis also applied a hemodynamic definition for PH that has recently been redefined to having a mean pulmonary artery pressure of >20 mm Hg. 9 Additional work will be needed to adapt the present algorithms to this revised definition. Finally, our study focuses only on patients enrolled in Medicare, which represents an older, age‐biased cohort. Therefore, other populations may yield different results because of age‐dependent presentation of PH, other patient demographics, and variability in treatment practices. Nonetheless, methods to advance PH research in the Medicare population are particularly relevant given the rising rates of hospitalization for PH among elderly patients in the United States. 24
Conclusions
Although designed primarily for billing purposes, administrative claims are an important tool for epidemiologic research. Our study has established that reliable algorithms for identifying patients with PH can be defined with high fidelity. PH research using claims data would be considerably strengthened through the use of validated, quantifiable algorithms for cohort ascertainment.
Sources of Funding
Research reported in this publication was supported by the National Heart, Lung, And Blood Institute of the National Institutes of Health under Award Number U01HL121518, National Center for Advancing Translational Sciences (NCATS)/National Institutes of Health, Award Number U01TR002623 and CDRN‐1306‐04864 from the Patient Centered Outcomes Research Institute. The content is solely the responsibility of the authors and does not necessarily represent the official views of the National Institutes of Health.
Disclosures
None.
Supporting information
Tables S1–S2
Acknowledgments
Author contributions: Dr Ong had full access to all of the data in the study and takes responsibility for the integrity of the data and the accuracy of the data analysis, including and especially any adverse effects. Drs Klann, Lin, Maron, Murphy, Natter, and Mandl contributed substantially to the study design, data analysis and interpretation, and the writing of the manuscript.
(J Am Heart Assoc. 2020;9:e016648 DOI: 10.1161/JAHA.120.016648.)
Supplementary Materials for this article are available at https://www.ahajournals.org/doi/suppl/10.1161/JAHA.120.016648
For Sources of Funding and Disclosures, see page 9.
References
- 1. Mathai SC, Mathew S. Breathing (and coding?) a bit easier: changes to international classification of disease coding for pulmonary hypertension. Chest. 2018;154:207–218. [DOI] [PubMed] [Google Scholar]
- 2. Papani R, Sharma G, Agarwal A, Callahan SJ, Chan WJ, Kuo YF, Shim YM, Mihalek AD, Duarte AG. Validation of claims‐based algorithms for pulmonary arterial hypertension. Pulm Circ. 2018;8:2045894018759246. [DOI] [PMC free article] [PubMed] [Google Scholar]
- 3. Geva A, Gronsbell JL, Cai T, Murphy SN, Lyons JC, Heinz MM, Natter MD, Patibandia N, Bickel J, Mullen MP, et al. A computable phenotype improves cohort ascertainment in a pediatric pulmonary hypertension registry. J Pediatr. 2017;188:224–231. [DOI] [PMC free article] [PubMed] [Google Scholar]
- 4. Kirby JC, Speltz P, Rasmussen LV, Basford M, Gottesman O, Peissig PL, Pacheco JA, Tromp G, Pathak J, Carrell DS, et al. PheKB: a catalog and workflow for creating electronic phenotype algorithms for transportability. J Am Med Inform Assoc. 2016;23:1046–1052. [DOI] [PMC free article] [PubMed] [Google Scholar]
- 5. Shivade C, Raghavan P, Fosler‐Lussier E, Embi PJ, Elhadad N, Johnson SB, Lai AM. A review of approaches to identifying patient phenotype cohorts using electronic health records. J Am Med Inform Assoc. 2014;21:221–230. [DOI] [PMC free article] [PubMed] [Google Scholar]
- 6. Bergquist SL, Brooks GA, Keating NL, Landrum MB, Rose S. Classifying lung cancer severity with ensemble machine learning in health care claims data. Proc Mach Learn Res. 2017;68:25–38. [PMC free article] [PubMed] [Google Scholar]
- 7. Richesson RL, Sun J, Pathak J, Kho AN, Denny JC. Clinical phenotyping in selected national networks: demonstrating the need for high throughput, portable, and computational methods. Artif Intell Med. 2016;71:57–61. [DOI] [PMC free article] [PubMed] [Google Scholar]
- 8. Hoeper MM, Bogaard HJ, Condliffe R, Frantz R, Khanna D, Kurzyna M, Langleben D, Manes A, Satoh T, Torres F, et al. Definitions and diagnosis of pulmonary hypertension. J Am Coll Cardiol. 2013;62:D42. [DOI] [PubMed] [Google Scholar]
- 9. Simonneau G, Montani D, Celermajer DS, Denton CP, Gatzoulis MA, Krowka M, Williams PG, Souza R. Haemodynamic definitions and updated classification of pulmonary hypertension. Eur Respir J. 2019;53:1801913. [DOI] [PMC free article] [PubMed] [Google Scholar]
- 10. Maron BA, Galiè N. Pulmonary arterial hypertension diagnosis, treatment, and clinical management in the contemporary era. JAMA Cardiol. 2016;1:1056-1065. [DOI] [PMC free article] [PubMed] [Google Scholar]
- 11. Opitz CF, Hoeper MM, Gibbs JS, Kaemmerer H, Pepke‐Zaba J, Coghlan JG, Scelsi L, D’Alto M, Olsson KM, Ulrich S, et al. Pre‐capillary, combined, and post‐capillary pulmonary hypertension: a pathophysiological continuum. J Am Coll Cardiol. 2016;68:368–378. [DOI] [PubMed] [Google Scholar]
- 12. McLaughlin VV, Vachiery JL, Oudiz RJ, Rosenkranz S, Galiè N, Barberà JA, Forst AE, Ghofrani H‐A, Peacock AJ, Simonneau G, et al. Patients with pulmonary arterial hypertension with and without cardiovascular risk factors: results from the AMBITION trial. J Heart Lung Transplant. 2019;38:1286–1295. [DOI] [PubMed] [Google Scholar]
- 13. Tibshirani R. Regression shrinkage and selection via the lasso: a retrospective. J Roy Stat Soc: Ser B. 2011;73:273–282. [Google Scholar]
- 14. Breiman L. Random forests. Mach Learn. 2001;45:5–32. [Google Scholar]
- 15. Hanley JA, McNeil BJ. A method of comparing the areas under receiver operating characteristic curves derived from the same cases. Radiology. 1983;148:839–843. [DOI] [PubMed] [Google Scholar]
- 16. Link J, Glazer C, Torres F, Chin K. International Classification of Diseases coding changes lead to profound declines in reported idiopathic pulmonary arterial hypertension mortality and hospitalizations: implications for database studies. Chest. 2011;139:497–504. [DOI] [PMC free article] [PubMed] [Google Scholar]
- 17. Cipparone CW, Withiam‐Leitch M, Kimminau KS, Fox CH, Singh R, Kahn L. Inaccuracy of ICD-9 codes for chronic kidney disease: a study from two practice‐based research networks. J Am Board Farm Med. 2015;28:678–682. [DOI] [PubMed] [Google Scholar]
- 18. Woodworth GF, Baird CJ, Garces‐Ambrossi G, Tonascia J, Tamargo RJ. Inaccuracy of the administrative database: comparative analysis of two databases for the diagnosis and treatment of intracranial aneurysms. Neurosurgery. 2009;65:251–256. [DOI] [PubMed] [Google Scholar]
- 19. McLaughlin VV, Langer A, Tan M, Clements PJ, Oudiz RJ, Tapson VF, Channick RN, Rubin LJ; Pulmonary Arterial Hypertension‐Quality Enhancement Research Initiative (PAH‐QuERI) Investigators . Contemporary trends in the diagnosis and management of pulmonary arterial hypertension: an initiative to close the care gap. Chest. 2013;143:324–332. [DOI] [PubMed] [Google Scholar]
- 20. Deaño RC, Glassner‐Kolmin C, Rubenfire M, Frost A, Visovatti S, McLaughlin VV, Gomberg‐Maitland M. Referral of patients with pulmonary hypertension diagnoses to tertiary pulmonary hypertension centers: the multicenter RePHerral study. JAMA Intern Med. 2013;173:887–893. [DOI] [PubMed] [Google Scholar]
- 21. Liao KP, Cai T, Savova GK, Murphy SN, Karlson EW, Ananthakrishnan AN, Gainer VS, Shaw SY, Xia Z, Szolovits P, et al. Development of phenotype algorithms using electronic medical records and incorporating natural language processing. BMJ. 2015;350:h1885. [DOI] [PMC free article] [PubMed] [Google Scholar]
- 22. Ananthakrishnan AN, Cai T, Savova G, Cheng SC, Chen P, Perez RG, Gainer VS, Murphy SN, Szolovits P, Zia Z, et al. Improving case definition of Crohn’s disease and ulcerative colitis in electronic medical records using natural language processing: a novel informatics approach. Inflamm Bowel Dis. 2013;19:1411–1420. [DOI] [PMC free article] [PubMed] [Google Scholar]
- 23. Liao K, Cai T, Gainer V, Goryachev S, Zeng‐treitler Q, Raychaudhuri S, Szolovits P, Churchill S, Murphy S, Kohane I, et al. Electronic medical records for discovery research in rheumatoid arthritis. Arthritis Care Res. 2010;62:1120–1127. [DOI] [PMC free article] [PubMed] [Google Scholar]
- 24. George MG, Schieb LJ, Ayala C, Talwalkar A, Levant S. Pulmonary hypertension surveillance: United States, 2001 to 2010. Chest. 2014;146:476–495. [DOI] [PMC free article] [PubMed] [Google Scholar]
Associated Data
This section collects any data citations, data availability statements, or supplementary materials included in this article.
Supplementary Materials
Tables S1–S2