

Abstract
We sought to determine whether temporal changes in the lower airway microbiome are associated with ventilator-associated pneumonia (VAP) in children.
Using a multicenter prospective study of children 31 days to 18 years requiring mechanical ventilation (MV) support for > 72 hours, daily tracheal aspirates were collected and analyzed by sequencing of the 16S rRNA gene. VAP was assessed using 2008 CDC pediatric criteria. The association between microbial factors and VAP was evaluated using joint longitudinal time-to-event modeling, matched case-control comparisons, and unsupervised clustering.
Of 366 eligible subjects, 66 (15%) developed VAP at a median of 5 (IQR: 3 – 5) days post intubation. At intubation, there was no difference in total bacterial load (TBL), but Shannon diversity and the relative abundance of Streptococcus, Lactobacillales, and Prevotella were lower for VAP subjects versus non-VAP subjects. However, higher TBL on each sequential day was associated with a lower hazard (HR: 0.39; CI: 0.23, 0.64) for developing VAP, but sequential values of diversity were not associated with VAP. Similar findings were observed from the matched analysis and unsupervised clustering. The most common dominant VAP pathogens included Prevotella species (19%), Pseudomonas aeruginosa (14%), and Streptococcus mitis/pneumoniae (10%). Mycoplasma and Ureaplasma were also identified as dominant organisms in several subjects.
In mechanically ventilated children, changes over time in microbial factors were marginally associated with VAP risk, although these changes were not suitable for predicting VAP in individual patients. These findings suggest that focusing exclusively on pathogen burden may not adequately inform VAP diagnosis.
Summary Statement:
In mechanically ventilated children, microbial factors were subtly different at intubation between those who did and did not develop VAP, and changes over time were marginally associated with VAP risk, suggesting other factors may contribute to VAP.
INTRODUCTION
Mechanically ventilated children are at high risk for ventilator-associated pneumonia (VAP). Children who develop VAP have an increased risk of mortality (1) and morbidities such as prolonged intubation and pediatric intensive care unit (PICU) stays, and the need for extensive rehabilitation (2). Suspected VAP is the most common indication for antibiotic use in the PICU, accounting for almost half of all antibiotic days (3). Limited understanding of the microbial and host factors associated with VAP has precluded the development of effective prevention, diagnostic, and treatment strategies.
The prevailing theory behind the pathogenesis of pneumonia, including VAP, is that a pathogen enters the respiratory tract and multiplies until it overwhelms endogenous microbiota and the host defense. Endogenous bacteria (4, 5) are likely critical regulators of both pathogen behavior and host responses in the airways (6–12). As such, factors that impact airway microbiota or the host response are key risk factors for development of VAP (11, 13–18). Yet, the typical culture methodology employed in the clinical environment lacks the sensitivity to assess changes in the microbiota over time.
Culture-independent molecular techniques, using nucleic acid isolated from respiratory samples, can provide sensitive quantification of the bacterial constituents of the lower airway microbiome (19–23), enabling analysis of longitudinal changes in bacterial communities in relation to development of VAP. Intestinal conditions have been associated with changes in bacterial communities over time (24–26); specifically, lower alpha diversity and relative absence of commensal organisms are associated with increased inflammation, barrier permeability, and disease status (27, 28). Early evaluations of the respiratory tract microbiota in mechanically ventilated adults suggest similar shifts in bacterial composition occur among those who develop VAP compared to those who do not (21, 22, 29), but these studies were performed in small numbers of patients and lacked daily molecular assessments to derive conclusive evidence of these associations.
The objectives of this prospective multi-center cohort study of mechanically ventilated children were to determine whether 1) compositional differences at the time of intubation, and 2) decreasing lower airway bacterial alpha diversity, increasing bacterial burden, and compositional change of the microbiome (increasing pathogen abundance) over time, are associated with development of VAP. Further, we sought to determine whether these patterns are evident prior to the clinical determination of VAP, allowing for earlier detection and more effective treatment strategies. Some of the results were previously reported in abstract form (30).
MATERIAL AND METHODS
Study Design and Subjects
We conducted a prospective cohort study of mechanically ventilated children admitted to the 8 PICUs in the National Institute of Child Health and Human Development’s Collaborative Pediatric Critical Care Research Network (CPCCRN) from February 2015 to December 2017. Children ages 31 days – 18 years who were expected to require mechanical ventilation (MV) via endotracheal tube (ETT) >72 hours were eligible. Exclusion criteria included: children in whom an ETT aspirate was not obtained within 24 hours of intubation, those with a tracheostomy tube or with plans to place one, conditions in which deep tracheal suctioning was contraindicated, a previous episode of MV during the hospitalization, previous enrollment into this study; and limitations of care.
Eligible patients and their legal guardians were approached for consent within 96 hours of intubation. Delayed consent was granted, allowing for tracheal aspirate (TA) samples collected from standard of care suctioning of the ETT via sterile specimen trap and stored at −80°C until informed consent could be obtained. Specimens from non-consenting patients were destroyed. The study was approved by the University of Utah central IRB.
Initial specimens were collected within 24 hours of intubation, and subsequent samples were collected daily until the first attempted extubation or for up to 14 days. Specimens were frozen at −80°C until analysis. Clinical data were prospectively collected as detailed in the supplementary material. Subjects were screened daily to identify VAP defined by the pediatric 2008 Center for Disease Control (CDC) criteria (31) in blinded fashion to the caregivers. Physicians were also separately surveyed daily to determine whether they initiated antibiotics for suspected or diagnosed VAP. Details on the method for applying the CDC criteria and physician diagnosis are provided in the supplementary material.
Only subjects undergoing MV for >72 hours were included in the final analyses (Figure 1). Given the limitations of the CDC VAP definition, with significant false positive and negative cases (32), we removed subjects with a physician diagnosis or suspected VAP who did not meet CDC VAP criteria (n = 88) who may represent false negative CDC cases. The remaining subjects (n= 366) represent the “supervised analytic cohort”.
Figure 1:

CONSORT diagram
Laboratory Assays
The supplementary material provides details of laboratory assays. Briefly, DNA extraction was performed using the Qiagen EZ1 advanced extraction platform. Total bacterial load (TBL) was estimated by quantitative PCR (33, 34). Bacterial community composition was assessed by amplification of the V1/V2 region of the 16S ribosomal RNA gene (16S) (34–36). The relative abundance (RA) of each taxon was calculated (number of sequences for specific taxon/total number of sequences*100). Shannon diversity and evenness indices characterized alpha diversity. Morisita-Horn characterized beta diversity between longitudinally collected samples within subjects.
Statistical Analyses
A complete description of statistical methods is included in the supplementary material. Briefly, the association between changes in microbial factor measures over time and development of VAP was estimated using a joint longitudinal time-to-event model (JointModel package in R, R Foundation, Vienna) that included all subjects in the supervised analytical cohort (n = 366); covariates included age at intubation, Pediatric Risk of Mortality (PRISM) III score (37), antibiotic exposure (detailed in the supplementary material), and subject-specific random intercepts and slopes. Due to anticipated differences in the baseline characteristics between VAP and non-VAP subjects, an a priori sub-analysis was performed employing a group matching scheme based on age at intubation, PRISM III score, infectious admitting diagnosis, and duration of MV. For this analysis, the day of VAP diagnosis in VAP subjects was designated as “Day 0” and a corresponding day of MV was assigned in the non-VAP subjects. Mixed effects models were used to evaluate the changes in microbial factors and beta diversity measures over time. A sensitivity analysis using the full cohort (n=454) was also performed.
Given the marked heterogeneity of the cohort, an unsupervised random forest clustering algorithm in the full cohort was used to evaluate the association between select clinical and microbial factors at intubation to identify subpopulations of patients at high risk for VAP.
RESULTS
Cohort description
Of 1,542 subjects screened, 514 were enrolled, 454 were ventilated >72 hours and had TA samples available for analysis, and 366 subjects met criteria to be included in the supervised analytic cohort (Figure 1). Tables 1 and S1 describe the cohort characteristics, and subject specific reports can be found at https://wkayla.shinyapps.io/subject_specific/ (Figure S1). For the supervised analytic cohort, median age was 17 (inter-quartile range [IQR]: 5 – 66) months, and 58% were male. Infection was the presenting diagnosis for 284 (78%) patients, of whom 203 (55%) were lower respiratory tract infection (LRTI) and 45 (12%) were sepsis. Clinically performed viral PCR testing within 48 hours of admission was positive in 127 (35%) subjects. Severity of Illness (median PRISM III score: 5 [IQR: 1, 10] and antibiotic exposure (128 [35%] within 7 days prior to intubation, and 317 [87%] on the day of intubation) were similar between groups. Sixty-six (18%) subjects developed VAP at a median of 5 days (IQR: 3 – 5) post-intubation (Figure S2). VAP subjects were more likely to be placed on extracorporeal membrane oxygen (ECMO) support, have longer duration of MV and oxygen support, longer PICU and hospital stays, and be discharged from the hospital on oxygen therapy (Table 1). Mortality was higher in VAP subjects (11% [n= 7]) compared to non-VAP subjects (4% [n = 11]; p = 0.027).
Table 1.
Baseline Characteristics and Outcomes.
| All Subjects (n=454) | Supervised Analytic Cohort (n=366) | Subjects with Physician diagnosed or suspected VAP not meeting CDC criteria (n=88) | |||
|---|---|---|---|---|---|
| Patient Characteristics | No VAP (n=300) | VAP (n=66) | P-value | ||
| Gender (Male) | 257 (57%) | 166 (55%) | 45 (68%) | 0.076 | 46 (52%) |
| Age at Intubation (months) | 16.7 (5.0, 71.6) | 17.5 (4.9, 76.5) | 14.0 (3.7, 38.0) | 0.085 | 17.3 (6.6, 89.7) |
| Admission Category1 | 0.001 | ||||
| Medical | 393 (87%) | 257 (86%) | 66 (100%) | 70 (79%) | |
| Surgical | 34 (7%) | 30 (10%) | 0 (0%) | 4 (4%) | |
| Trauma | 27 (6%) | 13 (4%) | 0 (0%) | 14 (16%) | |
| Infectious Admitting Diagnosis | 332 (73%) | 224 (75%) | 60 (91%) | 0.007 | 48 (54%) |
| Primary Admitting Diagnosis | 0.005 | ||||
| Lower respiratory tract infection | 236 (52%) | 154 (51%) | 49 (74%) | 33 (37%) | |
| Sepsis | 48 (11%) | 39 (13%) | 6 (9.1%) | 3 (3%) | |
| Trauma | 25 (5.5%) | 13 (4%) | 0 (0%) | 12 (14%) | |
| Other | 145 (32%) | 94 (31%) | 11 (17%) | 40 (45%) | |
| Comorbidity2 | 219 (48%) | 143 (48%) | 35 (53%) | 0.514 | 41 (47%) |
| Baseline Functional Status Score | 6 (6, 8) | 6 (6, 8) | 6 (6, 9) | 0.428 | 6 (6, 8.3) |
| Received antibiotics within 7 days prior to intubation | 152 (33%) | 104 (34%) | 24 (36%) | 0.62 | 24 (27%) |
| Received antibiotics on day of intubation | 386 (85%) | 259 (86%) | 58 (88%) | 0.15 | 69 (78%) |
| Proportion of Intubated Days on antibiotics | 0.29 (0.14, 0.6) | 0.32 (0.18, 0.68) | 0.25 (0.12, 0.39) | 0.003 | 0.18 (0.07, 0.43) |
| PRISM III Score | 5 (2, 10) | 5 (1.75, 10) | 5.5 (1.25, 10) | 0.644 | 6.5 (2, 11) |
| Patient Outcomes | |||||
| Length of first intubation3 | 6 (5, 8) | 6 (4, 7) | 10 (7, 14) | <0.0001 | 8 (6, 11) |
| Ventilator Free Days in first 28 days | 21 (19, 23) | 22 (20, 24) | 18 (12, 21) | <0.0001 | 19 (14, 22) |
| PICU LOS3 | 10 (7, 15) | 9 (7, 12) | 14 (10, 26) | <0.0001 | 12 (9, 19) |
| Hospital LOS3 | 17 (11, 29) | 16 (11, 24) | 20 (14, 37) | 0.001 | 21 (14, 34) |
| Hospital mortality1 | 27 (6%) | 11 (4%) | 7 (11%) | 0.027 | 79(10%) |
| ECMO during ICU Stay1 | 14 (3%) | 6 (2%) | 7 (11%) | 0.003 | 1 (1%) |
| New Morbidity | 183 (42%) | 121 (41%) | 24 (39%) | 0.873 | 38 (47%) |
| Discharged from hospital on oxygen1 | 66 (14%) | 36 (12%) | 14 (21%) | 0.006 | 16 (18%) |
| Total number of days on oxygen3 | 10 (7, 14) | 9 (7, 12) | 14 (9, 26) | <0.0001 | 11 (8, 18) |
Fisher’s exact test was used to compare groups
Specific comorbidities are listed in Table E1
Values presented as median (Interquartile range), Wilcoxon rank sum test was used to compare groups
P-value for comparison between no VAP and VAP subjects in the supervised analytic cohort
Abbreviations: PRISM: Pediatric Risk of Mortality; PICU: pediatric intensive care unit; LOS, length of stay; ECMO: extracorporeal membrane oxygenation.
Sample collection description
For the whole cohort (n=454), there was a total of 4,031 ventilator days, and 2,987 (74%) TA samples were collected. Of those, 2,202 (74%) samples had sufficient bacterial DNA present to obtain robust sequence data (Supplementary methods). Similar values were observed for the supervised analytic cohort (Table S2, Figures S3 and S4).
Association between microbial factors and development of VAP
On the day of intubation, there were statistically lower Shannon diversity and evenness indices for VAP subjects versus non-VAP subjects, but no differences in TBL. The relative abundance was lower at intubation in the VAP subjects for the following taxa: Streptococcus, Lactobacillales, Prevotella, and Prevotella taxonJF146818 (Table S3). The first sample with sequencing data within 48 hours of intubation revealed a dominant organism (taxon with relative abundance >50%) in 187 (51%) subjects, of which 120 (64%) were admitted with a LRTI. The most common dominant taxa included Haemophilus, Moraxella, Streptococcus mitis/pneumoniae, Staphylococcus aureus, and Prevotella melaninogenica. At the time of VAP diagnosis, Pseudomonas aeruginosa represented the most common dominant taxon (n= 6, 14%), followed by Prevotella melaninogenica (n= 4, 10%), and Streptococcus mitis/pneumoniae (n = 4, 10%) (Table 2). Overall, Prevotella species represented 8 (19%) of the cases. Of the VAP subjects with a dominant organism, 45% had the dominant organism present in the initial TA sample. For 24% of VAP subjects, the most abundant taxon represented <50% relative abundance.
Table 2:
Dominant Taxon1 in VAP patients on day ± 1 of diagnosis
| Taxon | Number of VAP cases2 (n=42) |
|---|---|
| Pseudomonas aeruginosa | 6 |
| Prevotella melaninogenica | 4 |
| Streptococcus mitis/pneumoniae | 4 |
| Enterobacteriaceae spp. | 3 |
| Mycoplasma spp. | 3 |
| Haemophilus spp. | 3 |
| Streptococcaceae spp. | 2 |
| Moraxella spp. | 2 |
| Ureaplasma spp. | 2 |
| Staphylococcus epidermidis | 2 |
| Stenotrophomonas spp. | 2 |
| Escherichia/Shigella spp. | 1 |
| Staphylococcus aureus | 1 |
| Bacilli spp. | 1 |
| Acinetobacter spp. | 1 |
| Neisseria mucosa | 1 |
| Prevotella oral taxon299 strF0039* | 1 |
| Prevotella oral taxon306 strF0472** | 1 |
| Prevotella taxon JF146818 | 1 |
| Prevotella spp. | 1 |
Dominant taxa are defined as those with >50% relative abundance.
Fifty-five VAP cases had samples/sequence data available with ± 1day of diagnosis, 13 had top ranked taxa < 50%.
Beta diversity measures quantify the divergence in communities within individual subjects over time. Evaluation of trends in beta diversity indicated that VAP subjects had a bimodal pattern of higher divergence in their bacterial communities early (days 3–4) and late (days 10–11) compared to non-VAP subjects (Figure 2 A and B). When sequential samples were compared to their intubation sample, VAP subjects appeared to have more divergence over time than non-VAP subjects (Figure 2 C and D). However, these overall differences were not statistically significant when evaluated with the mixed effects models.
Figure 2: Comparison of beta diversity between VAP and non-VAP subjects in the supervised analytic cohort.

Plots A and C present the raw Morisita Horn (MH) values for each individual (grey lines) and the average trends for the VAP groups using smoothing splines (colored curves). Plots B and D include the estimates and the 95% confidence intervals from the mixed model. The solid lines are included in the CI for the other group, indicating there is no significant difference between groups. Plots A and B correspond to the MH between consecutively collected samples within an individual. Plots C and D correspond to the MH between each sample and the intubation sample for each subject. All plots exclude samples collected after VAP diagnosis for VAP subjects.
Joint Models Time-to-Event Analysis
Three joint models were constructed, each of which included time to VAP as one outcome and a microbial factor (TBL, Shannon diversity or Shannon evenness) modeled over time during MV as a second longitudinal outcome. The joint model assumes a linear trend over time for the longitudinal outcomes, and each sequential day’s microbial factor value is included into the time to VAP diagnosis component of the model. On average, TBL increased over time; no significant changes were observed for Shannon diversity or evenness (Table S4). Multiple measures of antibiotic exposure were associated with diversity and evenness but not with TBL (Table S4, Figure 3A). In the subset of subjects with sequencing data, younger age was associated with shorter time to VAP after adjusting for PRISM III and microbial factors. After adjustment for days on MV, measures of antibiotic exposure, age, and PRISM III score, only TBL was associated with development of VAP (Table S4, Figure 3B). Surprisingly and counterintuitively, higher TBL on each sequential day of MV was associated with a lower hazard (HR: 0.39; CI: 0.23, 0.64) for developing VAP (Table S5). There was no association between each sequential day’s diversity or evenness values and the hazard for VAP. Employing different approaches to incorporate the longitudinal outcome, the association between TBL and development of VAP was consistent for lagged values (values from the days preceding the current day’s value in the model) and slopes of the sequential values (Table S5). However, for diversity and evenness there was an association only with the slopes of those measures over time and the development of VAP. Because sequence data were missing on day of diagnosis for some VAP patients (n=18 [27%]), a sensitivity analysis was performed that included VAP subjects with at least 3 samples, one of which had to be collected within a day of diagnosis. The results were consistent with the findings of the initial analysis (data not shown). We also performed these analyses in the entire cohort (n=454) including all subjects not meeting CDC VAP criteria (n=388) with similar results (data not shown).
Figure 3. Parameter estimates from the three joint models, each of which includes time to VAP and a microbial factor modeled over time as outcomes.

The joint model assumes a linear trend over time for the longitudinal outcomes and the current or sequential values for the microbial factor is included into the time to VAP diagnosis component of the model. Antibiotic exposure was measured in 4 ways: cumulative antibiotic coverage score indicates the overall broadest spectrum antibiotic coverage the patient received throughout the period of intubation up until the time the sample was collected, total antibiotic coverage score by day indicates the broadest spectrum coverage of antibiotic the patient received on the day the sample was collected, cumulative days of antibiotic exposure indicates number of antibiotics given during the time of intubation up until the sample was collected, and number of antibiotics by day indicates number of drugs given on the day of sample collection. A forest plot displaying the (A) parameter estimates from the longitudinal outcome component of the joint model for each of the microbial factors and (B) the hazard ratios from the time to VAP component of the joint model. These model estimates indicate that microbial factors change over time and with antibiotic exposure. Time to VAP diagnosis is associated with TBL. In the subset of subjects with sequencing data, younger age is associated with shorter time to VAP after adjusting PRISM III and microbial factors. After adjustment for time, antibiotic exposure, age and PRISM III score, only TBL was associated with development of VAP. Error bars correspond to 95% credible intervals from the joint model, intervals that exclude values of 0 in A or 1 in B are significantly associated with the variables listed on the y-axis. CrI: credible interval.
Matched Case-Control Analysis
The 66 VAP patients were group matched to 227 patients who did not develop VAP either by the CDC diagnostic criteria or by physician diagnosis or suspicion of VAP. The VAP and non-VAP groups were balanced based on age at intubation, PRISM III score, infectious admitting diagnoses, and length of MV (match quality is reported in Table S6). Comparisons of the lower airway bacterial communities at intubation and at Day 0 (VAP group: day of VAP diagnosis, non-VAP group: corresponding MV day) are provided in Figure S5. Applying the beta diversity metrics to the matched cohort, we found that the degree of divergence was greatest 3 days prior to Day 0 and was more divergent in the VAP subjects, although not statistically higher compared to non-VAP subjects (difference of 0.15, p = 0.06; Figure S6). We observed lower diversity and evenness in the VAP cases at day −2, but not at days −3, −1, or 0 (Table S7 and Figure 4). TBL was lower in the VAP group at day −3 only (Figure 4), but there were no differences in the day-to-day changes from intubation in any of the measures between the VAP and non-VAP groups from days −3 to 0 (Table S7, Figure S7).
Figure 4: Average trajectories of change in microbial factors reveal subtle statistical differences between subjects who developed VAP compared to subjects who did not develop VAP in the matched cohort.
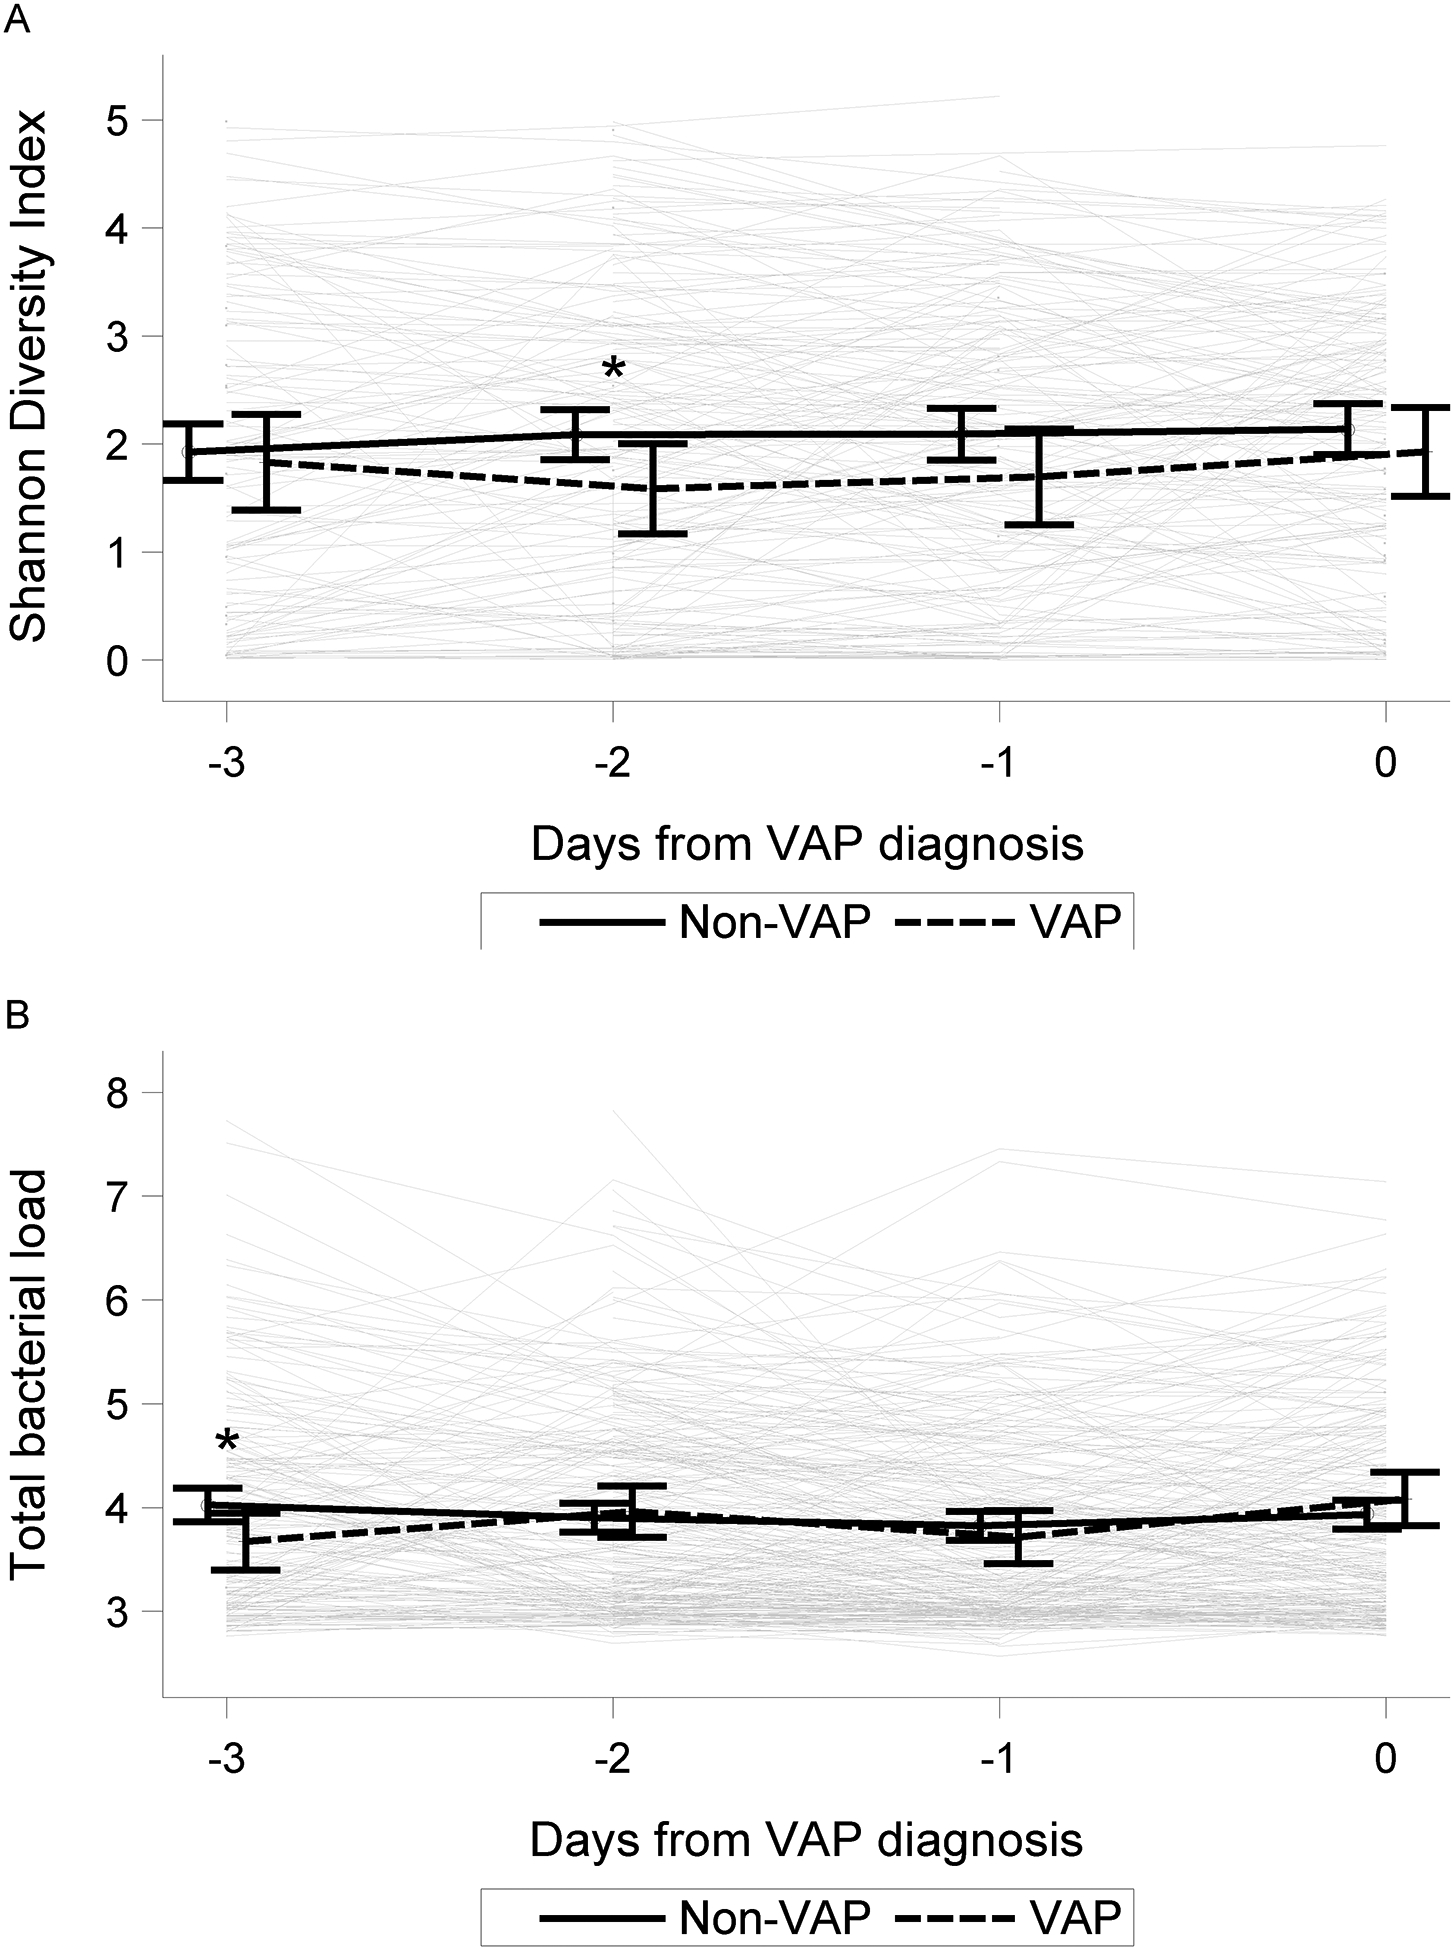
Day 0 denotes day of diagnosis in VAP cases (n = 66) and the reference day of mechanical ventilation in controls (n=227; see supplement for details). Comparisons are displayed for Shannon Diversity (A) and Total Bacterial Load (B), Shannon Evenness not shown, for up to 3 days preceding Day 0. Comparison of diversity between VAP cases and controls at each of three days prior to Day 0 indicated a lower diversity in the VAP cases at day −2 prior to VAP diagnosis compared to controls (* indicate p-value < 0.05), however, significant differences were not present on days −3, −1 or 0.
Cluster Analysis: Temporal changes in community composition within endotypes
Given the high degree of heterogeneity of subjects in the cohort (Table 1 and S1), an unbiased clustering algorithm based on clinical and microbiological characteristics at the time of intubation was used to create subgroups of subjects with similar presentation. The dendrogram, a graphical description of the hierarchical clustering (Figure S8), indicated several tight, small clusters of patients with similar microbial composition and clinical characteristics. The contribution of changes in microbial composition or antibiotic treatment to the development of VAP was then evaluated within each cluster (Figure 5). The clusters were not clearly associated with VAP diagnosis. For example, the leftmost cluster of subjects contains 33 subjects with TA samples dominated by Haemophilus, the majority of whom had an infectious diagnosis and low PRISM III scores upon intubation. Of this subset, 4 subjects were diagnosed with VAP with variation in the dominant organism at or near the time of VAP (2 with Streptococcus mitis/pneumoniae, 1 with Bacilli, and 1 Prevotella). There were no consistent differences in the temporal changes in microbial factors, site effects, or administered antibiotics that might explain an association with VAP in this more homogeneous group of subjects. Similar heterogeneity was noted amongst the other clusters.
Figure 5: Clustering analysis does not reveal high-risk VAP phenotypes.

The patient clusters represented in Figure S8 are displayed by the dendrogram at the top of the figure. Outcomes (VAP, length of mechanical ventilation, mortality) for each subject are indicated using color bars underneath the corresponding terminal end of the dendrogram. The heatmap displays the relative abundance for the taxa identified in the sample either at VAP diagnosis for cases or 48 hours prior to extubation for non-VAP subjects. Subjects clustered together based on their clinical and microbial factors at intubation are displayed next to each other, the distance between subjects is indicated by the dendrogram at the top. There are no discernable differences in any clinical, treatment (antibiotic score; see supplementary material for details), or microbial factors that might explain why subjects in the same cluster develop VAP while others did not. Total bacterial load, richness, diversity, and evenness are presented for day of VAP diagnosis or 48 hours prior to extubation in non-VAP subjects. Abbreviations LOS: length of hospital stay, TBL: total bacterial load, Length MV: Length of mechanical ventilation, Mortality: in-hospital mortality, VAP: ventilator associated pneumonia, RA: relative abundance.
DISCUSSION
In this prospective multi-center cohort study of mechanically ventilated children at high risk for VAP, those who developed VAP exhibited lower Shannon diversity and lower relative abundance of Streptococcus, Lactobacillales, and Prevotella, on the day of intubation compared with those without VAP. The composition of bacterial communities diverged more over time in VAP subjects compared to non-VAP subjects; these differences were not statistically significant. Subtle differences in microbial factors (TBL, diversity and evenness) were associated with development of VAP after adjusting for antibiotic exposure in both joint time-to-event and matched case-control analyses.
To our knowledge this is the first comprehensive evaluation of the lower airway microbiota in mechanically ventilated children relative to the development of VAP. Our findings are consistent with previous studies performed in adults (20, 21, 29, 38), including one report of an association between VAP and lower abundance of Bacilli, which includes Streptococcus and Lactobacillus, at intubation (29). While these associations may provide insight into potential pathogenic mechanisms, given the variability in the longitudinal evolution of the microbiome, it is unlikely they will provide useful clinical prognostication for individual patients. Unsupervised clustering of subjects using baseline characteristics did not identify subgroups of subjects at significant risk for developing VAP. Additionally, within relatively homogeneous clusters of subjects, there were no discernable changes in the bacterial community or antibiotic usage patterns that were associated with VAP, suggesting other unmeasured factors may contribute to development of VAP.
The hypothesis that VAP, like other infections, is characterized by an increase in bacterial burden and a decrease in community diversity (21, 29, 39) was not clearly evident in our study. The decrease in microbial diversity during MV support is consistent with other studies, and we found that antibiotic exposure is directly associated with diversity and evenness, but change in diversity was not consistently associated with the development of VAP over time (only observed 2 days prior to VAP in the matched cohort), even after adjusting for antibiotic exposure. In general, these changes over time appear subtle in context of the large longitudinal intra- and inter-subject variation. In both analytic approaches, we found that on average, TBL was lower in VAP cases than in non-VAP cases, contrary to our hypothesis. Yet, there were individuals who exhibited increases in TBL with development of VAP. Given the high use of antibiotics, it is possible that the lower TBL signifies microbiome depletion, providing a gap for pathogen colonization and subsequent infection, but this explanation would require more detailed studies to confirm. Because TBL is a measure of the entire bacterial community burden, it may not directly represent pathogen burden, e.g. if the pathogen burden increases while other commensal bacterial burden decrease, the TBL may not change significantly.
To sufficiently characterize the existence of infection, an increase in pathogen burden must be coupled with evidence of tissue injury and host inflammatory response. The latter is a key measure that is missing in our study and suggests that even with the increased sensitivity of molecular microbial detection methodology and a large sample size, simply focusing on the quantitative composition of the bacterial microbiome of tracheal aspirate specimens is not sufficient to fully elucidate the pathogenesis and key risk factors for VAP. The evolution of the airway microbiota as it relates to development of VAP is likely a more dynamic process than daily molecular taxonomic analysis can assess given its inability to measure metabolic activity, replication rates, and virulence of the bacteria as they interact with each other and the host. Approximately 20% of VAP cases did not have a dominant organism. These could represent false-positive cases, consistent with known limitations of the CDC definition (32). We attempted to correct for confounding by antibiotic administration by excluding cases in which physician suspicion for VAP led to antibiotic administration before CDC criteria could be satisfied, but many patients received antibiotics for reasons other than VAP. Alternatively, it is possible that the “increased pathogen burden” hypothesis may not be entirely correct. Emerging evidence suggests that bacterial virulence may change without necessarily changing bacterial abundance (40). This could explain why VAP patients had worse outcomes without having marked differences in their bacterial constituencies and despite similar initial illness severity. Thus, different approaches centered on gene expression changes in both host and microbial populations (viral, bacterial and fungal) may be required to redefine pneumonia constructively (23, 41). One recent study measured human DNA content (a surrogate for host inflammatory response) in respiratory samples together with 16S RNA gene sequencing and found that higher human DNA content was more robustly associated with VAP than microbial factors (29).
Molecular detection identified common pathogens in many of the VAP patients in our cohort, including Pseudomonas, Streptococcus mitis/pneumoniae, and Enterobacteriaceae. However, we also identified microbes not detected by traditional aerobic cultures. Prevotella and other anaerobic species represented the most dominant taxa in several VAP cases, corroborating evidence from other reports (42–44). Almost half of VAP patients had the VAP dominant organism present in the first TA sample, suggesting the possibility that the pathogen was not acquired during mechanical ventilation. As seen in other studies of critically ill children (45), LRTI was the most common admitting diagnosis in our cohort, and children with LRTI developed VAP more frequently. Most of the LRTI cases were viral in origin, which may predispose to secondary bacterial infection (46–49). Whether broad empiric antibiotic therapy for viral LRTI contributes to the early dominance of anaerobes requires further investigation. Mycoplasma and Ureaplasma, were also identified as the dominant organism in several subjects. Recent adult studies report mycoplasma as a common causative organism for VAP (29, 50), suggesting it should routinely be considered among possible etiologies of VAP.
The taxonomic composition identified in in tracheal aspirates is similar to those identified in our previous study of tracheal aspirates and ETT biofilms and consist largely of oropharyngeal bacteria (51). Unsurprisingly, these findings likely represent cross contamination with oral secretions either during the process of intubation or via aspiration of oral secretions after intubation. We had previously found that tracheal aspirate specimens and ETT biofilms from the same patients largely shared similar bacterial communities, yet with a substantial minority of patients demonstrating divergent communities between these sites. Thus, the potential role of ETT microbial biofilms in the development of VAP deserves further investigation, but this potential impact was not examined in context of this study.
The strengths of our study include 1) the largest cohort of mechanically ventilated children in whom daily molecular assessments of bacteria were performed on respiratory samples, 2) complementary statistical analytic approaches encompassing a time-to-event analysis, matched case-control approach, and unbiased clustering, 3) prospective and consistent application of the CDC pediatric definition of VAP, and 4) incorporation of clinical factors, including age, severity of illness and antibiotic exposure into our analytic models.
There are several limitations to our study. 1) TBL measurements are subject to variation by dilution from host secretion production and by the addition of small amounts of saline to facilitate sample collection. Thus, it is more a measure of bacterial density that true bacterial burden. 2) Amplification of 16S genes may result in bacterial detection bias, and some bacteria were only identified to the genus level. Further, we only evaluated bacterial composition, which neglects contributions from other microbes (viruses and fungi) to the development of VAP. 3) Our study included gaps in daily sample collection. Daily respiratory samples were not collected in all patients for reasons including inappropriate suctioning technique, subjects with inadequate secretions, and development of a contraindication to suctioning. Additionally, many samples had insufficient bacterial DNA load to robustly sequence without substantial interference of background signals. 4) VAP was diagnosed by the pediatric CDC criteria, which despite vigorous prospective application, may still have produced an error rate that adversely impacted our analyses (32). We attenuated this by excluding subjects with physician suspected or diagnosed VAP who did not meet CDC criteria. Yet, it is possible that with a more precise VAP definition, a more direct relationship between microbiome assessments and VAP could be identified. Additionally, it is possible that tracheal aspirates are an inadequate specimen for assessing this relationship, even with a perfect VAP definition. 5) The cohort represents a heterogenous PICU population, and individual risk for VAP may differ based on the primary admitting diagnosis. The intention of this study was to identify common patterns in the airway microbiome across all PICU patients that could inform the risk and pathogenesis of VAP. While we attempted to control for infectious diagnoses, including LRTI, in our matching analysis, there may be unique patterns within a specific presenting diagnosis group that we failed to recognize. 6) Cultures were performed clinically and were not performed with the same samples as the research samples, precluding direct comparisons between the 16S and clinical culture results. 7) Although a robust antibacterial scoring system was employed, accounting for antibacterial activity and duration, the high variation in antibiotic use may not have been adequately represented in our analyses.
In conclusion, longitudinal analysis of lower airway samples with 16S rRNA gene sequencing in a large, diverse population of critically ill children revealed that the airway microbiome is heterogeneous at intubation with lower Shannon diversity and relative abundance of Streptococcus, Lactobacillales, and Prevotella, in children who developed VAP. Although there were statistical differences in TBL and diversity between VAP and non-VAP patients during MV support, which may provide some insight into the pathogenesis of VAP, these changes were not suitable for predicting VAP in individual patients. These findings suggest that other factors contribute to VAP risk and thus, focusing exclusively on pathogen burden may not adequately inform VAP diagnosis. Future studies that include comprehensive microbial detection, measures of microbial activity and virulence, and assessment of host response may offer greater insight into VAP pathogenesis, provide more accurate prediction models, and identify modifiable risk factors to prevent VAP.
Supplementary Material
ACKNOWLEDGEMENTS
The VAP Investigators thank all subjects and their families for participating in this project. We also acknowledge the contributions of Tammara L. Jenkins, MSN, RN, and Robert F. Tamburro, MD, from Eunice Kennedy Shriver National Institute of Child Health and Human Development, Bethesda, MD. Following is a summary of Performance Sites, Principal Investigators (PI), Co-investigators (CI), Research Coordinators (RC), and Allied Research Personnel. Children’s Hospital of Colorado, Aurora, CO: Peter Mourani (PI); Todd Carpenter (CI); Yamila Sierra (RC); Katheryn Malone (RC), Diane Ladell (RC); Kimberly Ralston (RC); Kevin Van (RC). Children’s Hospital of Michigan, Detroit, MI: Kathleen L. Meert (PI); Sabrina Heidemann (CI); Ann Pawluszka (RC); Melanie Lulic (RC). Children’s Hospital of Philadelphia, Philadelphia, PA: Robert A Berg (PI); Athena Zuppa (CI); Carolann Twelves (RC); Mary Ann DiLiberto (RC). Children’s National Medical Center, Washington, DC: Murray Pollack (PI); David Wessel (PI); Randall Burd (CI); Elyse Tomanio (RC); Diane Hession (RC); Ashley Wolfe (RC). Nationwide Children’s Hospital, Columbus, OH: Mark Hall (PI); Andrew Yates (CI); Lisa Steele (RC); Maggie Flowers (RC); Josey Hensley (RC). Mattel Children’s Hospital, University of California Los Angeles, Los Angeles, CA: Anil Sapru (PI); Rick Harrison (CI), Neda Ashtari (RC); Anna Ratiu (RC). Children’s Hospital of Pittsburgh, University of Pittsburgh Medical Center, Pittsburgh, PA: Joe Carcillo (PI); Ericka Fink (CI); Leighann Koch (RC); Alan Abraham (RC). Benioff Children’s Hospital, University of California, San Francisco, San Francisco, CA: Patrick McQuillen (PI); Anne McKenzie (RC); Yensy Zetino (RC). University of Utah; Data Coordinating Center, Salt Lake City, Utah: Mike Dean (PI); Richard Holubkov (PI), Juhee Peterson, Melissa Bolton, Whit Coleman, and Stephanie Dorton.
Support Statement: Supported in part, by the following cooperative agreements from the Eunice Kennedy Shriver National Institute of Child Health and Human Development (NICHD), and Heart Lung Blood Institute (NHLBI), National Institutes of Health (NIH): UG1HD083171 and (Dr. Mourani), 1R01HL124103 (Drs. Mourani and Sontag) UG1HD049983 (Dr. Carcillo), UG01HD049934 (Drs. Reeder, Locandro, and Dean), UG1HD083170 (Dr. Hall), UG1HD050096 (Dr. Meert), UG1HD63108 (Dr. Zuppa), UG1HD083116 (Dr. Sapru), UG1HD083166 (Dr. McQuillen), UG1HD049981 (Dr. Pollack), and K23HL138461-01A1 (Dr. Langelier). The study sponsors were not involved in study design; in the collection, analysis, and interpretation of data; in the writing of the report; and in the decision to submit the report for publication.
Footnotes
Publisher's Disclaimer: This manuscript has recently been accepted for publication in the European Respiratory Journal. It is published here in its accepted form prior to copyediting and typesetting by our production team. After these production processes are complete and the authors have approved the resulting proofs, the article will move to the latest issue of the ERJ online.
REFERENCES
- 1.Raymond J, Aujard Y. Nosocomial infections in pediatric patients: a European, multicenter prospective study. European Study Group. Infect Control Hosp Epidemiol 2000; 21: 260–263. [DOI] [PubMed] [Google Scholar]
- 2.Foglia EE, Fraser VJ, Elward AM. Effect of nosocomial infections due to antibiotic-resistant organisms on length of stay and mortality in the pediatric intensive care unit. Infect Control Hosp Epidemiol 2007; 28: 299–306. [DOI] [PubMed] [Google Scholar]
- 3.Fischer JE, Ramser M, Fanconi S. Use of antibiotics in pediatric intensive care and potential savings. Intensive Care Medicine 2000; 26: 959–966. [DOI] [PubMed] [Google Scholar]
- 4.Hilty M, Burke C, Pedro H, Cardenas P, Bush A, Bossley C, Davies J, Ervine A, Poulter L, Pachter L, Moffatt MF, Cookson WO. Disordered microbial communities in asthmatic airways. PLoS One 2010; 5: e8578. [DOI] [PMC free article] [PubMed] [Google Scholar]
- 5.Sze MA, Dimitriu PA, Hayashi S, Elliott WM, McDonough JE, Gosselink JV, Cooper J, Sin DD, Mohn WW, Hogg JC. The Lung Tissue Microbiome in Chronic Obstructive Pulmonary Disease. Am J Respir Crit Care Med 2012. [DOI] [PMC free article] [PubMed] [Google Scholar]
- 6.Mourani PM, Sontag MK. Ventilator-Associated Pneumonia in Critically Ill Children: A New Paradigm. Pediatr Clin North Am 2017; 64: 1039–1056. [DOI] [PubMed] [Google Scholar]
- 7.Sands KM, Wilson MJ, Lewis MAO, Wise MP, Palmer N, Hayes AJ, Barnes RA, Williams DW. Respiratory pathogen colonization of dental plaque, the lower airways, and endotracheal tube biofilms during mechanical ventilation. J Crit Care 2017; 37: 30–37. [DOI] [PubMed] [Google Scholar]
- 8.Gollwitzer ES, Saglani S, Trompette A, Yadava K, Sherburn R, McCoy KD, Nicod LP, Lloyd CM, Marsland BJ. Lung microbiota promotes tolerance to allergens in neonates via PDL1. Nat Med 2014; 20: 642–647. [DOI] [PubMed] [Google Scholar]
- 9.Trompette A, Gollwitzer ES, Yadava K, Sichelstiel AK, Sprenger N, Ngom-Bru C, Blanchard C, Junt T, Nicod LP, Harris NL, Marsland BJ. Gut microbiota metabolism of dietary fiber influences allergic airway disease and hematopoiesis. Nat Med 2014; 20: 159–166. [DOI] [PubMed] [Google Scholar]
- 10.Yin Y, Hountras P, Wunderink RG. The microbiome in mechanically ventilated patients. Curr Opin Infect Dis 2017; 30: 208–213. [DOI] [PubMed] [Google Scholar]
- 11.Dickson RP. The microbiome and critical illness. The Lancet Respiratory Medicine 2016; 4: 59–72. [DOI] [PMC free article] [PubMed] [Google Scholar]
- 12.Huffnagle GB, Dickson RP, Lukacs NW. The respiratory tract microbiome and lung inflammation: a two-way street. Mucosal Immunol 2017; 10: 299–306. [DOI] [PMC free article] [PubMed] [Google Scholar]
- 13.Elward AM, Warren DK, Fraser VJ. Ventilator-Associated Pneumonia in Pediatric Intensive Care Unit Patients: Risk Factors and Outcomes. Pediatrics 2002; 109: 758–764. [DOI] [PubMed] [Google Scholar]
- 14.Almuneef M, Memish ZA, Balkhy HH, Alalem H, Abutaleb A. Ventilator-associated pneumonia in a pediatric intensive care unit in Saudi Arabia: a 30-month prospective surveillance. Infection Control and Hospital Epidemiology 2004; 25: 753–758. [DOI] [PubMed] [Google Scholar]
- 15.Srinivasan R, Asselin J, Gildengorin G, Wiener-Kronish J, Flori HR. A Prospective Study of Ventilator-Associated Pneumonia in Children. Pediatrics 2009; 123: 1108–1115. [DOI] [PubMed] [Google Scholar]
- 16.Fayon MJ, Tucci M, Lacroix J, Farrell CA, Gauthier M, Lafleur L, Nadeau D. Nosocomial pneumonia and tracheitis in a pediatric intensive care unit: a prospective study. Am J Respir Crit Care Med 1997; 155: 162–169. [DOI] [PubMed] [Google Scholar]
- 17.Wright ML, Romano MJ. Ventilator-associated pneumonia in children. Semin Pediatr Infect Dis 2006; 17: 58–64. [DOI] [PubMed] [Google Scholar]
- 18.Bochicchio GV, Sung J, Joshi M, Bochicchio K, Johnson SB, Meyer W, Scalea TM. Persistent hyperglycemia is predictive of outcome in critically ill trauma patients. J Trauma 2005; 58: 921–924. [DOI] [PubMed] [Google Scholar]
- 19.Wagner BD, Sontag MK, Harris JK, Miller JI, Morrow L, Robertson CE, Stephens M, Poindexter BB, Abman SH, Mourani PM. Airway Microbial Community Turnover Differs by BPD Severity in Ventilated Preterm Infants. PLoS One 2017; 12: e0170120. [DOI] [PMC free article] [PubMed] [Google Scholar]
- 20.Kelly BJ, Imai I, Bittinger K, Laughlin A, Fuchs BD, Bushman FD, Collman RG. Composition and dynamics of the respiratory tract microbiome in intubated patients. Microbiome 2016; 4: 7. [DOI] [PMC free article] [PubMed] [Google Scholar]
- 21.Zakharkina T, Martin-Loeches I, Matamoros S, Povoa P, Torres A, Kastelijn JB, Hofstra JJ, de Wever B, de Jong M, Schultz MJ, Sterk PJ, Artigas A, Bos LDJ. The dynamics of the pulmonary microbiome during mechanical ventilation in the intensive care unit and the association with occurrence of pneumonia. Thorax 2017; 72: 803–810. [DOI] [PubMed] [Google Scholar]
- 22.Sommerstein R, Merz TM, Berger S, Kraemer JG, Marschall J, Hilty M. Patterns in the longitudinal oropharyngeal microbiome evolution related to ventilator-associated pneumonia. Antimicrob Resist Infect Control 2019; 8: 81. [DOI] [PMC free article] [PubMed] [Google Scholar]
- 23.Kitsios GD, Fitch A, Manatakis DV, Rapport SF, Li K, Qin S, Huwe J, Zhang Y, Doi Y, Evankovich J, Bain W, Lee JS, Methe B, Benos PV, Morris A, McVerry BJ. Respiratory Microbiome Profiling for Etiologic Diagnosis of Pneumonia in Mechanically Ventilated Patients. Front Microbiol 2018; 9: 1413. [DOI] [PMC free article] [PubMed] [Google Scholar]
- 24.de La Serre CB, Ellis CL, Lee J, Hartman AL, Rutledge JC, Raybould HE. Propensity to high-fat diet-induced obesity in rats is associated with changes in the gut microbiota and gut inflammation. Am J Physiol Gastrointest Liver Physiol 2010; 299: G440–448. [DOI] [PMC free article] [PubMed] [Google Scholar]
- 25.van Vliet MJ, Harmsen HJ, de Bont ES, Tissing WJ. The role of intestinal microbiota in the development and severity of chemotherapy-induced mucositis. PLoS Pathog 2010; 6: e1000879. [DOI] [PMC free article] [PubMed] [Google Scholar]
- 26.Yang L, Lu X, Nossa CW, Francois F, Peek RM, Pei Z. Inflammation and intestinal metaplasia of the distal esophagus are associated with alterations in the microbiome. Gastroenterology 2009; 137: 588–597. [DOI] [PMC free article] [PubMed] [Google Scholar]
- 27.Cani PD, Possemiers S, Van de Wiele T, Guiot Y, Everard A, Rottier O, Geurts L, Naslain D, Neyrinck A, Lambert DM, Muccioli GG, Delzenne NM. Changes in gut microbiota control inflammation in obese mice through a mechanism involving GLP-2-driven improvement of gut permeability. Gut 2009; 58: 1091–1103. [DOI] [PMC free article] [PubMed] [Google Scholar]
- 28.Dimmitt RA, Staley EM, Chuang G, Tanner SM, Soltau TD, Lorenz RG. Role of postnatal acquisition of the intestinal microbiome in the early development of immune function. J Pediatr Gastroenterol Nutr; 51: 262–273. [DOI] [PMC free article] [PubMed] [Google Scholar]
- 29.Emonet S, Lazarevic V, Leemann Refondini C, Gaia N, Leo S, Girard M, Nocquet Boyer V, Wozniak H, Despres L, Renzi G, Mostaguir K, Dupuis Lozeron E, Schrenzel J, Pugin J. Identification of respiratory microbiota markers in ventilator-associated pneumonia. Intensive Care Med 2019; 45: 1082–1092. [DOI] [PMC free article] [PubMed] [Google Scholar]
- 30.Mourani PM, Sontag M, Wagner B, Williamson K, Harris JK, Reeder R, Locandro C, Carpenter TC, Maddux AB, Ziegler K, Simoes E, Osborne CM, Langelier C, Kalantar K, Kamm J, Hall MW, Zuppa A, Carcillo J, Meert K, Sapru A, Pollack M, McQuillen P, Tamburro R, Dean JM, NICHD Collaborative Pediatric Critical Care Research Network. . Temporal Changes in the Lower Airway Microbiome are Associated with Development of Ventilator Associated Pneumonia in Mechanically Ventilated Children. American Thoracic Society International Congress. Dallas, TX; 2019. [Google Scholar]
- 31.Centers for Disease Control and Prevention Guidelines: Guidelines and Procedures for Monitoring VAP. 07/2013 [cited 2013 9/6/2013]. Available from: http://www.cdc.gov/nhsn/PDFs/pscManual/6pscVAPcurrent.pdf.
- 32.Ziegler KM, Haywood JD, Sontag MK, Mourani PM. Application of the New Centers for Disease Control and Prevention Surveillance Criteria for Ventilator-Associated Events to a Cohort of PICU Patients Identifies Different Patients Compared With the Previous Definition and Physician Diagnosis. Crit Care Med 2019; 47: e547–e554. [DOI] [PMC free article] [PubMed] [Google Scholar]
- 33.Nadkarni MA, Martin FE, Jacques NA, Hunter N. Determination of bacterial load by real-time PCR using a broad-range (universal) probe and primers set. Microbiology 2002; 148: 257–266. [DOI] [PubMed] [Google Scholar]
- 34.Zemanick ET, Wagner BD, Robertson CE, Ahrens RC, Chmiel JF, Clancy JP, Gibson RL, Harris WT, Kurland G, Laguna TA, McColley SA, McCoy K, Retsch-Bogart G, Sobush KT, Zeitlin PL, Stevens MJ, Accurso FJ, Sagel SD, Harris JK. Airway microbiota across age and disease spectrum in cystic fibrosis. Eur Respir J 2017; 50. [DOI] [PMC free article] [PubMed] [Google Scholar]
- 35.Hara N, Alkanani AK, Ir D, Robertson CE, Wagner BD, Frank DN, Zipris D. Prevention of virus-induced type 1 diabetes with antibiotic therapy. J Immunol 2012; 189: 3805–3814. [DOI] [PubMed] [Google Scholar]
- 36.Markle JG, Frank DN, Mortin-Toth S, Robertson CE, Feazel LM, Rolle-Kampczyk U, von Bergen M, McCoy KD, Macpherson AJ, Danska JS. Sex differences in the gut microbiome drive hormone-dependent regulation of autoimmunity. Science 2013; 339: 1084–1088. [DOI] [PubMed] [Google Scholar]
- 37.Pollack MM, Patel KM, Ruttimann UE. PRISM III: an updated Pediatric Risk of Mortality score. Crit Care Med 1996; 24: 743–752. [DOI] [PubMed] [Google Scholar]
- 38.Dickson RP, Schultz MJ, van der Poll T, Schouten LR, Falkowski NR, Luth JE, Sjoding MW, Brown CA, Chanderraj R, Huffnagle GB, Bos LDJ, Biomarker Analysis in Septic ICUPC. Lung Microbiota Predict Clinical Outcomes in Critically Ill Patients. Am J Respir Crit Care Med 2020; 201: 555–563. [DOI] [PMC free article] [PubMed] [Google Scholar]
- 39.Conway Morris A, Gadsby N, McKenna JP, Hellyer TP, Dark P, Singh S, Walsh TS, McAuley DF, Templeton K, Simpson AJ, McMullan R. 16S pan-bacterial PCR can accurately identify patients with ventilator-associated pneumonia. Thorax 2017; 72: 1046–1048. [DOI] [PMC free article] [PubMed] [Google Scholar]
- 40.Alverdy JC, Krezalek MA. Collapse of the Microbiome, Emergence of the Pathobiome, and the Immunopathology of Sepsis. Crit Care Med 2017; 45: 337–347. [DOI] [PMC free article] [PubMed] [Google Scholar]
- 41.Bos LDJ, Kalil AC. Changes in lung microbiome do not explain the development of ventilator-associated pneumonia. Intensive Care Med 2019; 45: 1133–1135. [DOI] [PubMed] [Google Scholar]
- 42.Dore P, Robert R, Grollier G, Rouffineau J, Lanquetot H, Charriere JM, Fauchere JL. Incidence of anaerobes in ventilator-associated pneumonia with use of a protected specimen brush. Am J Respir Crit Care Med 1996; 153: 1292–1298. [DOI] [PubMed] [Google Scholar]
- 43.Robert R, Nanadoumgar H, Chatellier D, Veinstein A, Frat JP, Grollier G. Protected telescopic catheter also allows anaerobic bacteria isolation in patients with ventilatory-acquired pneumonia. Intensive Care Med 2006; 32: 322–324. [DOI] [PubMed] [Google Scholar]
- 44.Bartlett JG. How important are anaerobic bacteria in aspiration pneumonia: when should they be treated and what is optimal therapy. Infect Dis Clin North Am 2013; 27: 149–155. [DOI] [PubMed] [Google Scholar]
- 45.Farias JA, Fernandez A, Monteverde E, Flores JC, Baltodano A, Menchaca A, Poterala R, Panico F, Johnson M, von Dessauer B, Donoso A, Zavala I, Zavala C, Troster E, Pena Y, Flamenco C, Almeida H, Nilda V, Esteban A, Latin-American Group for Mechanical Ventilation in C. Mechanical ventilation in pediatric intensive care units during the season for acute lower respiratory infection: a multicenter study. Pediatr Crit Care Med 2012; 13: 158–164. [DOI] [PubMed] [Google Scholar]
- 46.Brealey JC, Sly PD, Young PR, Chappell KJ. Viral bacterial co-infection of the respiratory tract during early childhood. FEMS Microbiol Lett 2015; 362. [DOI] [PubMed] [Google Scholar]
- 47.Randolph AG, Reder L, Englund JA. Risk of bacterial infection in previously healthy respiratory syncytial virus-infected young children admitted to the intensive care unit. Pediatr Infect Dis J 2004; 23: 990–994. [DOI] [PMC free article] [PubMed] [Google Scholar]
- 48.Kneyber MC, Blusse van Oud-Alblas H, van Vliet M, Uiterwaal CS, Kimpen JL, van Vught AJ. Concurrent bacterial infection and prolonged mechanical ventilation in infants with respiratory syncytial virus lower respiratory tract disease. Intensive Care Med 2005; 31: 680–685. [DOI] [PubMed] [Google Scholar]
- 49.Resch B, Gusenleitner W, Mueller WD. Risk of concurrent bacterial infection in preterm infants hospitalized due to respiratory syncytial virus infection. Acta Paediatrica 2007; 96: 495–498. [DOI] [PubMed] [Google Scholar]
- 50.Nolan TJ, Gadsby NJ, Hellyer TP, Templeton KE, McMullan R, McKenna JP, Rennie J, Robb CT, Walsh TS, Rossi AG, Conway Morris A, Simpson AJ. Low-pathogenicity Mycoplasma spp. alter human monocyte and macrophage function and are highly prevalent among patients with ventilator-acquired pneumonia. Thorax 2016; 71: 594–600. [DOI] [PMC free article] [PubMed] [Google Scholar]
- 51.Leroue MK, Harris JK, Burgess KM, Stevens MJ, Miller JI, Sontag MK, Sierra YL, Wagner BD, Mourani PM. Molecular analysis of endotracheal tube biofilms and tracheal aspirates in the pediatric intensive care unit. Adv Pediatr Res 2017; 4. [DOI] [PMC free article] [PubMed] [Google Scholar]
Associated Data
This section collects any data citations, data availability statements, or supplementary materials included in this article.