

Abstract
Fragile X‐associated Tremor/Ataxia Syndrome (FXTAS) is a neurodegenerative disorder associated with the FMR1 premutation. It is currently unknown when, and if, individual premutation carriers will develop FXTAS. Thus, with the aim of identifying biomarkers for early diagnosis, development, and progression of FXTAS, we performed global metabolomic profiling of premutation carriers (PM) who, as part of an ongoing longitudinal study, emerged into two distinct categories: those who developed symptoms of FXTAS (converters, CON) at subsequent visits and those who did not (non‐converters, NCON) and we compared to age‐matched healthy controls (HC). We assessed CGG repeat allele size by Southern Blot and PCR analysis. Metabolomic profile was obtained by ultra‐performance liquid chromatography, accurate mass spectrometer, and an Orbitrap mass analyzer. In this study we found 47 metabolites were significantly dysregulated between HC and the premutation groups (PM). Importantly, we identified 24 metabolites that showed significant changes in expression in the CON as compared to the NCON both at V1 and V2, and 70 metabolites in CON as compared to NCON but only at V2. These findings suggest the potential role of the identified metabolites as biomarkers for early diagnosis and for FXTAS disease progression, respectively. Interestingly, the majority of the identified metabolites were lipids, followed by amino acids. To our knowledge, this the first report of longitudinal metabolic profiling and identification of unique biomarkers of FXTAS. The lipid metabolism and specifically the sub pathways involved in mitochondrial bioenergetics, as observed in other neurodegenerative disorders, are significantly altered in FXTAS.
Keywords: fatty acids, fragile X‐associated tremor/ataxia syndrome, FMR1, molecular biomarkers, metabolomic
Abbreviations
- AA
amino acids
- AD
Alzheimer disease
- ANOVA
analysis of variance
- ASD
autism spectrum disorder
- BHBA
β‐hydroxybutyric acid
- CON
converters
- DAG
diacylglycerides
- ESI
electrospray Ionization
- FA
formic acid
- FDR
false discovery rate
- FFA
free fatty acids
- FMR1
fragile X mental retardation gene
- FXTAS
fragile X‐associated tremor/ataxia syndrome
- FXS
fragile X syndrome
- gDNA
genomic DNA
- HC
healthy controls
- HCER
hexosylceramides
- HD
huntington disease
- HESI‐II
heated electrospray ionization
- KP
Kynurenine pathway
- LCER
lactosylceramides
- LIMS
laboratory information management system
- MAG
monoacylglycerides
- NCON
non‐converters
- PD
Parkinson’s disease
- PEA
phenethylamine
- PFPA
perfluoropentanoic acid
- PM
premutation carrier group
- QC
quality control
- RI
retention time/index
- RSD
relative standard deviation
- SAH
S‐adenosylhomocysteine
- UPLC
ultra‐performance liquid chromatography
- V1
visit 1
- V2
visit 2
- 5′UTR
5 prime Untranslated Regions
1. BACKGROUND
Today, neurodegenerative diseases represent one of the significant causes of death in an industrialized economy. The prevalence of age‐dependent disorders has escalated in the past few years due to an increase in the elderly population. 1 The development of unique targeted therapeutics for rare age‐dependent neurodegenerative disorders faces many challenges, including the lack of biomarkers for early diagnosis and progression, complicated underlying molecular mechanisms, heterogeneous phenotypes, limited historical data, and difficulty of assessing efficacy in clinical trials for which small patient populations limit enrollment. Thus, it is of importance to identify biomarkers, which can provide fast, objective evidence for changes of underlying disease pathophysiology, which may, in turn, be used for clinical benefit.
Fragile X‐associated Tremor/Ataxia Syndrome (FXTAS) is a late‐onset neurodegenerative disorder that affects some carriers of the fragile X mental retardation 1 (FMR1) premutation after the age of 50. It is characterized by intention tremor, cerebellar ataxia, white matter/ global brain atrophy, autonomic dysfunction, and progressive Parkinsonism. Neuropathologically, FXTAS is distinguished by the presence of ubiquitin‐positive intranuclear inclusions throughout the brain in astrocytes, neurons, and Purkinje cells. 2 FXTAS is caused by the expanded CGG repeats (55‐200 CGG) in the 5′UTR of the FMR1 gene. In normal healthy individuals, the number of CGG repeats lies between 5 and 54 while individuals carrying alleles with a CGG repeat expansion greater than 200 develop fragile X syndrome (FXS), the most common form of intellectual disability and known monogenic cause of autism spectrum disorder (ASD). 3 The prevalence of the premutation allele among the general population is 1:110‐200 females and 1:430 males with an estimated 40%‐75% of males and 8%‐16% of females developing FXTAS. 4 , 5 Currently, there is no effective treatment for FXTAS. As only a proportion of premutation carriers develop the disorder, clinical assessment fails to identify those carriers before significant neurological symptoms are evident. Thus, a deep understanding of the molecular basis of FXTAS pathogenesis requires the development of biomarkers for early identification and progression of the disorder. Importantly, the identification of reliable biomarkers will also lead to the development of medications, which could prevent, reverse, or slow down the neurodegenerative progression of the disorder.
Metabolomics, the study of metabolites, is an emerging tool that focuses on the investigation of global metabolic changes within a given sample, followed by deep data mining and bioinformatic analysis. 6 Metabolic profiling reflects not only the dynamic response to genetic modification, but also physiological, pathophysiological, and developmental stimuli. Now, advancement in metabolomic profiling technology and processing have made it possible to analyze several hundred metabolites efficiently and precisely to obtain a snapshot of the physiological state of an organism, 7 and to identify biomarkers for disease development and progression. 8 Although metabolic variations have been identified in various other neurodegenerative disorders and multiple metabolites with altered level have been suggested as strong candidates for the early diagnosis of diseases like Alzheimer’s (AD), 9 Huntington’s (HD) 10 , 11 and Parkinson’s Disease (PD) 12 , 13 extensive studies focused on metabolic changes, and importantly at different time points, have not been carried out in the case of FXTAS.
In the recent past, Giulivi and colleagues have evaluated the plasma metabolic profile of human premutation carriers with FXTAS in comparison to non‐carrier healthy controls. Their work highlighted a panel of four core serum metabolites (phenethylamine (PEA), oleamide, aconitate, and isocitrate) for sensitive and specific diagnosis of the premutation carriers with and without FXTAS, and oleamide/isocitrate as a biomarker of FXTAS. 14 Later, based on the previously observed plasma metabolic profiles, they reported that FXTAS premutation carriers exhibited mitochondrial dysfunction, markers of neurodegeneration, and pro‐inflammatory damage. 15 Furthermore, they also reported on the increased mitochondrial oxidative stress in primary fibroblasts from premutation carriers, compared with age and sex‐matched controls. 16 In another study, the presence of the Warburg effect that involve the alteration of the glycolysis and oxidative phosphorylation has been reported in the peripheral blood mononuclear cells (PBMCs)’s derived from the controls, premutation allele carriers with and without FXTAS. 17 A recent study took advantage of the FXTAS murine model and investigated the metabolic changes associated with FXTAS in the cerebellum. They showed that significant metabolic changes occur in sphingolipid and purine metabolism in the cerebella of FXTAS mice and Schlank (Cers5), Sk2 (Sphk1), and Ras (Impdh1) are genetic modifiers of CGG toxicity in Drosophila. 18 Later, Napoli et al evaluated the effect of allopregnanolone on lymphocytic bioenergetics and plasma pharmaco metabolomics in a 12‐week open‐label intervention study with six male individuals with FXTAS. They observed a significant impact of allopregnanolone treatment on oxidative stress, GABA metabolism, and some mitochondria‐related outcomes, and suggested allopregnanolone as a potential therapeutic for the cognitive and GABA metabolism improvement in FXTAS patients. 19
However, no study evaluating the metabolic alterations in premutation carriers who develop symptoms of FXTAS over time has been reported to date. Here, we present our findings on global metabolic profiling derived from male participants enrolled in an ongoing longitudinal study carried out at the UC Davis MIND Institute. The participants have been followed for at least two longitudinal time points (Visit 1, V1, and Visit 2, V2) during which neuroimaging, neuropsychological, molecular measurements as well as medical and neurological examinations were collected. A fraction of the premutation participants, all symptom‐free at the time of enrollment, developed symptoms which warranted a diagnosis of FXTAS during the course of the study, defined here as converters (CON.) The remaining premutation participants who did not develop symptoms that warranted a diagnosis of FXTAS are defined here as non‐converters (NCON). In the current work, we show that significant metabolic changes occurred in CON as compared to the NCON and HC. More specifically, we report on the identification of both metabolic biomarkers of FXTAS development that changed only in the converter group at both V1 and V2 and of metabolic biomarkers of FXTAS progression were only altered at V2 in CON as compared to the non‐converter premutation carriers. The majority of these identified metabolites are lipids, including the free fatty acids, acylcarnitine’s, sphingolipids, diacylglycerol, endocannabinoid, phospholipids followed by amino acid, nucleotide, xenobiotics, carbohydrate, energy, and peptides classes.
2. METHODS
2.1. Study participants
As part of a continuing longitudinal study, male participant premutation carriers, over the age of 40 years, and participant non‐carrier age‐matched controls were recruited as detailed in. 20 All male participants were white in the race with 3, 1, 0 Hispanic, and Latino in HC, CON, and NCON. The studies and all protocols were carried out in accordance with the Institutional Review Board at the University of California, Davis. All participants gave written informed consent before participating in the study in line with the Declaration of Helsinki. FXTAS stage scoring was based on the clinical descriptions as previously described. 21 As explained by, 22 there are three categories used in the diagnosis of FXTAS termed as “definite,” “probable,” and “possible.” “Definite” indicates the presence of one major radiological sign plus one major clinical symptom. “Probable” shows the presence of either one major radiology sign plus one minor clinical symptom or two major clinical symptoms. “Possible” indicates the presence of one minor radiology sign plus one major clinical symptom. In addition, the diagnosis of FXTAS can also be clarified by the stage of the disease, which provides information on the impact of the disease on activities of daily living. Six FXTAS stages have been described and they include stage 0‐normal function; stage 1‐subtle or questionable signs such as subtle tremor or mild balance problems, with no interference in activities of daily living (ADLs); stage 2‐ minor but clear tremor and/or balance problems with minor interference with ADLs; stage 3‐moderate tremor and/or balance problems and occasional falls with significant interference in ADLs; stage 4‐severe tremor and /or balance problems (uses cane or walker); stage 5‐the use of a wheelchair on the daily basis; stage 6‐bedridden.
Three age‐matched groups were included in this study: CON, NCON, and healthy controls. After two brain scans and on the basis of neurological assessment, FXTAS stage, and CGG repeat length, 10 participants were classified as CON as they developed clear FXTAS symptomology between visits (FXTAS stage score was 0–1 at visit 1 (V1) and ≥2 at visit 2 (V2); 10 were defined as NCON because they continued to show no signs of FXTAS at V2 (FXTAS stage score was 0‐1 at both V1 and V2) and 10 HC (normal FMR1 alleles/non‐carriers).
2.2. CGG repeat length
Genomic DNA (gDNA) was isolated from 5 mL of peripheral blood leukocytes using the Gentra Puregene Blood Kit (Qiagen). CGG repeat allele size and methylation status were assessed using the combination of Southern Blot and PCR analysis. Details of the protocols are as previously reported. 23 , 24
2.3. Sample preparation and metabolite profiling
Plasma metabolite profiling was determined by a non‐targeted platform that allows the relative quantitative analysis of a large number of molecules. 25 Samples were stored at −80°C until processing and then prepared using the automated MicroLab STAR (Hamilton Company, Reno, NV, USA). Several recovery standards were added prior to the first step in the extraction process for QC purposes. To remove protein, dissociate small molecules bound to protein or trapped in the precipitated protein matrix, and to recover chemically diverse metabolites, proteins were precipitated with methanol under vigorous shaking for 2 minutes (Glen Mills GenoGrinder 2000) followed by centrifugation. The resulting extract was divided into five fractions: two for analysis by two separate reverse phases (RP)/UPLC‐MS/MS methods with positive ion mode electrospray ionization (ESI), one for analysis by RP/UPLC‐MS/MS with negative ion mode ESI, one for analysis by HILIC/UPLC‐MS/MS with negative ion mode ESI, and one sample were reserved for backup. Samples were placed briefly on a TurboVap (Zymark) to remove the organic solvent. The sample extracts were stored overnight under nitrogen before preparation for analysis.
2.3.1. Ultrahigh performance liquid chromatography‐tandem mass spectroscopy (UPLC‐MS/MS)
All methods utilized a Waters ACQUITY ultra‐performance liquid chromatography (UPLC) and a Thermo Scientific Q‐Exactive high resolution/accurate mass spectrometer interfaced with a heated electrospray ionization (HESI‐II) source and Orbitrap mass analyzer operated at 35 000 mass resolution. The sample extract was dried then reconstituted in solvents compatible with each of the four methods. Each reconstitution solvent contained a series of standards at fixed concentrations to ensure injection and chromatographic consistency. One aliquot was analyzed using acidic positive ion conditions, chromatographically optimized for more hydrophilic compounds. In this method, the extract was gradient eluted from a C18 column (Waters UPLC BEH C18‐2.1 × 100 mm, 1.7 µm) using water and methanol, containing 0.05% perfluoropentanoic acid (PFPA) and 0.1% formic acid (FA). Another aliquot was also analyzed using acidic positive ion conditions; however, it was chromatographically optimized for more hydrophobic compounds. In this method, the extract was gradient eluted from the same aforementioned C18 column using methanol, acetonitrile, water, 0.05% PFPA, and 0.01% FA and was operated at an overall higher organic content. Another aliquot was analyzed using basic negative ion optimized conditions using a separate dedicated C18 column. The basic extracts were gradient eluted from the column using methanol and water, however, with 6.5 mM Ammonium Bicarbonate at pH 8. The fourth aliquot was analyzed via negative ionization following elution from a HILIC column (Waters UPLC BEH Amide 2.1 × 150 mm, 1.7 µm) using a gradient consisting of water and acetonitrile with 10 mM Ammonium Formate, pH 10.8. The MS analysis alternated between MS and data‐dependent MSn scans using dynamic exclusion. The scan range varied slightly between methods but covered 70‐1000 m/z.
2.3.2. Quality assurance (QA) and quality control (QC)
Several types of controls were analyzed in concert with the experimental samples: a pooled matrix sample generated by taking a small volume of each experimental sample (or alternatively, use of a pool of well‐characterized human plasma) served as a technical replicate throughout the dataset; extracted water samples served as process blanks; and a cocktail of QC standards that were carefully chosen not to interfere with the measurement of endogenous compounds was spiked into every analyzed sample, allowed instrument performance monitoring and aided chromatographic alignment. Instrument variability was determined by calculating the median relative standard deviation (RSD) for the standards that were added to each sample prior to injection into the mass spectrometers. Overall process variability was determined by calculating the median RSD for all endogenous metabolites (ie, non‐instrument standards) present in 100% of the pooled matrix samples. Experimental samples were randomized across the platform run with QC samples spaced evenly among the injections.
2.3.3. Biochemical identification
The informatics system consisted of four major components, the Laboratory Information Management System (LIMS), the data extraction and peak‐identification software, data processing tools for QC and compound identification, and a collection of information interpretation and visualization tools for use by data analysts. The hardware and software foundations for these informatics components were the LAN backbone, and a database server running Oracle 10.2.0.1 Enterprise Edition.
LIMS
The purpose of the Metabolon LIMS system was to enable fully auditable laboratory automation through a secure, easy to use, and highly specialized system. The scope of the Metabolon LIMS system encompasses sample accessioning, sample preparation, and instrumental analysis and reporting, and advanced data analysis. All of the subsequent software systems are grounded in the LIMS data structures. It has been modified to leverage and interface with the in‐house information extraction and data visualization systems, as well as third party instrumentation and data analysis software.
Data extraction and compound identification
Raw data were extracted, peak‐identified and QC processed using Metabolon’s hardware and software. These systems are built on a web‐service platform utilizing Microsoft’s NET technologies, which run on high‐performance application servers and fiber‐channel storage arrays in clusters to provide active failover and load‐balancing. Compounds were identified by comparison to library entries of purified standards or recurrent unknown entities. Metabolon maintains a library based on authenticated standards that contain the retention time/index (RI), mass to charge ratio (m/z), and chromatographic data (including MS/MS spectral data) on all molecules present in the library. Furthermore, biochemical identifications are based on three criteria: retention index within a narrow RI window of the proposed identification, accurate mass match to the library ±10 ppm, and the MS/MS forward and reverse scores between the experimental data and authentic standards. The MS/MS scores are based on a comparison of the ions present in the experimental spectrum to the ions present in the library spectrum. While there may be similarities between these molecules based on one of these factors, the use of all three data points can be utilized to distinguish and differentiate biochemicals. More than 3300 commercially available purified standard compounds have been acquired and registered into LIMS for analysis on all platforms for the determination of their analytical characteristics. Additional mass spectral entries have been created for structurally unnamed biochemicals, which have been identified by virtue of their recurrent nature (both chromatographic and mass spectral). These compounds have the potential to be identified by the future acquisition of a matching purified standard or by classical structural analysis.
Curation
A variety of curation procedures were carried out to ensure that a high‐quality dataset was made available for statistical analysis and data interpretation. The QC and curation processes were designed to ensure accurate and consistent identification of true chemical entities and to remove those representing system artifacts, misassignments, and background noise. Metabolon data analysts use proprietary visualization and interpretation software to confirm the consistency of peak identification among the various samples. Library matches for each compound were checked for each sample and corrected if necessary.
Metabolite quantitation and data normalization
Peaks were quantified using area‐under‐the‐curve. For studies spanning multiple days, a data normalization step was performed to correct variation resulting from instrument inter‐day tuning differences. Essentially, each compound was corrected in run‐day blocks by registering the medians to equal one (1.00) and normalizing each data point proportionately. For studies that did not require more than one day of analysis, no normalization is necessary, other than for purposes of data visualization. In certain instances, biochemical data may have been normalized to an additional factor (ie, cell counts, total protein was determined by Bradford assay, osmolality, etc.) to account for differences in metabolite levels due to differences in the amount of material present in each sample.
2.4. Statistical analysis
Statistical analysis of log‐transformed data was conducted using “ArrayStudio” and for non‐standard analysis “R” (http://cran.r‐project.org/), which is a freely available, open‐source software package and a commercial software package JMP (http://www.jmp.com) were used. ANOVA contrasts and Welch’s two‐sample t test were used to identify biochemicals that differed significantly between experimental groups. Differences were considered significant at P < .05, with groups with altered levels identified using critical P‐values calculated after correction for multiple comparisons. Analysis by two‐way ANOVA with repeated measures performed to identify biochemicals exhibiting significant interaction and main effects for experimental parameters of Disease and Time. Multiple comparisons were accounted for by estimating the false discovery rate (FDR) using q values, a low (q < 0.10) is an indication of high confidence in a result. 26
3. RESULTS
3.1. Demographics
Male participants, included in each group were: premutation carriers who converted at V2 (CON; n = 10), premutation carriers who did not convert at V2 (NCON; n = 10) and healthy controls (HC; n = 10). All participants were matched for age and CGG repeat length as reported in (Table 1). Participant age, race, and ethnicity did not differ significantly between the three groups. CGG repeat numbers were significantly lower in healthy controls than in other groups of CON and NCON as expected (P < .001 in both comparisons) and were not significantly different between the two premutation carrier groups (P = .76).
TABLE 1.
Demographic information on age and CGG repeats in three male participant groups: HC, CON, and NCON
| Healthy controls (HC) | Converters (CON) | Non‐converters (NCON) | All patients | P‐value (F‐test) | ||
|---|---|---|---|---|---|---|
| Age | N | 10 | 10 | 10 | 30 | .936 |
| Mean (SD) | 65.60 (3.239) | 63.50 (6.786) | 63.20 (4.849) | 64.10 (5.101) | ||
| Median (Range) | 64.50 (62‐70) | 63.50 (53‐75) | 64.00 (52‐69) | 64.00 (62‐75) | ||
| CGG | N | 10 | 10 | 10 | 30 | <.001 |
| Mean (SD) | 28.90 (4.095) | 93.30 (22.91) | 75.70 (18.73) | 65.97 (32.26) | ||
| Median (Range) | 30 (20‐32) | 84.50 (74‐141) | 74 (56‐122) | 72 (20‐141) |
3.2. Differential metabolite levels between healthy control and premutation groups
To identify metabolic biomarkers potentially associated with the development and progression of FXTAS, we compared the metabolic profile of HC to the premutation groups (PM) including CON and NCON. Within the 991 detected metabolites we identified 66 metabolites that showed statistically significant changes in level (P < .05) at V1, (Supplementary Material S1 Table) and 151 that showed significant alteration at V2 (Supplementary Material S2 Table) with 47 metabolites statistically different at V1 and V2 (Figure 1A) between HC and the PM groups. We also identified the proportion of each super pathway that is significantly altered in these 47 metabolites, and upon examination found that lipid was the most affected super pathway, followed by amino acids, xenobiotics, and others (Figure 1B).
FIGURE 1.
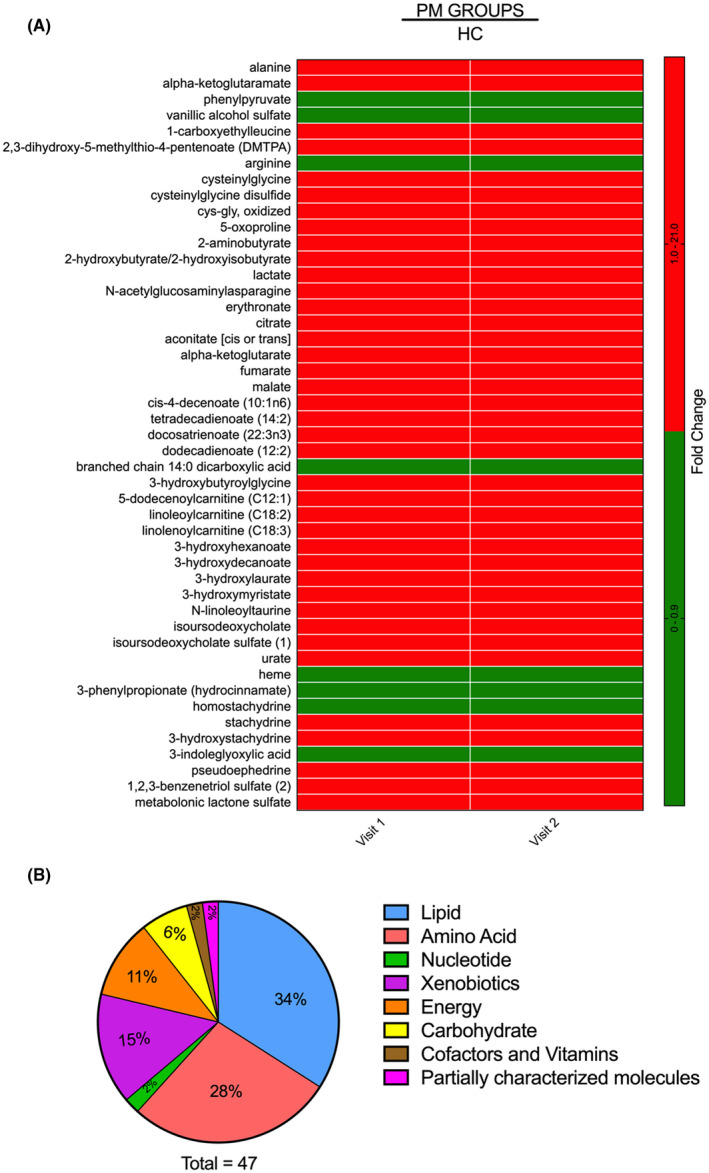
Differential metabolite expression levels among the HC and the PM groups. A, Heatmap of the 47 most significantly altered metabolites (P < .05) in the PM group as compared to HC at both V1 and V2. Heatmap was generated using PRISM software; red indicates high and green indicates low intensity of the metabolite. B, Representation of the super pathways of metabolism affected in these 47 significantly altered metabolites (P < .05)
Between the groups, CON vs. HC we found significant changes in 78 metabolites at V1, out of which, 70 showed increased levels while 8 showed decreased levels within the CON group. At V2, 169 metabolites were observed to be enriched (P < .05) within the CON group as compared to HC while 21 were less abundant. Furthermore, in the comparison between NCON vs. HC, we identified 68 metabolites, of which 34 were more abundant and 34 less abundant at V1 within the NCON group, while 64 metabolites were more abundant and 7 less abundant at V2 (Table 2).
TABLE 2.
Differential metabolites expression among the HC and the premutation groups including both the CON and NCON at Visit 1 (V1), Visit 2 (V2) and both at Visit 1 (V1) and Visit 2 (V2)
| Statistical comparisons | |||||||
|---|---|---|---|---|---|---|---|
| Welch’s two sample t‐test | PM groups vs HC | ||||||
| CON‐ V1 | CON‐ V2 | NCON ‐V1 | NCON‐ V2 | Total Visit 1 | Total Visit 2 | Total at V1 & V2 | |
| Total biochemicals P ≤ .05 | 78 | 190 | 68 | 71 | 66 | 151 | 47 |
Biochemicals ( ) ) |
70 | 8 | 169 | 21 | 34 | 34 | 64 | 7 | 51 | 15 | 140 | 11 | 39 | 8 |
3.3. Identification of early metabolic biomarkers of FXTAS
From this untargeted metabolic profiling, we identified 24 metabolites that showed significant changes in expression (P < .05) in pairwise comparisons of an analysis of variance (ANOVA) model in the CON as compared to the NCON both at V1 and V2 suggesting their role as biomarkers for early diagnosis of FXTAS (Figure 2A). More than half of the 24 altered metabolites were lipids, followed by amino acids, xenobiotics, peptide, carbohydrates, and nucleotides (Figure 2B).
FIGURE 2.
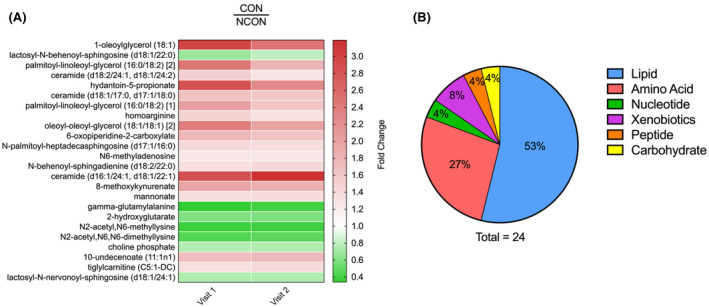
Identification of metabolic biomarkers for early diagnosis of FXTAS. A, Heatmap of the 24 most significantly altered metabolite expression levels (P ≤ .05) in CON at V1 and V2 which distinguish the CON from the NCON. Heatmap was generated using PRISM software; red indicates high and green indicates low intensity of the metabolite compare to the median (white). B, Representation of the super pathways of metabolism involved in these 24 significantly altered metabolites (P ≤ .05)
In addition, we identified 70 metabolites that were significantly different (P < .05) in CON as compared to NCON only at V2, indicating their potential role as biomarkers for FXTAS disease progression (Figure 3A). 72% of these identified metabolites were lipids, followed by xenobiotics (15%), amino acids (10%), energy, carbohydrates, and nucleotides (1% each) (Figure 3B).
FIGURE 3.
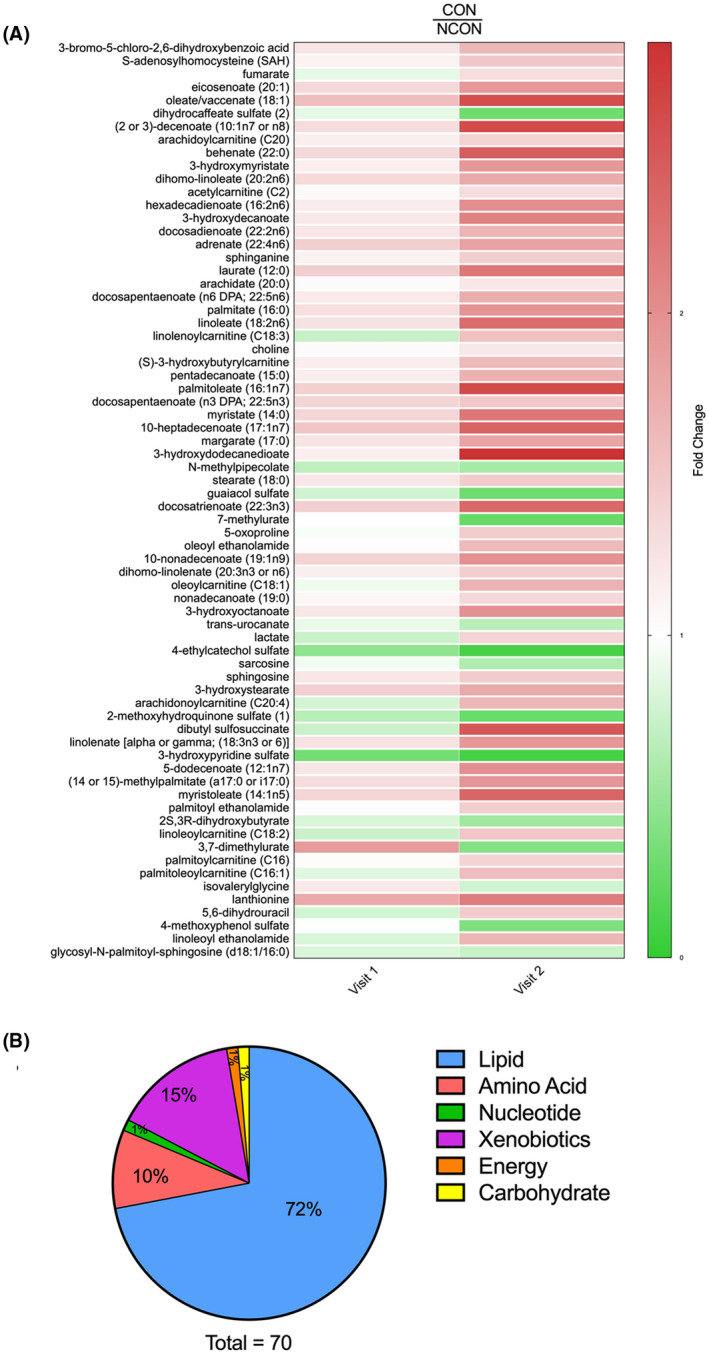
Metabolic profiling identified biomarkers of FXTAS disease progression. A, Heatmap of the 70 most significantly altered metabolites (P ≤ .05) in CON compared to NCON at V2 which represent biomarkers of FXTAS disease progression. Heatmap was generated using PRISM software; red indicates high and green indicates low intensity of the metabolite compare to the median (white). B, Representation of the super pathways of metabolism affected in these 70 significantly altered metabolites (P ≤ .05)
3.4. Lipid metabolism is altered in individuals who develop FXTAS over time
The high‐throughput unbiased global metabolic profiling of HC, NCON, and CON showed that a significant number of metabolites were altered in several lipid pathways, including lipid catabolism, sphingolipids, and phospholipid metabolism (Supplementary Material S3 Table).
We identified 64 metabolites associated with lipid metabolism, of which 45 belonged to the subcategory of free fatty acids (FFA) and acylcarnitines. Of these 45 metabolites, 43 had increased, while 2 had decreased levels in the CON group as compared to the NCON group at V2 (Figure 4A). Among the lipids, we observed the elevated level of all identified diacylglycerides, as well as nearly all monoacylglycerides, in CON as compared to NCON at both V1 and V2 (Figure 4B). This accumulation of serum monoacylglycerol (MAG) and diacylglycerol (DAG) species likely reflects increased liberation of FFA from circulating lipid stores. The elevated circulating acylcarnitine’s, often indicative intercellular changes, 27 suggests that the FFA is being utilized for beta‐oxidation. Further evidence for changes in lipid metabolism is also apparent in the elevated levels of the ketone body β‐hydroxybutyric acid (BHBA) and acetylcarnitine, reflective of changes in acetyl‐CoA levels, 28 at visit 2 within CON as compared to NCON. In total, these differences between CON and NCON may suggest a greater reliance on lipid oxidation for energy generation and a potential inability to process increased lipids.
FIGURE 4.
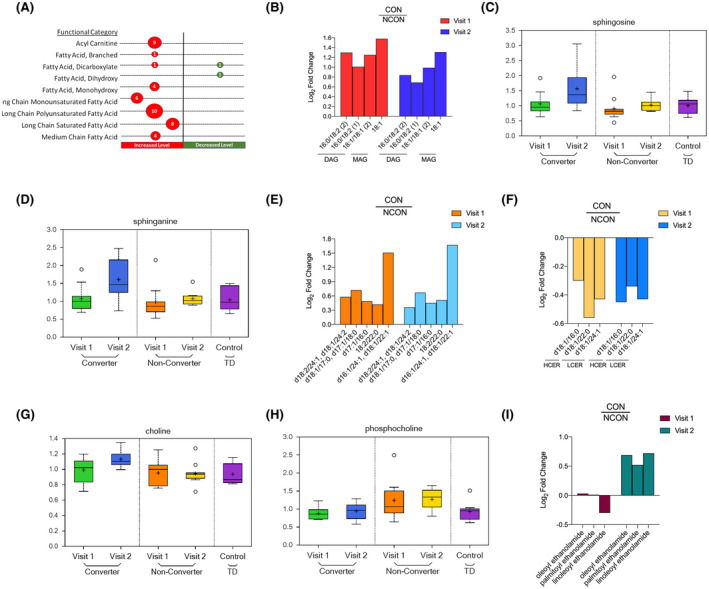
Lipid metabolism is dysregulated in individuals who develop FXTAS over time. A, Number of differentially expressed metabolites by functional categories are shown; circle sizes are proportional to the number of metabolites; red indicates increased and green indicates decrease level in CON as compared to NCON. B, Log2 Fold Change representation of diacylglycerides (DAG) and monoacylglycerides (MAG) in CON as compared to NCON both at V1 and V2. C, Box plots showing increased levels of sphingosine in CON as compared to NCON at V2. The heavy line in each box represents the median, the lower and upper box edges represent the 25th and 75th percentiles, respectively, and the lower and upper whiskers represent the smallest and largest observations, respectively. D, Box plots showing increased levels of sphingosine and sphinganine in CON as compared to NCON at V2. E, Log2 Fold Change representation of ceramides in CON as compared to NCON at V1 and V2. F, Log2 Fold Change representation of Hexocylceramides (HCER) and of Lactosylceramides (LCER) in CON as compared to NCON at V1 and V2. G, Box plots showing increased level of choline in CON as compared to NCON at V2. H, Box plots showing decreased levels of choline phosphate in CON as compared to NCON at V1 and V2. I, Log2 Fold Change representation of endocannabinoids in CON as compared to NCON at V1 and V2
The sphingolipid metabolic pathway has been observed to modulate CGG repeat toxicity and to be significantly perturbed in the cerebellum of the FXTAS murine model, 18 but there is no study to date investigating the sphingolipid alterations in carriers who develop FXATS. We found the level of sphingoid bases, including sphingosine, the substrate of ceramide synthase (P = .0181; q = 0.1462; Figure 4C) and sphinganine (P = .0182; q = 0.1462; Figure 4D) are elevated in CON as compared to NCON only at V2. Interestingly, ceramides, the product of sphingoid base acylation, (Figure 4E) were all also found increased in CON as compared to NCON both at V1 and V2. The elevation of these sphingoid bases along with circulating ceramides, like those observed here in the converter groups, have been implicated in neurodegeneration, potentially by activating apoptotic pathways of neuronal cells. In addition, we observed the low level of 3 observed Hexosylceramides (HCER) and Lactosylceramides (LCER) in converters former at V2 while later both at V1 and V2 (Figure 4F).
Abnormal phospholipid metabolism and specifically choline‐containing phospholipids are an indicator of neural membrane breakdown, and their increased levels have been found in the postmortem brain of AD patients. 29 We identified two metabolites associated with phospholipids that were statistically significant between groups; choline and choline phosphate. The level of Choline was found elevated in CON as compared to NCON only at Visit 2 (P = .0119; q = 0.1288; Figure 4G), while the level of choline phosphate was significantly decreased in CON both at V1 (P = .0291, q = 0.3591; Figure 4H) and V2 (P = .0231; q = 0.1684; Figure 4H). The increased levels of choline suggest that neural functional could be compromised and the decreased levels of the choline phosphate suggest an impaired neuron reception in individuals who developed the FXTAS over time.
The endocannabinoid system alterations have been found as a contributing factor to the development of AD’s disease (AD), Huntington’s disease (HD) and (PD). 30 We found three metabolites associated with endocannabinoid system including oleoyl ethanolamide (P = .0208; q = 0.1593), palmitoyl ethanolamide (P = .042; q = 0.1115) and linoleoyl ethanolamide (P = .0304; q = 0.1846), elevated in CON as compared to NCON only at V2 (Figure 4I). All of the identified endocannabinoids are playing a biological role in chronic pain and inflammation.
3.5. Altered Amino acid profiling observed in converter group
In addition to lipids, several metabolites in the amino acid pathway were also significantly altered in the development (changed in CON as compared to NCON at both V1 and V2) as well as in the progression of FXTAS (changed in CON as compared to NCON only at V2) (Figure 5A). Notably, differences were observed in methionine, lysine, and branched‐chain amino acid metabolism.
FIGURE 5.
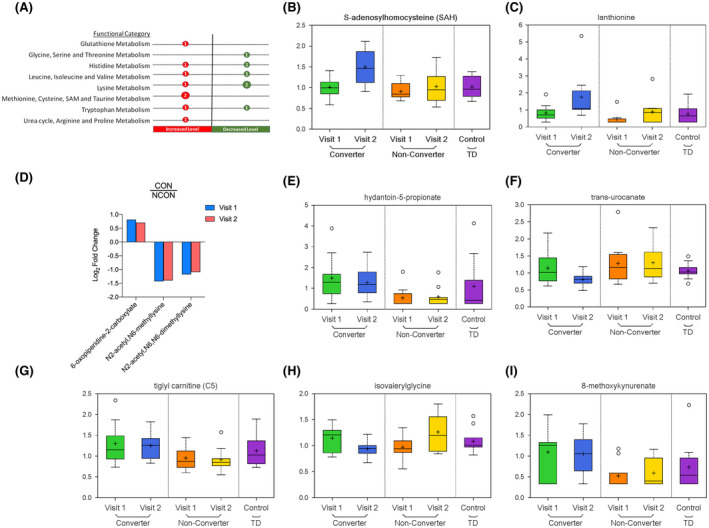
Altered amino‐acid profiling observed in CON group. A, Number of differentially expressed metabolites by functional categories are shown, circle sizes are proportional to the number of metabolites, red indicates increased and green indicates decrease level in CON as compared to NCON. B, Box plots showing increased levels of S‐adenosylhomocysteine in CON as compared to NCON at V2. For Box Plots the heavy line in each box represents the median, the lower and upper box edges represent the 25th and 75th percentiles, respectively, and the lower and upper whiskers represent the smallest and largest observations, respectively. C, Box plots showing increased levels of lanthionine in CON as compared to NCON at V2. D, Log2 Fold Change representation of metabolites associates with Lysine metabolism in CON as compared to NCON at V1 and V2. E, Box plots showing increased levels of hydantoin‐5‐propionate in CON as compared to NCON at V1 and V2. F, Box plots showing decreased levels of trans‐urocanate in CON as compared to NCON at V2. G, Box plots showing increased level of tiglylcarnitine (C5:1‐DC) in CON as compared to NCON at V1 and V2. H, Box plots showing decreased level of isovalerylglycine in CON as compared to NCON at V2. I, Box plots showing increased level of 8‐methoxykynurenate in CON as compared to NCON at V1 and V2.
Within the total 14 identified metabolites associated with amino acids we found 2 metabolites including S‐adenosylhomocysteine (SAH) (P = .0061; q = 0.1218; Figure 5B) and lanthionine (P = .0103; q = 0.1288; Figure 5C) associated with methionine, cysteine, SAM, and taurine metabolism increased only in CON as compared to NCON at V2. While three biomarkers of FXTAS development, that is, 6‐oxopiperidine‐2‐carboxylate, N2‐acetyl N6‐methyllysine, and N2‐acetyl N6 N6‐dimethyllysine found associated with lysine metabolism with 6‐oxopiperidine‐2‐carboxylate increased, and later two decreased in CON as compared to NCON both at V1 and V2 (Figure 5D). Two metabolites, that is, hydantoin‐5‐propionate and trans‐urocanate associated with Histidine Metabolism found only in CON of which level of hydantoin‐5‐propionate increased in CON as compared to NCON both at V1 (P = .0014; q = 0.1458; Figure 5E) and V2 (P = .0108; q = 0.1288; Figure 5E). In contrast, the level of trans‐urocanate found decreased in CON only at V2 (P = .0168; q = 0.1422; Figure 5F).
From leucine, isoleucine, and valine metabolism, we identify two metabolites tiglylcarnitine (C5:1‐DC) and isovalerylglycine, of which former found increased in CON as compared to NCON both at V1 (P = .0356; q = 0.3724; Figure 5G) and V2 (P = .0202; q = 0.1572; Figure 5G), while later found decreased only in CON as compared to NCON only at V2 (P = .0191; q = 0.1503; Figure 5H). The kynurenine pathway (KP) is the primary route of tryptophan degradation in mammalian cells and has been demonstrated to be involved in aging and many neurodegenerative disorders, including AD, PD, HD, and amyotrophic lateral sclerosis. Besides, it has been implicated in the pathogenesis of schizophrenia and bipolar disorder. 31 , 32 , 33 We found 8‐methoxykynurenate associated with Tryptophan metabolism with an increased level in CON as compared to NCON both at V1 (P = .0140; q = 0.2741; Figure 5I) and V2 (P = .0249; q = 0.1692; Figure 5I).
3.6. Nucleotide, carbohydrate, energy, and peptide pathways are dysregulated in individuals who develop symptoms of FXTAS over time.
The number of metabolites associated with other pathways, including nucleotide, carbohydrates, energy, and peptide is found dysregulated in the CON either at V2 or both at V1 and V2. As biomarker of disease development, we identified the N6‐methyladenosine associated with purine metabolism with increased level in CON as compared to NCON both at V1 (P = .0093; q = 0.2441; Figure 6A) and V2 (P = .0114; q = 0.1288; Figure 6A). While 5,6‐dihydrouracil as a biomarker of progression and linked with pyrimidine metabolism found an increase in CON as compared to NCON only at V2 (P = .0445; q = 0.2235; Figure 6B). Interestingly, we observed the low level of lactate in CON at V1 (P = 0.0426; q = 0.4019; Figure 6C) as compared to NCON, that significantly increased at V2 (P = .0397; q = 0.2158; Figure 6C). While on the other side, the level of Fumarate was found elevated only in CON as compared to NCON at V2 (P = .0083; q = 0.1223; Figure 6D).
FIGURE 6.
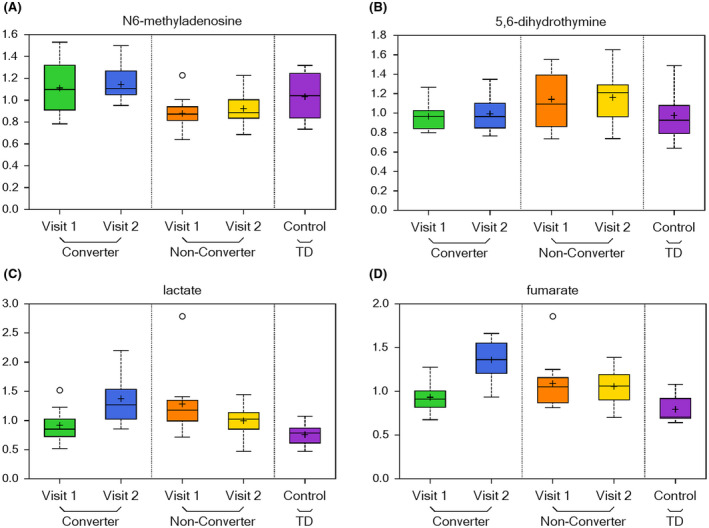
Nucleotide, carbohydrate, energy, and peptide pathways are dysregulated in individuals who develop symptoms of FXTAS over time. A, Box plots showing a biomarker of early disease diagnosis N6‐methyladenosine increased levels in CON as compared to NCON at V1 and V2. For Box Plots the heavy line in each box represents the median, the lower and upper box edges represent the 25th and 75th percentiles, respectively, and the lower and upper whiskers represent the smallest and largest observations, respectively. B, Box plots showing a biomarker of disease progression 5,6‐dihydrouracil increased levels in CON as compared to NCON at V2. C, Box plots showing decreased levels of lactate CON as compared to NCON at V1 that significantly increased at V2. D, Box plots showing increased levels of fumarate in CON as compared to NCON at V2
3.7. The metabolism of Xenobiotics is perturbed in FXTAS Converters
The xenobiotics alterations have been found in the cerebellum of the murine model of FXTAS 18 here we identified 11 metabolites from Xenobiotic pathway of which mannonate found to be increased in CON both at V1 (P = .0175; q = 0.3028; Figure 7A) and V2 (P = .0088; q = 0.1244; Figure 7A), while 3‐bromo‐5‐chloro‐2,6‐dihydroxybenzoic acid (P = .0019; q = 0.0841; Figure 7B), and dibutyl sulfosuccinate (P = .0119; q = 0.1288; Figure 7C) found increased at only V2. Interestingly we observed the significantly decreased level of remaining 8 xenobiotic metabolites at V2 in CON as compared to NCON (Figure 7D).
FIGURE 7.
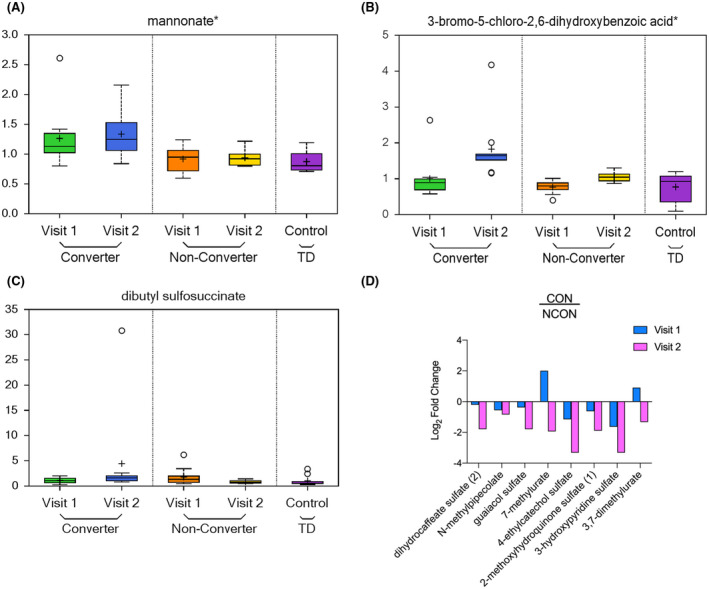
Xenobiotics metabolism is perturbed in CON group. A, Box plots showing increased level of mannonate in CON as compared to NCON at V1 and V2. For Box Plots the heavy line in each box represents the median, the lower and upper box edges represent the 25th and 75th percentiles, respectively, and the lower and upper whiskers represent the smallest and largest observations, respectively. B,C, Box plots showing an increased level of 3‐bromo‐5‐chloro‐2,6‐dihydroxybenzoic acid and dibutyl sulfosuccinate in CON as compared to NCON at V2. D, Log2 Fold Change representation of remaining 8 xenobiotics that are decreasing in CON as compared to NCON at V2
4. DISCUSSION
The present study identified several potential plasma metabolomic biomarkers for the early diagnosis and progression of FXTAS. Importantly, the study revealed the potential dysregulation of lipid metabolism in FXTAS as well as differences in the metabolism of numerous amino acids, nucleotides, xenobiotics, and carbohydrates. These findings both validate and expand upon an earlier, more limited study of plasma metabolic profiling of patients with a definitive diagnosis of FXTAS 14 , 15 and in the cerebellum of the murine model, 18 suggesting the involvement of pathways previously identified but now expanded (S3 Table) as well as the involvement and alterations of several other pathways. To our knowledge, this is the first report of the longitudinal metabolic profiling and on the identification of unique biomarkers that might in the future be used for early diagnosis, development, and the progression of FXTAS (Figures 2A and 3A).
Lipids regulate several cellular processes, including inflammation, cell proliferation, division, differentiation, aging, and death 34 and their metabolism has been found to be altered in various neurodegenerative disorders including the AD and other dementia, Parkinson’s disease, multiple sclerosis, Huntington disease, schizophrenia and bipolar disorders. 35 , 36 , 37 A distinguished subclass of lipids, the FFA, is primarily utilized for energy production by the mitochondrial fatty acid β‐oxidation (FAO) cycle, which begins with the conjugation of an FFA with coenzyme A (CoA) and subsequently carnitine. 38 Carnitines are found to accumulate to a lower extent in the brain as compared to peripheral tissues 39 and in the brain, these acylcarnitines can function in synthesizing lipids, modulating genes and proteins, increasing antioxidant activity, improving mitochondrial function, altering and stabilizing membrane composition and enhancing cholinergic neurotransmission. 40 We observed an increased level of FFA and all identified acylcarnitines in CON, as compared to the NCON, suggesting abnormalities in mitochondrial energy substrate utilization and potentially fatty acid processing in individuals who developed FXTAS over time.
Altered DAGs metabolism is a common feature of the neurodegenerative diseases that ultimately result in cognitive deficits. Increased levels of sphingolipids, and DAG have been found in the plasma and brains of patients with AD 41 and PD. 42 With regard to the mechanism, decreases in phosphocholine levels in PD suggest that the observed augmented degradation may contribute to increases in the pool size of free DAG. 43 Interestingly, in our current study, we found increased levels of all DAG and decrease the level of choline phosphate only in CON as compared to the NCON both as V1 and V2 suggesting their potential involvement in the neurodegeneration of FXTAS.
Sphingolipids have been considered an important potential lipid messenger and have been involved in various neurodegenerative disorders such as PD, AD, and HD. 44 , 45 , 46 , 47 Ceramides play a vital role in numerous fundamental cellular processes, including growth, differentiation, cell cycle arrest, senescence, survival, and apoptosis. 48 An increased level of ceramide has been reported in brains with AD and the other neurodegenerative disorders suggesting their role in the atypical death of neuronal cells. 49 In this study, we identified altered levels of metabolites in the sphingolipid metabolic pathway, in particular, the levels of sphingosine, sphinganine, and ceramides being significantly higher in participants who developed FXTAS over time (Figure 4c,d,e) suggesting an aberration in neural health and development. In addition, in the CON group we observed low levels of the hexosylceramides (HCER) (Figure 4f), that has been pointed as a promising candidate marker of disease progression in multiple sclerosis, 50 and of lactosylceramides (LCER) (Figure 4F) which has been implicated in both neuroinflammatory diseases and in mitochondrial dysfunction, which are common features of FXTAS. 51 , 52
The endocannabinoid system, which involves cannabinoid receptors type 1 (CB1R) and type 2 (CB2R), endogenous cannabinoids, and the enzymes that catabolize these compounds, have been shown to contribute to the development of neurodegenerative disorders including the including AD, HD, and PD. 30 These endocannabinoids, particularly palmitoylethanolamide, have been observed to have a biological function related to chronic pain and inflammation. Neuropsychiatric issues are common among premutation allele carriers, often exacerbated by chronic pain and fatigue, fibromyalgia, autoimmune disorders, and sleep problems. 53 In this study we identified high levels of several endocannabinoids (Figure 4I) in CON as compared to NCON, potentially indicating their role in inflammation and chronic pain process commonly seen in patients with FXTAS.
Phospholipids are found in high concentrations in the myelin sheaths of neurons, influencing the conformation and function of membrane‐bound receptors and ion channels. Abnormal phospholipid metabolism and specifically Choline containing phospholipids are indicators of neural membrane breakdown and their increased levels have been observed in the postmortem brain of AD patients. 29 In this study, we observed a significant increase in the level of choline (Figure 4G) in CON as compared to NCON at V2 which suggests their potential role in the increased chronic widespread musculoskeletal pain and inflammation associated with patients with FXTAS.
Amino acids (AA) play several integral roles in the central nervous system, where they act as neurotransmitters, regulators of metabolism, and neuromodulators. 54 A number of studies with amino acid profiling have found differences between the level of amino acids in patients with various types of diseases and in healthy control groups, for example, in patients with AD 55 , 56 , 57 and PD 58 , 59 and elderly patients. 60 These studies indicated the potential application of measuring amino acid levels as a diagnostic tool for AD, PD, and biomarkers of aging. Here, we found that amino acid metabolism is significantly altered in the individuals who developed FXTAS over time as compared to the premutation allele carriers who did not show any symptoms of FXTAS suggesting a potential involvement in the early identification and progression of FXTAS.
Mitochondrial dysfunction is one of the important characteristics of the aging process and is associated with various Krebs’ intermediates and a Warburg‐like shift in energy substrate utilization. The brain is particularly vulnerable to oxidative stress and damage, because of its low antioxidant defenses, increased oxygen consumption, and high content of polyunsaturated fats. 61 Mitochondrial alterations are also associated with various other neurodegenerative disorders and the bile acid metabolites are reported as the potential biomarker for the PD. 62 Napoli and the colleagues reported variation in the energy metabolism of freshly isolated PBMCs from premutation allele carriers as compared to age‐matched healthy controls by finding the low oxidative phosphorylation and increased glycolysis. 16 , 17 In addition, a previous analysis of plasma metabolites, we reported an increased level of lactate in premutation carriers as compared to controls suggesting a lower Krebs cycle activity in mitochondria. In addition, an increased level of fumarate which may inhibit alpha‐ketoglutarate‐dependent prolyl‐hydroxylases was previously reported. 14 These findings along with a higher production of the reactive oxygen species as well as impaired redox regulated mitochondrial disulfide relay system and the mtDNA deletions in both the PBMCs and the fibroblast derived from the premutation allele carriers suggest the increased level of the oxidative nitrate damage. 16 , 17 The resultant nitrate damage could be responsible for the mitochondrial dysfunction and neurons remodeling. Interestingly, in this study, we found a unique trend in which lactate was low in CON as compared to NCON at V1 but became significantly increased at V2 (Figure 6C). This significant increment supports our previous findings and the mitochondrial dysfunction observed in individuals who develop the FXTAS. 15 The increase in lactate in premutation carriers as compared to controls and more interestingly among the CON as compared to the NCON group suggests its potential role as an important biomarker to evaluate in clinical settings. In addition, we also found the increased level of fumarate (Figure 6D) in the converters as compared to non‐converters suggesting its role in the observed mitochondrial functional impairment in FXTAS. Direct evidence for changes in inflammatory or redox balance is also apparent here, namely with increased levels of lanthionine, 5‐oxoproline, cysteinglycine‐oxidized, and cysteine glycine disulfide at V2 within the CON group as compared to NCON. These changes possibly reflect increased oxidative stress as a consequence of conversion from carrier to symptomatic state. In addition, targeting of these metabolites could recover the mitochondrial function as shown by the Song and colleagues in fibroblast derived from carriers of a premutation allele. 16
A strong relationship between environmental factors and neurodegenerative disorders 63 suggests an important role of early life in the health and development of an individual. Specifically, it has been shown that environmental xenobiotics were extremely toxic causing mitochondrial dysfunction in dopaminergic neurons leading to PD phenotypes. 64 In addition, a dietary intervention has been suggested to increase xenobiotic metabolism that could reduce oxidative stress and neuroendocrine disease in developing countries. 65 We found a decreased level of the majority of identified xenobiotics in the CON as compared to the NCON that may suggest increasing oxidative stress and the role of xenobiotic dysregulation in FXTAS.
Nervonic acid, a long‐chain unsaturated fatty acid, enriched in sphingomyelin enhances brain functions and prevents demyelination. In this study, nervonate levels were significantly elevated in the CON group at V2 (Supplementary Material S1 Fig) which suggests an altered myelin formation in neural cells. This would support myelin loss, which would support one of the pathologic features of FXTAS 66 and motor and sensory demyelinating polyneuropathy in the lower extremities of patients with FXTAS detected by nerve conduction studies. 67
5. CONCLUSION
To date, there have been no identified molecular biomarkers of FXTAS, which has delayed treatment, diagnosis, and prognosis of patients. In this study, using a unique approach of high‐throughput unbiased metabolic profiling of premutation carriers including longitudinal analysis, we identified a unique set of potential metabolomic biomarkers of early development and progression of FXTAS. In addition, we also observed a significant dysregulation in lipid metabolism, more specifically the sub pathways involved in mitochondrial bioenergetics. These identified metabolites could be of a great value not only for the early identification but also for the development of effective therapeutics of this devasting neurodegenerative disorder. However, due to the limitation of the small sample size, potential medication, and diet effect further studies with larger sample size and more robust medication and diet history are required to test the initial findings and elucidate and confirm the role of the potential identified biomarkers. Finally, in addition, recent studies, in a wide range of neurological diseases have provide compelling evidence that both lifestyle and nutritional factors contribute to risk or protection for a wide range of neurological diseases. Thus, in future metabolomic studies it will be are important to include dietary patterns.
CONFLICT OF INTERESTS
M. Zafarullah, G. Palczewski and S.M. Rivera: No disclosures to report.
D.R. Hessl: Has received the funding from Novartis, Roche, Seaside Therapeutics LLC and Marinus Pharmaceuticals, Inc. for designing Fragile X clinical Trials.
F. Tassone: Has received the funding from Azrieli Foundation, Zynerba and Asuragen, Inc. for studies in Fragile X syndrome.
AUTHOR CONTRIBUTIONS
Designed Research
Conception: F. Tassone
Organization: M. Zafarullah, S.M. Rivera, D.R. Hessl, F. Tassone
Execution: M. Zafarullah, F. Tassone
Analyzed Data
Design: F. Tassone, G. Palczewski
Execution: G. Palczewski
Review and Critique: M. Zafarullah, G. Palczewski, S.M. Rivera, D.R. Hessl, F. Tassone
Manuscript Preparation
Writing the first draft: M. Zafarullah
Review and Critique: M. Zafarullah, G. Palczewski, S.M. Rivera, D.R. Hessl, F. Tassone
“All authors read and approved the final manuscript”
Supporting information
Supplementary Material
ACKNOWLEDGMENTS
We thank the participants of the community‐based studies who donated their time and samples for this study. This paper is dedicated to the memory of Matteo.
Zafarullah M, Palczewski G, Rivera SM, Hessl DR, Tassone F. Metabolic profiling reveals dysregulated lipid metabolism and potential biomarkers associated with the development and progression of Fragile X‐Associated Tremor/Ataxia Syndrome (FXTAS). The FASEB Journal. 2020;34:16676–16692. 10.1096/fj.202001880R
REFERENCES
- 1. Heemels M‐T. Neurodegenerative diseases. Nature. 2016;539:179. [DOI] [PubMed] [Google Scholar]
- 2. Hagerman RJ, Hagerman P. Fragile X‐associated tremor/ataxia syndrome — features, mechanisms and management. Nat Rev Neurol. 2016;12:403‐412. [DOI] [PubMed] [Google Scholar]
- 3. Hagerman RJ, Berry‐Kravis E, Hazlett HC, et al. Fragile X syndrome. Nat Rev Dis Primers. 2017;3:17065. [DOI] [PubMed] [Google Scholar]
- 4. Jacquemont S. Penetrance of the Fragile X‐associated tremor/ataxia syndrome in a premutation carrier population. JAMA. 2004;291:460. [DOI] [PubMed] [Google Scholar]
- 5. Tassone F, Iong K, Tong T‐H, et al. FMR1 CGG allele size and prevalence ascertained through newborn screening in the United States. Genome Med. 2012;4:100. [DOI] [PMC free article] [PubMed] [Google Scholar]
- 6. Jové M, Portero‐Otín M, Naudí A, Ferrer I, Pamplona R. Metabolomics of human brain aging and age‐related neurodegenerative diseases. J Neuropathol Exp Neurol. 2014;73:640‐657. [DOI] [PubMed] [Google Scholar]
- 7. Gu Q, Spinelli JJ, Dummer TBJ, McDonald TE, Moore SC, Murphy RA. Metabolic profiling of adherence to diet, physical activity and body size recommendations for cancer prevention. Sci Rep. 2018;8:16293. [DOI] [PMC free article] [PubMed] [Google Scholar]
- 8. Peng B, Li H, Peng X‐X. Functional metabolomics: from biomarker discovery to metabolome reprogramming. Protein Cell. 2015;6:628‐637. [DOI] [PMC free article] [PubMed] [Google Scholar]
- 9. Lin C, Huang C, Huang K, Lin K, Yen T, Kuo H. A metabolomic approach to identifying biomarkers in blood of Alzheimer’s disease. Ann Clin Transl Neurol. 2019;6:537‐545. [DOI] [PMC free article] [PubMed] [Google Scholar]
- 10. Graham SF, Kumar P, Bahado‐Singh RO, Robinson A, Mann D, Green BD. Novel metabolite biomarkers of huntington’s disease as detected by high‐resolution mass spectrometry. J Proteome Res. 2016;15:1592‐1601. [DOI] [PubMed] [Google Scholar]
- 11. Skene DJ, Middleton B, Fraser CK, et al. Metabolic profiling of presymptomatic Huntington’s disease sheep reveals novel biomarkers. Sci Rep. 2017;7:43030. [DOI] [PMC free article] [PubMed] [Google Scholar]
- 12. Havelund J, Heegaard N, Færgeman N, Gramsbergen J. Biomarker research in Parkinson’s disease using metabolite profiling. Metabolites. 2017;7:42. [DOI] [PMC free article] [PubMed] [Google Scholar]
- 13. Shao Y, Le W. Recent advances and perspectives of metabolomics‐based investigations in Parkinson’s disease. Mol Neurodegener. 2019;14:3. [DOI] [PMC free article] [PubMed] [Google Scholar]
- 14. Giulivi C, Napoli E, Tassone F, Halmai J, Hagerman R. Plasma biomarkers for monitoring brain pathophysiology in FMR1 premutation carriers. Front Mol Neurosci. 2016;9:71. [DOI] [PMC free article] [PubMed] [Google Scholar]
- 15. Giulivi C, Napoli E, Tassone F, Halmai J, Hagerman R. Plasma metabolic profile delineates roles for neurodegeneration, pro‐inflammatory damage and mitochondrial dysfunction in the FMR1 premutation. Biochem J. 2016;473:3871‐3888. [DOI] [PMC free article] [PubMed] [Google Scholar]
- 16. Song G, Napoli E, Wong S, et al. Altered redox mitochondrial biology in the neurodegenerative disorder fragile X‐tremor/ataxia syndrome: use of antioxidants in precision medicine. Mol. Med. 2016;22:548‐559. [DOI] [PMC free article] [PubMed] [Google Scholar]
- 17. Napoli E, Song G, Schneider A, et al. Warburg effect linked to cognitive‐executive deficits in FMR1 premutation. FASEB J. 2016;30:3334‐3351. [DOI] [PMC free article] [PubMed] [Google Scholar]
- 18. Kong HE, Lim J, Zhang F, et al. Metabolic pathways modulate the neuronal toxicity associated with fragile X‐associated tremor/ataxia syndrome. Hum Mol Genet. 2019;28:980‐991. [DOI] [PMC free article] [PubMed] [Google Scholar]
- 19. Napoli E, Schneider A, Wang JY, et al. Allopregnanolone treatment improves plasma metabolomic profile associated with GABA metabolism in fragile X‐associated tremor/ataxia syndrome: a pilot study. Mol. Neurobiol. 2019;56:3702‐3713. [DOI] [PMC free article] [PubMed] [Google Scholar]
- 20. Shelton AL, Wang JY, Fourie E, et al. Middle cerebellar peduncle width—a novel MRI biomarker for FXTAS? Front Neurosci. 2018;12:379. [DOI] [PMC free article] [PubMed] [Google Scholar]
- 21. Bacalman S, Farzin F, Bourgeois JA, et al. Psychiatric phenotype of the fragile X‐associated tremor/ataxia syndrome (FXTAS) in males: newly described fronto‐subcortical dementia. J Clin Psychiatry. 2006;67:87‐94. [DOI] [PubMed] [Google Scholar]
- 22. Zafarullah M, Tassone F. Fragile X‐associated tremor/ataxia syndrome (FXTAS). Fragile‐X Syndrome. 2019;1942:173‐189. [DOI] [PubMed] [Google Scholar]
- 23. Tassone F, Pan R, Amiri K, Taylor AK, Hagerman PJ. A Rapid polymerase chain reaction‐based screening method for identification of all expanded alleles of the fragile X (FMR1) gene in newborn and high‐risk populations. J Mol Diagn. 2008;10:43‐49. [DOI] [PMC free article] [PubMed] [Google Scholar]
- 24. Filipovic‐Sadic S, Sah S, Chen L, et al. A novel FMR1 PCR method for the routine detection of low abundance expanded alleles and full mutations in fragile X syndrome. Clin Chem. 2010;56:399‐408. [DOI] [PMC free article] [PubMed] [Google Scholar]
- 25. Evans AM, DeHaven CD, Barrett T, Mitchell M, Milgram E. Integrated, nontargeted ultrahigh performance liquid chromatography/electrospray ionization tandem mass spectrometry platform for the identification and relative quantification of the small‐molecule complement of biological systems. Anal Chem. 2009;81:6656‐6667. [DOI] [PubMed] [Google Scholar]
- 26. Storey JD, Tibshirani R. Statistical significance for genomewide studies. Proc Natl Acad Sci. 2003;100:9440‐9445. [DOI] [PMC free article] [PubMed] [Google Scholar]
- 27. Makrecka‐Kuka M, Sevostjanovs E, Vilks K, et al. Plasma acylcarnitine concentrations reflect the acylcarnitine profile in cardiac tissues. Sci Rep. 2017;7:1‐11. [DOI] [PMC free article] [PubMed] [Google Scholar]
- 28. Schroeder MA, Atherton HJ, Dodd MS, et al. the cycling of acetyl‐coenzyme a through acetylcarnitine buffers cardiac substrate supply. Circulation: Cardiovascular Imaging. 2012;5:201‐209. [DOI] [PMC free article] [PubMed] [Google Scholar]
- 29. Klein J. Membrane breakdown in acute and chronic neurodegeneration: focus on choline‐containing phospholipids. J Neural Transm. 2000;107:1027‐1063. [DOI] [PubMed] [Google Scholar]
- 30. Basavarajappa BS, Shivakumar M, Joshi V, Subbanna S. Endocannabinoid system in neurodegenerative disorders. J. Neurochem. 2017;142:624‐648. [DOI] [PMC free article] [PubMed] [Google Scholar]
- 31. Maddison DC, Giorgini F. The kynurenine pathway and neurodegenerative disease. Semin Cell Dev Biol. 2015;40:134‐141. [DOI] [PubMed] [Google Scholar]
- 32. Majláth Z, Toldi J, Vécsei L. The role of the kynurenine pathway in neurodegenerative diseases. Target Broadly Pathogenic Kynurenine Pathway. 2015;193‐204. [Google Scholar]
- 33. Tan L, Yu J‐T, Tan L. The kynurenine pathway in neurodegenerative diseases: mechanistic and therapeutic considerations. J Neurol Sci. 2012;323:1‐8. [DOI] [PubMed] [Google Scholar]
- 34. Boojar MMA, Boojar MMA, Golmohammad S. Ceramide pathway: a novel approach to cancer chemotherapy. Egypt J Basic Appl Sci. 2018;5:237‐244. [Google Scholar]
- 35. Xu Q, Huang Y. Lipid metabolism in Alzheimer’s and Parkinson’s disease. Future Lipidol. 2006;1:441‐453. [Google Scholar]
- 36. Yadav RS, Tiwari NK. Lipid Integration in Neurodegeneration: an overview of Alzheimer’s disease. Mol Neurobiol. 2014;50:168‐176. [DOI] [PubMed] [Google Scholar]
- 37. Shamim A, Mahmood T, Ahsan F, Kumar A, Bagga P. Lipids: an insight into the neurodegenerative disorders. Clin Nutr Experimental. 2018;20:1‐19. [Google Scholar]
- 38. Schulz H. Fatty acid oxidation. Encyclopedia Biol Chem. 2004;1:90‐94. [Google Scholar]
- 39. Nacz K. Carnitine: transport and physiological functions in the brain. Mol Aspects Med. 2004;25:551‐567. [DOI] [PubMed] [Google Scholar]
- 40. Jones LL, McDonald DA, Borum PR. Acylcarnitines: role in brain. Prog Lipid Res. 2010;49:61‐75. [DOI] [PubMed] [Google Scholar]
- 41. Critical assessment of the status of biomarkers for Alzheimer’s disease. J Parkinson’s Dis Alzheimer's Dis. 1.
- 42. Cheng D, Jenner AM, Shui G, et al. Lipid pathway alterations in Parkinson’s disease primary visual Cortex. PLoS ONE. 2011;6:e17299. [DOI] [PMC free article] [PubMed] [Google Scholar]
- 43. Wood PL, Tippireddy S, Feriante J, Woltjer RL. Augmented frontal cortex diacylglycerol levels in Parkinson’s disease and Lewy Body Disease. PLoS ONE. 2018;13:e0191815. [DOI] [PMC free article] [PubMed] [Google Scholar]
- 44. Mielke MM, Lyketsos CG. Alterations of the sphingolipid pathway in Alzheimer’s disease: new biomarkers and treatment targets? NeuroMol Med. 2010;12:331‐340. [DOI] [PMC free article] [PubMed] [Google Scholar]
- 45. Piccinini M, Scandroglio F, Prioni S, et al. Deregulated sphingolipid metabolism and membrane organization in neurodegenerative disorders. Mol Neurobiol. 2010;41:314‐340. [DOI] [PubMed] [Google Scholar]
- 46. Wang G, Silva J, Dasgupta S, Bieberich E. Long‐chain ceramide is elevated in presenilin 1 (PS1M146V) mouse brain and induces apoptosis in PS1 astrocytes. Glia. 2008;56:449–456. [DOI] [PubMed] [Google Scholar]
- 47. Cutler RG, Kelly J, Storie K, et al. Involvement of oxidative stress‐induced abnormalities in ceramide and cholesterol metabolism in brain aging and Alzheimer’s disease. Proc Natl Acad Sci. 2004;101:2070‐2075. [DOI] [PMC free article] [PubMed] [Google Scholar]
- 48. Mullen TD, Obeid LM. Ceramide and apoptosis: exploring the enigmatic connections between sphingolipid metabolism and programmed cell death. Anticancer Agents Med Chem. 2012;12:340‐363. [DOI] [PubMed] [Google Scholar]
- 49. Filippov V, Song MA, Zhang K, et al. Increased ceramide in brains with Alzheimer’s and other neurodegenerative diseases. J Alzheimer’s Dis. 2012;29:537‐547. [DOI] [PMC free article] [PubMed] [Google Scholar]
- 50. Checa A, Khademi M, Sar DG, et al. Hexosylceramides as intrathecal markers of worsening disability in multiple sclerosis. Multiple Sclerosis J. 2015;21:1271‐1279. [DOI] [PubMed] [Google Scholar]
- 51. Pannu R. A novel role of lactosylceramide in the regulation of lipopolysaccharide/interferon‐ ‐mediated inducible nitric oxide synthase gene expression: implications for neuroinflammatory diseases. J Neurosci. 2004;24:5942‐5954. [DOI] [PMC free article] [PubMed] [Google Scholar]
- 52. Novgorodov SA, Riley CL, Yu J, et al. Lactosylceramide contributes to mitochondrial dysfunction in diabetes. J Lipid Res. 2016;57:546‐562. [DOI] [PMC free article] [PubMed] [Google Scholar]
- 53. Hagerman RJ, Protic D, Rajaratnam A, Salcedo‐Arellano MJ, Aydin EY, Schneider A. Fragile X‐associated neuropsychiatric disorders (FXAND). Front. Psychiatry. 2018;9:564. [DOI] [PMC free article] [PubMed] [Google Scholar]
- 54. Socha E, Koba M, Kośliński P. Amino acid profiling as a method of discovering biomarkers for diagnosis of neurodegenerative diseases. Amino Acids. 2019;51:367‐371. [DOI] [PubMed] [Google Scholar]
- 55. Van Assche R, Temmerman L, Dias DA, et al. Metabolic profiling of a transgenic Caenorhabditis elegans Alzheimer model. Metabolomics. 2015;11:477‐486. [DOI] [PMC free article] [PubMed] [Google Scholar]
- 56. Corso G, Cristofano A, Sapere N, et al. Serum amino acid profiles in normal subjects and in patients with or at risk of Alzheimer dementia. Dement Geriatr Cogn Dis Extra. 2017;7:143‐159. [DOI] [PMC free article] [PubMed] [Google Scholar]
- 57. Gong Y, Liu Y, Zhou L, et al. A UHPLC‐TOF/MS method based metabonomic study of total ginsenosides effects on Alzheimer disease mouse model. J Pharm Biomed Anal. 2015;115:174‐182. [DOI] [PubMed] [Google Scholar]
- 58. Blesa J, Trigo‐Damas I, Quiroga‐Varela A, Jackson‐Lewis VR. Oxidative stress and Parkinson’s disease. Front Neuroanat. 2015;9. [DOI] [PMC free article] [PubMed] [Google Scholar]
- 59. Figura M, Kuśmierska K, Bucior E, et al. Serum amino acid profile in patients with Parkinson’s disease. PLoS ONE. 2018;13:e0191670. [DOI] [PMC free article] [PubMed] [Google Scholar]
- 60. Adachi Y, Ono N, Imaizumi A, et al. Plasma amino acid profile in severely frail elderly patients in Japan. Int J Gerontol. 2018;12:290‐293. [Google Scholar]
- 61. Cenini G, Lloret A, Cascella R. Oxidative stress and mitochondrial damage in neurodegenerative diseases: from molecular mechanisms to targeted therapies. Oxidative Med Cellular Longevity. 2020;2020:1‐2. [DOI] [PMC free article] [PubMed] [Google Scholar]
- 62. Zhao H, Wang C, Zhao N, et al. Potential biomarkers of Parkinson’s disease revealed by plasma metabolic profiling. J Chromatogr B. 2018;1081‐1082:101‐108. [DOI] [PubMed] [Google Scholar]
- 63. Lahiri DK, Maloney B. The “LEARn” (Latent Early‐life Associated Regulation) model integrates environmental risk factors and the developmental basis of Alzheimer’s disease, and proposes remedial steps. Exp Gerontol. 2010;45:291–296. [DOI] [PMC free article] [PubMed] [Google Scholar]
- 64. Ekstrand MI, Terzioglu M, Galter D, et al. Progressive parkinsonism in mice with respiratory‐chain‐deficient dopamine neurons. Proc Natl Acad Sci. 2007;104:1325‐1330. [DOI] [PMC free article] [PubMed] [Google Scholar]
- 65. Increased risk for obesity and diabetes with neurodegeneration in developing countries. Journal of Molecular and Genetic Medicine. s1. [Google Scholar]
- 66. Greco CM, Tassone F, Garcia‐Arocena D, et al. Clinical and neuropathologic Findings in a woman with the FMR1 premutation and multiple sclerosis. Arch Neurol. 2008;65. [DOI] [PMC free article] [PubMed] [Google Scholar]
- 67. Eker A, Fahrioglu U, Serakinci N. Late onset tremor and ataxia syndrome: FXTAS and its ignored peripheral nervous system findings in diagnostic criteria. Noro Psikiyatri Arsivi. 2016;53:92‐93. [DOI] [PMC free article] [PubMed] [Google Scholar]
Associated Data
This section collects any data citations, data availability statements, or supplementary materials included in this article.
Supplementary Materials
Supplementary Material