

Abstract
Imatinib, a PDGF receptor tyrosine kinase inhibitor, has been shown to suppress intimal hyperplasia in different animal models under normal metabolic milieu, diabetic, and/or hypercholesterolemic conditions. However, the impact of imatinib treatment on injury-induced neointimal hyperplasia has not yet been investigated in the setting of insulin resistance without frank diabetes. Using a mouse model of high fat diet (HFD)-induced insulin resistance and guidewire-induced arterial injury, the present study demonstrates that intraperitoneal administration of imatinib (25 mg/kg/day) for ~3 weeks resulted in a marked attenuation of neointimal hyperplasia (intima/media ratio) by ~78% (n = 6–9 per group; P < 0.05). Imatinib treatment also led to significant improvements in key metabolic parameters. In particular, imatinib improved insulin resistance and glucose tolerance, as revealed by complete inhibition of HFD-induced increase in HOMA-IR index and AUCIPGTT, respectively. In addition, imatinib treatment led to diminutions in HFD-induced increases in plasma total cholesterol and triglycerides by ~73% and ~59%, respectively. Furthermore, imatinib decreased HFD-induced increase in visceral fat accumulation by ~51% (as determined by epididymal white adipose tissue weight). Importantly, imatinib treatment in HFD-fed mice enhanced plasma levels of high-molecular-weight adiponectin by ~2-fold without affecting total adiponectin. However, there were no significant changes in mean arterial pressure in insulin-resistant state or after imatinib exposure, as measured by tail-cuff method. Together, the present findings suggest that targeting PDGF receptor tyrosine kinase using imatinib may provide a realistic treatment option to prevent injury-induced neointimal hyperplasia and diet-induced insulin resistance in obesity.
Keywords: imatinib, PDGF, neointimal hyperplasia, arterial injury, insulin resistance, adiponectin
1. Introduction
Platelet-derived growth factor (PDGF) plays a major role in the pathogenesis of atherosclerosis and restenosis after angioplasty (Heldin and Westermark, 1999; Ross, 1999; Owens et al., 2004). It is released locally at the site of vascular injury and functions as a potent mitogen for vascular smooth muscle cells [VSMCs] (Barrett and Benditt, 1987; Tanizawa et al., 1996; Heldin and Westermark, 1999). In particular, PDGF promotes phenotypic switching of VSMCs from contractile to proliferative state, thereby contributing to intimal hyperplasia at the lesion site (Owens et al., 2004). Importantly, intimal hyperplasia is an early event that occurs prior to the development of atherosclerotic lesions including the formation of foam cells and infiltration of inflammatory cells (Ross, 1999; Cizek et al., 2007). Previous studies have shown that imatinib, a PDGF receptor tyrosine kinase inhibitor, attenuates the development of atherosclerosis in diabetic apoE knockout mice (Lassila et al., 2004) and hypercholesterolemic LRP1-inactivated-LDL receptor knockout mice (Boucher et al., 2003). In addition, imatinib inhibits neointimal hyperplasia under normal metabolic milieu in different experimental models, including rat model of balloon injury (Makiyama et al., 2008), rabbit jugular vein grafts (Kimura et al., 2008), and porcine coronary artery stent model (Masuda et al., 2011). From a mechanistic standpoint, we and several other investigators have shown that imatinib suppresses VSMC proliferation by inhibiting PDGF receptor tyrosine phosphorylation and its downstream signaling components such as Akt, p70S6kinase, and ERK1/2 (Boucher et al., 2003; Lassila et al., 2004; Zhao et al., 2011). In our previous study, we have also shown that imatinib prevents PDGF-mediated disruption of insulin receptor signaling in VSMCs (Zhao et al., 2011). Despite the antiproliferative and insulin-sensitizing effects of imatinib observed in VSMCs in vitro, it remains unclear as to whether imatinib has the potential to inhibit neointimal hyperplasia in the setting of systemic insulin resistance in vivo.
Several studies suggest that in nondiabetic subjects, insulin resistance is an independent risk factor for carotid atherosclerosis (Laakso et al., 1991; Ishizaka et al., 2003) and neointimal hyperplasia after percutaneous coronary intervention (Piatti et al., 2003; Sekiguchi et al., 2004; Komatsu et al., 2015). In subjects with obesity or metabolic syndrome, insulin receptor substrate-1 (IRS-1) mutation significantly increases the risk of coronary artery disease (Baroni et al., 1999; Delafontaine, 2000). Together, these earlier studies suggest that insulin resistance, metabolic syndrome, and/or defective insulin receptor signaling in vivo would exaggerate neointimal hyperplasia after arterial injury. It is well accepted that insulin resistance is associated with metabolic syndrome, which is a cluster of abnormalities such as impaired glucose tolerance, dyslipidemia, obesity, and hypertension. In the present study using C57BL/6J mice, we examined the effects of high fat diet (HFD) on insulin resistance (HOMA-IR index), glucose tolerance, plasma lipid profile and adiponectin, epididymal white adipose tissue weight, and blood pressure. In addition, we examined the extent to which guidewire-induced injury in the femoral artery enhances neointimal hyperplasia in the setting of HFD-induced insulin resistance. Furthermore, we examined the effects of imatinib on insulin resistance, associated metabolic changes, and injury-induced neointimal hyperplasia.
2. Materials and methods
2.1. Materials
Imatinib (Gleevec; STI-571) was purchased from Santa Cruz Biotechnology (Dallas, Texas). Smooth muscle (SM) α-actin primary antibody was purchased from Abcam (ab5694; Cambridge, MA). Goat anti-rabbit secondary antibody (A-11037) and prolong gold anti-fade mountant with DAPI (P36931) were purchased from Life Technologies (Grand Island, NY). Normal goat serum was purchased from Sigma-Aldrich (G9023; St. Louis, MO). VITROS DT-slides were purchased from Ortho Clinical Diagnostics (Rochester, NY). All surgical tools were purchased from Roboz Surgical Instrument (Gaithersburg, MD). Isoflurane was purchased from Butler Schein Animal Health (Dublin, OH). All other chemicals were purchased from Fisher Scientific (Fair Lawn, NJ).
2.2. Animals
All animal experiments were performed in accordance with the Charlie Norwood Veterans Affairs Medical Center Institutional Animal Care and Use Committee guidelines and were approved by the committee (protocol number: 14-09-077). Male C57BL/6J mice (7 weeks of age; stock number: 000664) were purchased from Jackson Laboratory (Bar Harbor, Maine) and maintained (3 mice/cage) in a room at a controlled temperature of 23 °C with a 12-h:12-h dark-light cycle. The mice had free access to water and standard rodent chow (cat# 8904, Harlan Teklad, Madison, WI).
2.3. Experimental design for imatinib treatment and femoral artery injury studies in ND- and HFD-fed mice

At 8 weeks of age (day 0), the mice were divided into two groups (n = 22 per group) and were fed a standard chow diet (normal diet; ND) or HFD (cat# D12492; Research Diets, Inc., New Brunswick, NJ) for 6 weeks. HFD is comprised of 60% fat-derived calories (mainly as lard) vs ND that contains 14% fat. On day 21, ND- and HFD-fed groups of mice were divided into two subgroups (n = 11 mice/group) to receive intraperitoneal injections of vehicle (control) or imatinib [25 mg/kg/day] (Han et al., 2009) until the end of experiment (day 42). Imatinib was dissolved in sterile water prior to administration. On the day after the start of imatinib treatment (day 22), the left femoral arteries from ND- and HFD-fed mice were injured using a straight spring wire, as described (Shawky et al., 2016; Fairaq et al., 2017).
2.4. Measurements of body weight, food consumption, and caloric intake
Body weights were initially measured (day 0) and monitored weekly thereafter throughout the experiment. Average daily food and caloric intakes, feeding and energy efficiencies were calculated according to the formulas; as described (Choi et al., 2014; Fjaere et al., 2014; Shawky et al., 2016).
2.5. Measurement of blood pressure and heart rate
Blood pressure was recorded in conscious mice once a week during the entire period of study by the tail-cuff method using single/dual blood pressure analysis system (Model SC1000, Hatteras instruments Inc., Cary, NC). The platform was pre-warmed to 40.5 °C before placing the mice. Initially, the mice underwent 5 preliminary cycles, for which the data were not considered for analysis. These steps allow the mice to adjust and warm-up to improve the blood flow in the tail. The preliminary cycles were followed by 10 actual cycles for the measurement of systolic blood pressure (SBP), diastolic blood pressure (DBP), mean arterial pressure (MAP), and heart rate (HR). To improve consistency in blood pressure measurements, each mouse was handled gently and kept on the platform in a quiet and warm environment. The above procedures were repeated for 2–3 days before the actual experiment to familiarize the mice with the restrainer.
2.6. Fasing blood glucose measurement and intraperitoneal glucose tolerance test (IPGTT)
Fasting glucose levels were measured at the start of the experiment (day 0), 3rd week (day 20), and 6th week (day 42) using tail blood after making a puncture at the tail end. IPGTT was performed in mice after a 15-h fast on day 41. IPGTT was performed by injecting fresh glucose solution (2 g/kg, IP) and measuring blood glucose at baseline (0 time point) before glucose injection and at 30, 60, 120 and 180 min after glucose injection. Blood glucose was measured using a glucometer (Contour glucometer, Bayer Health Care, Mishawaka, IN). Area under the curve (AUC) was calculated from the IPGTT using GraphPad Prism software (GraphPad Software Inc. V6.0f, San Diego, CA, USA).
2.7. Blood sampling and organ collection
After a 15-h fast, blood was collected via the retro-orbital plexus using heparinized capillary tubes at the end of the experiment (day 42). Plasma samples were separated immediately by centrifugation at 5000 × g (15 min, 4 °C) and then stored at −80 °C until analysis. Mice were perfused with saline solution through the left ventricle during deep anesthesia on isoflurane. Epididymal white adipose tissue (eWAT) was subsequently collected and weighed.
2.8. Plasma insulin and homeostasis model assessment of insulin resistance (HOMA-IR)
Fasting plasma insulin concentrations were measured using ELISA kit that is specific for mouse insulin (cat# 10-1247-011; Mercodia Inc., Uppsala, Sweden). HOMA-IR was calculated using the following formula, as described (Matthews et al., 1985);
2.9. Measurement of plasma lipid profile
Plasma total cholesterol (TC), triglyceride (TG) and high-density lipoprotein cholesterol (HDL-C) levels were measured using an enzymatic colorimetric method by VITROS DT60 II Chemistry System (Ortho-Clinical Diagnostics, Inc., Rochester, NY).
2.10. Quantification of plasma adiponectin
Total and high molecular weight (HMW) adiponectin levels were quantified in plasma samples using ELISA kit (ALPCO Diagnostics, Salem, NH) according to the manufacturer`s instructions.
2.11. Histological and morphometric analyses of harvested femoral arteries
On day 42, after perfusion with saline as mentioned earlier, mice were perfused with 4% paraformaldehyde (PFA). Subsequently, the left and right femoral arteries were carefully harvested and fixed overnight in 4% PFA at 4°C. Femoral arteries were then incubated overnight with 30% sucrose at 4 °C, embedded in ornithine carbamyl-transferase (OCT), mounted on slides (5–7 mm-thick middle section), and stained with hematoxylin & eosin (H&E) and elastic van gieson (EVG) to quantify intimal hyperplasia. Frozen slides were stored at −80 °C until immunofluorescence analysis.
To evaluate intimal hyperplasia after arterial injury, EVG cross sections were observed at 20x magnification under microscope (Carl Zeiss Micro-imaging, Inc., Thornwood, NY). The external elastic lamina (EEL), internal elastic lamina (IEL), and lumen were circumscribed by computerized Carl Zeiss Axiovision software (SS64). Medial and intimal areas and intima-to-media (I/M) ratio were calculated, as described (Shawky et al., 2016; Shawky and Segar, 2017), according to the following equations:
2.12. Confocal immunofluorescence analyses of harvested femoral arteries
Immunofluorescence analyses were performed for SM α-actin to confirm the presence of vascular smooth muscle cells in the neointima after arterial injury. The cross sections of femoral artery were incubated with 5% normal goat serum for 1 h. Subsequently, these sections were exposed to the primary antibody for SM α-actin (1:200) overnight at 4 °C in a humidified chamber followed by the secondary antibody (anti-rabbit IgG conjugated to Alexa fluor 594 with red fluorescence). The cross sections were mounted with prolong antifade with DAPI, and the images were captured using confocal microscope.
2.13. Statistical analyses
Values are expressed as means ± S.E.M. Statistical analyses were performed by regular two-way ANOVA followed by Tukey’s multiple comparisons test. Body weight, food and caloric intakes, blood pressure, HR, and IPGTT were compared by repeated measures two-way ANOVA followed by Bonferroni test. Values of P ≤ 0.05 were considered statistically significant. Statistical analyses and AUC calculations were carried out using GraphPad Prism software (GraphPad Software Inc. V6.0f, San Diego, CA, USA).
3. Results
3.1. Imatinib prevents weight gain in HFD-fed mice
Mice at 8 weeks of age were fed a HFD vs a ND for 6 weeks. At 1st, 2nd, and 3rd weeks of diet, there was a progressive increase in body weight by ~16%, 17.7%, and 26.3% (P < 0.05), respectively, in mice fed a HFD compared with ND (Fig. 1A). As shown in Fig. 1A–B, continuation of HFD feeding (with vehicle treatment) for the last three weeks (4th to 6th week) showed a further increase in body weight to a maximum of ~33.6% (P < 0.05) at 6th week of diet, compared with ND-fed mice (with vehicle treatment). Notably, imatinib treatment during the last three weeks of HFD feeding abolished the weight gain seen in mice fed a HFD alone. In parallel, imatinib treatment in ND-fed mice diminished the weight gain seen in mice fed a ND alone.
Fig. 1.

Effects of imatinib on body weight in HFD-fed mice. Eight-week old mice were fed a ND or HFD for 6 weeks (42 days). Imatinib was injected intraperitoneally (25 mg/kg/day) on the day prior to femoral artery injury (day 21) and for 3 weeks post-femoral artery injury (day 22 to day 42). A) Linear graph shows body weights determined once a week for 6 weeks. B) Bar graph shows changes in body weights after imatinib treatment (body weight at the end of 6th week of diet minus body weight before starting imatinib/vehicle treatment). The data shown are means ± S.E.M. (n = 5–6 mice/group). * P < 0.05 compared with ND; # P < 0.05 compared with HFD, using repeated measures two-way ANOVA followed by Bonferroni multiple comparisons test (A) or regular two-way ANOVA followed by Tukey multiple comparisons test (B). ND: normal diet; HFD: high fat diet.
3.2. Imatinib decreases food and energy efficiencies without significant effects on food and caloric intakes in HFD-fed mice
Because HFD-induced obesity in mice is primarily attributed to an increase in feeding/energy efficiency (Surwit et al., 1995), we determined the changes in food and caloric intakes and calculated the changes in feeding and energy efficiencies accordingly. In the present study, HFD-fed mice showed significant decreases in food intakes throughout the experimental period. By calculating caloric intakes, they were found to be significantly higher in HFD-fed mice at 1st, 2nd and 6th week of dietary manipulation by ~55.3%, 20.4%, and 21.9%, respectively, due to the higher number of calories obtained from 1 g of HFD (5.24 kcal) vs 1 g of ND (3 kcal) [Fig. 2A–B]. Changes in feeding and energy efficiencies were calculated during 3 weeks of imatinib treatment (day 21–42), where HFD-fed mice exhibited significant increases in feeding (~4.8-fold) and energy (~2.7-fold) efficiencies, respectively, compared with ND-fed mice (Fig. 2C–D). Imatinib treatment during the last 3 weeks of HFD did not affect food or caloric intakes; however, it completely abolished HFD-induced increases in feeding and energy efficiencies (P < 0.05). Interestingly, imatinib treatment in ND-fed mice resulted in significant decreases in food and caloric intakes at week 5 of dietary manipulation compared with vehicle-treated ND-fed mice (Fig. 2A–B).
Fig. 2.
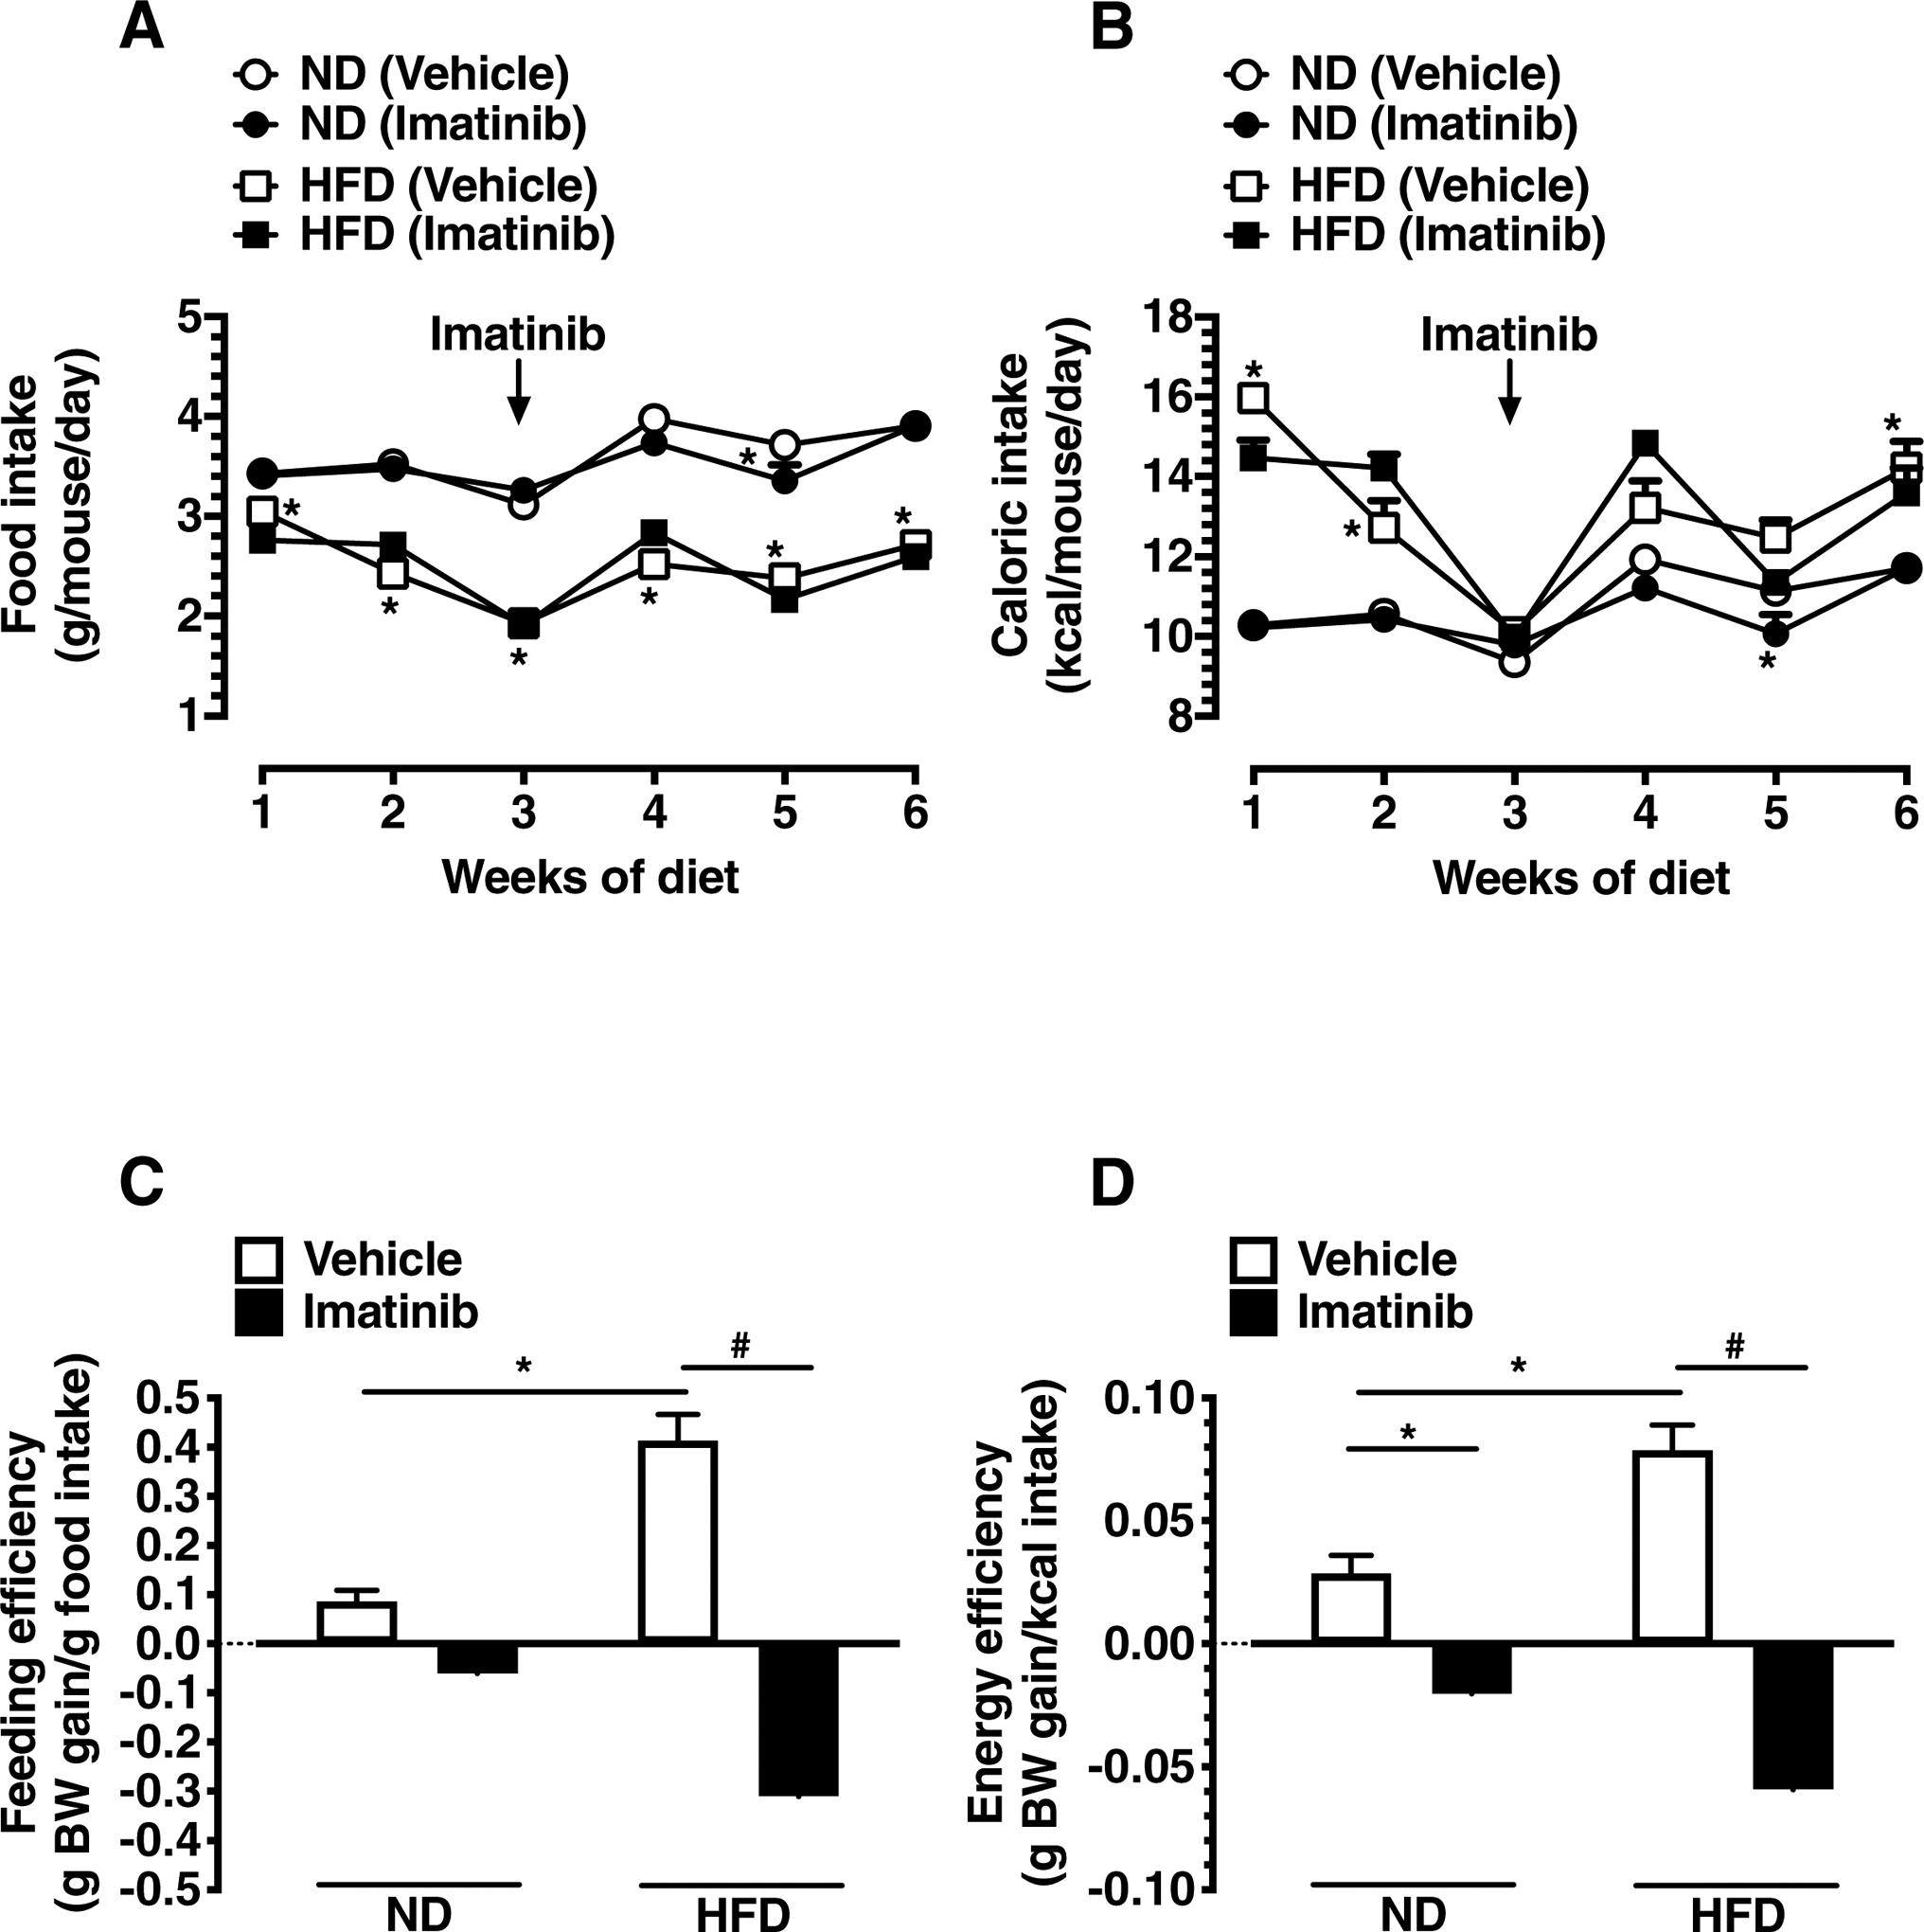
Effects of imatinib on food and caloric intakes, and feeding and energy efficiencies in HFD-fed mice. A) Linear graph shows average daily food intakes in ND- and HFD-fed mice. B) Linear graph shows changes in caloric intakes for 6 weeks. C-D) Bar graphs show changes in feeding and caloric efficiencies after imatinib treatment (day 21–42). The data shown are the means ± S.E.M. (n = 6 mice/group). * P < 0.05 compared with ND; # P < 0.05 compared with HFD, using repeated measures two-way ANOVA followed by Bonferroni multiple comparisons test (A-B) or regular two-way ANOVA followed by Tukey multiple comparisons test (C-D). BW, body weight.
3.3. Imatinib does not affect blood pressure and heart rate in HFD-fed mice
Mice on a HFD for up to three weeks (before the start of imatinib treatment) did not exhibit any significant changes in SBP, DBP, MAP, and HR compared with ND-fed mice (Table 1A). In addition, continuation of HFD with or without imatinib treatment for the following three weeks did not show significant differences in SBP, DBP, MAP, and HR (Table 1B).
Table 1A.
Changes in SBP, DBP, MAP, and HR in ND- and HFD-fed mice measured before the start of imatinib treatment (3rd week of diets).
| ND | HFD | |
|---|---|---|
| n = 12 | n = 12 | |
| SBP (mm Hg) | 139 ± 4 | 136 ± 3 |
| DBP (mm Hg) | 77 ± 5 | 79 ± 5 |
| MAP (mm Hg) | 97 ± 4 | 97 ± 4 |
| HR (beats/min) | 607 ± 14 | 595 ± 13 |
Table 1B.
Changes in SBP, DBP, MAP, and HR in ND- and HFD-fed mice with or without imatinib treatment (6th week of diets).
| ND | HFD | |||
|---|---|---|---|---|
| Vehicle | Imatinib | Vehicle | Imatinib | |
| n = 6 | n = 6 | n = 6 | n = 6 | |
| SBP (mm Hg) | 127 ± 2 | 123 ± 4 | 115 ± 3 | 120 ± 2 |
| DBP (mm Hg) | 81 ± 9 | 64 ± 8 | 76 ± 10 | 88 ± 5 |
| MAP (mm Hg) | 96 ± 7 | 85 ± 6 | 89 ± 7 | 98 ± 4 |
| HR (beats/min) | 660 ± 21 | 651 ± 27 | 674 ± 46 | 670 ± 15 |
SBP, DBP, MAP, and HR were determined using tail-cuff method in all mice under conscious conditions. The data shown are the means ± S.E.M. None of the observed changes was statistically significant. ND, normal diet; HFD, high fat diet; SBP, systolic blood pressure; DBP, diastolic blood pressure; MAP, mean arterial pressure; HR, heart rate.
3.4. Imatinib improves impaired glucose tolerance and lowers fasting hyperglycemia in HFD-fed mice
To evaluate the effects of imatinib treatment on HFD-induced glucose intolerance, IPGTT was performed at the 6th week time point (day 41). In mice fed a HFD alone, IPGTT revealed significant increases in blood glucose levels at 30, 60 and 120 min time points, compared with ND-fed mice (Fig. 3A). Calculation of AUC revealed a significant increase by ~1.8-fold in HFD-fed mice, compared with ND-fed mice. Imatinib treatment during the last three weeks of HFD feeding completely abolished HFD-induced increase in AUCIPGTT (Fig. 3A–B).
Fig. 3.

Effects of imatinib on glucose tolerance in HFD-fed mice. A) Linear graph shows changes in blood glucose levels during IPGTT. IPGTT was performed in mice on day 41 by injecting fresh glucose solution (2 g/kg) and determining blood glucose at the indicated time points. B) Bar graph shows changes in AUCIPGTT. The data shown are the means ± S.E.M. (n = 6 mice/group). * P < 0.05 compared with ND; # P < 0.05 compared with HFD, using repeated measures two-way ANOVA followed by Bonferroni multiple comparisons test (A) or regular two-way ANOVA followed by Tukey multiple comparisons test (B). IPGTT: intraperitoneal glucose tolerance test; AUC: area under the curve.
At the start of the experiment, fasting blood glucose levels were 107.3 ± 1.8 mg/dl in all mice (n = 24). At the 3rd week time point (day 20), fasting blood glucose levels measured before imatinib treatment were ~1.4-fold higher in HFD-mice compared with ND-fed mice (147 ± 9 versus 102 ± 4 mg/dl; P < 0.05). At the 6th week time point (day 42), fasting blood glucose levels were ~1.3-fold higher in HFD-mice compared with ND-fed mice (128 ± 5 versus 102 ± 5 mg/dl; P < 0.05). Imatinib treatment during the last three weeks of HFD feeding completely abolished HFD-induced increase in fasting blood glucose (Table 2).
Table 2.
Changes in systemic parameters and eWAT weight in ND- and HFD-fed mice with or without imatinib treatment.
| ND | HFD | |||
|---|---|---|---|---|
| Vehicle | Imatinib | Vehicle | Imatinib | |
| Blood glucose (mg/dl) | 102 ± 5 | 97 ± 4 | 128 ± 5a | 82 ± 2b |
| Plasma insulin (μg/l) | 0.29 ± 0.05 | 0.57 ± 0.11 | 0.92 ± 0.19 | 0.47 ± 0.27 |
| HOMA-IR index | 1.50 ± 0.27 | 2.89 ± 0.49 | 6.62 ± 1.30a | 2.08 ± 1.15b |
| Plasma TC (mg/dl) | 78.75 ± 3.90 | 73.00 ± 4.20 | 118.50 ± 2.99a | 89.50 ± 8.15b |
| Plasma HDL-C (mg/dl) | 49.75 ± 5.32 | 46.40 ± 5.33 | 37.50 ± 1.94 | 49.20 ± 3.09 |
| Plasma TGs (mg/dl) | 37.50 ± 0.96 | 47.50 ± 4.84 | 69.20 ± 5.01a | 50.25 ± 1.84b |
| Plasma total adiponectin (μg/ml) | 19.95 ± 0.56 | 21.53 ± 0.92 | 18.17 ± 1.41 | 19.68 ± 0.52 |
| Plasma HMW adiponectin (μg/ml) | 2.45 ± 0.32 | 1.82 ± 0.37 | 1.95 ± 0.49 | 3.80 ± 0.47b |
| eWAT weight (g) | 0.23 ± 0.01 | 0.25 ± 0.01 | 1.82 ± 0.13a | 1.00 ± 0.13b |
The systemic parameters were determined using blood samples collected on day 42 (day of sacrifice). HOMA-IR index was calculated using the formula, as described in ‘Materials and methods’. The data shown are the means ± S.E.M. (n = 4–7 mice/group).
P < 0.05 compared with vehicle-treated ND-fed mice;
P < 0.05 compared with vehicle-treated HFD-fed mice, using regular two-way ANOVA followed by Tukey multiple comparisons test. ND, normal diet; HFD, high fat diet; HOMA-IR, homeostasis model assessment of insulin resistance; TC, total cholesterol; HDL-C, high-density lipoprotein cholesterol; TGs, triglycerides; HMW, high molecular weight; eWAT, epidydimal white adipose tissue.
3.5. Imatinib improves insulin resistance in HFD-fed mice
The effects of HFD on fasting plasma insulin levels and HOMA-IR (an index of insulin resistance) were also determined, as shown in Table 2. At the 6th week time point (day 42), fasting plasma insulin level was ~3.2-fold higher in HFD-fed mice compared with ND-fed mice (0.92 ± 0.19 versus 0.29 ± 0.05 μg/L; non-significant). In addition, induction of insulin resistance was observed by ~4.4-fold increase in HOMA-IR index in HFD-fed mice compared with ND-fed mice (6.62 ± 1.3 versus 1.5 ± 0.27; P < 0.05). Importantly, imatinib treatment prevented the development of insulin resistance in HFD-fed mice. Together, these findings suggest that imatinib-mediated improvement in glycemic control results from improved insulin sensitivity.
3.6. Imatinib decreases plasma levels of total cholesterol and triglycerides in HFD-fed mice
As shown in Table 2, mice on a HFD for 6 weeks displayed significant increases in the fasting levels of plasma total cholesterol (by ~1.5-fold) and triglycerides (by 1.8-fold). Although there was a decrease in HDL-cholesterol (by ~24.6%), it was not statistically significant. Imatinib treatment during the last 3 weeks of HFD resulted in significant decreases in HFD-induced increases in plasma total cholesterol and triglycerides by ~73% and 59.5%, respectively. However, imatinib treatment resulted in no significant changes in plasma HDL-cholesterol.
3.7. Imatinib increases plasma levels of HMW adiponectin in HFD-fed mice
Mice on a HFD for 6 weeks showed a non-significant decrease in HMW adiponectin by ~20.5% compared with ND-fed mice. Imatinib treatment during the last 3 weeks of HFD resulted in a significant increase in HMW adiponectin (~1.95-fold), compared with HFD-fed mice (Table 2). The changes observed in total adiponectin levels upon HFD feeding or imatinib treatment were non-significant.
3.8. Imatinib decreases eWAT weight in HFD-fed mice
As shown in Table 2, mice on a HFD for 6 weeks displayed ~7.8-fold increase in epididymal white adipose tissue (eWAT) weight compared with ND-fed mice (1.82 ± 0.13 versus 0.23 ± 0.01 g; P < 0.05). Imatinib treatment during the last 3 weeks of HFD resulted in a significant decrease in HFD-induced increase in eWAT weight by 51.4% (P < 0.05). In parallel, imatinib treatment in ND-fed mice did not result in significant changes in eWAT weight. These findings suggest that imatinib-induced decrease in body weight gain in HFD-fed mice may, in part, be due to decreased visceral adiposity.
3. 9. Imatinib suppresses neointimal hyperplasia after femoral artery injury in HFD-fed mice
The extent to which imatinib prevents neointimal hyperplasia after arterial injury remains unclear, especially in insulin-resistant state without the frank development of diabetes. In the present study using HFD mice, there was a modest increase in injury-induced neointimal hyperplasia (by ~1.3-fold, P = 0.28) compared with ND-fed mice (Fig. 4A–D). Imatinib treatment for ~3 weeks in HFD-fed and ND-fed mice resulted in significant inhibition of injury-induced neointimal hyperplasia by 68.8% and 63.4%, respectively. Similarly, intima-to-media ratios were diminished by imatinib in HFD- and ND-fed mice by 78.4% and 77.7%, respectively. Lumen area was significantly increased by imatinib in HFD-fed mice (0.034 mm2 in imatinib-treated vs 0.004 mm2 in vehicle-treated) and in ND-fed mice (0.037 mm2 in imatinib-treated vs 0.01 mm2 in vehicle-treated). Area of the medial layer was not statistically significant (data not shown).
Fig. 4.


Effects of imatinib on injury-induced neointimal hyperplasia in HFD-fed mice. Imatinib was administered intraperitoneally (25 mg/kg/day) on the day prior to femoral artery injury and for 3 weeks post-femoral artery injury. Subsequently, uninjured and injured femoral artery segments from ND-fed mice and HFD-fed mice (− or + imatinib treatment) were subjected to staining procedures for: A) H&E and B) EVG, as described in ‘Materials and methods’. The arrowheads indicate internal and external elastic laminae; scale bars represent 20 μm; magnification. C-D) Morphometric analyses of injured femoral arteries that include neointima/media ratio and neointimal area. The data shown are the means ± S.E.M. (n = 6–9 mice/group). * P < 0.05 compared with ND; # P < 0.05 compared with HFD; using regular two-way ANOVA followed by Tukey multiple comparisons test.
3. 10. Imatinib diminishes neointimal hyperplasia as revealed by SM a-actin immunoreactivity
Confocal immunofluorescence analysis using the primary antibody for SM α-actin (Fig. 5) showed the presence of VSMCs in the medial layer of uninjured arteries of HFD and ND-fed mice (red fluorescence; upper-left panels). Neointima formation in the injured arteries of HFD and ND-fed mice 3 weeks after arterial injury was primarily due to enhanced VSMC growth, as is evident from immunoreactivity to SM α-actin and narrowed lumen area (red fluorescence; upper-middle panels). Imatinib treatment, starting one day before arterial injury and continuing for the next 3 weeks, in HFD and ND-fed mice resulted in a significant decrease in neointimal area and widened lumen as shown (red fluorescence; upper-right panels).
Fig. 5.
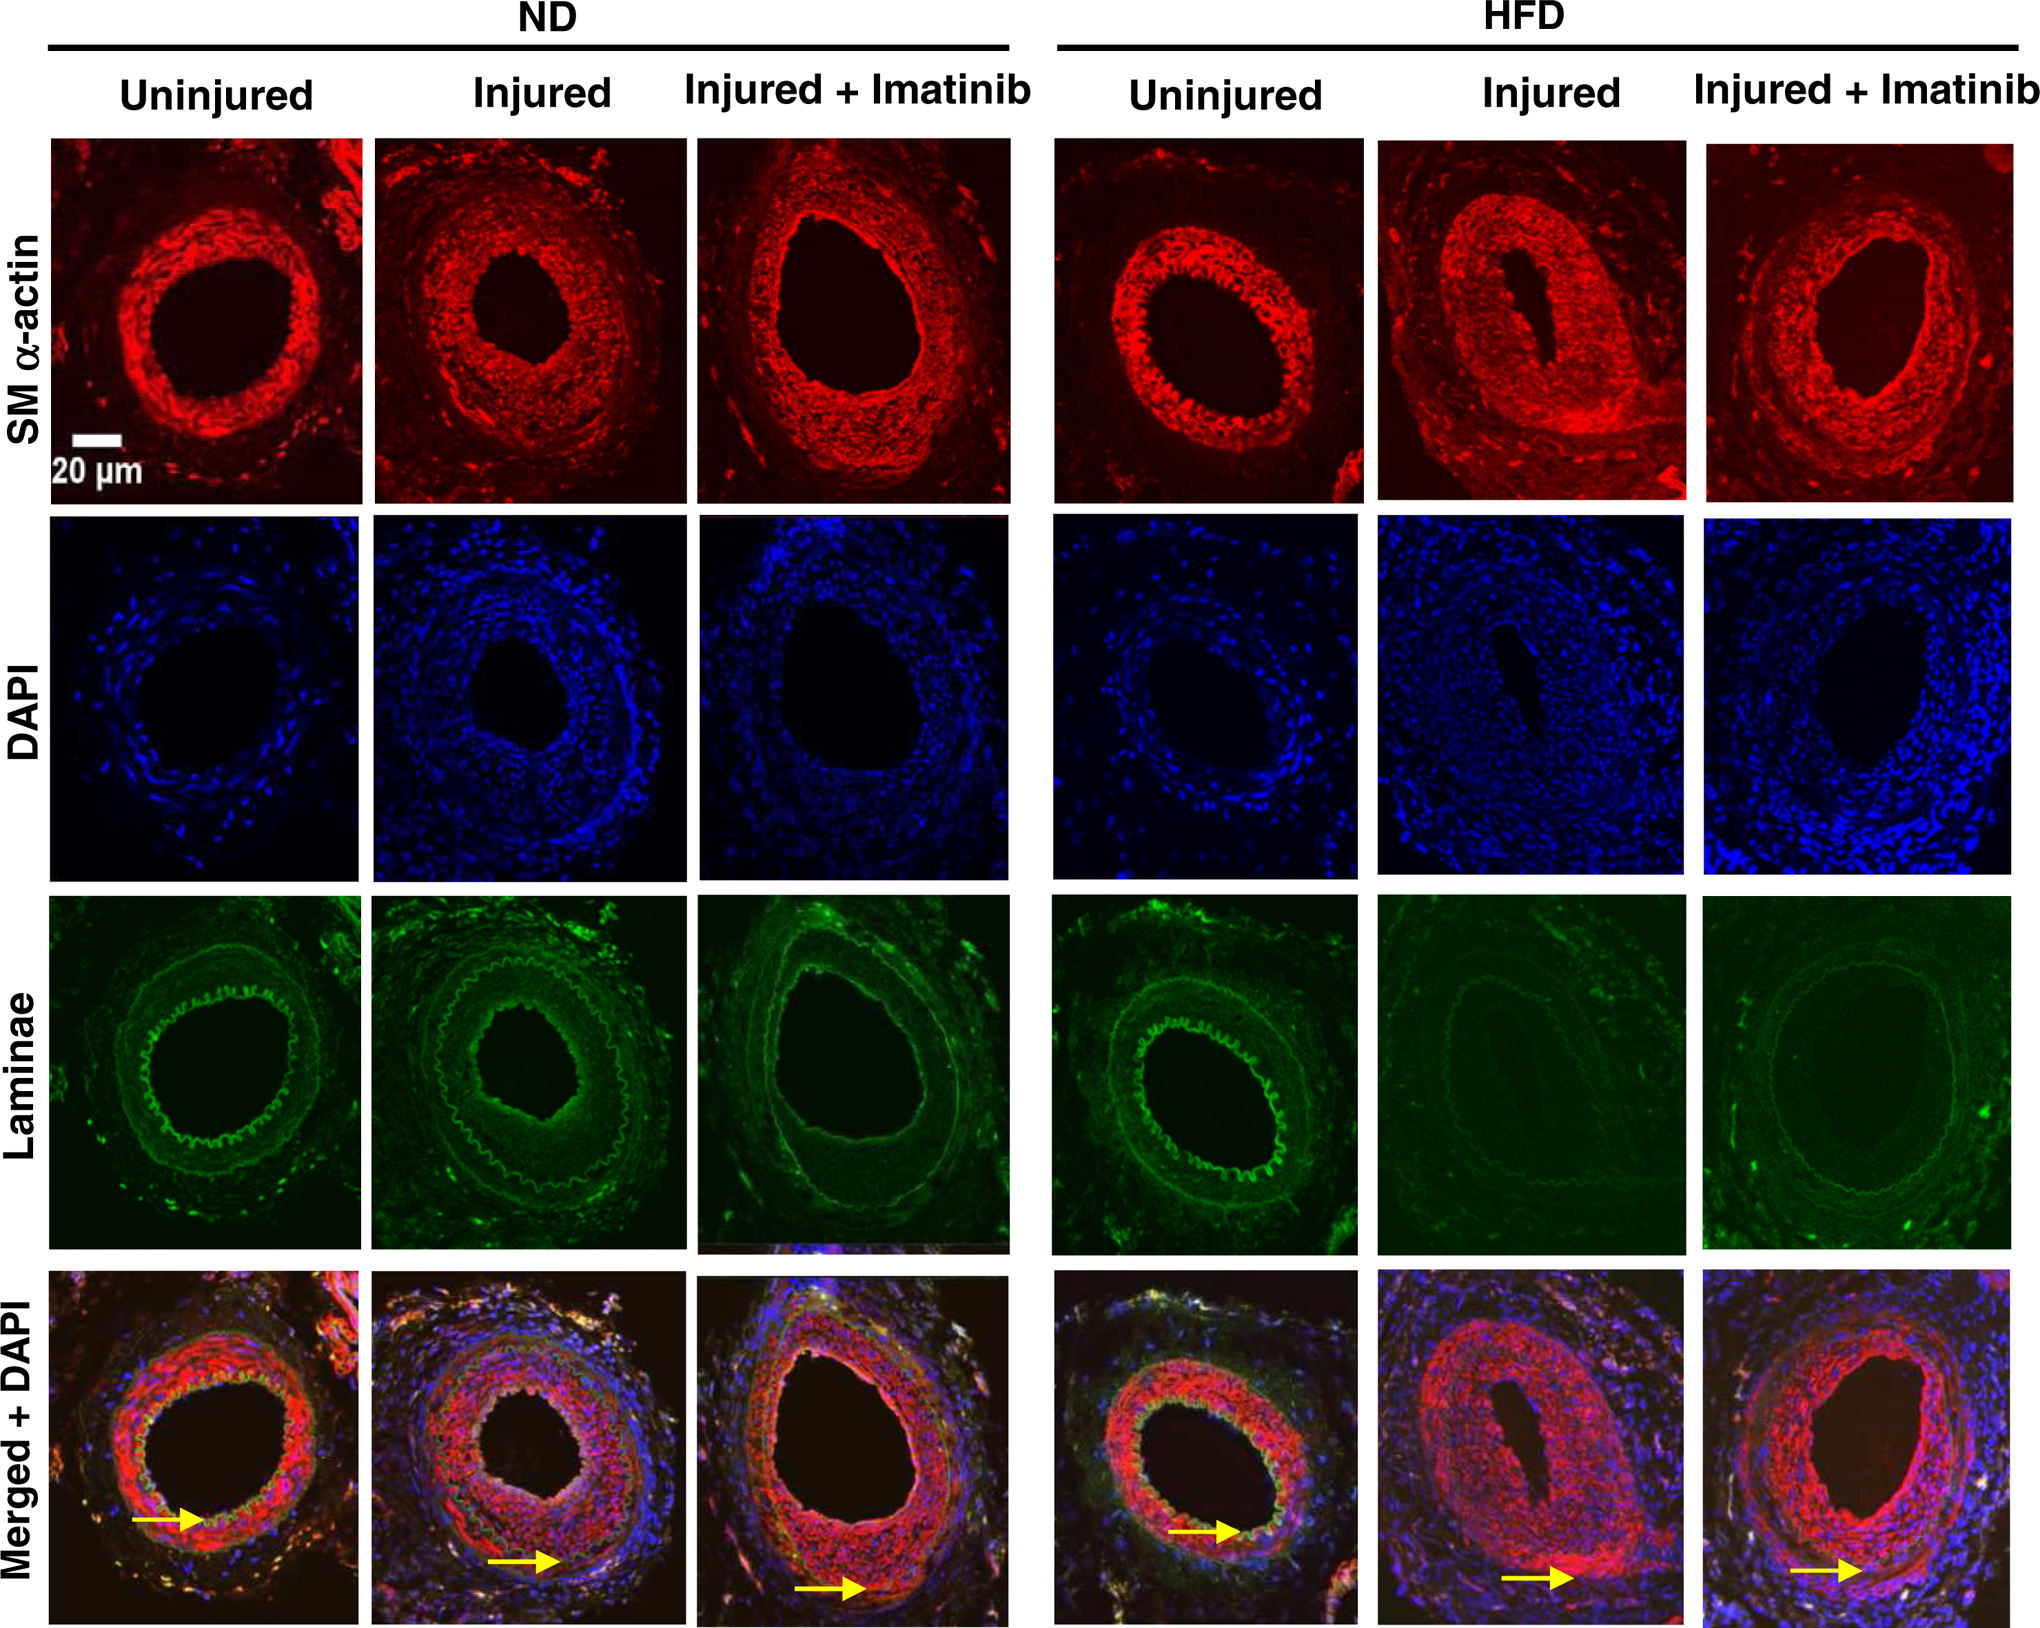
Effects of imatinib on injury-induced neointimal hyperplasia as revealed by SM α-actin immunoreactivity. Confocal immunofluorescence analysis of SM α-actin in femoral artery sections: uninjured, left panel; injured, middle panel; and injured + imatinib, right panel. The representative images for SM α-actin immunoreactivity (red) are shown along with nuclei staining (DAPI, blue), elastin autofluorescence (laminae, green), and merged images. The arrowheads indicate internal and external elastic laminae; scale bars represent 20 μm. The images shown are representative of arterial injury from 3 mice/group.
4. Discussion
The present study demonstrates that in HFD-fed mice, guidewire-induced injury in the femoral artery results in enhanced neointimal hyperplasia by ~30% compared with normal diet-fed mice (Fig. 4A–D). This increase in neointimal hyperplasia is due to increased proliferation of VSMCs, as revealed by SM α-actin immunoreactivity (Fig. 5). Treatment of HFD-fed mice with imatinib, a PDGF receptor tyrosine kinase inhibitor, for ~3 weeks led to a marked attenuation of injury-induced neointimal hyperplasia by ~69% compared with vehicle-treated HFD-fed mice (Figs. 4 and 5). In addition to inhibiting injury-induced neointimal hyperplasia, imatinib treatment in HFD-fed mice resulted in significant improvements in key metabolic parameters including insulin resistance (HOMA-IR index, Table 2), glucose tolerance (AUCIPGTT, Fig. 3A–B), and plasma total cholesterol and triglycerides (Table 2). Furthermore, imatinib treatment decreased visceral fat accumulation (as determined by epididymal white adipose tissue weight, and enhanced plasma levels of high-molecular-weight adiponectin without affecting total adiponectin (Table 2). However, there were no significant changes in mean arterial pressure in insulin-resistant state or after imatinib exposure, as measured by tail-cuff method (Table 1). Together, the present findings reveal that imatinib inhibition of PDGF receptor tyrosine kinase can suppress injury-induced neointimal hyperplasia in the setting of insulin resistance and associated metabolic changes without frank diabetes.
Previously, we and several other investigators have shown that PDGF receptor tyrosine kinase activation by PDGF-BB results in enhanced VSMC proliferation. In particular, PDGF-induced VSMC proliferation is mediated by activation of key signaling components including PI 3-kinase/Akt, mTOR/p70S6kinase, and Ras/Raf/MEK1/ERK1/2 (Auger et al., 1989; Marshall, 1995; Bourbon et al., 2002; Zhao et al., 2011). Importantly, PDGF-induced phosphorylation of Akt and p70S6kinase facilitates IRS-1 serine phosphorylation and IRS-2 downregulation, which in turn results in the attenuation of insulin-induced IRS-1/IRS-2-associated PI 3-kinase activity in VSMCs (Zhao et al., 2011). In conjunction with our key findings that enhanced VSMC proliferation is coupled to impaired insulin receptor signaling (Zhao et al., 2011), studies by several investigators have shown that loss of insulin receptor signaling or downregulation of IRS-1 in VSMCs results in enhanced VSMC proliferation (Lightell et al., 2011; Xi et al., 2017). With regard to imatinib, we and several other investigators have shown that it diminishes VSMC proliferation by inhibiting PDGF receptor tyrosine phosphorylation and its downstream signaling components such as Akt, p70S6kinase, and ERK1/2 (Boucher et al., 2003; Lassila et al., 2004; Zhao et al., 2011). In addition to inhibiting PDGF-induced VSMC proliferation, imatinib prevents PDGF-mediated disruption of insulin receptor signaling in VSMCs, as evidenced in our previous study (Zhao et al., 2011). In the present study, imatinib treatment attenuates neointimal hyperplasia after arterial injury and improves insulin resistance in HFD-fed mice. Together, imatinib treatment has the potential to suppress injury-induced neointimal hyperplasia by inhibiting PDGF-induced VSMC proliferation at the lesion site, while improving systemic insulin resistance and VSMC-specific insulin receptor signaling.
It is noteworthy that PDGF-A and PDGF-B ligands exist in the form of homodimers or heterodimers (PDGF-AA, PDGF-BB, and PDGF-AB), which can bind to PDGFR subtypes (PDGFR-α and/or PDGFR-β) thereby facilitating their dimerization to PDGFR-αα, PDGFR-ββ or PDGFR-αβ (Heldin and Westermark, 1999). A recent study by several investigators has shown that in obese individuals, overexpression of PDGF-A in the liver (due to hypomethylation in PDGFA gene) increases the risk of insulin resistance, hyperinsulinemia, and type 2 diabetes (Abderrahmani et al., 2018). Importantly, increased PDGF-A receptor signaling in human hepatocytes enhances protein kinase C activation, which in turn contributes to insulin resistance by downregulating the expression levels of IRS-1 and insulin receptor (Abderrahmani et al., 2018). In type 2 diabetic db/db obese mice challenged with acute insulin, imatinib treatment restores the decreases in IRS-1 tyrosine phosphorylation and Akt phosphorylation in the liver and adipose tissues, suggesting that PDGF receptor tyrosine kinase inhibition improves insulin receptor signaling in hepatic and adipose tissues (Han et al., 2009). In addition, in HFD-fed rats, imatinib treatment improves insulin sensitivity and whole-body glucose disposal rates (Hagerkvist et al., 2008). In a different study that utilizes obese mice, loss of PGDF-B receptor signaling enhances hepatic insulin delivery and insulin receptor signaling thereby diminishing hepatic glucose output, which contributes in part to the maintenance of blood glucose homeostasis (Raines et al., 2011). In conjunction with the aforementioned findings by several investigators, imatinib treatment for ~3 weeks in the present study has the potential to inhibit PDGF receptor(s) signaling in the liver, thereby enhancing hepatic insulin action to diminish glucose spillover into the systemic circulation to improve glycemic control. This may in part explain the normalization of fasting blood glucose level and improved glucose tolerance seen in imatinib-treated HFD-fed mice (Table 2 and Fig. 3B). The diminution in insulin secretion by pancreatic β-cells (due to decreased glucose-stimulated insulin secretion; GSIS) may be accountable for the lowering of plasma insulin in imatinib-treated HFD-fed mice, compared with HFD-fed mice (Table 2). The improvement in insulin resistance by imatinib is further supported by the present observations of complete inhibition of HFD-induced increase in HOMA-IR index.
Although insulin resistance is closely correlated with hypoadiponectinemia (Hotta et al., 2001; Weyer et al., 2001), there were no significant changes in the plasma levels of total and high-molecular-weight adiponectin in HFD-fed mice (Table 2). However, imatinib treatment in HFD-fed mice led to a significant increase in the plasma levels of high-molecular-weight adiponectin. A recent study has shown that in HFD-fed mice, imatinib treatment improves insulin sensitivity and glucose tolerance and enhances adiponectin expression in white adipose tissue (Choi et al., 2016). It is likely that imatinib-induced increase in adiponectin expression in differentiated adipocytes results in elevated levels of circulating high-molecular-weight adiponectin. Elevated adiponectin by imatinib has the potential to improve insulin sensitivity in obesity, and this may be attributed to the ability of adiponectin to suppress endoplasmic reticulum stress and low-grade inflammation in adipose tissue (Han et al., 2009; Ruderman et al., 2013; Kim et al., 2017). Notably, in subjects with chronic myeloid leukemia, imatinib treatment for three months results in improved insulin sensitivity and elevated plasma levels of high-molecular-weight- and low-molecular-weight forms of adiponectin by ~3-fold (Fitter et al., 2010). Subsequent studies by Fitter et al. have shown that therapeutically-relevant concentrations of imatinib inhibit PDGF-induced PI 3-kinase activity to promote human mesenchymal stromal cell differentiation into adipocytes, which in turn contributes to increased secretion of high-molecular-weight adiponectin (Fitter et al., 2012). In addition to its insulin-sensitizing effects (Yamauchi et al., 2002), adiponectin is known to inhibit VSMC proliferation in vitro and intimal hyperplasia in different animal models (Matsuda et al., 2002; Okamoto et al., 2002). In our recent study, we have shown that AdipoRon, an adiponectin receptor agonist, inhibits injury-induced neointimal hyperplasia in mouse femoral artery (Fairaq et al., 2017). Thus, imatinib-mediated increase in plasma adiponectin may contribute in part to the suppression of neointimal hyperplasia in the present study.
In conclusion, imatinib treatment has the potential to target PDGF receptor tyrosine kinase in the vessel wall and in hepatic tissue to attenuate injury-induced neointimal hyperplasia and improve insulin resistance, respectively. Importantly, imatinib inhibition of PDGF receptor signaling in the injured vessel would prevent VSMC proliferation (Zhao et al., 2011), a key event in restenosis after angioplasty. In addition, imatinib inhibition of PDGF receptor signaling in the liver would enhance hepatic insulin receptor signaling to inhibit hepatic glucose output (Raines et al., 2011; Abderrahmani et al., 2018), a key metabolic event in improving insulin resistance. The contribution to improved insulin resistance by imatinib is further supported by the present observations of elevated plasma high-molecular-weight adiponectin, an adipocyte-derived protein with insulin-sensitizing effects. Thus, imatinib may provide a realistic treatment option to prevent injury-induced neointimal hyperplasia and diet-induced insulin resistance in obesity.
Acknowledgements
This work was supported by the National Heart, Lung, and Blood Institute/National Institutes of Health Grant (R01-HL-097090).
Footnotes
Publisher's Disclaimer: This is a PDF file of an unedited manuscript that has been accepted for publication. As a service to our customers we are providing this early version of the manuscript. The manuscript will undergo copyediting, typesetting, and review of the resulting proof before it is published in its final form. Please note that during the production process errors may be discovered which could affect the content, and all legal disclaimers that apply to the journal pertain.
Declaration of competing interest
The authors declare no conflict of interests.
References
- Abderrahmani A, Yengo L, Caiazzo R, Canouil M, Cauchi S, Raverdy V, Plaisance V, Pawlowski V, Lobbens S, Maillet J, Rolland L, Boutry R, Queniat G, Kwapich M, Tenenbaum M, Bricambert J, Saussenthaler S, Anthony E, Jha P, Derop J, Sand O, Rabearivelo I, Leloire A, Pigeyre M, Daujat-Chavanieu M, Gerbal-Chaloin S, Dayeh T, Lassailly G, Mathurin P, Staels B, Auwerx J, Schurmann A, Postic C, Schafmayer C, Hampe J, Bonnefond A, Pattou F, Froguel P, 2018. Increased Hepatic PDGF-AA Signaling Mediates Liver Insulin Resistance in Obesity-Associated Type 2 Diabetes. Diabetes 67, 1310–1321. [DOI] [PubMed] [Google Scholar]
- Auger KR, Serunian LA, Soltoff SP, Libby P, Cantley LC, 1989. PDGF-dependent tyrosine phosphorylation stimulates production of novel polyphosphoinositides in intact cells. Cell 57, 167–175. [DOI] [PubMed] [Google Scholar]
- Baroni MG, D’Andrea MP, Montali A, Pannitteri G, Barilla F, Campagna F, Mazzei E, Lovari S, Seccareccia F, Campa PP, Ricci G, Pozzilli P, Urbinati G, Arca M, 1999. A common mutation of the insulin receptor substrate-1 gene is a risk factor for coronary artery disease. Arterioscler. Thromb. Vasc. Biol 19, 2975–2980. [DOI] [PubMed] [Google Scholar]
- Barrett TB, Benditt EP, 1987. sis (platelet-derived growth factor B chain) gene transcript levels are elevated in human atherosclerotic lesions compared to normal artery. Proc. Natl. Acad. Sci. USA 84, 1099–1103. [DOI] [PMC free article] [PubMed] [Google Scholar]
- Boucher P, Gotthardt M, Li WP, Anderson RG, Herz J, 2003. LRP: role in vascular wall integrity and protection from atherosclerosis. Science 300, 329–332. [DOI] [PubMed] [Google Scholar]
- Bourbon NA, Sandirasegarane L, Kester M, 2002. Ceramide-induced inhibition of Akt is mediated through protein kinase Czeta: implications for growth arrest. J. Biol. Chem 277, 3286–3292. [DOI] [PubMed] [Google Scholar]
- Choi KM, Lee YS, Kim W, Kim SJ, Shin KO, Yu JY, Lee MK, Lee YM, Hong JT, Yun YP, Yoo HS, 2014. Sulforaphane attenuates obesity by inhibiting adipogenesis and activating the AMPK pathway in obese mice. J. Nutr. Biochem 25, 201–207. [DOI] [PubMed] [Google Scholar]
- Choi SS, Kim ES, Jung JE, Marciano DP, Jo A, Koo JY, Choi SY, Yang YR, Jang HJ, Kim EK, Park J, Kwon HM, Lee IH, Park SB, Myung KJ, Suh PG, Griffin PR, Choi JH, 2016. PPARgamma Antagonist Gleevec Improves Insulin Sensitivity and Promotes the Browning of White Adipose Tissue. Diabetes 65, 829–839. [DOI] [PMC free article] [PubMed] [Google Scholar]
- Cizek SM, Bedri S, Talusan P, Silva N, Lee H, Stone JR, 2007. Risk factors for atherosclerosis and the development of preatherosclerotic intimal hyperplasia. Cardiovasc. Pathol 16, 344–350. [DOI] [PMC free article] [PubMed] [Google Scholar]
- Delafontaine P, 2000. IRS-1 variant: A new risk factor for coronary artery disease? Arterioscler. Thromb. Vasc. Biol 20, 283–284. [DOI] [PubMed] [Google Scholar]
- Fairaq A, Shawky NM, Osman I, Pichavaram P, Segar L, 2017. AdipoRon, an adiponectin receptor agonist, attenuates PDGF-induced VSMC proliferation through inhibition of mTOR signaling independent of AMPK: implications toward suppression of neointimal hyperplasia. Pharmacol. Res 119, 289–302. [DOI] [PMC free article] [PubMed] [Google Scholar]
- Fitter S, Vandyke K, Gronthos S, Zannettino AC, 2012. Suppression of PDGF-induced PI3 kinase activity by imatinib promotes adipogenesis and adiponectin secretion. J. Mol. Endocrinol 48, 229–240. [DOI] [PubMed] [Google Scholar]
- Fitter S, Vandyke K, Schultz CG, White D, Hughes TP, Zannettino AC, 2010. Plasma adiponectin levels are markedly elevated in imatinib-treated chronic myeloid leukemia (CML) patients: a mechanism for improved insulin sensitivity in type 2 diabetic CML patients? J. Clin. Endocrinol. Metab 95, 3763–3767. [DOI] [PubMed] [Google Scholar]
- Fjaere E, Aune UL, Roen K, Keenan AH, Ma T, Borkowski K, Kristensen DM, Novotny GW, Mandrup-Poulsen T, Hudson BD, Milligan G, Xi Y, Newman JW, Haj FG, Liaset B, Kristiansen K, Madsen L, 2014. Indomethacin treatment prevents high fat diet-induced obesity and insulin resistance but not glucose intolerance in C57BL/6J mice. J. Biol. Chem 289, 16032–16045. [DOI] [PMC free article] [PubMed] [Google Scholar]
- Hagerkvist R, Jansson L, Welsh N, 2008. Imatinib mesylate improves insulin sensitivity and glucose disposal rates in rats fed a high-fat diet. Clin. Sci. (Lond) 114, 65–71. [DOI] [PubMed] [Google Scholar]
- Han MS, Chung KW, Cheon HG, Rhee SD, Yoon CH, Lee MK, Kim KW, Lee MS, 2009. Imatinib mesylate reduces endoplasmic reticulum stress and induces remission of diabetes in db/db mice. Diabetes 58, 329–336. [DOI] [PMC free article] [PubMed] [Google Scholar]
- Heldin CH, Westermark B, 1999. Mechanism of action and in vivo role of platelet-derived growth factor. Physiol. Rev 79, 1283–1316. [DOI] [PubMed] [Google Scholar]
- Hotta K, Funahashi T, Bodkin NL, Ortmeyer HK, Arita Y, Hansen BC, Matsuzawa Y, 2001. Circulating concentrations of the adipocyte protein adiponectin are decreased in parallel with reduced insulin sensitivity during the progression to type 2 diabetes in rhesus monkeys. Diabetes 50, 1126–1133. [DOI] [PubMed] [Google Scholar]
- Ishizaka N, Ishizaka Y, Takahashi E, Unuma T, Tooda E, Nagai R, Togo M, Tsukamoto K, Hashimoto H, Yamakado M, 2003. Association between insulin resistance and carotid arteriosclerosis in subjects with normal fasting glucose and normal glucose tolerance. Arterioscler. Thromb. Vasc. Biol 23, 295–301. [DOI] [PubMed] [Google Scholar]
- Kim B, Kim MS, Hyun CK, 2017. Syringin attenuates insulin resistance via adiponectin-mediated suppression of low-grade chronic inflammation and ER stress in high-fat diet-fed mice. Biochem. Biophys. Res. Commun 488, 40–45. [DOI] [PubMed] [Google Scholar]
- Kimura S, Egashira K, Nakano K, Iwata E, Miyagawa M, Tsujimoto H, Hara K, Kawashima Y, Tominaga R, Sunagawa K, 2008. Local delivery of imatinib mesylate (STI571)-incorporated nanoparticle ex vivo suppresses vein graft neointima formation. Circulation 118, S65–70. [DOI] [PubMed] [Google Scholar]
- Komatsu T, Yaguchi I, Komatsu S, Nakahara S, Kobayashi S, Sakai Y, Taguchi I, 2015. Impact of Insulin Resistance on Neointimal Tissue Proliferation after 2nd-Generation Drug-Eluting Stent Implantation. Texas Heart Institute Journal 42, 327–332. [DOI] [PMC free article] [PubMed] [Google Scholar]
- Laakso M, Sarlund H, Salonen R, Suhonen M, Pyorala K, Salonen JT, Karhapaa P, 1991. Asymptomatic atherosclerosis and insulin resistance. Arteriosclerosis and Thrombosis 11, 1068–1076. [DOI] [PubMed] [Google Scholar]
- Lassila M, Allen TJ, Cao Z, Thallas V, Jandeleit-Dahm KA, Candido R, Cooper ME, 2004. Imatinib attenuates diabetes-associated atherosclerosis. Arterioscler. Thromb. Vasc. Biol 24, 935–942. [DOI] [PubMed] [Google Scholar]
- Lightell DJ Jr., Moss SC, Woods TC, 2011. Loss of canonical insulin signaling accelerates vascular smooth muscle cell proliferation and migration through changes in p27Kip1 regulation. Endocrinology 152, 651–658. [DOI] [PMC free article] [PubMed] [Google Scholar]
- Makiyama Y, Toba K, Kato K, Hirono S, Ozawa T, Saigawa T, Minagawa S, Isoda M, Asami F, Ikarashi N, Oda M, Moriyama M, Higashimura M, Kitajima T, Otaki K, Aizawa Y, 2008. Imatinib mesilate inhibits neointimal hyperplasia via growth inhibition of vascular smooth muscle cells in a rat model of balloon injury. Tohoku. J. Exp. Med 215, 299–306. [DOI] [PubMed] [Google Scholar]
- Marshall CJ, 1995. Specificity of receptor tyrosine kinase signaling: transient versus sustained extracellular signal-regulated kinase activation. Cell 80, 179–185. [DOI] [PubMed] [Google Scholar]
- Masuda S, Nakano K, Funakoshi K, Zhao G, Meng W, Kimura S, Matoba T, Miyagawa M, Iwata E, Sunagawa K, Egashira K, 2011. Imatinib mesylate-incorporated nanoparticle-eluting stent attenuates in-stent neointimal formation in porcine coronary arteries. J. Atheroscler. Thromb 18, 1043–1053. [DOI] [PubMed] [Google Scholar]
- Matsuda M, Shimomura I, Sata M, Arita Y, Nishida M, Maeda N, Kumada M, Okamoto Y, Nagaretani H, Nishizawa H, Kishida K, Komuro R, Ouchi N, Kihara S, Nagai R, Funahashi T, Matsuzawa Y, 2002. Role of adiponectin in preventing vascular stenosis. The missing link of adipo-vascular axis. J. Biol. Chem 277, 37487–37491. [DOI] [PubMed] [Google Scholar]
- Matthews DR, Hosker JP, Rudenski AS, Naylor BA, Treacher DF, Turner RC, 1985. Homeostasis model assessment: insulin resistance and beta-cell function from fasting plasma glucose and insulin concentrations in man. Diabetologia 28, 412–419. [DOI] [PubMed] [Google Scholar]
- Okamoto Y, Kihara S, Ouchi N, Nishida M, Arita Y, Kumada M, Ohashi K, Sakai N, Shimomura I, Kobayashi H, Terasaka N, Inaba T, Funahashi T, Matsuzawa Y, 2002. Adiponectin reduces atherosclerosis in apolipoprotein E-deficient mice. Circulation 106, 2767–2770. [DOI] [PubMed] [Google Scholar]
- Owens GK, Kumar MS, Wamhoff BR, 2004. Molecular regulation of vascular smooth muscle cell differentiation in development and disease. Physiol. Rev 84, 767–801. [DOI] [PubMed] [Google Scholar]
- Piatti P, Di Mario C, Monti LD, Fragasso G, Sgura F, Caumo A, Setola E, Lucotti P, Galluccio E, Ronchi C, Origgi A, Zavaroni I, Margonato A, Colombo A, 2003. Association of insulin resistance, hyperleptinemia, and impaired nitric oxide release with in-stent restenosis in patients undergoing coronary stenting. Circulation 108, 2074–2081. [DOI] [PubMed] [Google Scholar]
- Raines SM, Richards OC, Schneider LR, Schueler KL, Rabaglia ME, Oler AT, Stapleton DS, Genove G, Dawson JA, Betsholtz C, Attie AD, 2011. Loss of PDGF-B activity increases hepatic vascular permeability and enhances insulin sensitivity. Am. J. Physiol. Endocrinol. Metab 301, E517–526. [DOI] [PMC free article] [PubMed] [Google Scholar]
- Ross R, 1999. Atherosclerosis--an inflammatory disease. N. Engl. J. Med 340, 115–126. [DOI] [PubMed] [Google Scholar]
- Ruderman NB, Carling D, Prentki M, Cacicedo JM, 2013. AMPK, insulin resistance, and the metabolic syndrome. J. Clin. Invest 123, 2764–2772. [DOI] [PMC free article] [PubMed] [Google Scholar]
- Sekiguchi M, Kurabayashi M, Adachi H, Hoshizaki H, Oshima S, Taniguchi K, 2004. Usefulness of insulin resistance measured by homeostasis model assessment in predicting restenosis after coronary stent placement in nondiabetic patients. Am. J. Cardiol 93, 920–922. [DOI] [PubMed] [Google Scholar]
- Shawky NM, Pichavaram P, Shehatou GS, Suddek GM, Gameil NM, Jun JY, Segar L, 2016. Sulforaphane improves dysregulated metabolic profile and inhibits leptin-induced VSMC proliferation: Implications toward suppression of neointima formation after arterial injury in western diet-fed obese mice. J. Nutr. Biochem 32, 73–84. [DOI] [PMC free article] [PubMed] [Google Scholar]
- Shawky NM, Segar L, 2017. Sulforaphane inhibits platelet-derived growth factor-induced vascular smooth muscle cell proliferation by targeting mTOR/p70S6kinase signaling independent of Nrf2 activation. Pharmacol. Res 119, 251–264. [DOI] [PMC free article] [PubMed] [Google Scholar]
- Surwit RS, Feinglos MN, Rodin J, Sutherland A, Petro AE, Opara EC, Kuhn CM, Rebuffe-Scrive M, 1995. Differential effects of fat and sucrose on the development of obesity and diabetes in C57BL/6J and A/J mice. Metabolism 44, 645–651. [DOI] [PubMed] [Google Scholar]
- Tanizawa S, Ueda M, van der Loos CM, van der Wal AC, Becker AE, 1996. Expression of platelet derived growth factor B chain and beta receptor in human coronary arteries after percutaneous transluminal coronary angioplasty: an immunohistochemical study. Heart 75, 549–556. [DOI] [PMC free article] [PubMed] [Google Scholar]
- Weyer C, Funahashi T, Tanaka S, Hotta K, Matsuzawa Y, Pratley RE, Tataranni PA, 2001. Hypoadiponectinemia in obesity and type 2 diabetes: close association with insulin resistance and hyperinsulinemia. J. Clin. Endocrinol. Metab 86, 1930–1935. [DOI] [PubMed] [Google Scholar]
- Xi G, Wai C, White MF, Clemmons DR, 2017. Down-regulation of Insulin Receptor Substrate 1 during Hyperglycemia Induces Vascular Smooth Muscle Cell Dedifferentiation. J. Biol. Chem 292, 2009–2020. [DOI] [PMC free article] [PubMed] [Google Scholar]
- Yamauchi T, Kamon J, Minokoshi Y, Ito Y, Waki H, Uchida S, Yamashita S, Noda M, Kita S, Ueki K, Eto K, Akanuma Y, Froguel P, Foufelle F, Ferre P, Carling D, Kimura S, Nagai R, Kahn BB, Kadowaki T, 2002. Adiponectin stimulates glucose utilization and fatty-acid oxidation by activating AMP-activated protein kinase. Nature Med 8, 1288–1295. [DOI] [PubMed] [Google Scholar]
- Zhao Y, Biswas SK, McNulty PH, Kozak M, Jun JY, Segar L, 2011. PDGF-induced vascular smooth muscle cell proliferation is associated with dysregulation of insulin receptor substrates. Am. J. Physiol. Cell. Physiol 300, C1375–1385. [DOI] [PMC free article] [PubMed] [Google Scholar]