

Abstract
Background
Autophagy is an intracellular degradation pathway conserved in eukaryotes. ANXA6 (annexin A6) belongs to a family of calcium‐dependent membrane and phospholipid‐binding proteins. Here, we identify ANXA6 as a newly synthesized protein in starvation‐induced autophagy and validate it as a novel autophagy modulator that regulates autophagosome formation.
Results
ANXA6 knockdown attenuates starvation‐induced autophagy, while restoration of its expression enhances autophagy. GO (gene ontology) analysis of ANXA6 targets showed that ANXA6 interacts with many RAB GTPases and targets endocytosis and phagocytosis pathways, indicating that ANXA6 exerts its function through protein trafficking. ATG9A (autophagy‐related 9A) is the sole multispanning transmembrane protein and its trafficking through recycling endosomes is an essential step for autophagosome formation. Our results showed that ANXA6 enables appropriate ATG9A+ vesicle trafficking from endosomes to autophagosomes through RAB proteins or F‐actin. In addition, restoration of ANXA6 expression suppresses mTOR (mammalian target of rapamycin) activity through the inhibition of the PI3K (phosphoinositide 3‐kinase)‐AKT and ERK (extracellular signal‐regulated kinase) signaling pathways, which is a negative regulator of autophagy. Functionally, ANXA6 expression is correlated with LC3 (microtubule‐associated protein 1 light chain 3) expression in cervical cancer, and ANXA6 inhibits tumorigenesis through autophagy induction.
Conclusions
Our results reveal an important mechanism for ANXA6 in tumor suppression and autophagy regulation.
Keywords: ANXA6, ATG9A, autophagy, cervical cancer, ERK, mTOR
Autophagy is an intracellular degradation pathway conserved in eukaryotes. ANXA6 (annexin A6) belongs to a family of calcium‐dependent membrane and phospholipid binding proteins. Here, we identify ANXA6 as a newly synthesized protein in starvation‐induced autophagy and validate it as a novel autophagy modulator that regulates autophagosome formation. ANXA6 knockdown attenuates starvation‐induced autophagy and restoration of its expression enhances autophagy. GO (gene ontology) analysis of ANXA6 targets showed that ANXA6 interacts with many RAB GTPases and targets endocytic and phagocytosis pathways, indicating that ANXA6 exert its function through protein trafficking. ATG9A (autophagy related 9A) is the sole multi‐spanning transmembrane protein and its trafficking through the recycling endosomes is an essential step for autophagosome formation. Our results showed that under starvation condition, ANXA6 enables appropriate ATG9A trafficking from endosomes to autophagosomes through RAB proteins or F‐actin. In addition, restoration of ANXA6 expression suppresses mTOR (mammalian target of rapamycin) activity through the inhibition of the PI3K (phosphoinositide 3‐kinase)‐AKT and the ERK (extracellular signal‐regulated kinase) signaling pathway, which is a negative regulator of autophagy. Functionally, ANXA6 expression is correlated with LC3 (microtubule‐associated protein 1 light chain 3) expression in cervical cancer and ANXA6 inhibits tumourigenesis through autophagy induction. Our results reveal an important mechanism for ANXA6 in tumor suppression and autophagy regulation.

Abbreviations
- ACTRT1
actin‐related protein T1
- AHA
lazidohomoalanine
- AKT
protein kinase B
- ANXA
annexin
- AP
adaptor protein
- ATG
autophagy‐related gene
- CHX
cycloheximide
- CQ
chloroquine
- EGFR
epidermal growth factor receptor
- ERK
extracellular regulated protein kinase
- GAPK
GTPase‐activating protein
- IP
immunoprecipitation
- LAMP1
lysosome‐associated membrane protein 1
- MAPK
mitogen‐activated protein kinase
- MS
mass spectrometry
- mTOR
mechanistic target of rapamycin
- PARP‐1
poly [ADP‐ribose] polymerase 1
- PAS
phagophore assembly sites
- PI3K
phosphoinositide 3‐kinase
- PKC
protein kinase C
- tfLC3B
tandem fluorescent‑tagged LC3B
- TSC2
tuberous sclerosis 2
- ULK1
unc‐51 like autophagy activating kinase 1
1. INTRODUCTION
Cervical cancer is the second most common cancer in women and the leading cause of cancer‐related deaths among women in developing countries. 1 , 2 Approximately 70% of cervical cancers are caused by HPV (human papilloma virus) 16 and 18 infections. One of the latest opinions about etiopathogenesis 3 is that HPV leads to the occurrence of cervical cancer through autophagy inhibition. At the early stage of cervical carcinogenesis, HPV infection induces autophagy in cancerous cells 4 , 5 ; conversely, autophagy suppresses HPV infection. 6 However, at the late stage of cervical carcinogenesis, HPV infection attenuated autophagy 5 ; thus, the protective effect of autophagy is lost, and the infectivity of HPV is aggravated to accelerate cervical carcinogenesis. In FIGO stage I‐II cervical squamous cell carcinoma, 7 the expression levels of autophagy‐related proteins Beclin 1 and LC3 are significantly lower than that in healthy cervical tissue samples, indicating the tumor suppressive effect of autophagy at the early stage of cervical cancer. High levels of autophagy are also a biomarker for good prognosis of cervical cancer. 7
The autophagic process involves the formation of double‐membrane compartments, called autophagosomes, 8 which contain cytoplasmic constituents, such as protein aggregates and damaged organelles. Thus, autophagy is regarded as a pathway exclusively regulated by cytosolic processes. However, increasing evidence 9 , 10 demonstrates that nuclear transcriptional and epigenetic events also play important roles in autophagy regulation. At the transcriptional level, ATG gene expression can be regulated by some transcription factors and epigenetic changes at histones. 11 These transcripts can be further regulated at the levels of post‐transcription and translation, such as by noncoding RNAs, RNA‐binding proteins, RNA localization, and decay. 9 These incidents suggest that de novo protein synthesis is implicated in autophagy. In starvation‐induced autophagy, although global protein synthesis is significantly reduced due to the suppression of mTOR (mammalian target of rapamycin), there are still a large number of de novo proteins in the autophagic process. 12 Using bio‐orthogonal metabolic tagging combined with MS (mass spectrometry), 13 newly synthesized proteins containing AHA (L‐azidohomoalanine) are identified, and functional analysis reveals their involvement in energy metabolism, cell death, cell survival, and so on, 12 which provides useful insights into the molecular mechanisms and biological functions of autophagy.
Annexins are highly conserved Ca2+‐dependent membrane‐binding proteins that exert multiple functions in cellular development and differentiation. 14 , 15 According to phylogenetic distribution, they are classified into five groups: A (vertebrates), B (invertebrates), C (unicellular eukaryotes), D (plants), and E (protists). In humans, annexin proteins are conventionally referred to as annexin A1‐11 and A13. Annexins are composed of two principal domains: a variable N‐terminal domain and a conserved C‐terminal core. ANXA6 (annexin A6) has eight homologous annexin repeats, which contain ∼70 highly conserved amino acid residues. 16 These repeats form a disk with a slight curvature to facilitate the binding of membrane phospholipids in the presence of Ca2+.14 The Ca2+‐binding sites of ANXA6 are located in the annexin repeats 1, 2, 4, 5, 6, and 8. 17 ANXA6 binds to negatively charged phospholipids in a wide range of intracellular localizations upon activation, especially the plasma membrane and late endosomes/prelysosomes. 15 , 18 It participates in membrane trafficking, cytoskeleton organization, cholesterol homoeostasis, and cell adhesion. 18 , 19 , 20 Growing evidence supports 21 that Ca2+ and Ca2+‐binding proteins control endocytosis and autophagy because Ca2+ originating from lysosomes/late endosomes participates in the converging steps of autophagy and endocytic trafficking. Enrich et al reported 21 that ANXA6 is identified in the autophagosomes of hepatocytes, indicating a function for ANXA6 in the convergence of endocytic and autophagic vesicles to lysosomes. However, the involvement of ANXA6 in the autophagic and endocytic stages remains poorly understood.
ANXA6 is closely associated with many tumors, as previously described. 18 However, the functional role of ANXA6 in carcinogenesis is controversial. It has been used as a potential marker for cervical cancer, 22 , 23 as several studies have shown the association of ANXA6 with the progression and malignancy of cervical cancer. ANXA6 is reportedly overexpressed in squamous cell cervical carcinoma, especially its N‐terminus. 22 Its expression in the nucleus of squamous cell cervical carcinoma is stronger than that in squamous cell epithelia. It has been revealed 24 , 25 that ANXA6 may act through Ras or Ras/MAPK (mitogen‐activated protein kinase) signaling pathways in cervical cancer, which is mainly mediated by PKC‐α (protein kinase C) or p120GAP (GTPase‐activating protein). P120GAP is the sole GAP known to bind to EGFR (epidermal growth factor receptor) and promote the hydrolysis of Ras‐GTP. 26 Thus, the interaction of ANXA6 with PKC‐α and p120GAP downregulates the EGFR/Ras signaling pathway. Conversely, interfering with ANXA6 enhances EGF‐induced Ras activity and phosphorylation of ERK (extracellular regulated protein kinase). 27
In view of the involvement of ANXA6 in autophagy convergence, 21 ANXA6‐regulated autophagy may be associated with cervical carcinogenesis. Thus, it is important to investigate the role of autophagy in ANXA6‐mediated cervical cancer. We hypothesized that the newly synthesized protein ANXA6 regulates autophagosome formation in starvation‐induced autophagy, which is closely related to cervical carcinogenesis. Here, our study demonstrates that ANXA6 is required for autophagy induction, which promotes appropriate ATG9A+ vesicle sorting from endosomes to autophagosomes through RAB proteins or F‐actin. We also showed that ANXA6 correlates with autophagy levels and is downregulated in cervical cancer, while high levels of ANXA6 are associated with improved survival. Functionally, ANXA6‐induced autophagy serves as cell death and enhancing autophagy leads to cervical cancer suppression. These data suggest that ANXA6 expression status may be useful for survival prediction of cervical cancer patients and that ANXA6 could exert its anticancer function through autophagy regulation.
Headlights
ANXA6 is a newly synthesized protein in starvation‐induced autophagy and a novel autophagy modulator that regulates autophagosome formation.
Under starvation, ANXA6 enables appropriate ATG9A trafficking from endosomes to autophagosomes through RAB proteins or F‐actin.
ANXA6 suppresses mTOR activity through the inhibition of the PI3K‐AKT and the ERK signaling.
ANXA6 inhibits tumorigenesis through autophagy induction.
2. MATERIALS AND METHODS
2.1. Cell lines and cell culture
HeLa cells stably expressing GFP‐LC3 were kindly provided by Dr. N Mizushima (The University of Tokyo, Japan). The tfLC3 (mRFP‐GFP tandem fluorescence‐tagged LC3 construct) stably transfected L929 cells were from Prof. Shen Han‐Ming's lab (National University of Singapore, Singapore). ANXA6 knockdown HeLa cells were constructed using shRNA specific for ANXA6 lentivirus by us. Other cells were obtained from American Type Culture Collection (ATCC). All cell lines were cultured in DMEM (Sigma, D1152) with 10% fetal bovine serum (HyClone, SV30160.03).
2.2. Reagents and antibodies
The chemicals used in our experiments were: rapamycin (Med Chem Express, HY‐10219), CQ (Med Chem Express, HY‐17589), Click‐iT® AHA (Lazidohomoalanine) reagent (Invitrogen, C10289), Tris[(1‐benzyl‐1H‐1,2,3‐triazol ‐4‐yl)methyl]amine (TBTA; Sigma, 678937), (2‐carboxyethyl) phosphine (TCEP; Sigma, C4706), CuSO4 (Sigma, 451657), TAMRA alkyne (Invitrogen, T10183), biotin alkyne (Click Chemistry Tools, 1266‐5), U0126 (MCE, HY‐12031), Dulbecco's Modified Eagle's Medium (Invitrogen, 21013), dialyzed fetal bovine serum (Invitrogen, 26400044), 4% formaldehyde (Sigma, F8775) in PBS, 0.5% Triton™ X‐100 (Sigma, T8787) in PBS, and GIBCO® Earle's Balanced Salt Solution (EBSS; Thermo Fisher Scientific 24010043).
The antibodies used in our experiments included: ANXA6 (Abcam, ab31026), ATG9A (Abcam, ab108338), ATG7 (Cell Signaling Technology, 2631), phospho‐ERK (Thr202/Tyr204; Cell Signaling Technology, 4370), ERK (Cell Signaling Technology, 4695), phospho‐mTOR (Ser2448; Cell Signaling Technology, 5536), mTOR (Cell Signaling Technology, 2972), phospho‐PI3K (p85 (Tyr458)/p55 (Tyr199); Cell Signaling Technology, 17366), PI3K (Cell Signaling Technology, 3358), TSC2 (Cell Signaling Technology, 3635), phospho‐AKT (Cell Signaling Technology, 4060), AKT (Cell Signaling Technology, 9272), phospho‐RPS6 (Ser235/236; Cell Signaling Technology, 2211), RPS6 (Cell Signaling Technology, 2217), β‐actin (Sigma, A5441), α‐tubulin (Sigma, T6199), F‐actin (Abcam, ab205), GFP (Cell Signaling Technology, 2555), GFP‐Trap Agarose (ChromoTek, gta‐10), LC3 (Sigma, L7543), P62 (Sigma, P0067), LAMP1 (Cell Signaling Technology, 9091), PARP‐1 (Cell Signaling Technology, 9542), cleaved caspase‐3 (Cell Signaling Technology, 9661), RAB5 (Santa Cruz Biotechnology, sc‐46692), and RAB11 (Proteintech, 15903‐1‐AP).
2.3. Chemical metabolic labeling of de novo proteins by AHA
HeLa cells were labeled with AHA to detect the newly synthesized proteins as previously described. 12 AHA (50 µM) was used to lable cells in L‐methionine‐free DMEM (Invitrogen, 21013). To induce autophagy, cells were starved for 2 h. CHX (cycloheximide, 10 µM) was added to inhibit protein synthesis. The AHA‐incorporated proteins were enriched through a click reaction with TAMRA alkyne or alkyne‐bearing biotin. Affinity purification was further performed through adding 50 µL streptavidin beads (Sigma‐Aldrich, S1638). The enriched proteins were either visualized using gel electrophoresis or subjected to iTRAQ labeling for protein identification and quantification using LC‐MS/MS (liquid chromatography‐tandem MS).
2.4. Short hairpin RNA and plasmids transient transfection
According to the manufacturer's protocol, the shRNA (short hairpin RNA) targeting ANXA6 (Santa Cruz Biotechnology, sc‐29688‐V), the shRNA targeting Atg7 (Santa Cruz Biotechnology, sc‐41447‐V), GFP‐ANXA6 (GeneBio, EX‐A0185‐M98‐B), or GFP‐WIPI2 (WD repeat domain, phosphoinositide interacting 2; GeneBio, EX‐V0950‐M98‐B) were transfected into HeLa cells using Lipofectmine™ 3000 (Invitrogen, L3000015) and then followed by EBSS treatment.
2.5. Western blotting
After indicated treatment, cells were harvested by scraping and washed with PBS. Then, cells were lysed in lysis buffer with proteinase inhibitor (P0013, Beyotime). Equal amounts of proteins were prepared for separation by SDS‐polyacrylamide gels and then transferred onto a polyvinylidene fluoride membrane (PVDF, Bio‐Rad, 1620184). After blocking, the membrane was probed with indicated primary and secondary antibodies, developed with the ECL (chemiluminescence) and photographed using Image Quant LAS 4000 system (GE Healthcare).
2.6. Immunofluorescence staining and confocal microscopy
HeLa cells stably expressing GFP‐LC3 or L929 cells stably expressing tfLC3 were first seeded to a coverglass slide chamber. After the indicated treatment, cell fluorescence was examined using Leika TCS SP5 Confocal. For immunofluorescence staining, cells were first fixed in 4% paraformaldehyde. After permeabilization by 0.25% Triton X‐100, cells were probed with indicated primary antibodies and fluorochrome‐conjugated secondary antibodies, respectively. Finally, cell fluorescence was determined using confocal microscope.
2.7. Immunoprecipitation assay
Briefly, HEK293 cells were lysed on ice for 30 min with the IP (immunoprecipitation) buffer (Beyotime, P0013) with protease inhibitor. Cell lysates were prepared and incubated with RAB5 or RAB11 antibodies overnight with gentle rocking at 4°C, respectively. And then, the immunoprecipitates were washed and boiled in sample buffer. Immunoblotting was performed to analyze the precipitated proteins.
2.8. Immunohistochemistry assay
IHC (immunohistochemistry) staining of human cervical cancer samples was performed using anti‐ANXA6 and anti‐LC3 antibodies. A scoring system was used to determine signals in tumor cells from 0 to 3. 0 = no signal, 1 = weak signal, 2 = intermediate signal, and 3 = strong signal. The scores were calculated by multiplying the intensity of signals with the percentage of positive cells.
2.9. MS analysis
HEK293 cells were first overexpressed with GFP‐ANXA6 and then treated with EBSS starvation for 2 h. Control cells and starved cells were lysed in IP buffer (Beyotime, P0013) and pulldown was performed using GFP‐Trap Agarose (ChromoTek, gta‐10), respectively. The pulldown samples were separated on 10% (w/v) SDS‐PAGE gels through electrophoresis. After staining with coomassie brilliant blue, the separated protein bands were excised, evaporated using acetonitrile, and resuspended in 1% (v/v) formic acid. After trypsin digestion, samples were injected into the mass spectrometer (Model LTQ, Thermo Fisher Scientific, Waltham, MA, USA). The size of the trap and analytical column was 75 µm x 250 mm, respectively, and both were packed with ChromXP C18‐CL, 3 µm (Eksigent, Germany). Using the high pressure liquid chromatography, these proteolytic peptides were gradient eluted into the mass spectrometer at a flow rate of 0.3 µL/min. By targeting MS/MS scans, the MS/MS data were collected on the 10 most abundant ions occurring in the MS scan. The results are retrieved by Proteome Discoverer according to the following conditions.
| Type of search | MS/MS ion search |
| Enzyme | Trypsin |
| Fixed modifications: | Carbamidomethyl (C) |
| Variable modifications |
Oxidation (M) Acetyl (Protein N‐term) |
| Mass values | Monoisotopic |
| Protein mass | Unrestricted |
| Peptide mass tolerance | ±15 ppm |
| Fragment mass tolerance | ±20 mmu |
| Max missed cleavages | 2 |
| Instrument type | ESI‐FTICR |
After label‐free relative quantitation, GO (gene ontology), KEGG (kyoto encyclopedia of genes and genomes), and IPA (ingenuity pathway analysis) analyses were performed among the identified proteins by LC‐MS/MS to demonstrate the protein‐protein interaction network. The analysis was performed by Keecloud Biotech Co., Ltd. (Shanghai, China).
2.10. Colony formation assay
HeLa cells were first seeded in 6‐well plate and then treated with autophagy inducers rapamycin or EBSS starvation. After that, cells were continued to culture until colony formation. After methanol fixation, Gentian Violet was used to stain those surviving colonies, and visible colonies (≥50 cells) were calculated and analyzed.
2.11. Detection of cell death
Under phase‐contrast microscopy, cellular morphological changes were photographed. Cell death was quantitatively analyzed using Pacific Blue™ Annexin V staining coupled with flow cytometry (BD Biosciences). Two apoptosis markers PARP‐1 and Caspase‐3 were examined using western blotting.
2.12. In vivo xenograft tumor model
BALB/c nude mice (female, 4 weeks old) were purchased from the Institute of Zoology, Zhejiang Chinese Medical University. A suspension containing 5 × 10⁶ HeLa or ANXA6 knockdown HeLa cells was subcutaneously (s.c.) injected into the right flanks of the nude mice to construct two different types of tumor models, respectively. After 1 week, tumor‐bearing mice were randomly divided into two groups: PBS treatment and rapamycin treatment (5 mg/kg/per 2 days). A vernier caliper was used to measure the tumor dimensions twice per week. After 30 days tumor inoculation, mice were sacrificed and tumors were excised and weighed. According to the criteria outlined in the “Guide for the Care and Use of Laboratory Animals,” all animals received humane care. All experiments were conducted following the official recommendations of the Chinese Zoological Society.
2.13. Statistical analysis
All western blotting data and image data presented were representative of three independent experiments. The numeric data were presented as mean ± S.D. and analyzed using Student's t test. Image J was used for colocalization analysis and the Pearson's correlation coefficient was calculated and analyzed using Student's t test. At least 10 cells of one image and three images from each group were chosen for Image J analysis.
3. RESULTS
3.1. ANXA6 is a newly synthesized protein involved in autophagy induction in cervical cancer
To profile de novo protein synthesis during autophagy, the azide‐tagged methionine analogue AHA (L‐azidohomoalanine) is incorporated into protein synthesis. 12 , 28 Under 2 h starvation, there was still a lower signal intensity in Figure 1A. After the click reaction, we performed quantitative proteomics and identified 937 newly synthesized proteins. Representative proteins are listed in Figure 1B, and includes ANXA6. 12 Among them, the functional roles of ATP5B (ATP synthase, H+ transporting, mitochondrial F1 complex, and beta polypeptide) and GNB2L1 (guanine nucleotide‐binding protein [G protein], and beta polypeptide 2‐like 1) have been validated in the autophagic process. 12 , 29 The newly synthesized ANXA6 protein was also detected using western blotting (Figure 1A).
FIGURE 1.

ANXA6 is a newly synthesized protein in starvation‐induced autophagy in human cervical cancer. A, Identification of de novo proteins using AHA labeling. HeLa cells were labeled with AHA (50 µM) under starvation in the presence or absence of CHX (10 µM). Intensity of AHA‐labeled proteins was detected in gel fluorescence. The newly synthesized ANXA6 protein was detected using western blotting. B, The representative proteins were shown in database by LC‐MS/MS, including ANXA6. C, D, ANXA6 was downregulated in both mRNA and protein levels in human cervical cancer tissues when compared with that in noncancer tissues. The mRNA levels of ANXA6 were obtained from Oncomine database (total 45 samples). IHC analysis of ANXA6 expression was performed in 100 human cervical cancer patients from Shanghai Putuo District People's Hospital. * P < .05 E, Low expression of ANXA6 was correlated with poor survival in human cervical cancer patients. The data were obtained from TIMER database. F, G, The levels of ANXA6 were increased with time under starvation. HeLa cells were starved with EBSS for autophagy induction
Next, we analyzed the expression levels of ANXA6 in human cervical cancer. Using the Oncomine database, we first analyzed ANXA6 mRNA levels in tissue samples from 45 cervical cancer patients and found that it was significantly downregulated in tumor tissues (Figure 1C). Next, we conducted IHC analysis of ANXA6 protein levels in 100 human cervical cancer patients from Shanghai Putuo District People's Hospital. Compared with nontumor tissues, ANXA6 expression was significantly decreased in tumor tissues (Figure 1D). In addition, data from the TIMER (Tumour Immune Estimation Resource) showed that low ANXA6 mRNA expression in cervical cancer was significantly associated with poor survival (Figure 1E). These results further confirmed the association between ANXA6 and cervical carcinogenesis. In starvation‐induced autophagy, there was an increase in ANXA6 protein levels with time (Figure 1F). Real‐time PCR results showed that starvation led to increased ANXA6 mRNA levels (Figure 1G), in accordance with its protein synthesis.
3.2. Requirement of ANXA6 in the autophagic process
In view of Ca2+‐binding proteins regulating autophagy, 30 , 31 we thus proceeded to test the possible involvement of ANXA6 in autophagy regulation. As shown in Figure 2A and B, ANXA6 knockdown with siRNA led to a significant decrease in the formation of GFP‐LC3 puncta in HeLa cells treated with EBSS starvation. Moreover, the autophagic flux level decreased in ANXA6 knockdown cells under starvation, accompanied by a lower LC3 level and increased P62 (one autophagy substrate) (Figure 2C). Additionally, in rapamycin‐induced autophagy, the decrease in autophagy level due to ANXA6 knockdown is also shown in Figure S1. These results clearly suggest that ANXA6 plays a critical role in autophagy induction.
FIGURE 2.

Knockdown of ANXA6 decreases autophagy levels under starvation. A, B, Hela cells with GFP‐LC3 expressing were starved for 2 h and then cells were examined by confocal microscopy (scale bar 10 µm). The number of GFP‐LC3 puncta was counted and statistically analyzed. * P < 0.05 C, HeLa cells were transfected with scrambled or ANXA6 siRNA for 48 h and then starved in the presence or absence of CQ (20 µM). D, E, HeLa cells with GFP‐LC3 expressing were treated with EBSS for 2 h. After LysoTracker staining (50 nM, 30 min), cells were examined using confocal microscopy (scale bar 10 µm). The Pearson's coefficient was calculated and colocalization was statistically analyzed. ** P < 0.01 F, L929‐tfLC3 cells were first transfected with scrambled or ANXA6 siRNA for 48 h and then starved for 2 h. Cells fluorescence was examined by flow cytometry and the fluorescence ratio of RFP to GFP was calculated and statistically analyzed. ** P < 0.01 G, H, as in F, confocal microscope was performed to determine the fluorescence intensity (scale bar 10 µm). The number of yellow puncta (GFP+RFP+) versus red puncta (GFP−RFP+) was calculated and statistically analyzed. * P < 0.05
ANXA6 is reported to exert a function in vesicle fusion through binding to negatively charged phospholipids of membranes. 32 , 33 Here, we also determined the effect of ANXA6 on the fusion of autophagosomes and lysosomes. In EBSS‐treated cells, we observed increased localization of GFP‐LC3 in lysosomes (Figure 2D and E), indicating the enhancement of autophagosome‐lysosome fusion. However, in ANXA6 knockdown cells, their colocalization appeared to be decreased (Figure 2D and E). In addition, tfLC3B (mRFP‐GFP tandem fluorescent‐tagged LC3B) was also used to examine autophagosome and lysosome fusion. 34 In the acidic lysosome environment, GFP‐LC3 is degraded, while RFP‐LC3 is stable. As shown in Figure 2F and H, EBSS starvation increased RFP puncta instead of GFP puncta, while ANXA6 knockdown attenuated this increase. Similar results were also observed in rapamycin‐treated cells, in which ANXA6 knockdown impaired the enhanced formation of autolysosomes (Figure S2). Therefore, ANXA6 seems to be a new Ca2+ effector that regulates the converging steps of autophagy.
3.3. Identification of ANXA6 targets by quantitative proteomics
To reveal the molecular mechanism of ANXA6‐induced autophagy, quantitative proteomics was performed to identify the targets of ANXA6. HEK293 cells were first transfected with GFP‐ANXA6 and then starved in EBSS for 2 h before lysis. The lysate was then subjected to affinity enrichment using GFP‐fusion beads. The beads were first thoroughly washed and then digested using trypsin. LC‐MS/MS was used to pool and analyze the derived peptides and finally the target proteins were identified and quantified. To differentiate specific targets, a highly stringent cutoff threshold was applied to minimize potential false‐positive targets. Each identified protein was subjected to statistical tests and only proteins identified with P‐values less than 0.05 were considered statistically reliable hits. In our study, a total of 2295 proteins from the control group and 2339 proteins from the starvation‐treated group were successfully identified and quantified (Figure 3A). Among them, we identified 587 proteins as the specific targets of ANXA6 under starvation (Table S1).
FIGURE 3.

Quantitative proteomics reveals ANXA6‐specific target proteins and involved pathways. A, Total 587 proteins were profiled as target proteins of ANXA6 under starvation. B, GO analysis of CC (cellular component) localization of the ANXA6 targets. C, The top regulated BPs (biological processes) of ANXA6 targets were shown according to their ranking. D, Top molecular and cellular functional classes to which the ANXA6‐targeted proteins are associated. E, Top canonical pathways that the ANXA6 protein targets are significantly over‐represented
Subsequently, we performed GO analysis of the ANXA6 targets under starvation. It was shown that these targets were broadly distributed in different parts of the cell, especially in the cytosol, nucleus, mitochondria, and membrane (Table S1). The distribution of the enrichment ratios of these proteins is presented as a histogram in Figure 3B. GO analysis also showed that ANXA6 targets are involved in many biological processes (Figure 3C), such as mRNA splicing, mitochondrial elongation, DNA replication, and repair. Accordingly, they exert various biological functions, including RNA and DNA modification, protein trafficking, molecular transport, protein synthesis and degradation, cell death, and survival (Figure 3D and Figure S3A). In Figure 3E, Figure S3B, and Table S2, GO and KEGG analysis of pathways demonstrated that ANXA6 may exert its effects through the endocytic pathway, mTOR signaling, eukaryotic initiation factor 2 signaling, MAPK signaling, oxidative stress, and phagocytosis of proteins.
3.4. ANXA6 regulates ATG9A+ vesicle trafficking through RAB proteins or F‐actin
GO analysis showed that ANXA6 targets endocytic and phagocytic pathways. Under normal conditions, 15 RAB proteins of ANXA6 targets in the database are listed in Figure S3C, including RAB2, RAB5, RAB7, and RAB11. RABs belong to small GTPases and have critical role in molecular trafficking. 35 , 36 Under starvation, eight representative proteins of ANXA6 targets were selected and listed (Figure 4A), such as Rab GTPases RAB2 and RAB8, AP complexes (adaptor protein), and ACTRT1 (actin‐related protein T1). AP complexes, also known as vesicle coat components, exert an important function in protein transport in membrane traffic pathways. 37 As shown in Figure 4B, IPA also suggested that ANXA6 exerts its function through protein trafficking. It has been known that several RAB GTPases are involved in autophagy regulation. 38 , 39 An RAB‐conversion mechanism is revealed to involve in endocytosis or phagocytosis in which signals are seamlessly transduced to form endosomes or phagosomes. For example, RAB2 transports ATG9+ vesicles derived from Golgi apparatus to the PAS (phagophore assembly site) . 40 RAB2 interacts with ATG9 and facilitates the colocalization of ATG9 and ULK1 (unc‐51 like autophagy activating kinase 1), resulting in ULK1 acquisition and activation to facilitate phagophore formation. 40
FIGURE 4.

ANXA6 targets molecular transporters to regulate the formation of autophagosome. A, The representative target proteins of ANXA6 identified by LC‐MS/MS in cells (sorted by average enrichment ratios). B, IPA reveals that ANXA6 affects protein trafficking. All proteins shown were identified as specific targets of ANXA6. C, D, The colocalization of ATG9A with P62 in HeLa cells was examined under starvation (scale bar 10 µm). The Pearson's coefficient was calculated and statistically analyzed. * P < 0.05 ** P < 0.01 E, F, Hela cells were starved in EBSS for 2 h in the presence or absence of CDN1163 (an activator of Ca2+‐ATPase) or thapsigargin (an inhibitor of Ca2+‐ATPase). The colocalization of endogenous ATG9A with ANXA6 was determined by confocal microscopy (scale bar 10 µm). The Pearson's coefficient was calculated and statistically analyzed. * P < 0.05 ** P < 0.01 *** P < 0.001 G, H, The colocalization of ATG9A with F‐actin was examined under starvation (scale bar 10 µm). The Pearson's coefficient was calculated and statistically analyzed. * P < 0.05 I, IP assay was also conducted to determine the interaction between ATG9A and F‐actin
Previous studies have demonstrated that ATG9+ vesicle derived from plasma membrane or recycling endosome contributes to autophagosome biogenesis. 41 , 42 As shown in Figure 4C and D, EBSS starvation enhanced the colocalization of ATG9A and autophagy substrate P62, but ANXA6 knockdown attenuated their interaction, indicating the role of ANXA6 in the trafficking of ATG9A to the site of autophagosome biogenesis. This was further confirmed by the enhanced colocalization of ANXA6 and ATG9A under starvation (Figure 4E and F). In addition, their colocalization was found to depend on Ca2+ (Figure 4E and F) because ANXA6 is a highly conserved Ca2+‐dependent membrane‐binding protein. 14 , 15 In the presence of CDN1163, an allosteric activator of sarco/endoplasmic reticulum Ca2+‐ATPase, the colocalization of ANXA6 and ATG9A was enhanced under starvation. However, in the presence of thepsigarin, a highly potent inhibitor of the sarco‐endoplasmic reticulum Ca2+‐ATPase, their enhanced interaction was attenuated under starvation. ANXA6 interacts with cytoskeleton components through an F‐actin binding domain to remodel the plasma membrane. 43 The actin cytoskeleton has a critical role in ATG9A+ vesicle motion. 44 In our study, under starvation, the localization of ANXA6 or ATG9A and F‐actin was increased, while knockdown of ANXA6 attenuated their interaction (Figure 4G and H; Figure S4). In addition, IP results also showed the enhanced interaction of ATG9A and F‐actin poststarvation and the requirement of ANXA6 for their interaction (Figure 4I). These data suggest that ANXA6 may control autophagosome formation through actin and potentially via ATG9A sorting at the endosomal level.
3.5. ANXA6 regulates ATG9A sorting from recycling endosomes to form autophagosomes
ATG9A, a transmembrane protein, functions in membrane trafficking to the preautophagosome structures or autophagosomes. 45 , 46 In mammalian cells, ATG9A traffics among Golgi, various endocytic vesicles, and autophagosomes. 47 , 48 In the N‐terminal cytosolic stretch, ATG9A has sorting motifs for trafficking. 49 , 50 Through interaction with the AP complexes, it is sorted and packed into a transport vesicle as cargo. 51 These ATG9‐containing vesicular carriers are transported toward sites of autophagosome formation. It was revealed that ANXA6 interacts directly with TPC1/2 (two pore channels) of the late endosomes that induce the endocytic or autophagic trafficking pathways, 52 or with the proton pump H+ ATPaseV0A2. 53 We first knocked down ANXA6 in HeLa cells and then starved cells to understand the regulation of autophagosome formation by ANXA6. We next analyzed the localization of ATG9A with an endosomal marker and observed that ANXA6 knockdown led to increased ATG9A accumulation in the early endosomes (RAB5+ vesicles) under starvation (Figure 5A and B). As shown in Figure 5C, the IP assay also showed that knockdown of ANXA6 enhanced the interaction of ATG9A with RAB5. This suggested that the ANXA6‐dependent actin mechanism transports ATG9A through early endosomes. As a result, the disturbed ATG9A trafficking affected autophagosome formation.
FIGURE 5.

Knockdown of ANXA6 attenuates ATG9A trafficking through the recycling endosomes. A, B, Confocal pictures showed the colocalization of ATG9A with RAB5 in starved HeLa cells with ANXA6 knockdown (scale bar 10 µm). The Pearson's coefficient was calculated and statistically analyzed. * P < 0.05 C, IP assay was performed to determine the interaction between ATG9A and ANXA6. HEK293 cells with ANXA6 knockdown were transfected with pcDNA3.1‐ATG9A and then starved with EBSS. Cell lysates were prepared for IP assay. D, E, The colocalization of ATG9A with RAB11 in ANXA6 knockdown cells was determined under starvation. (scale bar 10 µm). The Pearson's coefficient was calculated and statistically analyzed. ** P < 0.01 *** P < 0.001 F as in C, IP assay was conducted to examine the interaction between ATG9A and RAB11 in ANXA6 knockdown cells
Recent studies 44 , 54 showed that ATG9A has an important function in autophagosome biogenesis with its transient localization to recycling endosomes. We also observed that starvation led to ATG9A vesicle accumulation in the recycling endosomes using RAB11 as a marker (Figure 5D and E). RAB11 exerts its function in regulating ATG9A trafficking to autophagic compartments from the plasma membrane. 42 , 55 However, ANXA6 knockdown decreased ATG9A localization in RAB11‐positive vesicles. Consistently, the IP assay also showed that ANXA6 knockdown weakened the interaction between ATG9A and RAB11 (Figure 5F). These data suggest that ANXA6 controls ATG9A trafficking to recycling endosomes.
3.6. Restoration of ANXA6 expression induces autophagy
We restored the expression of ANXA6 in knockdown cells to assess the intracellular localization of ATG9A to confirm the role of ANXA6 in ATG9A trafficking. As shown in Figure 5A and B, increased accumulation of ATG9A was observed at the early endosomes (RAB5+ vesicles) under starvation during ANXA6 knockdown. The effect of ANXA6 downregulation on ATG9A sorting could be rescued by transiently expressing ANXA6, as seen by reduced colocalization of ATG9A‐RAB5 (Figure 6A and B), and increased colocalization of ATG9A‐RAB11 under nutrient‐starved conditions (Figure 6C and D). These results indicate that restoration of ANXA6 expression leads to the trafficking of ATG9A from the early endosomes to the recycling endosomes for autophagosome formation.
FIGURE 6.

ATG9A trafficking by ANXA6 is required for the formation of autophagosome. A, C, GFP‐ANXA6 was transiently transfected into HeLa cells with ANXA6 knockdown and then cells were starved in EBSS for 2 h. Confocal microscope was used to determine the colocalization of ATG9A with RAB5 or RAB11 (scale bar 10 µm). The Pearson's coefficient was calculated and statistically analysed in B, D. * P < 0.05 ** P < 0.01 *** P < 0.001 E, HeLa cells with or without ANXA6 knockdown were starved for 2 h. Cells were harvested and lysed for western blotting. α‐tubulin served as loading control. F, HeLa cells with ANXA6 knockdown were transiently transfected with different amount of ANXA6. Cell lysates were prepared for western blotting to determine the expression levels of the indicated proteins. α‐tubulin was used as loading control. G, HeLa cells with ANXA6 knockdown were treated with ERK inhibitor U0126 (10 µM) for 2 h. Cells were harvested for western blotting to determine the indicated proteins expression. H, HeLa cells with ANXA6 knockdown were first transiently transfected with GFP‐ANXA6 and then starved in EBSS for 2 h in the presence or absence of CQ (20 µM). Cells were harvested and lysed for western blotting and α‐tubulin served as loading control
GO analysis revealed that ANXA6 targets were associated with mTOR signaling (Figure 3E). mTOR, an evolutionarily conserved protein kinase, serves as a central regulator of cell growth and is a key negative regulator of autophagy. 56 Nutrient starvation activates autophagy through suppression of mTOR signaling and activation of the ULK1 complex in eukaryotic cells. 57 , 58 To reveal the role of mTOR signaling in autophagy regulation by ANXA6, we conducted RNA interference to knock down ANXA6 expression and found that the PI3K (phosphoinositide 3‐kinase)‐AKT (protein kinase B)‐mTOR signaling pathway was activated by ANXA6 knockdown (Figure 6E), accompanied by an increase in the phosphorylation levels of PI3K, AKT, mTOR, and S6. Consequently, cells with ANXA6 knockdown exhibited lower LC3 levels and higher P62 levels (Figure 6E and Figure S5), indicating decreased autophagy levels due to mTOR activation. Conversely, when we restored the expression of ANXA6 in knockdown cells, the phosphorylation levels of AKT, mTOR, and S6 decreased with increasing ANXA6 levels (Figure 6F).
In addition, IPA analysis showed that ERK signaling was involved in ANXA6‐induced autophagy (Figure 4B). Based on the literature, the ERK pathway can cross‐activate PI3K‐mTOR signaling by regulating TSC2 (tuberous sclerosis 2) and mTOR. 59 Through the posttranslational repression of TSC2, ERK exerts an important function in TSC progression. ERK‐mediated phosphorylation results in the dissociation of TSC1 and TSC2 and further weakens the ability of TSC2 to inhibit mTOR signaling. 59 , 60 Thus, we determined the levels of ERK in ANXA6 knockdown cells. As shown in Figure 6G, ANXA6 knockdown increased the phosphorylation levels of ERK and decreased TSC2 protein levels. ANXA6 overexpression attenuated the increase in phosphorylation levels of ERK. Moreover, ERK inhibitor increased TSC2 protein levels and attenuated mTOR activity in ANXA6 knockdown cells (Figure 6G). The above results demonstrate that ANXA6 may inhibit mTOR function by blocking ERK and PI3K‐AKT signaling.
As a result, mTOR inhibition led to increased LC3 levels and decreased P62 levels (Figure 6F and G; Figure S5). Using chloroquine (CQ, an autophagy inhibitor), we also measured autophagy flux‐level changes during restoration of ANXA6 expression. As shown in Figure 6H, under EBSS starvation, LC3 levels greatly increased in the presence of CQ. When restoring ANXA6 in knockdown cells, high levels of LC3 were further increased (Figure 6H), indicating enhanced autophagy flux. Meanwhile, ANXA6 restoration reduced P62 levels and increased autophagy flux. The above results demonstrated that ANXA6 induces autophagy through mTOR suppression.
3.7. Decreased autophagy levels by ANXA6 knockdown lead to aberrant cell growth
Next, we sought to determine the biological function of autophagy in cancer cell growth. IHC analysis showed that ANXA6 was lowly expressed in human cervical cancer tissues (Figure 1C), indicating its tumor suppressive effect. 18 As expected, the morphological changes and CCK‐8 results showed that knockdown of ANXA6 or Atg7 in HeLa cells promoted proliferation (Figure 7A and B; Figure S6C), which may be due to lower autophagy levels in knockdown cells. To test this, EBSS starvation was used to induce autophagy 56 and Annexin V staining showed that cell apoptosis significantly increased under starvation (Figure S6A). However, in starved‐ANXA6 knockdown cells, quantification of apoptotic events was far less than that in wild‐type cells (Figure S6A). As shown in Figure 7C, western blotting results also showed that starvation reduced cellular apoptosis in ANXA6 or Atg7 knockdown cells, accompanied by less cleavage of caspase 3 and PARP‐1 (poly [ADP‐ribose] polymerase 1), two known apoptotic markers. In addition, we tried to restore ANXA6 expression in knockdown cells and found that ectopic expression of ANXA6 led to increased apoptosis when compared with ANXA6 knockdown cells under starvation using Annexin V staining (Figure S7). Such observations indicate that ANXA6‐induced autophagy serves as a cell death mechanism.
FIGURE 7.

Low levels of autophagy promotes the proliferation of cancer cells. HeLa cells were first transfected with the ANXA6‐ or Atg7‐specific lentiviral shRNA. After 72 h, cells were cultured in EBSS for 24 h starvation. A, HeLa cells with indicated treatment were examined under an inverted microscope and morphological change of cells was photographed (scale bar 100 µm). Western blotting was used to determine ANXA6 and ATG7 expression. B, Cell proliferation was measured by CCK‐8 (cell counting kit‐8) under starvation and statistically analyzed. ** P < 0.01 *** P < 0.001 C, Cell lysates were prepared for western blotting to determine the apoptotic markers. D, E, as in A, cells were treated with autophagy inducer rapamycin. Cell proliferation was determined by colony formation assay. A quantitative analysis of the colony numbers was shown in the bar diagram. * P < 0.05 F, G, HeLa cells with or without ANXA6 knockdown were transfected with GFP‐WIPI2 and colony formation assay was performed to measure cell proliferation. * P < 0.05 ** P < 0.01 H, I, HeLa cells with ANXA6 knockdown were first restored the expression of ANXA6 and then transfected with the Atg7‐specific lentiviral shRNA. Western blotting was conducted to examine the expression levels of ANXA6 and ATG7. Cell proliferation was determined by colony formation assay. ** P < 0.01 J, Cell proliferation was measured using CCK‐8 and statistically analyzed. ** P < 0.01 *** P < 0.001
Rapamycin (an mTOR inhibitor) was used to induce autophagy. 61 As shown in Figure 7D and E and Figure S6B, ANXA6 or Atg7 knockdown stimulated cancer cell proliferation to a greater extent than wild‐type cells based on the results of cell growth curves and colony formation assays. Rapamycin treatment induced autophagy and significantly inhibited cancer cell viability and colony formation. Consistently, knockdown of ANXA6 attenuated the inhibitory effects of rapamycin on cell growth due to reduced autophagy induction. In addition, we also performed genetic induction of autophagy via ectopic expression of WIPI2. 62 As shown in Figure 7F and G, WIPI2 overexpression significantly inhibited cancer cell colony formation, but ANXA6 knockdown weakened the suppressive effect of autophagy induction. Moreover, we restored ANXA6 expression in knockdown cells and found that ANXA6 significantly suppressed cell growth and colony formation (Figure 7H‐J and Figure S7). However, when Atg7 was knocked down, the inhibitory effect of ANXA6 restoration was attenuated, further confirming that autophagy serves as cell death.
3.8. In vivo tumor suppression by autophagy activation
Finally, we evaluated whether autophagy induction could exert an antitumor effect in xenograft tumor modeling. Wild type or ANXA6 knockdown HeLa cells were inoculated S.C. into the flank of nude mice. Two different types of xenograft tumor models were established, in which tumor‐bearing mice were divided into two groups: (1) mice treated with PBS and (2) mice treated with rapamycin. The xenograft tumors developed for 4 weeks after injection, and the treatment commenced 1 week postinoculation when the subcutaneous tumor mass formed.
Consistently, ANXA6 knockdown significantly promoted tumorigenesis when compared with wild‐type cells (Figure 8A). These observations were also strengthened by increased tumor weight and larger tumor volume in the ANXA6 knockdown tumor model after mice were sacrificed (Figure 8B and C). Significant tumor suppression was observed in the rapamycin‐treated groups compared with the PBS‐treated groups, but the tumor suppressive effect was attenuated by ANXA6 knockdown. As shown in Figure 8D, western blotting results showed that rapamycin treatment induced autophagy in wild‐type tumors instead of ANXA6 knockdown tumors, accompanied by increased LC3 and decreased P62 levels. This may be attributed to the higher levels of phospho‐S6 in rapamycin‐treated ANXA6 knockdown tumors (Figure 8D), indicating the activation of mTOR signaling. IHC was used to evaluate the levels of apoptosis and autophagy in the xenograft tumor, and we observed that rapamycin treatment greatly increased caspase 3 cleavage and LC3 level in wild‐type tumors than in ANXA6 knockdown tumors (Figure 8E). To evaluate the clinical importance of ANXA6‐induced autophagy in cervical cancer, we analyzed the correlation between ANXA6 and LC3 expression levels in human cervical cancer specimens. The levels of ANXA6 and LC3 were determined using IHC staining. In Figure 8F, ANXA6 expression had a significant correlation with LC3 level in these cervical cancer samples. Taken together, these findings markedly indicate that autophagy exerts an anticancer effect.
FIGURE 8.
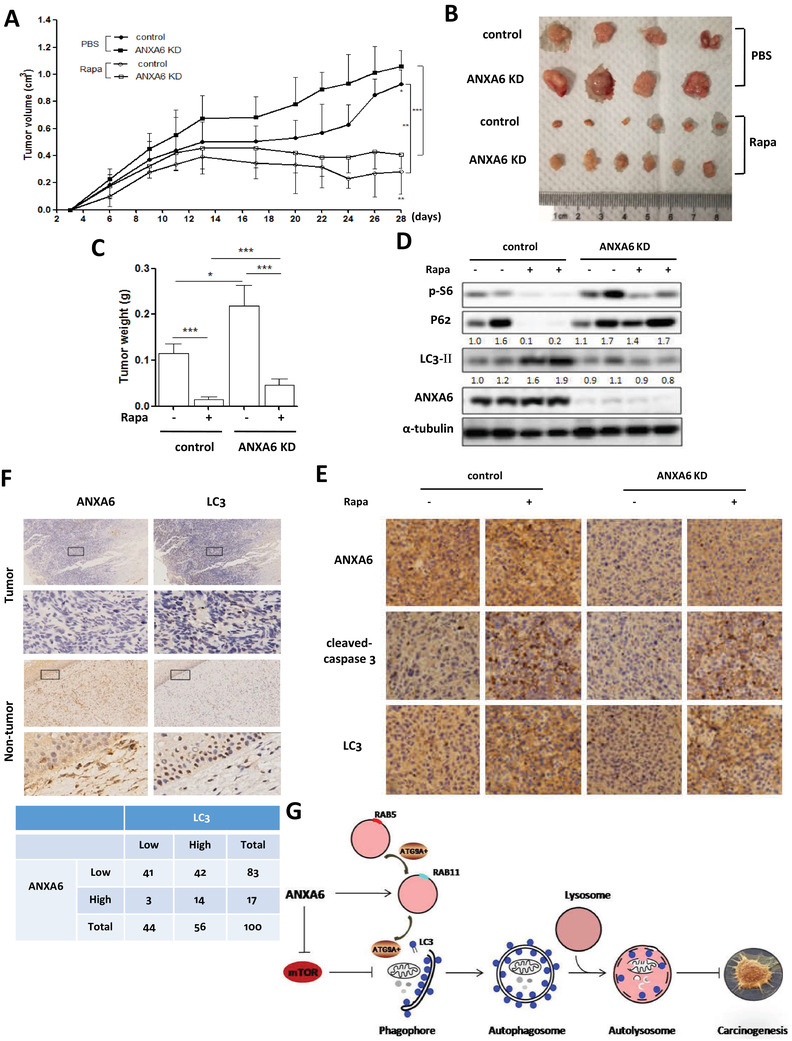
Activation of autophagy suppresses the tumorigenesis of cervical cancer. A, Tumor volumes from each group were measured using a vernier caliper twice per week and then statistically analyzed. * P < 0.05, **P < 0.01, *** P < 0.001 B, Typical images of the xenograft tumors from different treatment groups were shown. C, The average tumor weight from each group was calculated and statistically analyzed. * P < 0.05, *** P < 0.001 D, Autophagy markers were examined in tumor tissue from various groups using western blotting. E, Representative images of ANXA6, cleaved‐caspase 3, and LC3 by IHC staining were shown on serial sections of tumors from various groups. F, ANXA6 expression was associated with LC3 level in human cervical tumor and nontumor tissues by IHC staining (upper panel). IHC staining results were summarized in two different cohorts of human cervical cancer specimens (lower panel). G, A schematic model of autophagy induction by ANXA6 in human cervical cancer
A schematic model of autophagy induction by ANXA6 in human cervical cancer is shown in Figure 8G. On the one hand, through RAB proteins or F‐actin, ANXA6 enables appropriate ATG9A+ vesicle trafficking to autophagosomes from endosomes. On the other hand, ANXA6 expression leads to mTOR suppression and autophagy initiation. ANXA6 exerts an anticancer effect in cervical carcinogenesis through autophagy induction.
4. DISCUSSION
In response to starvation, autophagy levels increase to ensure sufficient energy provision for cell survival through degradation of cytoplasmic constituents and organelles. In this process, many proteins are synthesized, which may be involved in autophagy or biological functions of autophagy. Here, we identified a newly synthesized protein, ANXA6, in starvation‐induced autophagy in cervical cancer cells. ANXA6 induction was due to its transcriptional upregulation with increased mRNA levels (Figure 1G), but its upstream modulator was not explored in our study. Autophagy induction was dependent on ANXA6 level, as it was abrogated by ANXA6 knockdown, while restoration of ANXA6 expression in cells was able to enhance autophagosome formation, confirming that the autophagy process requires the synthesis of ANXA6. In cervical cancer, ANXA6 was downregulated and low levels of ANXA6 were associated with poor survival of cervical cancer patients (Figure 1), indicating that it serves as a tumor suppressor. This was also confirmed by in vitro and in vivo experiments. The tumor suppressive effect of ANXA6 could be attributed to autophagy induction. Knockdown of ANXA6 decreased autophagy levels and increased cervical tumor growth, while induction of autophagy significantly suppressed cervical tumorigenesis (Figure 8). These results demonstrate that ANXA6‐induced autophagy exerts an anticancer effect in cervical carcinogenesis.
To reveal the molecular mechanism of ANXA6‐induced autophagy, quantitative proteomics was conducted to profile the targets of ANXA6. Among them, multiple molecules regulating protein trafficking were identified and IPA showed that ANXA6 regulates autophagy mainly through molecule transport and protein trafficking (Figure 3). These molecules include RAB GTPases RAB2 and RAB8, adaptor protein AP complexes, and ACTRT1, enabling the maintenance of starvation‐induced autophagy. Either in endocytosis or phagocytosis, an RAB‐conversion mechanism is involved in the maturation of endosomes or phagosomes. 63 , 64 Recently, 65 growing evidence has demonstrated that members of RAB small GTPases regulate the autophagic process. RAB8 interacts with the autophagy receptor Optineurin and is recruited to PAS to initiate autophagy. 66 The AP2 complex, together with the RabGAP protein TBC1D5, 67 regulates the rerouting of ATG9‐containing vesicle toward sites of autophagosome formation. Thus, the identification of multiple target molecules and cooperating responses demonstrates that ANXA6‐dependent autophagosome formation involves many trafficking pathways of converging membrane.
ATG9A is mainly localized to the trans‐Golgi network and the endosomal system, 46 , 68 and reportedly moves between them. 48 , 69 ATG9A also localizes with ULK1 and ATG16L at recycling endosomes. 42 , 67 When autophagy is induced, ATG9A transiently translocalizes to autophagosomes from recycling endosomes through the interaction of its sorting motifs with AP complexes. 67 In fact, the trafficking of ATG9A among endosomes is also associated with ANXA6, and knockdown of ANXA6 decreased ATG9A trafficking from early endosomes to recycling endosomes under starvation (Figure 5). As a result, the localization of ATG9A in autophagosomes was also attenuated and autophagosome formation was impaired. As an autophagy modulator, the function of ANXA6 is similar to that of another annexin family member ANXA2. 44 Unfortunately, ATG9A was not predicted in the MS analysis of ANXA6‐interacting proteins. In our MS data, ANXA6 was found to interact with RAB small GTPases, including RAB2, RAB8, and AP complexes (Figure 4A). These molecular targets are involved in vesicle trafficking to PAS. 40 , 66 , 67 Thus, we speculate that ANXA6 may regulate ATG9A+ vesicles to form phagophores through these molecular transporters instead of directly regulating the trafficking of ATG9A‐containing vesicles.
In fact, ATG9 is found to not only be involved in the formation of ILVs (intraluminal vesicles), but is also involved in the localized acidification within amphisomes/autolysosomes. 70 This means that ANXA6 may exert an effect on the regulation of MVB (multivesicular body) pathways. MVBs contain ILVs and these contents are ubiquitinated and degraded in the lysosome or recycled to cell surface in the endocytic pathway. 71 This process is achieved through the action of protein complexes named endosomal sorting complex required for transport‐0,I,II, and III. 72 We also examined the degradation of EGFR, which is internalized via clathrin‐mediated endocytosis. 73 A significant portion of EGFR is ubiquitinated and sorted to ILVs within the MVB. 74 Our results showed that ANXA6 was required for the degradation of EGFR (data not shown), suggesting that ANXA6 regulates the MVB‐mediated pathway. However, the underlying mechanism requires further investigation.
Nutrient starvation activates autophagy through stimulating the ULK1 complex‐ULK1, the binding partners ATG13 and FIP200. 75 , 76 mTOR negatively regulates the ULK1 complex and autophagy initiation, while inhibition of mTOR activity enhances the ULK1 kinase activity. 75 Through the quantitative proteomics, there were many ANXA6 candidate interactors that show a connection to mTOR and provide some insight into these observations (Figure 4A). Several membrane‐trafficking RAB and ARF GTPases have also been shown to play key roles in autophagy through the regulation of mTOR signaling. 77 , 78 ARF1, localized in the Golgi complex, exerts its function in the expansion of the phagophore through inhibition of mTOR activity. 78 , 79 RAB5, localized in early endosomes, regulates PI3K activity and inhibits mTOR‐dependent signaling. 80 , 81 GO analysis showed that ANXA6 targets were associated with molecular transport and protein trafficking to induce autophagy. To reveal the role of mTOR signaling in ANXA6‐induced autophagy, we interfered with ANXA6 expression and found that mTOR activity was enhanced, which was mediated by the PI3K‐AKT and ERK signaling pathways (Figure 6). Conversely, the restoration of ANXA6 expression suppressed mTOR signaling with a decrease in phosphorylated S6 and ERK levels. These results demonstrated that ANXA6‐induced autophagy is attributed to the inhibition of mTOR activity.
In summary, we have identified a newly synthesized protein, ANXA6, that is upregulated upon starvation. ANXA6 upregulation is important for inducing autophagy, especially during starvation. The action of ANXA6 has been mainly associated with dysregulation of mTOR, MAPK, and PI3K signaling activities. ANXA6 downregulation is involved in human cervical cancer and may serve as a potential biomarker for the diagnosis, treatment, and prognosis of cervical cancer. ANXA6 displays tumor suppressor effects and ectopic expression of ANXA6 limits the growth of cervical cancer through autophagy induction; thus, their association contributes to cervical carcinogenesis. The possibility of enhancing ANXA6 levels as a cancer treatment is particularly interesting, as ANXA6‐mediated autophagic mechanisms display efficacy in a human cervical cancer xenograft model.
Supporting information
FIGURE S1 A, Hela cells with or without ANXA6 knockdown were treated with rapamycin (100 nM) to induce autophagy. Western blotting was performed to determine the levels of autophagy‐related proteins. B, as in A, cells were treated with rapamycin in the presence or absence of autophagy inhibitor CQ.
FIGURE S2. Knockdown of ANXA6 decreases the formation of autolysosomes. L929‐tfLC3 cells were first transfected with scrambled or ANXA6 siRNA for 48 h and then treated with rapamycin for 2 h. Confocal microscope was performed to determine the fluorescence intensity (scale bar 10 μm). The number of yellow puncta (GFP+RFP+) versus red puncta (GFP−RFP+) was calculated and statistically analyzed. * P < .05, ** P < .01
FIGURE S3. Analysis of ANXA6 targets function and involved pathways. A, GO analysis of the top regulated MF (molecular functions) of ANXA6 targets according to their ranking. B, KEGG analysis of top canonical pathways that the ANXA6 protein targets are significantly over‐represented. C, Representative RAB proteins were listed as target proteins of ANXA6 under normal condition.
FIGURE S4. Analysis of localization of ANXA6 in response to starvation. HeLa cells were starved in EBSS for 2 h starvation. The colocalization of ANXA6 with F‐actin was examined using confocal microscope (scale bar 10 µm).
FIGURE S5. ANXA6‐induced autophagy involves mTOR signaling pathway. SiHA cells were first transfected with scrambled or ANXA6 siRNA for 48 h and then starved for 2 h. Cells were harvested and lysed for western blotting. GAPDH served as loading control.
FIGURE S6. Knockdown of ANXA6 accelerates cervical cancer cell growth. A, HeLa cells with or without ANXA6 knockdown were under 24 h starvation. Cells were harvested and labeled with 5 μL Annexin V (Pacific Blue™) and cell fluorescence was measured by flow cytometry. * P < .05 B, Cell growth curves in ANXA6 knockdown cells were drawn with or without rapamycin treatment (200 nM). *** P < .001 C, SiHA cells with or without ANXA6 knockdown were treated with rapamycin. Cell proliferation was measured by CCK‐8 and statistically analyzed. * P < .05 ** P < .01 *** P < .001.
FIGURE S7. Restoration of ANXA6 expression leads to more cell death under starvation. A, HeLa cells with respective treatments were examined with an inverted microscope and morphological changes were photographed (scale bar 100 µm). B, Quantification of cell apoptosis in ANXA6 knockdown HeLa cells when ectopic expression of GFP‐ANXA6. Cells were starved in EBSS for 24 h and then labeled with Pacific Blue™ Annexin V for analysis. * P < .05 C, SiHA cells with ANXA6 knockdown were first restored the expression of ANXA6 and then transfected with the Atg7‐specific lentiviral shRNA. Cell proliferation was measured by CCK‐8 and statistically analyzed. * P < .05 ** P < .01 # P > .05
Supporting information
Supporting information
ACKNOWLEDGMENTS
This study was supported by research grants from the National Natural Science Foundation of China (31701199 and 32070740), Zhejiang Provincial Program in Medicine and Health Sciences and Technology (2018253645), Zhejiang Provincial Natural Science Foundation (LR18H160002), Traditional Chinese Medicine Scientific Research Fund Project of Zhejiang Province (2018ZB010) to Dr. Zhang Jianbin; National Natural Science Foundation of China (81703907) to Dr. Sun Xin; and Zhejiang Provincial Outstanding Talent Project of Ten Thousand Talents Program, Zhejiang Provincial Qianjiang Talents Program to Dr. Zhang Jianbin.
Sun X, Shu Y, Xu M, et al. ANXA6 suppresses the tumorigenesis of cervical cancer through autophagy induction. Clin Transl Med. 2020;10:e208 10.1002/ctm2.208
Contributor Information
Jigang Wang, Email: jgwang@icmm.ac.cn.
Dongsheng Huang, Email: dshuang@zju.edu.cn.
Jianbin Zhang, Email: zhangjianbin@hmc.edu.cn.
DATA AVAILABILITY STATEMENT
Data available on request from the authors. The data that support the findings of this study are available from the corresponding author upon reasonable request.
REFERENCES
- 1. Trottier H, Burchell AN. Epidemiology of mucosal human papillomavirus infection and associated diseases. Public Health Genomics. 2009;12:291‐307. 10.1159/000214920. [DOI] [PubMed] [Google Scholar]
- 2. Einstein MH, Schiller JT, Viscidi RP, et al. Clinician's guide to human papillomavirus immunology: knowns and unknowns. Lancet Infect Dis. 2009;9:347‐356. 10.1016/S1473-3099(09)70108-2. [DOI] [PubMed] [Google Scholar]
- 3. Li X, Gong Z, Zhang L, et al. Autophagy knocked down by high‐risk HPV infection and uterine cervical carcinogenesis. Int J Clin Exp Med. 2015;8:10304‐10314. [PMC free article] [PubMed] [Google Scholar]
- 4. Ishii Y. Electron microscopic visualization of autophagosomes induced by infection of human papillomavirus pseudovirions. Biochem Biophys Res Commun. 2013;433:385‐389. 10.1016/j.bbrc.2013.02.130. [DOI] [PubMed] [Google Scholar]
- 5. Surviladze Z, Sterk RT, Deharo SA, Ozbun MA. Cellular entry of human papillomavirus type 16 involves activation of the phosphatidylinositol 3‐kinase/Akt/mTOR pathway and inhibition of autophagy. J Virol. 2013;87:2508‐2517. 10.1128/JVI.02319-12. [DOI] [PMC free article] [PubMed] [Google Scholar]
- 6. Griffin LM, Cicchini L, Pyeon D. Human papillomavirus infection is inhibited by host autophagy in primary human keratinocytes. Virology. 2013;437:12‐19. 10.1016/j.virol.2012.12.004. [DOI] [PMC free article] [PubMed] [Google Scholar]
- 7. Zhu W, Pan X, Li F, Zhang Y, Lu X. Expression of Beclin 1 and LC3 in FIGO stage I‐II cervical squamous cell carcinoma and relationship to survival. Tumour Biol. 2012;33:1653‐1659. 10.1007/s13277-012-0421-4. [DOI] [PubMed] [Google Scholar]
- 8. Levine B, Klionsky DJ. Development by self‐digestion: molecular mechanisms and biological functions of autophagy. Dev Cell. 2004;6:463‐477. [DOI] [PubMed] [Google Scholar]
- 9. Delorme‐Axford E, Klionsky DJ. Transcriptional and post‐transcriptional regulation of autophagy in the yeast Saccharomyces cerevisiae . J Biol Chem. 2018;293:5396‐5403. 10.1074/jbc.R117.804641. [DOI] [PMC free article] [PubMed] [Google Scholar]
- 10. Di Malta C, Cinque L, Settembre C. Transcriptional regulation of autophagy: mechanisms and diseases. Front Cell Dev Biol. 2019;7:114 10.3389/fcell.2019.00114. [DOI] [PMC free article] [PubMed] [Google Scholar]
- 11. Sakamaki J‐I, Long JS, New M, Van Acker T, Tooze SA, Ryan KM. Emerging roles of transcriptional programs in autophagy regulation. Transcription. 2018;9:131‐136. 10.1080/21541264.2017.1372045. [DOI] [PMC free article] [PubMed] [Google Scholar]
- 12. Wang J, Zhang J, Lee Y‐M, et al. Quantitative chemical proteomics profiling of de novo protein synthesis during starvation‐mediated autophagy. Autophagy. 2016;12:1931‐1944. 10.1080/15548627.2016.1196317. [DOI] [PMC free article] [PubMed] [Google Scholar]
- 13. Zhang J, Wang J, Lee Y‐M, Kim T‐K, Shen H‐M. Proteomic profiling of de novo protein synthesis in starvation‐induced autophagy using bioorthogonal noncanonical amino acid tagging. Methods Enzymol. 2017;588:41‐59. 10.1016/bs.mie.2016.09.075. [DOI] [PubMed] [Google Scholar]
- 14. Gerke V, Moss SE. Annexins: from structure to function. Physiol Rev. 2002;82:331‐371. 10.1152/physrev.00030.2001. [DOI] [PubMed] [Google Scholar]
- 15. Gerke V, Creutz CE, Moss SE. Annexins: linking Ca2+ signalling to membrane dynamics. Nat Rev Mol Cell Biol. 2005;6:449‐461. 10.1038/nrm1661. [DOI] [PubMed] [Google Scholar]
- 16. Moss SE, Morgan RO. The annexins. Genome Biol. 2004;5:219 10.1186/gb-2004-5-4-219. [DOI] [PMC free article] [PubMed] [Google Scholar]
- 17. Huber R, Schneider M, Mayr I, Römisch J, Paques E‐P. The calcium binding sites in human annexin V by crystal structure analysis at 2.0 A resolution. Implications for membrane binding and calcium channel activity. FEBS Lett. 1990;275:15‐21. 10.1016/0014-5793(90)81428-q. [DOI] [PubMed] [Google Scholar]
- 18. Qi H, Liu S, Guo C, Wang J, Greenaway FT, Sun M‐Z. Role of annexin A6 in cancer. Oncol Lett. 2015;10:1947‐1952. 10.3892/ol.2015.3498. [DOI] [PMC free article] [PubMed] [Google Scholar]
- 19. Cubells L, Vilà De Muga S, Tebar F, et al. Annexin A6‐induced alterations in cholesterol transport and caveolin export from the Golgi complex. Traffic. 2007;8:1568‐1589. 10.1111/j.1600-0854.2007.00640.x. [DOI] [PMC free article] [PubMed] [Google Scholar]
- 20. De Diego I, Schwartz F, Siegfried H, et al. Cholesterol modulates the membrane binding and intracellular distribution of annexin 6. J Biol Chem. 2002;277:32187‐32194. 10.1074/jbc.M205499200. [DOI] [PubMed] [Google Scholar]
- 21. Enrich C, Rentero C, Grewal T. Annexin A6 in the liver: from the endocytic compartment to cellular physiology. Biochim Biophys Acta Mol Cell Res. 2017;1864:933‐946. 10.1016/j.bbamcr.2016.10.017. [DOI] [PubMed] [Google Scholar]
- 22. Lomnytska MI, Becker S, Hellman K, et al. Diagnostic protein marker patterns in squamous cervical cancer. Proteomics Clin Appl. 2010;4:17‐31. 10.1002/prca.200900086. [DOI] [PubMed] [Google Scholar]
- 23. Lomnytska MI, Becker S, Bodin I, et al. Differential expression of ANXA6, HSP27, PRDX2, NCF2, and TPM4 during uterine cervix carcinogenesis: diagnostic and prognostic value. Br J Cancer. 2011;104:110‐119. 10.1038/sj.bjc.6605992. [DOI] [PMC free article] [PubMed] [Google Scholar]
- 24. Koese M, Rentero C, Kota BP, et al. Annexin A6 is a scaffold for PKCalpha to promote EGFR inactivation. Oncogene. 2013;32:2858‐2872. 10.1038/onc.2012.303. [DOI] [PubMed] [Google Scholar]
- 25. Grewal T, Koese M, Rentero C, Enrich C. Annexin A6‐regulator of the EGFR/Ras signalling pathway and cholesterol homeostasis. Int J Biochem Cell Biol. 2010;42:580‐584. 10.1016/j.biocel.2009.12.020. [DOI] [PubMed] [Google Scholar]
- 26. Wang Z, Tung PS, Moran MF. Association of p120 ras GAP with endocytic components and colocalization with epidermal growth factor (EGF) receptor in response to EGF stimulation. Cell Growth Differ. 1996;7:123‐133. [PubMed] [Google Scholar]
- 27. Grewal T, Evans R, Rentero C, et al. Annexin A6 stimulates the membrane recruitment of p120GAP to modulate Ras and Raf‐1 activity. Oncogene. 2005;24:5809‐5820. 10.1038/sj.onc.1208743. [DOI] [PubMed] [Google Scholar]
- 28. Wong Y‐K, Zhang J, Hua Zi‐C, Lin Q, Shen H‐M, Wang J. Recent advances in quantitative and chemical proteomics for autophagy studies. Autophagy. 2017;13:1472‐1486. 10.1080/15548627.2017.1313944. [DOI] [PMC free article] [PubMed] [Google Scholar]
- 29. Zhao Y, Wang Q, Qiu G, et al. RACK1 promotes autophagy by enhancing the Atg14L‐Beclin 1‐Vps34‐Vps15 complex formation upon phosphorylation by AMPK. Cell Rep. 2015;13:1407‐1417. 10.1016/j.celrep.2015.10.011. [DOI] [PubMed] [Google Scholar]
- 30. Enrich C, Rentero C, Meneses‐Salas E, Tebar F, Grewal T. Annexins: Ca(2+) effectors determining membrane trafficking in the late endocytic compartment. Adv Exp Med Biol. 2017;981:351‐385. 10.1007/978-3-319-55858-5_14. [DOI] [PubMed] [Google Scholar]
- 31. Medina DL, Ballabio A. Lysosomal calcium regulates autophagy. Autophagy. 2015;11:970‐971. 10.1080/15548627.2015.1047130. [DOI] [PMC free article] [PubMed] [Google Scholar]
- 32. Jackle S, Beisiegel U, Rinninger F, et al. Annexin VI, a marker protein of hepatocytic endosomes. J Biol Chem. 1994;269:1026‐1032. [PubMed] [Google Scholar]
- 33. Pol A, Ortega D, Enrich C. Identification of cytoskeleton‐associated proteins in isolated rat liver endosomes. Biochem J. 1997;327(Pt 3):741‐746. 10.1042/bj3270741. [DOI] [PMC free article] [PubMed] [Google Scholar]
- 34. Zhang J, Wang J, Wong YK, et al. Docetaxel enhances lysosomal function through TFEB activation. Cell Death Dis. 2018;9:614 10.1038/s41419-018-0571-4. [DOI] [PMC free article] [PubMed] [Google Scholar]
- 35. Pfeffer S, Aivazian D. Targeting Rab GTPases to distinct membrane compartments. Nat Rev Mol Cell Biol. 2004;5:886‐896. 10.1038/nrm1500. [DOI] [PubMed] [Google Scholar]
- 36. Stenmark H. Rab GTPases as coordinators of vesicle traffic. Nat Rev Mol Cell Biol. 2009;10:513‐525. 10.1038/nrm2728. [DOI] [PubMed] [Google Scholar]
- 37. Nakatsu F, Ohno H. Adaptor protein complexes as the key regulators of protein sorting in the post‐Golgi network. Cell Struct Funct. 2003;28:419‐429. [DOI] [PubMed] [Google Scholar]
- 38. Ao X, Zou L, Wu Y. Regulation of autophagy by the Rab GTPase network. Cell Death Differ. 2014;21:348‐358. 10.1038/cdd.2013.187. [DOI] [PMC free article] [PubMed] [Google Scholar]
- 39. Lamb CA, Longatti A, Tooze SA. Rabs and GAPs in starvation‐induced autophagy. Small GTPases. 2016;7:265‐269. 10.1080/21541248.2016.1220779. [DOI] [PMC free article] [PubMed] [Google Scholar]
- 40. Ding X, Jiang X, Tian R, et al. RAB2 regulates the formation of autophagosome and autolysosome in mammalian cells. Autophagy. 2019;15:1774‐1786. 10.1080/15548627.2019.1596478. [DOI] [PMC free article] [PubMed] [Google Scholar]
- 41. Lamb CA, Nühlen S, Judith D, et al. TBC1D14 regulates autophagy via the TRAPP complex and ATG9 traffic. EMBO J. 2016;35:281‐301. [DOI] [PMC free article] [PubMed] [Google Scholar]
- 42. Puri C, Renna M, Bento CF, Moreau K, Rubinsztein DC. Diverse autophagosome membrane sources coalesce in recycling endosomes. Cell. 2013;154:1285‐1299. 10.1016/j.cell.2013.08.044. [DOI] [PMC free article] [PubMed] [Google Scholar]
- 43. Cornely R, Rentero C, Enrich C, Grewal T, Gaus K. Annexin A6 is an organizer of membrane microdomains to regulate receptor localization and signalling. IUBMB Life. 2011;63:1009‐1017. 10.1002/iub.540. [DOI] [PubMed] [Google Scholar]
- 44. Moreau K, Ghislat G, Hochfeld W, et al. Transcriptional regulation of Annexin A2 promotes starvation‐induced autophagy. Nat Commun. 2015;6:8045 10.1038/ncomms9045. [DOI] [PMC free article] [PubMed] [Google Scholar]
- 45. Xie Z, Klionsky DJ. Autophagosome formation: core machinery and adaptations. Nat Cell Biol. 2007;9:1102‐1109. 10.1038/ncb1007-1102. [DOI] [PubMed] [Google Scholar]
- 46. Mari M, Griffith J, Rieter E, Krishnappa L, Klionsky DJ, Reggiori F. An Atg9‐containing compartment that functions in the early steps of autophagosome biogenesis. J Cell Biol. 2010;190:1005‐1022. 10.1083/jcb.200912089. [DOI] [PMC free article] [PubMed] [Google Scholar]
- 47. Longatti A, Lamb CA, Razi M, Yoshimura S‐I, Barr FA, Tooze SA. TBC1D14 regulates autophagosome formation via Rab11‐ and ULK1‐positive recycling endosomes. J Cell Biol. 2012;197:659‐675. 10.1083/jcb.201111079. [DOI] [PMC free article] [PubMed] [Google Scholar]
- 48. Reggiori F, Tooze SA. Autophagy regulation through Atg9 traffic. J Cell Biol. 2012;198:151‐153. 10.1083/jcb.201206119. [DOI] [PMC free article] [PubMed] [Google Scholar]
- 49. Bonifacino JS, Traub LM. Signals for sorting of transmembrane proteins to endosomes and lysosomes. Annu Rev Biochem. 2003;72:395‐447. 10.1146/annurev.biochem.72.121801.161800. [DOI] [PubMed] [Google Scholar]
- 50. Rohn WM, Rouille Y, Waguri S, Hoflack B. Bi‐directional trafficking between the trans‐Golgi network and the endosomal/lysosomal system. J Cell Sci. 2000;113(Pt 12):2093‐2101. [DOI] [PubMed] [Google Scholar]
- 51. Imai K, Hao F, Fujita N, et al. Atg9A trafficking through the recycling endosomes is required for autophagosome formation. J Cell Sci. 2016;129:3781‐3791. 10.1242/jcs.196196. [DOI] [PubMed] [Google Scholar]
- 52. Lin‐Moshier Y, Keebler MV, Hooper R, et al. The two‐pore channel (TPC) interactome unmasks isoform‐specific roles for TPCs in endolysosomal morphology and cell pigmentation. Proc Natl Acad Sci U S A. 2014;111:13087‐13092. 10.1073/pnas.1407004111. [DOI] [PMC free article] [PubMed] [Google Scholar]
- 53. Huttlin EL, Ting L, Bruckner RJ, et al. The BioPlex network: a systematic exploration of the human interactome. Cell. 2015;162:425‐440. 10.1016/j.cell.2015.06.043. [DOI] [PMC free article] [PubMed] [Google Scholar]
- 54. Søreng K, Munson MJ, Lamb CA, et al. SNX18 regulates ATG9A trafficking from recycling endosomes by recruiting Dynamin‐2. EMBO Rep. 2018;19:e44837. [DOI] [PMC free article] [PubMed] [Google Scholar]
- 55. Ravikumar B, Moreau K, Jahreiss L, Puri C, Rubinsztein DC. Plasma membrane contributes to the formation of pre‐autophagosomal structures. Nat Cell Biol. 2010;12:747‐757. 10.1038/ncb2078. [DOI] [PMC free article] [PubMed] [Google Scholar]
- 56. Jung CH, Ro S‐H, Cao J, Otto NM, Kim Do‐H. mTOR regulation of autophagy. FEBS Lett. 2010;584:1287‐1295. 10.1016/j.febslet.2010.01.017. [DOI] [PMC free article] [PubMed] [Google Scholar]
- 57. Hosokawa N, Hara T, Kaizuka T, et al. Nutrient‐dependent mTORC1 association with the ULK1‐Atg13‐FIP200 complex required for autophagy. Mol Biol Cell. 2009;20:1981‐1991. 10.1091/mbc.E08-12-1248. [DOI] [PMC free article] [PubMed] [Google Scholar]
- 58. Mizushima N. The role of the Atg1/ULK1 complex in autophagy regulation. Curr Opin Cell Biol. 2010;22:132‐139. 10.1016/j.ceb.2009.12.004. [DOI] [PubMed] [Google Scholar]
- 59. Mendoza MC, Er EE, Blenis J. The Ras‐ERK and PI3K‐mTOR pathways: cross‐talk and compensation. Trends Biochem Sci. 2011;36:320‐328. 10.1016/j.tibs.2011.03.006. [DOI] [PMC free article] [PubMed] [Google Scholar]
- 60. Ma Li, Chen Z, Erdjument‐Bromage H, Tempst P, Pandolfi PP. Phosphorylation and functional inactivation of TSC2 by Erk implications for tuberous sclerosis and cancer pathogenesis. Cell. 2005;121:179‐193. 10.1016/j.cell.2005.02.031. [DOI] [PubMed] [Google Scholar]
- 61. Zhang J, Wang J, Ng S, Lin Q, Shen H‐M. Development of a novel method for quantification of autophagic protein degradation by AHA labeling. Autophagy. 2014;10:901‐912. 10.4161/auto.28267. [DOI] [PMC free article] [PubMed] [Google Scholar]
- 62. Polson HEJ, De Lartigue J, Rigden DJ, et al. Mammalian Atg18 (WIPI2) localizes to omegasome‐anchored phagophores and positively regulates LC3 lipidation. Autophagy. 2010;6:506‐522. 10.4161/auto.6.4.11863. [DOI] [PubMed] [Google Scholar]
- 63. Rink J, Ghigo E, Kalaidzidis Y, Zerial M. Rab conversion as a mechanism of progression from early to late endosomes. Cell. 2005;122:735‐749. 10.1016/j.cell.2005.06.043. [DOI] [PubMed] [Google Scholar]
- 64. Poteryaev D, Datta S, Ackema K, Zerial M, Spang A. Identification of the switch in early‐to‐late endosome transition. Cell. 2010;141:497‐508. 10.1016/j.cell.2010.03.011. [DOI] [PubMed] [Google Scholar]
- 65. Szatmári Z, Sass M. The autophagic roles of Rab small GTPases and their upstream regulators: a review. Autophagy. 2014;10:1154‐1166. 10.4161/auto.29395. [DOI] [PMC free article] [PubMed] [Google Scholar]
- 66. Corbier C, Sellier C. C9ORF72 is a GDP/GTP exchange factor for Rab8 and Rab39 and regulates autophagy. Small GTPases. 2017;8:181‐186. 10.1080/21541248.2016.1212688. [DOI] [PMC free article] [PubMed] [Google Scholar]
- 67. Popovic D, Dikic I. TBC1D5 and the AP2 complex regulate ATG9 trafficking and initiation of autophagy. EMBO Rep. 2014;15:392‐401. 10.1002/embr.201337995. [DOI] [PMC free article] [PubMed] [Google Scholar]
- 68. Takahashi Y, Meyerkord CL, Hori T, et al. Bif‐1 regulates Atg9 trafficking by mediating the fission of Golgi membranes during autophagy. Autophagy. 2011;7:61‐73. 10.4161/auto.7.1.14015. [DOI] [PMC free article] [PubMed] [Google Scholar]
- 69. Orsi A, Razi M, Dooley HC, et al. Dynamic and transient interactions of Atg9 with autophagosomes, but not membrane integration, are required for autophagy. Mol Biol Cell. 2012;23:1860‐1873. 10.1091/mbc.E11-09-0746. [DOI] [PMC free article] [PubMed] [Google Scholar]
- 70. Bader CA, Shandala T, Ng YS, Johnson IRD, Brooks DA. Atg9 is required for intraluminal vesicles in amphisomes and autolysosomes. Biol Open. 2015;4:1345‐1355. 10.1242/bio.013979. [DOI] [PMC free article] [PubMed] [Google Scholar]
- 71. Hanson PI, Cashikar A. Multivesicular body morphogenesis. Annu Rev Cell Dev Biol. 2012;28:337‐362. 10.1146/annurev-cellbio-092910-154152. [DOI] [PubMed] [Google Scholar]
- 72. Piper RC, Katzmann DJ. Biogenesis and function of multivesicular bodies. Annu Rev Cell Dev Biol. 2007;23:519‐547. 10.1146/annurev.cellbio.23.090506.123319. [DOI] [PMC free article] [PubMed] [Google Scholar]
- 73. Er EE, Mendoza MC, Mackey AM, Rameh LE, Blenis J. AKT facilitates EGFR trafficking and degradation by phosphorylating and activating PIKfyve. Sci Signal. 2013;6:ra45 10.1126/scisignal.2004015. [DOI] [PMC free article] [PubMed] [Google Scholar]
- 74. Eden ER, Huang F, Sorkin A, Futter CE. The role of EGF receptor ubiquitination in regulating its intracellular traffic. Traffic. 2012;13:329‐337. 10.1111/j.1600-0854.2011.01305.x. [DOI] [PMC free article] [PubMed] [Google Scholar]
- 75. Jung CH, Jun CB, Ro S‐H, et al. ULK‐Atg13‐FIP200 complexes mediate mTOR signaling to the autophagy machinery. Mol Biol Cell. 2009;20:1992‐2003. 10.1091/mbc.E08-12-1249. [DOI] [PMC free article] [PubMed] [Google Scholar]
- 76. Ganley IG, Lam DH, Wang J, Ding X, Chen S, Jiang X. ULK1.ATG13.FIP200 complex mediates mTOR signaling and is essential for autophagy. J Biol Chem. 2009;284:12297‐12305. 10.1074/jbc.M900573200. [DOI] [PMC free article] [PubMed] [Google Scholar]
- 77. Bento CF, Puri C, Moreau K, Rubinsztein DC. The role of membrane‐trafficking small GTPases in the regulation of autophagy. J Cell Sci. 2013;126:1059‐1069. 10.1242/jcs.123075. [DOI] [PubMed] [Google Scholar]
- 78. Li Li, Kim E, Yuan H, et al. Regulation of mTORC1 by the Rab and Arf GTPases. J Biol Chem. 2010;285:19705‐19709. 10.1074/jbc.C110.102483. [DOI] [PMC free article] [PubMed] [Google Scholar]
- 79. Van Der Vaart A, Griffith J, Reggiori F. Exit from the Golgi is required for the expansion of the autophagosomal phagophore in yeast Saccharomyces cerevisiae . Mol Biol Cell. 2010;21:2270‐2284. 10.1091/mbc.E09-04-0345. [DOI] [PMC free article] [PubMed] [Google Scholar]
- 80. Ravikumar B, Sarkar S, Davies JE, et al. Regulation of mammalian autophagy in physiology and pathophysiology. Physiol Rev. 2010;90:1383‐1435. 10.1152/physrev.00030.2009. [DOI] [PubMed] [Google Scholar]
- 81. Su W‐C, Chao T‐C, Huang Y‐L, Weng S‐C, Jeng K‐S, Lai MMC. Rab5 and class III phosphoinositide 3‐kinase Vps34 are involved in hepatitis C virus NS4B‐induced autophagy. J Virol. 2011;85:10561‐10571. 10.1128/JVI.00173-11. [DOI] [PMC free article] [PubMed] [Google Scholar]
Associated Data
This section collects any data citations, data availability statements, or supplementary materials included in this article.
Supplementary Materials
FIGURE S1 A, Hela cells with or without ANXA6 knockdown were treated with rapamycin (100 nM) to induce autophagy. Western blotting was performed to determine the levels of autophagy‐related proteins. B, as in A, cells were treated with rapamycin in the presence or absence of autophagy inhibitor CQ.
FIGURE S2. Knockdown of ANXA6 decreases the formation of autolysosomes. L929‐tfLC3 cells were first transfected with scrambled or ANXA6 siRNA for 48 h and then treated with rapamycin for 2 h. Confocal microscope was performed to determine the fluorescence intensity (scale bar 10 μm). The number of yellow puncta (GFP+RFP+) versus red puncta (GFP−RFP+) was calculated and statistically analyzed. * P < .05, ** P < .01
FIGURE S3. Analysis of ANXA6 targets function and involved pathways. A, GO analysis of the top regulated MF (molecular functions) of ANXA6 targets according to their ranking. B, KEGG analysis of top canonical pathways that the ANXA6 protein targets are significantly over‐represented. C, Representative RAB proteins were listed as target proteins of ANXA6 under normal condition.
FIGURE S4. Analysis of localization of ANXA6 in response to starvation. HeLa cells were starved in EBSS for 2 h starvation. The colocalization of ANXA6 with F‐actin was examined using confocal microscope (scale bar 10 µm).
FIGURE S5. ANXA6‐induced autophagy involves mTOR signaling pathway. SiHA cells were first transfected with scrambled or ANXA6 siRNA for 48 h and then starved for 2 h. Cells were harvested and lysed for western blotting. GAPDH served as loading control.
FIGURE S6. Knockdown of ANXA6 accelerates cervical cancer cell growth. A, HeLa cells with or without ANXA6 knockdown were under 24 h starvation. Cells were harvested and labeled with 5 μL Annexin V (Pacific Blue™) and cell fluorescence was measured by flow cytometry. * P < .05 B, Cell growth curves in ANXA6 knockdown cells were drawn with or without rapamycin treatment (200 nM). *** P < .001 C, SiHA cells with or without ANXA6 knockdown were treated with rapamycin. Cell proliferation was measured by CCK‐8 and statistically analyzed. * P < .05 ** P < .01 *** P < .001.
FIGURE S7. Restoration of ANXA6 expression leads to more cell death under starvation. A, HeLa cells with respective treatments were examined with an inverted microscope and morphological changes were photographed (scale bar 100 µm). B, Quantification of cell apoptosis in ANXA6 knockdown HeLa cells when ectopic expression of GFP‐ANXA6. Cells were starved in EBSS for 24 h and then labeled with Pacific Blue™ Annexin V for analysis. * P < .05 C, SiHA cells with ANXA6 knockdown were first restored the expression of ANXA6 and then transfected with the Atg7‐specific lentiviral shRNA. Cell proliferation was measured by CCK‐8 and statistically analyzed. * P < .05 ** P < .01 # P > .05
Supporting information
Supporting information
Data Availability Statement
Data available on request from the authors. The data that support the findings of this study are available from the corresponding author upon reasonable request.