

Abstract
Objective:
To serially evaluate health-related quality of life (HRQL) during the first year after community-acquired septic shock in children with pre-existing severe developmental disabilities, and explore factors associated with HRQL changes in these children.
Design:
Secondary analysis of the Life after Pediatric Sepsis Evaluation (LAPSE) investigation.
Setting:
Twelve academic pediatric intensive care units (PICU) in the United States.
Patients:
Children ≥1 month and <18 years old identified by their family caregiver (e.g., parent/guardian) as having severe developmental disability prior to septic shock.
Interventions:
Family caregivers completed the Stein-Jessop Functional Status II-R Short Form (FSII-R) as a measure of their child’s HRQL at baseline (reflecting pre-admission status), Day 7, and Month 1, 3, 6 and 12 following PICU admission. FSII-R scores were linearly transformed to a 0-100 scale with higher scores indicating better HRQL.
Measurements and Main Results:
Of 392 LAPSE participants, 137 were identified by their caregiver as having a severe developmental disability. Sixteen (11.6%) children with severe disability died during the 12 months following septic shock. Among 121 survivors, FSII-R scores declined from preadmission baseline to Day 7 (70.7 ± 16.1 vs 55.6 ± 19.2, p<0.001). FSII-R scores remained below baseline through Month 12 (59.1 ± 21.0, p<0.001 vs baseline). After adjusting for baseline FSII-R, the caregiver being a single parent/guardian was associated with lower Month 3 FSII-R scores (p=0.041). No other baseline child or caregiver characteristic, or critical illness-related factors were significantly associated with Month 3 FSII-R scores.
Conclusions:
HRQL among children with severe developmental disability remains, on average, below baseline during the first year following community-acquired septic shock. Children with severe disability and septic shock that are in single parent families are at increased risk. Clinical awareness of the potential for decline in HRQL among disabled children is essential to prevent this adverse outcome from being missed.
Keywords: Health-related quality of life, sepsis, septic shock, developmental disability, pediatric, child, infant
INTRODUCTION
Severe sepsis in children often leads to death or reduced functional status and health-related quality of life (HRQL) among survivors (1-8). Children with underlying comorbidities are at higher risk for developing severe sepsis than are otherwise healthy children. In the U.S., underlying neuromuscular conditions are the most frequent comorbidity predisposing to severe sepsis in children greater than one year of age (3,4). These conditions include seizures, cerebral palsy, and other developmental abnormalities. Data from the National Health Interview Survey estimates that one in six U.S. children between the ages of three and 17 years have a developmental disability (9). How children with developmental disability fare following an episode of severe sepsis has not been well described; however, among general pediatric intensive care unit (PICU) populations, children with developmental disabilities have been found to have worse quality of life after discharge than children with other chronic conditions or children who were previously healthy (10,11). Greater understanding of the consequences of severe sepsis for children with developmental disabilities, including the magnitude of change in HRQL and its trajectory, could guide rehabilitation and other supportive interventions for disabled children and their families.
The Life after Pediatric Sepsis Evaluation (LAPSE) was a multicenter, prospective, observational cohort study that longitudinally evaluated HRQL among children surviving community-acquired septic shock (5,12). Overall, 13% of LAPSE participants died during the first year following septic shock and 35% failed to regain their baseline HRQL. Within the LAPSE cohort, about a third of children were subjectively perceived by their family caregivers (e.g., parents/guardians) to have a severe physical or mental developmental disability prior to their sepsis event. Caregivers of these children chose to complete the Stein-Jessop Functional Status II-R Short Form (FSII-R) (13) as a measure of their child’s HRQL at baseline (reflecting pre-admission status) and at intervals throughout the subsequent year. Caregivers of children without severe disability completed the Pediatric Quality of Life Inventory 4.0 Generic Core Scales or Infant Scales (PedsQL™) (14-16). The FSII-R was used for children with severe developmental disability because the behaviorally-based items included in the FSII-R were considered more appropriate for disabled children than the PedsQL™ items. In this paper, we focus on the subset of LAPSE children evaluated using the FSII-R to gain further insight into HRQL for developmentally disabled children who experience community-acquired septic shock. Our objective was to serially evaluate HRQL during the first year after community-acquired septic shock in children perceived by their caregivers as having pre-existing severe developmental disabilities, and explore factors associated with HRQL changes in these children.
MATERIALS AND METHODS
Design and Setting
This study is a secondary analysis of the LAPSE investigation; details of LAPSE were previously published (5,12). Twelve academic PICUs in the U.S. recruited children between January 1, 2014 and June 30, 2017. The study was approved by the institutional review boards at all study sites and the Data Coordinating Center. Parental permission was obtained for all participants.
Participants
Children eligible for LAPSE were ≥1 month and <18 years old, and had documented or suspected infection with onset within 48 hours of hospital admission. Eligible children also had body fluid cultures and/or polymerase chain reaction (PCR) testing, displayed ≥2 systemic inflammatory response syndrome criteria including abnormal leukocyte count/differential and/or abnormal body temperature, and were treated with antimicrobials, vasoactive inotropes, and invasive or non-invasive mechanical ventilation (5,12). Exclusion criteria included inability to be enrolled within 48 hours of PICU admission; additional exclusion criteria have been published (5,12). LAPSE enrolled 392 children. Of these, family caregivers of 137 children subjectively perceived their child as having a severe physical or mental developmental disability at pre-admission baseline and are the subjects of this report.
Independent variables
At study enrollment, baseline child and caregiver/family data were collected. Child data included age, sex, race, ethnicity, presence of chronic comorbid conditions, functional status, severity of illness, organ dysfunction, immune deficiency and documented versus suspected infection. Chronic comorbid conditions were determined using data from the Pediatric Health Information System (17) and the Pediatric Medical Complexity Algorithm (18), and categorized as none/non-complex or complex chronic comorbid condition. Baseline functional status was assessed using the Functional Status Scale (19). The Functional Status Scale assesses function in 6 domains including mental, sensory, communication, motor, feeding and respiratory. Domain scores range from 1 (normal) to 5 (very severe dysfunction). Total scores range from 6-30 and were categorized as 6-7 (good), 8-9 (mildly abnormal), 10-15 (moderately abnormal), 16-21 (severely abnormal) and >21 (very severely abnormal). Baseline Functional Status Scale scores were assessed retrospectively by researchers using medical record review and caregiver interview. Severity of illness was assessed using the Pediatric Risk of Mortality (PRISM) score (20). Severity of organ dysfunction was assessed using the Pediatric Logistic Organ Dysfunction (PELOD-2) score (21). Documented infection was microbial growth on culture or positive PCR.
Caregiver/family data included caregiver education, marital status, baseline psychological distress, baseline family functioning and whether the child was insured through Medicaid. Caregiver psychological distress was assessed using the Brief Symptom Inventory (BSI-18) (22). The BSI is an 18-item measure that assesses somatization, depression and anxiety, and provides a Global Severity Index (GSI) representing the overall level of psychological distress. For this study, one item assessing suicidality was removed due to the lack of real time monitoring of survey responses, and inability to practicably address suicidality if it arose. BSI GSI scores are expressed as standardized t-scores. In community norms, the mean is 50 and standard deviation is 10. Standardized scores ≥63 represent clinically significant psychological distress. Family functioning was assessed using the General Functioning Scale of the Family Assessment Device (FAD), a 12-item measure (23). Overall mean scores of 2 or greater indicate unhealthy family functioning.
During the PICU course, Vasoactive Inotropic Scores (24) and use of mechanical ventilation were collected at 08:00 and 20:00 daily. Additional daily data included the presence of abnormal neurologic findings on physical examination (i.e., anisocoria or absence of pupillary response, pathologic breathing pattern, stereotypic or flaccid posture, and autonomic storming), seizure activity or abnormal electroencephalogram, new anoxic-ischemic injury on brain imaging, treatment for increased intracranial pressure, neurologic injury suspected by healthcare provider, PELOD-2 scores, occurrence of cardiac arrest, and treatment with red blood cell transfusion, extracorporeal membrane oxygenation, or renal replacement therapy. Sum of PELOD-2 scores during the PICU stay was used to reflect the severity and duration of organ dysfunction. Length of stay in PICU and hospital were also recorded.
Outcomes
Children’s HRQL was assessed by their caregivers using the Stein-Jessop Functional Status II-R Short Form (FSII-R) (13) at study entry (reflecting baseline pre-admission status), Day 7, and Month 1, 3, 6 and 12 following PICU admission. The FSII-R Short Form is a 14-item measure of behaviorally-based functional status applicable across the pediatric age span. Items address communication, mood, energy, eating, sleep, responsiveness, and attention. Caregivers indicated how often their child exhibited the behavior described in each item on a 3-point scale (0 = never or rarely, 1 = some of the time, 2 = almost always). Total FSII-R scores were linearly transformed to a 0-100 scale with higher scores indicating better HRQL. HRQL assessments were facilitated by researchers at the study sites during the hospitalization and by the Seattle Children’s Research Institute after the child’s discharge.
Statistical Analysis
Child and caregiver/family characteristics were summarized with counts and percentages for categorical variables, and median, first quartile, and third quartile for continuous variables. In order to show the FSII-R trajectory for children surviving to Month 12, the mean response at each time point was reported for the total score and each of the 14 items on the FSII-R. The mean response at follow-up time points was compared to the mean response at pre-admission baseline using paired t-tests to account for repeated measures on the same children. Ordinary linear regression was used to evaluate the association of baseline factors and hospitalization characteristics with total FSII-R score at Month 3. The regression model included children who survived to Month 3 and controlled for baseline FSII-R. Controlling for pre-admission baseline, rather than explicitly modeling the change from baseline, allowed the model to more appropriately account for children with higher baseline FSII-R having, on average, a larger absolute reduction in FSII-R following hospitalization for septic shock.
A post-hoc exploratory analysis of the main LAPSE cohort was performed to assess whether the exposure effect (developmentally disabled and non-developmentally disabled) varied across variables identified as independent predictors of Month 3 FSII-R. PedsQL rather than FSII-R was measured in non-developmentally disabled children. For this analysis, FSII-R and PedsQL were treated as equivalent.
To account for potential bias due to loss to follow-up, multiple imputation was used to impute missing data. FSII-R scores were imputed for 1% of 12-month survivors at baseline, 17% at Day 7, 31% at Month 1, 36% at Month 3, 40% at Month 6 and 47% at Month 12. Missing values were imputed according to distributions determined from linear regression models based on baseline data, hospitalization data, and all observed outcomes including FSII-R obtained at other time points (25). Missing values were imputed 50 separate times, leading to 50 unique cohort datasets to analyze. All analyses were conducted separately on each of the 50 datasets, and the results were combined with the SAS MIANALYZE procedure to provide a single p-value and/or confidence interval for each analysis. This multiple imputation approach was used in order to make full use of the available data and to attempt to reduce the bias that would result if subjects without a follow-up at a specific time point were excluded from analysis. The extent to which this bias can be reduced depends on the assumption that data are missing at random. After controlling for baseline subject and clinical data as well as survey responses at other time points, if families of subjects with worse HRQL were less likely to respond to surveys, then long term HRQL is actually lower than our estimates suggest. Observed patterns of missing outcome data are displayed in Supplemental Digital Content 1.
All analyses were performed using SAS 9.4 (SAS Institute; Cary, NC). Imputation was done with the IMPUTE module of IVEWare for SAS using fully conditional specification and 10 iterations between imputations. All p-values were based on a two-sided alternative with values of <0.05 considered significant.
RESULTS
Of 137 children perceived by their caregiver to have severe developmental disability prior to their sepsis event, 74 (54.0%) were male, 84 (61.0%) were White, and 26 (19.0%) were <2 years old (Table 1). One hundred and twenty-three (89.8%) had at least mildly abnormal functional status at baseline as assessed by Functional Status Scale, and 107 (78.1%) had a complex chronic comorbid condition. Sum of PELOD-2 scores during the child’s PICU stay was 62.0 (33.0, 96.0) and PICU length of stay was 11.1 days (5.9, 16.3). Of 137 caregivers, 52 (38.1%) were a single parent/guardian. At baseline, 28 (20.5%) reported clinically significant psychological distress, and 38 (27.7%) reported unhealthy family functioning.
Table 1.
Child, Caregiver and Family Characteristics
| Characteristics | Overall (N = 137) |
|---|---|
| Child characteristics at pre-admission baseline | |
| Age | |
| 0-12 months | 14 (10.2%) |
| 13-24 months | 12 (8.8%) |
| 2-4 years | 27 (19.7%) |
| 5-7 years | 14 (10.2%) |
| 8-12 years | 30 (21.9%) |
| 13-17 years | 40 (29.2%) |
| Male | 74 (54.0%) |
| Race | |
| White | 84 (61.0%) |
| Black or African American | 34 (24.5%) |
| Other | 20 (14.6%) |
| Hispanic or Latino | 26 (18.6%) |
| Complex chronic comorbid condition(s)a | 107 (78.1%) |
| FSS total scoreb | |
| Good | 14 (10.2%) |
| Mildly abnormal | 16 (11.7%) |
| Moderately abnormal | 67 (48.9%) |
| Severely abnormal | 34 (24.8%) |
| Very severely abnormal | 6 (4.4%) |
| FSS componentsb | |
| Normal communication | 31 (22.6%) |
| Normal feeding | 34 (24.8%) |
| Normal mental status | 54 (39.4%) |
| Normal motor function | 31 (22.6%) |
| Normal respiratory | 74 (54.0%) |
| Normal sensory | 75 (54.7%) |
| Child characteristics at study enrollment | |
| Nature of infection | |
| Documentedc | 57 (41.6%) |
| Suspected | 80 (58.4%) |
| Immunocompromised | 25 (18.2%) |
| Overall PRISM scored | 12.0 [7.0, 17.0] |
| Child characteristics on study | |
| Sum of PELOD during PICU staye,f | 62.0 [33.0, 96.0] |
| Highest vasoactive inotropic score during PICU stayf | |
| None | 8 (5.8%) |
| 1 - 20 | 96 (70.1%) |
| > 20 | 33 (24.1%) |
| Abnormal neurologic exam findingg | 33 (24.1%) |
| Seizure activity and or abnormal EEGh | 37 (27.0%) |
| New anoxic-ischemic injury on CT/MRI imagingi | 8 (5.8%) |
| Treatment for increased intracranial pressure | 4 (2.9%) |
| Neurologic injury suspected by care provider | 16 (11.7%) |
| ECMO during PICU stayf,j | 3 (2.2%) |
| Renal replacement therapy during PICU stayf | 10 (7.3%) |
| Cardiopulmonary arrest or chest compressions | 8 (5.8%) |
| Number of mechanical ventilator days | 10.0 [5.0, 16.0] |
| PRBC transfusion during PICU stayf,k | 58 (42.3%) |
| PICU length of stay (days)f | 11.1 [5.9, 16.3] |
| Hospital length of stay (days) | 17.5 [10.6, 26.0] |
| Caregiver and family characteristics at pre-admission baseline | |
| Caregiver education | |
| High school grad, GED, or lessl | 41 (29.9%) |
| Vocational school, some college, or 2-year degree | 43 (31.4%) |
| College degree or beyond | 53 (38.7%) |
| Annual household income | |
| Less than $30,000 | 45 (33.2%) |
| $30,000 to less than $50,000 | 30 (21.8%) |
| $50,000-100,000 | 40 (29.5%) |
| $100,000 or more | 21 (15.5%) |
| Single parent/guardian caregiver | 52 (38.1%) |
| Child insured through state Medicaid | 87 (63.3%) |
| Standardized BSI-GSIm | 54.0 [47.1, 62.0] |
| Psychological distress (BSI-GSI ≥ 63)m | 28 (20.5%) |
| Unhealthy family functioning (FAD ≥ 2)n | 38 (27.7%) |
Data are summarized as n (%) and Median (IQR].
Assessed according to the Pediatric Medical Complexity Algorithm and determined using ICD 9/10 diagnosis codes up to three years prior the PICU sepsis admission.
FSS, Functional Status Scale.
Microbial growth on culture or positive polymerase chain reaction testing.
PRISM, Pediatric Risk of Mortality score. PRISM data were collected during a modified period of 2 hours prior PICU admission through 4 hours post PICU admission.
PELOD-2, Pediatric Logistic Organ Dysfunction score. Sum of PELOD-2 refers to the summation of daily scores while in the PICU (truncated at 28 calendar days following ICU admission).
PICU, pediatric intensive care unit.
Abnormal neurologic exam findings include anisocoria or absence of pupillary response, pathologic breathing pattern, stereotypic posturing, flaccid posture, and autonomic storming.
EEG, electroencephalogram.
CT/MRI, computerized tomography/magnetic resonance imaging.
ECMO, extracorporeal membrane oxygenation.
PRBC, packed red blood cells.
GED, General Education Diploma.
BSI-GSI, Brief Symptom Inventory 18 - Global Severity Index.
FAD, Family Assessment Device.
Sixteen (11.6%) children died during the 12 months following their presentation with septic shock. Among the 121 survivors, total FSII-R scores significantly declined from preadmission baseline to Day 7 (Table 2, Figure 1). Total FSII-R scores showed some improvement by Month 1 but remained below baseline through Month 12. Eleven of the 14 individual FSII-R items (Table 2) were significantly worse than preadmission baseline by Day 7; only one (sleeps through the night) remained significantly different by Month 1. Individual FSII-R item scores at baseline, Month 3 and Month 12 are graphically displayed in Figure 2.
Table 2.
Stein-Jessop Functional Status II-R Short Form Total and Item Scores over Time
| FSII-R total and item scoresa,b,c | Pre-admission baseline |
Day 7 | Month 1 | Month 3 | Month 6 | Month 12 |
|---|---|---|---|---|---|---|
| Total FSII-R scorea | 70.7 ± 16.1 |
55.6 ± 19.2 p = <.001 |
64.9 ± 18.4 p = 0.010 |
62.0 ± 21.3 p = 0.006 |
62.9 ± 21.0 p = 0.004 |
59.1 ± 21.0 p = <.001 |
| Positive items | ||||||
| Eats well | 1.5 | 1.1 | 1.3 | 1.3 | 1.3 | 1.3 |
| Sleeps well | 1.5 | 1.2 | 1.4 | 1.2 | 1.4 | 1.2 |
| Sleeps through the night | 1.4 | 1.1 | 1.2 | 1.2 | 1.3 | 1.1 |
| Content | 1.6 | 1.0 | 1.4 | 1.3 | 1.4 | 1.3 |
| Communicates what s/he wants | 1.1 | 0.8 | 1.2 | 1.1 | 1.0 | 1.1 |
| Occupies him/herself | 1.3 | 0.9 | 1.2 | 1.1 | 1.1 | 1.2 |
| Lively and energetic | 1.2 | 0.8 | 1.2 | 1.1 | 1.2 | 0.9 |
| Responds to parent attention | 1.6 | 1.3 | 1.6 | 1.5 | 1.5 | 1.4 |
| Interested in what is going on around | 1.4 | 1.1 | 1.4 | 1.4 | 1.3 | 1.3 |
| Negative items | ||||||
| Moody | 1.3 | 1.2 | 1.1 | 1.1 | 1.0 | 1.2 |
| Sick and tired | 1.2 | 0.9 | 1.3 | 1.2 | 1.2 | 1.0 |
| Irritable and cross | 1.6 | 1.3 | 1.3 | 1.4 | 1.3 | 1.3 |
| Unusually difficult | 1.6 | 1.5 | 1.5 | 1.4 | 1.5 | 1.3 |
| Reacts to little things by crying | 1.5 | 1.3 | 1.2 | 1.1 | 1.2 | 1.0 |
FSII-R = Stein-Jessop Functional Status II-R Short Form.
This table is based on survivors to 12 months (N = 121) including imputation of missing data. Statistics presented are means and standard deviations for Total FSII-R Score and means for individual items. Individual positive items are scored as 0 = never or rarely, 1 = some of the time, 2 = almost always. Negative items are reverse scored as 0 = almost always, 1 = some of the time, 2 = never or rarely. The range of individual items is therefore 0 – 2, with higher numbers representing better status.
P-values for Total FSII-R are based on a paired t-test and demonstrate that average Total FSII-R worsens from baseline by Day 7 and does not recover by Month 12.
Figure 1.
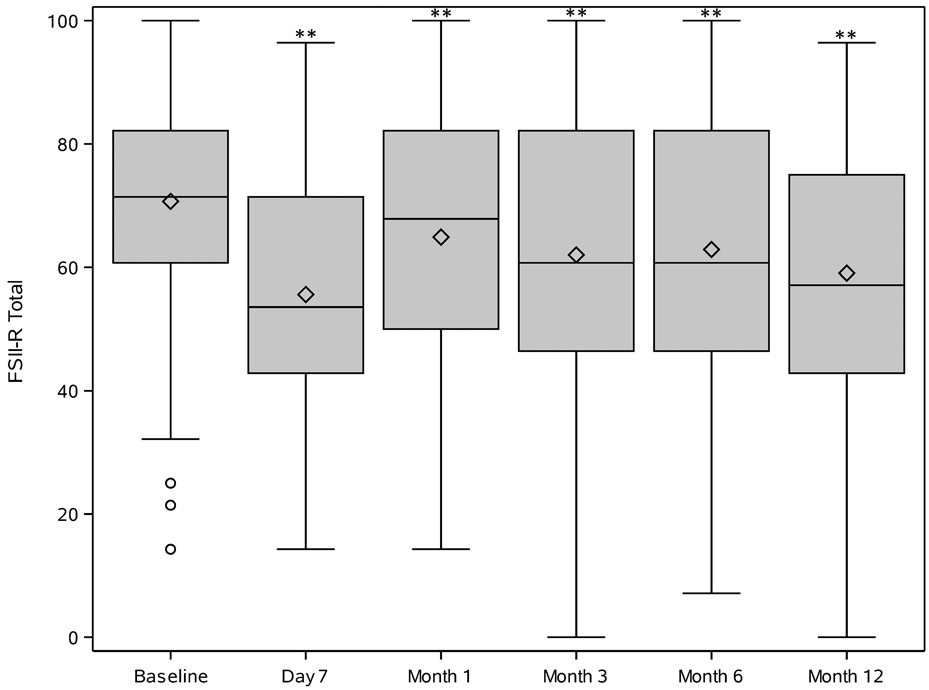
Trajectory of Stein-Jessop Functional Status II-R Short Form (FS II-R) Scores at pre-illness baseline, day 7, and month 1, 3, 6 and 12 following PICU admission for community-acquired septic shock in children perceived by family caregiver to have pre-existing severe developmental disability. For each time point, median [Q1, Q3] is displayed as a box with Q1 – (1.5 x IQR) and Q3 + (1.5 X IQR) as lines below and above each box. The diamond in the box is the mean. Circles outside the box are outliers. Asterisks represent a statistically significant difference (p<0.01) from pre-illness baseline.
Figure 2.
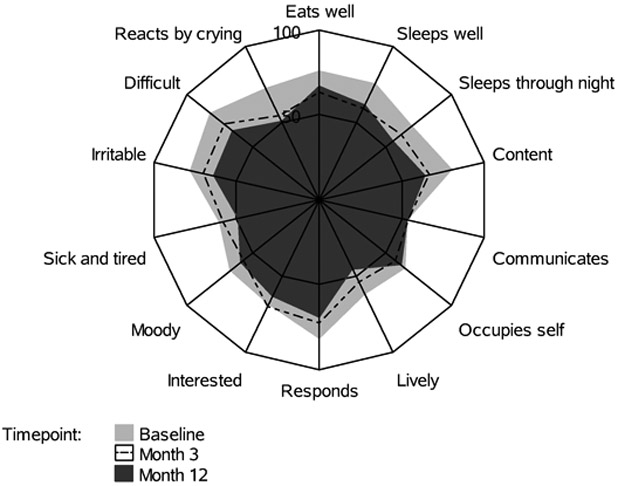
Radar plot of Stein-Jessop Functional Status II-R Short Form (FS II-R) Item Scores at pre-illness baseline, Month 3 and Month 12 following PICU admission for community-acquired septic shock in children perceived by family caregiver to have pre-existing severe developmental disability. Each spoke represents an FSII-R item. The length of the spoke is the mean for the item. Item scores were linearly transformed to a 0-100 scale and negative items were reverse scored so that higher scores for all items indicate better wellbeing.
Associations between child/caregiver characteristics and FSII-R scores at Month 3 adjusted for baseline FSII-R are shown in Supplemental Digital Content 2. The caregiver being a single parent/guardian was associated with lower Month 3 FSII-R scores (p = 0.041). No other baseline child or caregiver characteristic, or critical illness-related factors were significantly associated with Month 3 FSII-R scores. Interaction between developmental status and single parenthood (p = 0.034) demonstrated that the association of single parenthood with Month 3 outcome was unique to the developmentally disabled cohort.
DISCUSSION
HRQL is a multidimensional concept that includes physical, mental, emotional and social functioning, and focuses on the impact of health status on quality of life (26-30). Subjective assessment of one’s own functional abilities is an important aspect of HRQL; however, in the case of children with severe developmental disability, self-report may not be possible due to the child’s limited understanding or reduced communication skills. Using proxy-reporting by family caregivers, we found that overall HRQL among children with severe developmental disability remained, on average, below baseline during the first year following community-acquired septic shock. As previously reported for the entire LAPSE cohort, 35% of all surviving children failed to return to their baseline HRQL by one year when return to baseline was defined as being within 4.5 points of baseline (the minimal clinically important difference for the PedsQL™) (5,14). This included 38% of children without severe pre-existing disability and 31% with severe pre-existing disability suggesting a somewhat lower proportion of children with pre-existing disability fail to regain their baseline HRQL (5). These findings are important because they demonstrate that depression in HRQL after community-acquired septic shock is not confined to previously healthy children but also applies to children with disabilities. Clinical awareness of the potential for decline in HRQL among disabled children is essential to prevent this adverse outcome from being missed.
Children included in this study were subjectively identified as having severe developmental disability prior to the sepsis event by their family caregiver rather than by objective assessment. However, functional status based on Functional Status Scale scores was collected at enrollment to retrospectively assess each child’s baseline functional status. Almost 90% had at least mildly abnormal functional status with impairments in communication, feeding and motor function being most common. A minority of children (10%) subjectively perceived by their caregivers as having severe developmental disability had good baseline functional status on Functional Status Scale scoring. Despite their subjective perception of severe disability, caregivers of these children may have minimized their child’s functional impairments when reporting on characteristics included in individual Functional Status Scale domains. Caregivers may also have based their subjective perceptions of severe disability on factors not fully covered in the Functional Status Scale such as emotional or social functioning. Alternatively, very minimal functional impairments based on Functional Status Scale scoring may have had a large impact on the child/caregiver/family’s daily life and were therefore considered a severe disability from the caregiver’s perspective.
About 20% of family caregivers included in our study were found to have clinically significant psychological distress at baseline prior to their child’s sepsis event, and 27.7% had unhealthy family functioning. BSI scores at or above the cut-off of 63 are observed in 9% of a normative population (22); thus, the percentage of caregivers with significant psychological distress reported in our study is about double the norm. Unhealthy family functioning assessed using the General Functioning Scale of the FAD has previously been reported to range from 22% - 32% in families of children with chronic conditions, and as 24% in families of healthy children (31). Unhealthy family functioning reported in our study fell within this range. The effects of long-term informal caring for a child with disability on caregivers’ psychological health have been well documented (32-35). Caregivers have related the stress associated with caring for a disabled child to the unpredictable and uncontrollable nature of their situation, inadequate time for self-care and completion of daily tasks, frequent professional appointments and a need to coordinate services, a need to continuously advocate for their child, chronic fatigue, physical pain, social isolation, financial burdens, and unrelenting concern about their child’s future. Family functioning may also be adversely affected by caring for a child with disability, especially if caregivers have little time or energy to focus on the needs of other family members (32). Positive aspects of caregiving have also been described and include satisfaction with caring for another, increased compassion, personal growth, and development of new social networks (32,33).
Several baseline child and caregiver/family characteristics as well as hospitalization characteristics were evaluated for possible associations with the child’s Month 3 HRQL. Month 3 HRQL was selected as the outcome for these analyses because the majority of children were discharged from the hospital by this time and little change in HRQL occurred between Month 3 and the end of the follow-up period. In addition, more data was missing at the later time points. Being a single parent/guardian was associated with worse HRQL for the child. This finding is consistent with previous studies suggesting that single parenthood impacts caregivers’ ability to cope and is a risk factor for reduced quality of life among both caregivers and children with disabilities (34,36-38). Reduced coping may impact caregivers’ ability to care for their recovering child. Resources and support for strengthening caregiving skills and coping early after septic shock, especially for single parent families, may help reduce the burden on caregivers, thereby improving HRQL for caregivers and children (38).
Strengths of this study include the multicenter, prospective, longitudinal design. Limitations include the high loss to follow-up and the resulting need for data imputation to minimize potential bias in the reported results. The FSII-R was used to approximate HRQL; however, it may not cover all aspects of HRQL for children with disabilities, many of whom face unique challenges (39). Proxy-reporting for the FSII-R is also a limitation; how children with severe developmental disability perceive their own HRQL is unknown. Reference norms are not available for the FSII-R; however, comparison to baseline values better delineates the change in HRQL attributable to septic shock (40). Children included in this study had a high rate of complex chronic comorbid conditions. This may be expected because complex chronic comorbid conditions may contribute to developmental disabilities as well as increase sepsis risk (3,4). It is possible that the observed decline in HRQL may in part be related to deterioration in children’s functioning due to their underlying conditions rather than septic shock. The suicidality item was not included in the BSI potentially altering the scores. Other clinical characteristics that were not evaluated in our cohort may be potential predictors of HRQL following community-acquired septic shock in children with severe developmental disabilities. This study is a post-hoc exploratory secondary analysis and was not controlled for multiple testing so results should be interpreted with caution.
CONCLUSIONS
HRQL among children with severe developmental disability remains, on average, below baseline during the first year following community-acquired septic shock. Among children with severe disability and septic shock, single parenthood contributes to increased risk of reduced HRQL. Caregiver support offered early after septic shock may be most beneficial as most recovery in HRQL appears to occur within 3 months.
Supplementary Material
Supplemental Digital Content 1.
Title: Longitudinal Survey Response Patterns.
Description: This table displays the observed patterns of missingness for outcome data. An X appears at time points for which a survey response was received. The count and percentage represent the number and percentage of subjects in the cohort with the responses indicated in the row.
Supplemental Digital Content 2.
Title: Models of Month 3 Stein-Jessop Functional Status II-R Short Form Scores Adjusted for Baseline Score
Description: This table displays univariable models of Month 3 Stein-Jessop Functional Status II-R Short Form Scores Adjusted for Baseline Score. The table is based on survivors to 3 months (N = 128) with 3 month data imputed for 36%. Effect refers to the coefficient for each characteristic as a predictor in a linear regression model controlling for baseline FSII-R.
ACKNOWLEDGMENTS
We thank all subjects and families for participating in the LAPSE investigation.
Following is a summary of LAPSE Performance Sites, Principal Investigators (PI), Co-investigators (CI), Research Coordinators (RC), and Allied Research Personnel.
Children’s Hospital of Michigan, Detroit, MI: Kathleen L. Meert (PI); Sabrina Heidemann (CI); Ann Pawluszka (RC); Melanie Lulic (RC).
Children’s Hospital of Philadelphia, Philadelphia, PA: Robert A Berg (PI); Athena Zuppa (CI); Carolann Twelves (RC); Mary Ann DiLiberto (RC).
Children’s National Hospital, Washington, DC: Murray Pollack (PI); David Wessel (PI); John Berger (CI); Elyse Tomanio (RC); Diane Hession (RC); Ashley Wolfe (RC).
Children’s Hospital of Colorado, Aurora, CO: Peter Mourani (PI); Todd Carpenter (CI); Diane Ladell (RC); Yamila Sierra (RC); Alle Rutebemberwa (RC); Ruth Grosskreuz (RC).
Nationwide Children’s Hospital, Columbus, OH: Mark Hall (PI); Andrew Yates (CI); Lisa Steele (RC); Maggie Flowers (RC); Josey Hensley (RC).
Mattel Children’s Hospital, University of California Los Angeles, Los Angeles, CA: Anil Sapru (PI); Rick Harrison (CI), Neda Ashtari (RC); Anna Ratiu (RC).
Children’s Hospital of Pittsburgh, University of Pittsburgh Medical Center, Pittsburgh, PA: Joe Carcillo (PI); Michael Bell (CI); Leighann Koch (RC); Alan Abraham (RC).
Benioff Children’s Hospital, University of California, San Francisco, San Francisco, CA: Patrick McQuillen (PI); Anne McKenzie (RC); Yensy Zetino (RC).
Children’s Hospital Los Angeles, Los Angeles, CA: Christopher Newth (PI); Jeni Kwok (RC); Amy Yamakawa (RC).
CS Mott Children’s Hospital, University of Michigan, Ann Arbor, MI: Michael Quasney (PI); Thomas Shanley (CI); CJ Jayachandran (RC).
Cincinnati Children’s Hospital Medical Center, Cincinnati, OH: Ranjit S. Chima (PI); Hector Wong (CI); Kelli Krallman (RC); Erin Stoneman (RC); Laura Benken (RC); Toni Yunger (RC).
Seattle Children’s Hospital, Seattle Children’s Research Institute (LAPSE Follow-up Center), University of Washington, Seattle, WA: Jerry J Zimmerman (PI); Catherine Chen (RC); Erin Sullivan (RC); Courtney Merritt (RC); Deana Rich (RC); Julie McGalliard (Programmer); Wren Haaland (Data Specialist); Kathryn B. Whitlock, Derek Salud (RC).
University of Utah (LAPSE Data Coordinating Center), Salt Lake City, UT: J Michael Dean (PI); Richard Holubkov (CI); Whit Coleman (RC); Samuel Sorenson (RC); Ron Reeder (Statistician); Russell Banks (Statistician); Andrew Nicklawsky (Statistician); Angie Webster(Statistician); Jeri Burr (Director); Stephanie Bisping (RC); Teresa Liu (RC); Emily Stock (Administrative Program Coordinator); Kristi Flick (Clinical Data Manager).
Texas A&M University, College Station, TX: James Varni (CI).
Financial Support: This investigation was funded by the Eunice Kennedy Shriver National Institute of Child Health and Human Development, National Institutes of Health, Department of Health and Human Services, R01HD073362, and was supported, in part, by the following cooperative agreements associated with the Collaborative Pediatric Critical Care Research Network: UG1HD050096, UG1HD049981, UG1HD049983, UG1HD063108, UG1HD083171, UG1HD083166, UG1HD083170, U10HD050012, U10HD063106, and U01HD049934.
Footnotes
Copyright form disclosure: Drs. Meert, Reeder, Berg, Hall, Mourani, Holubkov, and Dean’s institutions received funding from the National Institutes of Health (NIH). Drs. Meert, Reeder, Maddux, Banks, Berg, Newth, Hall, Carcillo, McQuillen, Mourani, Chima, Holubkov, Sorenson, Dean, and Zimmerman received support for article research from the NIH. Drs. Maddux, Banks, Carcillo, McQuillen, Sorenson, and Zimmerman’s institutions received funding from the National Institute of Child Health and Human Development. Dr. Maddux’s institution received funding from Francis Family Foundation (Parker B Francis Fellowship). Drs. Banks and Sorenson disclosed government work. Dr. Newth received funding from Philips Research North America and Hamilton Medical AG. Dr. Hall received funding from La Jolla Pharmaceuticals. Dr. Holubkov received funding from Pfizer (DSMB), Physicians Committee for Responsible Medicine (biostatistical consulting), Medimmune (DSMB), DURECT Corporation (biostatistical consulting), and REVANCE (DSMB). Dr. McGalliard disclosed work for hire. Dr. Zimmerman’s institution received funding from Immunexpress and Elsevier Publishing (royalties), and he received funding from the Society of Critical Care Medicine (travel reimbursment). Dr. Quasney disclosed that he does not have any potential conflicts of interest.
REFERENCES
- 1.Weiss SL, Fitzgerald JC, Pappachan J, et al. : Global epidemiology of pediatric severe sepsis: the sepsis prevalence, outcomes, and therapies study. Am J Respir Crit Care Med 2015. May 15;191:1147–1157 [DOI] [PMC free article] [PubMed] [Google Scholar]
- 2.Ruth A, McCracken CE, Fortenberry JD, et al. : Pediatric severe sepsis: current trends and outcomes from the Pediatric Health Information Systems database. Pediatr Crit Care Med 2014; 15:828–838 [DOI] [PubMed] [Google Scholar]
- 3.Hartman ME, Linde-Zwirble WT, Angus DC, et al. : Trends in the epidemiology of pediatric severe sepsis. Pediatr Crit Care Med 2013; 14:686–693 [DOI] [PubMed] [Google Scholar]
- 4.Watson RS, Carcillo JA, Linde-Zwirble WT, et al. : The epidemiology of severe sepsis in children in the United States. Am J Respir Crit Care Med 2003; 167:695–701 [DOI] [PubMed] [Google Scholar]
- 5.Zimmerman JJ, Banks R, Berg RA, et al. : Trajectory of mortality and health related quality of life morbidity following community–acquired pediatric septic shock. Crit Care Med 2020; 48:329–337 [DOI] [PMC free article] [PubMed] [Google Scholar]
- 6.Killien EY, Farris RWD, Watson RS, et al. : Health-related quality of life among survivors of pediatric sepsis. Pediatr Crit Care Med 2019; 20:501–509 [DOI] [PMC free article] [PubMed] [Google Scholar]
- 7.Syngal P, Giuliano JS: Health-related quality of life after pediatric severe sepsis. Healthcare 2018; 6(3):113. [DOI] [PMC free article] [PubMed] [Google Scholar]
- 8.Farris RW, Weiss NS, Zimmerman JJ: Functional outcomes in pediatric severe sepsis: further analysis of the researching severe sepsis and organ dysfunction in children: a global perspective trial. Pediatr Crit Care Med 2013; 14:835–842 [DOI] [PMC free article] [PubMed] [Google Scholar]
- 9.Zablotsky B, Black LI, Maenner MJ, et al. : Prevalence and trends of developmental disabilities among children in the United States: 2009–2017. Pediatrics 2019; 144:e20190811. [DOI] [PMC free article] [PubMed] [Google Scholar]
- 10.Mestrovic J, Kardum G, Sustic A, et al. : Neurodevelopmental disabilities and quality of life after intensive care treatment. J Paediatr Child Health 2007; 43:673–676 [DOI] [PubMed] [Google Scholar]
- 11.Polic B, Mestrovic J, Markic J, et al. : Long-term quality of life of patients treated in paediatric intensive care unit. Eur J Pediatr 2013; 172:85–90 [DOI] [PubMed] [Google Scholar]
- 12.Zimmerman JJ, Banks R, Berg RA, et al. : Critical illness factors associated with long-term mortality and health related quality of life morbidity following community–acquired pediatric septic shock. Crit Care Med 2020; 48:319–328 [DOI] [PMC free article] [PubMed] [Google Scholar]
- 13.Stein RE, Jessop DJ: Functional status II(R). A measure of child health status. Med Care 1990; 28:1041–1055 [DOI] [PubMed] [Google Scholar]
- 14.Varni JW, Burwinkle TM, Seid M, et al. : The PedsQL 4.0 as a pediatric population health measure: feasibility, reliability, and validity. Ambul Pediatr 2003; 3:329–341 [DOI] [PubMed] [Google Scholar]
- 15.Aspesberro F, Fesinmeyer MD, Zhou C, et al. : Construct validity and responsiveness of the Pediatric Quality of Life Inventory 4.0 Generic Core Scales and Infant Scales in the PICU. Pediatr Crit Care Med 2016; 17:e272–279 [DOI] [PubMed] [Google Scholar]
- 16.Varni JW, Limbers CA, Neighbors K, et al. : The PedsQL Infant Scales: Feasibility, internal consistency reliability, and validity in healthy and ill infants. Qual Life Res 2011; 20:45–55 [DOI] [PubMed] [Google Scholar]
- 17.Children’s Hospital Association Pediatric Health Information System. Available at: https://www.childrenshospitals.org/Programs-and-Services/Data-Analytics-and-Research/Pediatric-Analytic-Solutions/Pediatric-Health-Information-System Accessed February 17, 2020
- 18.Simon TD, Cawthon ML, Stanford S, et al. : Pediatric medical complexity algorithm: A new method to stratify children by medical complexity. Pediatrics 2014; 133:e1647–1654 [DOI] [PMC free article] [PubMed] [Google Scholar]
- 19.Pollack MM, Holubkov R, Glass P, et al. : Functional Status Scale: New pediatric outcome measure. Pediatrics 2009; 124:e18–e28 [DOI] [PMC free article] [PubMed] [Google Scholar]
- 20.Pollack MM, Holubkov R, Funai T, et al. The Pediatric Risk of Mortality score: Update 2015. Pediatr Crit Care Med 2016;17:2–9 [DOI] [PMC free article] [PubMed] [Google Scholar]
- 21.Leteurtre S, Duhamel A, Salleron J, et al. : PELOD-2: An update of the PEdiatric Logistic Organ Dysfunction score. Crit Care Med 2013; 41:1761–1773 [DOI] [PubMed] [Google Scholar]
- 22.Derogatis LR: Brief Symptom Inventory (BSI-18): Administration, scoring and procedures manual. Minneapolis, MN, NCS Pearson, 2001 [Google Scholar]
- 23.Boterhoven de Haan KL, Hafekost J, Lawrence D, et al. : Reliability and validity of a short version of the general functioning subscale of the McMaster Family Assessment Device. Fam Process 2015; 54:116–123 [DOI] [PubMed] [Google Scholar]
- 24.McIntosh AM, Tong S, Deakyne SJ, et al. : Validation of the Vasoactive-Inotropic Score in pediatric sepsis. Pediatr Crit Care Med 2017; 18:750–757 [DOI] [PMC free article] [PubMed] [Google Scholar]
- 25.Sterne JA, White IR, Carlin JB, et al. : Multiple imputation for missing data in epidemiologic and clinical research: Potential and pitfalls. BMJ 2009; 338:b2393. [DOI] [PMC free article] [PubMed] [Google Scholar]
- 26.Karimi M, Brazier J: Health, health-related quality of life, and quality of life: What is the difference? Pharmacoeconomics 2016; 34:645–649 [DOI] [PubMed] [Google Scholar]
- 27.Office of Disease Prevention and Health Promotion. Health-Related Quality of Life and Well-Being. Available at: https://www.healthypeople.gov/2020/about/foundation-health-measures/Health-Related-Quality-of-Life-and-Well-Being/ Accessed February 17, 2020
- 28.Centers for Disease Control and Prevention. Health-Related Quality of Life (HRQOL). Available at: https://www.cdc.gov/hrqol/concept.htm. Accessed February 17, 2020
- 29.World Health Organization. Constitution of the World Health Organization Basic Documents. 48th Edition. Geneva Switzerland: World Health Organization; 2014 [Google Scholar]
- 30.Jonsson U, Alaie I, Lofgren Wilteus A, et al. : Annual research review: quality of life and childhood mental and behavioural disorders – a critical review of the research. J Child Psychol Psychiatry 2017; 58:439–469 [DOI] [PubMed] [Google Scholar]
- 31.Herzer M, Godiwala N, Hommel KA, et al. : Family functioning in the context of pediatric chronic conditions. J Dev Behav Pediatr 2010; 31:26–34 [DOI] [PMC free article] [PubMed] [Google Scholar]
- 32.Chambers HG, Chambers JA: Effects of caregiving on the families of children and adults with disabilities. Phys Med Rehabil Clin N Am 2015; 26:1–19 [DOI] [PubMed] [Google Scholar]
- 33.Murphy NA, Christian B, Caplin DA, et al. : The health of caregivers for children with disabilities: caregiver perspectives. Child Care Health Dev 2007; 33:180–187 [DOI] [PubMed] [Google Scholar]
- 34.Raina P, O’Donnell MO, Schwellnus H, et al. : Caregiving process and caregiver burden: Conceptual models to guide research and practice. BMC Pediatrics 2004; 4:1. [DOI] [PMC free article] [PubMed] [Google Scholar]
- 35.Harrison H: Making lemonade: A parent’s view of “quality of life” studies. J Clin Ethics 2001; 12; 239–250 [PubMed] [Google Scholar]
- 36.Tseng MH, Chen KL, Shieh JY, et al. : Child characteristics, caregiver characteristics, and environmental factors affecting the quality of life of caregivers of children with cerebral palsy. Disabil Rehabil 2016; 38:2374–2382 [DOI] [PubMed] [Google Scholar]
- 37.Chen KL, Tseng MH, Shieh JY, et al. : Determinants of quality of life in children with cerebral palsy: a comprehensive biopsychosocial approach. Res Dev Disabil 2014; 35:520–528 [DOI] [PubMed] [Google Scholar]
- 38.Haines KJ, Beesley SJ, Hopkins RO, et al. : Peer support in critical care: systematic review. Crit Care Med 2018; 46:1522–1531 [DOI] [PubMed] [Google Scholar]
- 39.Davis E, Reddihough D, Murphy N, et al. : Exploring quality of life of children with cerebral palsy and intellectual disability: what are the important domains of life? Child Health Care Dev 2017;43:854–860 [DOI] [PubMed] [Google Scholar]
- 40.Killian EY, Watson RS, Zimmerman JJ: Inherent value of baseline measures when assessing the trajectory of health-related quality of life among children surviving critical illness. Intensive Care Med 2018; 44:1979–1981 [DOI] [PMC free article] [PubMed] [Google Scholar]
Associated Data
This section collects any data citations, data availability statements, or supplementary materials included in this article.
Supplementary Materials
Supplemental Digital Content 1.
Title: Longitudinal Survey Response Patterns.
Description: This table displays the observed patterns of missingness for outcome data. An X appears at time points for which a survey response was received. The count and percentage represent the number and percentage of subjects in the cohort with the responses indicated in the row.
Supplemental Digital Content 2.
Title: Models of Month 3 Stein-Jessop Functional Status II-R Short Form Scores Adjusted for Baseline Score
Description: This table displays univariable models of Month 3 Stein-Jessop Functional Status II-R Short Form Scores Adjusted for Baseline Score. The table is based on survivors to 3 months (N = 128) with 3 month data imputed for 36%. Effect refers to the coefficient for each characteristic as a predictor in a linear regression model controlling for baseline FSII-R.