

Summary
Integrated multi-omics evaluation of 823 tumors from advanced renal cell carcinoma (RCC) patients identifies molecular subsets associated with differential clinical outcomes to angiogenesis blockade alone or with a checkpoint inhibitor. Unsupervised transcriptomic analysis reveals seven molecular subsets with distinct angiogenesis, immune, cell cycle, metabolism, and stromal programs. While sunitinib and atezolizumab+bevacizumab are effective in subsets with high angiogenesis, atezolizumab+bevacizumab improves clinical benefit in tumors with high T-effector and/or cell cycle transcription. Somatic mutations in PBRM1 and KDM5C associate with high angiogenesis and AMPK/Fatty acid oxidation gene expression, while CDKN2A/B and TP53 alterations associate with elevated cell cycle and anabolic metabolism. Sarcomatoid tumors exhibit lower prevalence of PBRM1 mutations and angiogenesis markers, frequent CDKN2A/B alterations, and increased PD-L1 expression. These findings can be applied to molecularly stratify patients, explain improved outcomes of sarcomatoid tumors to checkpoint blockade vs. anti-angiogenics alone, and develop personalized therapies in RCC and other indications.
Keywords: renal cell carcinoma, atezolizumab, bevacizumab, sunitinib, checkpoint blockade, tyrosine kinase inhibitor, integrated genomics, PD-L1, molecular stratification, VHL, PBRM1, CDKN2A/B, TP53, sarcomatoid
eTOC
Motzer et al. perform integrative multi-omics analyses of 823 renal cancer tumors from a randomized clinical trial. A robust molecular classification scheme, based on transcriptional and gene alteration profiles and differential clinical outcomes to VEGF blockade alone or in combination with anti-PD-L1, informs personalized treatment strategies and future therapeutic development in RCC.
Graphical Abstract

Introduction
Renal cell carcinoma (RCC) was diagnosed in more than 400,000 people and associated with approximately 175,000 deaths worldwide in 2018 (Bray et al., 2018; Siegel et al., 2018). Approximately 25% of patients present with metastatic disease at initial diagnosis (Dabestani et al., 2016). Clear-cell carcinoma (ccRCC) is the most common histologic subtype (75%) in RCC (Choueiri and Motzer, 2017). About 20% of tumors from patients with advanced RCC contain sarcomatoid elements. RCC tumors that include a sarcomatoid component are highly aggressive and lead to rapid metastasis and poor clinical prognosis (Lebacle et al., 2019; Mouallem et al., 2018).
Inactivation of the VHL gene function by deletion of chromosome 3p, mutation, and/or promoter methylation is a predominant feature of ccRCC (Cancer Genome Atlas Research, 2013; Gnarra et al., 1994; Linehan et al., 1995) and leads to abnormal accumulation of hypoxia inducible factors (HIF) and activation of the angiogenesis program (Kaelin, 2007; Majmundar et al., 2010; Semenza, 2013). However, VHL loss in itself is insufficient for tumorigenesis, and additional genomic aberrations such as mutations in 3p associated genes PBRM1, SETD2, and BAP1; loss of CDKN2A and CDKN2B genes via focal or arm level deletion of the 9p21 locus; and alterations in KDM5C, TP53, MTOR, or PTEN have been implicated in disease progression and degree of aggressiveness (Cancer Genome Atlas Research, 2013; Chen et al., 2016; Kapur et al., 2013; Ricketts et al., 2018; Voss et al., 2018). ccRCC is also characterized as a highly inflamed tumor type, with one of the highest immune infiltration scores in pan-cancer analysis and high expression of immune checkpoints, such as PD-L1 and CTLA-4 (Rooney et al., 2015; Senbabaoglu et al., 2016).
Given the distinct but variable hyper-vascularity, immune cell infiltration and PD-L1 expression in ccRCC, inhibitors of the VEGF pathway and PD-(L)1 axis as monotherapy or in combination have resulted in significant improvement in clinical outcomes in patients with advanced RCC (Choueiri and Motzer, 2017; Motzer et al., 2019; Motzer et al., 2018; Rini et al., 2009; Rini et al., 2019a; Rini et al., 2019c). However, not all patients respond and these treatments can produce significant toxicities. Thus, a better understanding of the molecular basis of clinical heterogeneity in patients with advanced RCC is needed to inform treatment selection strategies and delineate resistance mechanisms.
Here, we report integrated multi-omics analyses leading to identification of robust molecular subtypes in 823 tumors from patients with advanced RCC, including 134 tumors with sarcomatoid features, from a randomized, global Phase III trial (IMmotion151). These molecular subgroups associate with differential clinical outcomes to the combination of an anti-angiogenesis agent (bevacizumab, anti-VEGF) and a checkpoint inhibitor (CPI, atezolizumab, anti-PD-L1) versus a VEGF receptor tyrosine kinase inhibitor (TKI, sunitinib). The biological and clinical insights gained from this study may inform biomarker strategies for personalized treatment and guide future therapeutic development in RCC and other cancers.
Results
Patient cohorts, biomarker collection and validation of initial biomarker findings
The study design and primary clinical findings from IMmotion151 were reported previously (Rini et al., 2019c). Here, we report integrated RNA-seq and targeted somatic variant analysis using pre-treatment tumor samples from this study. Baseline tumors from 823/915 (90%) patients were available for biomarker evaluation (Table S1, Table S2, STAR Methods). This subset comprised 625 primary and 198 metastatic tumors, all of which were collected no longer than two years prior to enrollment in the study. Of these, 688 tumors were of clear cell histology without a sarcomatoid component, 110 tumors were of clear cell histology with any sarcomatoid component, 1 tumor was of clear cell histology with unknown sarcomatoid component, and 24 tumors were of non-clear cell histology with any sarcomatoid component. In these exploratory analyses, we evaluated biomarker associations with objective response (OR) and progression free survival (PFS), as these clinical outcomes capture the immediate effect of therapeutic intervention and are less affected than OS by subsequent treatments.
We previously reported associations between Angiogenesis and T-effector gene expression signatures and clinical outcome to treatment with atezolizumab+bevacizumab or sunitinib in the randomized Phase II trial IMmotion150 (McDermott et al., 2018). We evaluated the association of these signatures with clinical outcomes in IMmotion151 by pre-determining transcriptional cutoffs for both signatures in IMmotion150 and retrospectively applying them in IMmotion151 to define high and low expression patient subsets (Figure S1A, STAR Methods). Supporting observations in IMmotion150, high expression of the Angiogenesis signature was associated with improved PFS in the sunitinib treatment arm (HR=0.59, 95% CI 0.47, 0.75, Figure S1B). When compared across treatment arms, no difference in PFS was observed in the Angiogenesishigh or T-effectorlow tumors. Atezolizumab+bevacizumab improved PFS vs. sunitinib in T-effectorhigh (HR=0.76, 95% CI 0.59–0.99) and in Angiogenesislow (HR=0.68, 95% CI 0.52–0.88) tumors (Figure S1C). These findings underscore the relevance of immune and angiogenesis biology as reproducible biomarkers of differential clinical outcomes to checkpoint and angiogenesis blockade in independent advanced RCC cohorts.
Identification and characterization of seven molecular subtypes of ccRCC tumors
To expand our understanding of the biology of RCC, we next leveraged this large IMmotion151 RNA-seq data set to further identify and refine transcriptionally-defined subgroups of patients in an unbiased manner by utilizing non-negative matrix factorization (NMF). NMF is an unsupervised clustering algorithm that iteratively selects the most robust clustering pattern within a given dataset (Brunet et al., 2004). Here, NMF identified seven clusters of patients based on the top 10% (3074) most variable genes in the IMmotion151 cohort (Figure 1A, Figure S2A).
Figure 1: Transcriptional stratification identifies advanced RCC tumor subsets with distinct biologies.

A. Consensus matrix depicting clusters (k=7) identified by non-negative matrix factorization (NMF) clustering of 823 patient tumors. B. Heatmap representing MSigDb hallmark gene set QuSAGE enrichment scores for each NMF patient cluster compared to all other patients. Black cells represent non-significant enrichment after FDR correction. C. Heatmap of genes comprised in transcriptional signatures. Z-scores were calculated for each gene. Samples are grouped by NMF cluster. (FAO: fatty acid oxidation; FAS: fatty acid synthesis) D. Dot plot summarizing the heatmap in C. Samples were aggregated by NMF group using the mean across samples for each gene, and the mean z-score for each signature was calculated, resulting in one z-score per signature per NMF cluster. The horizontal bar chart on the right depicts the −log10(p-value) obtained from Kruskal-Wallis test for each signature across NMF clusters. E. Bar chart representing PD-L1 expression by immunohistochemistry in each NMF cluster. P-value was obtained from Pearson’s Chi-squared test.
To understand the main biological features driving these clusters, we compared them individually to all others using quantitative set analysis for gene expression (QuSAGE) (Yaari et al., 2013), leveraging hallmark gene sets from the Molecular Signatures Database (MSigDb) (Liberzon et al., 2015) combined with the previously described angiogenesis, T-effector and myeloid inflammation signatures (McDermott et al., 2018) (Figure 1B). We complemented this analysis with differential gene expression (DGE) analysis, again contrasting each cluster to all others, and conducting pathway enrichment analysis using gene sets from the Reactome database (Fabregat et al., 2018) (Table S3). To summarize these pathway-level analyses and further refine discriminatory transcriptomic profiles, we derived simplified signatures of representative genes associated with cell cycle, stroma, the complement cascade, small nucleolar RNAs (snoRNAs), and metabolism-related pathways including fatty acid oxidation (FAO)/AMPK signaling, fatty acid synthesis (FAS)/pentose phosphate and biological oxidation pathways that complemented our initial T-effector, angiogenesis and myeloid inflammation signatures (STAR Methods). These transcriptional programs were summarized across patient clusters both at the gene- (Figure 1C) and signature-levels (Figure 1D, Figure S2B). In addition, we applied xCell (Aran et al., 2017) to infer relative frequency of immune and stromal cell types across the tumor transcriptomes (Figure S2C).
Patient tumors in NMF-derived clusters 1 (n=98, 12%) and 2 (n=245, 30%) were primarily characterized as highly angiogenic, with enrichment of vascular and VEGF pathway-related genes (Figures 1B–D) as well as inferred endothelial cell presence (Figure S2C). These clusters also exhibited high expression of TGF-β, WNT, hedgehog and NOTCH signaling modules (Figure 1B). Cluster 1 differentiated from cluster 2 by higher stroma-specific expression (Figures 1C–D, Figure S2C), exemplified by high degree of fibroblast derived gene expression (Figure S2C), and elevated expression of collagens and activated stroma-associated genes (FAP, FN1, POSTN, MMP2). Cluster 2 additionally showed moderate T-effector gene signature expression, low cell cycle-associated genes and higher expression of genes associated with catabolic metabolism, including those in fatty acid oxidation (CPT2, PPARA, CPT1A) and AMPK (PRKAA2, PDK2, PRKAB1) pathways. We thus labeled cluster 1 as Angiogenic/Stromal and cluster 2 as Angiogenic.
Tumors in cluster 3 (n=156, 19%) were characterized by relatively lower expression of both angiogenesis and immune genes and moderate expression of cell cycle genes. These tumors showed elevated expression of genes associated with the complement cascade (C3, C1S, C1R), which has been associated with poor prognosis in the ccRCC TCGA cohort (Roumenina et al., 2019), as well as genes associated with the cytochrome P450 family, which is involved in omega oxidation. We labeled this cluster as the Complement/Ω-oxidation cluster.
Tumors in clusters 4 (n=116, 14%), 5 (n=74, 9%), and 6 (n=106, 13%) were characterized by enrichment of cell cycle transcriptional programs (G2M, E2F targets, MYC targets), and lower expression of angiogenesis-related genes. We observed mutual exclusion between the angiogenesis signature enriched in clusters 1 and 2 and the cell cycle signature (including the cyclin-dependent kinases CDK2, CDK4, CDK6) enriched in clusters 4, 5 and 6 (Figures 1C–D), which was confirmed by correlation analysis (R = −0.50, p<0.001; Figure S2E). Clusters 4, 5 and 6 also exhibited an anabolic metabolism transcriptomic profile, with higher expression of genes associated with FAS (FASN, PARP1, ACACA) and the pentose phosphate pathway (TKT, TALDO1, PGD), which may be related to the proliferative nature of these tumors. Tumors in cluster 4 were additionally characterized as highly immunogenic, exhibiting strong enrichment in T-effector, JAK/STAT and interferon alpha and gamma gene expression modules (Figures 1B–C). These tumors also showed the highest expression of PD-L1 by IHC (Figure 1E) and highest infiltration of both adaptive and innate immune cell subsets, including CD8+, CD4+, and regulatory T cells, B cells, macrophages, and dendritic cells (Figure S2C). In contrast, while tumors in cluster 5 and 6 showed enrichment of the myeloid gene signature and innate immune cell presence as inferred from xCell, they exhibited lower expression of T-effector gene signature and inferred T cell presence (Figure S2C). The expression of FAS/Pentose phosphate pathway associated genes was highest in cluster 5. Moreover, Cluster 5 included 15 tumors that contained TFE-fusions (12 tumors with TFE3 fusions and 3 tumors with TFEB fusions, Figure S2F), which have been implicated in mTORC1 signaling, upregulation of cyclin proteins, dysregulation of metabolic pathways, and increased tumor aggressiveness (Brady et al., 2018; Kauffman et al., 2014). Cluster 6 showed high expression of the epithelial-mesenchymal transition (EMT) transcriptional module and enrichment of collagen and fibroblast associated stromal genes. We termed cluster 4 as T-effector/Proliferative, cluster 5 as Proliferative, and cluster 6 as Stromal/Proliferative.
Finally, cluster 7 (n=28, 3%) was characterized by enrichment of expression of snoRNA, especially, C/D box snoRNAs (SNORDs). SNORDs have been implicated in alterations of epigenetic and translation programs and have been linked to carcinogenesis (Gong et al., 2017). For example, SNORD66, which was upregulated in this cluster, has been reported to be associated with lung cancer tumorigenesis (Braicu et al., 2019). The precise role of the overexpressed SNORDs in RCC tumors remains to be characterized. We labeled this small cluster as the snoRNA cluster.
Overall, molecular stratification of 823 RCC tumors identified seven groups of patients with biologically distinct transcriptomes. Given that the tumors in IMmotion151 included both primary and metastatic collections, we evaluated the prevalence of each across the seven NMF subsets. As shown in Figure S2D, metastatic tumors were distributed across all clusters, suggesting that our transcriptional stratification scheme is not primarily driven by the primary or metastatic origin of tumors.
To validate these molecular subgroups in an independent cohort, we trained a random forest classifier (STAR Methods) from the RNA-seq data in IMmotion151 and predicted the NMF class of tumors from patients in the IMmotion150 randomized Phase II trial. The observed distribution of the NMF clusters and the transcriptional expression profile of these clusters in IMmotion150 were highly concordant with those in IMmotion151, (Figure S3A–B), confirming the robustness of these molecular subtypes.
RCC molecular subtypes associate with prognostic risk categories and differential clinical outcomes to atezolizumab+bevacizumab and sunitinib
The Memorial Sloan Kettering Cancer Center (MSKCC) and the International Metastatic Renal Cell Carcinoma Database Consortium (IMDC) models are frequently applied in advanced RCC for patient prognostication (Heng et al., 2009; Motzer et al., 1999). These models utilize clinical and laboratory parameters to stratify patients into favorable, intermediate, and poor risk categories. However, the molecular features of tumors associated with these risk categories are incompletely understood. We evaluated the distribution of our NMF molecular clusters across MSKCC and IMDC risk categories, and observed enrichment of the Angiogenic/Stromal (#1) and Angiogenic (#2) clusters in the favorable risk groups in both classifications. Conversely, the T-effector/Proliferative (#4), Proliferative (#5) and Stromal/Proliferative (#6) clusters were enriched in the poor risk groups (Figure 2A).
Figure 2: Association between transcriptomic clusters and clinical outcomes to atezolizumab+bevacizumab or sunitinib in advanced RCC.

A. Bar charts representing non-negative matrix factorization (NMF) cluster distribution by Memorial-Sloan Kettering Cancer Center (MSKCC, left panel) or International Metastatic Renal Cell Carcinoma Database Consortium (IMDC, right panel) clinical risk categories. P-values were obtained from Pearson’s Chi-squared test. B. Kaplan-Meier curves of progression-free survival (PFS) in NMF clusters of patients treated with atezolizumab+bevacizumab or sunitinib. C. Bar chart representing objective response rate by treatment arm in each NMF cluster. P-value was obtained using Pearson’s Chi-squared test. [NE, not evaluable; PD, progressive disease; SD, stable disease; PR, partial response; CR, complete response; n.s., not statistically significant (p-value > 0.05); A/B, atezolizumab+bevacizumab; Sun, sunitinib]. D. Forest plots for PFS hazard ratios in patients treated with atezolizumab+bevacizumab (A/B) vs. sunitinib, by NMF cluster. mPFS = median PFS.
We subsequently evaluated clinical outcomes to atezolizumab+bevacizumab and sunitinib treatment in each cluster. Patients in the Angiogenic/Stromal (#1) and Angiogenic (#2) clusters demonstrated longer PFS in both treatment arms, suggesting better outcome regardless of treatment, while those in the Stromal/Proliferative cluster (#5) had relatively shorter PFS (atezolizumab+bevacizumab mPFS: 6.8 months; sunitinib mPFS: 5.2 months), suggesting poor prognostic association of proliferative/stromal biology with clinical outcomes (Figure 2B).
When evaluated across treatment arms, no apparent difference in clinical outcomes was observed between atezolizumab+bevacizumab and sunitinib arms in the Angiogenic/Stromal (#1), Angiogenic (#2) and Complement/Ω-oxidation (#3) clusters (Figures 2C, 2D). Atezolizumab+bevacizumab demonstrated improved objective response rate (ORR, 52.0% vs 19.4%, p <0.001) and PFS [hazard ratio(HR) 0.52, 95% CI 0.33–0.82] vs. sunitinib (Figures 2C,2D) in the T-effector/Proliferative cluster (#4), confirming the contribution of pre-existing intratumoral adaptive immune presence in determining benefit to immunotherapy containing regimens. In addition, atezolizumab+bevacizumab showed improved ORR (26.2% vs 3.1%, p <0.001, Figure 2C) and PFS (HR 0.47, 95% CI 0.27–0.82, Figure 2D) in the Proliferative cluster (#5), including in tumors that harbored TEE-fusions (Figure S2G), implicating the relevance of PD-L1 blockade in this low angiogenesis, but high proliferative subgroup. Atezolizumab+bevacizumab also showed improved PFS (HR 0.1, 95% CI 0.01−0.77) in the snoRNA cluster (#7); however, the biological basis of this effect in this small cluster of patients remains to be elucidated.
We subsequently compared the HRs obtained above using cox proportional hazard model that only tests treatment arm in each NMF subgroup against a model that included treatment arm, PD-L1 IHC and MSKCC clinical risk score. These multivariate analyses confirmed that the differential clinical benefit observed in these NMF clusters is independent of PD-L1 expression and MSKCC prognostic risk (Table S4).
Finally, we additionally evaluated differentially expressed genes between responders (complete or partial objective response, CR/PR) and non-responders (progressive disease, PD) within and across treatment arms. In sunitinib-treated patients, linear modeling complemented with MSigDb hallmark gene set enrichment analysis revealed higher expression of genes associated with VEGF pathway in tumors from responders and higher expression of cell cycle associated pathways in tumors from non-responders (Figures S4A–B). Comparison of gene expression in responders with non-responders treated with atezolizumab+bevacizumab did not identify any significantly differentially expressed genes (FDR < 0.05). Within responders across treatment arms, genes associated with proliferation and immune pathways were enriched in patients responding to atezolizumab+bevacizumab, while genes associated with VEGF signaling (hypoxia) were enriched in patients responding to sunitinib (Figures S4C–D). No differentially expressed genes (FDR<0.05) were observed in non-responders treated with atezolizumab+bevacizumab vs. sunitinib. These data confirm and support the findings from our unbiased NMF classification.
Somatic alterations associate with tumor intrinsic and extrinsic transcriptional profiles
We complemented transcriptional profiling with evaluation of somatic alterations in tumors from 715 patients. The pattern and prevalence of somatic alterations in this cohort were broadly in alignment with prior reports of recurrent gene alterations in RCC tumors (Figure 3A, S5A, Table S1) (Cancer Genome Atlas Research, 2013; Chen et al., 2016; Ricketts et al., 2018).
Figure 3: Association between somatic alterations and transcriptome in advanced RCC tumors.

A. Oncoprint of genes with alterations in at least 10% of 715 tumors. Tumor mutation burden (TMB) is represented for individual samples as a bar chart above the oncoprint. B. Oncoprints displaying alterations in non-negative matrix factorization (NMF) clusters. The horizontal bar charts to the right of each oncoprint represent the number of patients with alterations for each gene. P-values were obtained using the Pearson’s Chi-squared test (**: p<0.01; ***: p<0.001). C. NMF cluster distribution in patients with somatic alterations in PBRM1, KDM5C, CDKN2A/B, TP53, and BAP1 D. Left panel: Hierarchical cluster depicting the ratio of transcriptional signature z-scores (columns) between altered and non-altered tumor samples for each gene considered (rows). Only genes with alterations in >=10% of patients and significant differences (p<0.05) between altered and non-altered tumors as measured by the two-side Mann-Whitney test for at least one of the transcriptional signatures considered are displayed. Right panel: Boxplots representing the z-scores of gene signatures in samples with genomic alterations in PBRM1 (n=328), KDM5C (n=100), TP53 (n=107) and/or CDKN2A/B (n=116). P-values represent the statistical significance of the comparison of signature z-scores between patients with PBRM1 and/or KDM5C alterations vs. patients with TP53 and/or CDKN2A/B alterations using the two-side Mann-Whitney test.
Previous studies have reported differences in genomic alteration profiles between primary and metastatic tumors, including enrichment of loss of chromosome 9p21.3 in metastatic lesions compared to primary tumors (Turajlic et al., 2018a). In the IMmotion151 cohort, while no genes were exclusively expressed in metastatic tumors, the frequency of genomic alterations in 12 genes, including CDKN2A/B (23.8% vs 14.6%, p=0.011), BRCA2 (15.7% vs 9.2%, p=0.034), ZNF216 (12.2% vs 6.3%, p=0.025) and NF2 (10.9% vs 5.6%, p=0.036) was increased in metastatic tumors compared to primary tumors (Table S5).
Co-occurrence analysis showed >50% overlap of SETD2, KDM5C or PTEN alterations with PBRM1 mutations (Figure S5B). Conversely, mutations in PBRM1, BAP1, and CDKN2A/B were largely non-overlapping (<25% overlap, hypergeometric p=9.5e-09, Figures S5B–D), supporting models of distinct tumor lineages associated with PBRM1 vs. BAP1 mutations (Kapur et al., 2013; Pena-Llopis et al., 2012) and further suggesting evolutionary distinctions between tumors harboring 3p associated aberrations only versus those that also have 9p arm level or focal copy number alterations (Turajlic et al., 2018b). Additionally, CDKN2A/B alterations were non-overlapping with TP53 mutations (<20% overlap, Figures S5B–C).
We further characterized the prevalence of the top altered genes in each NMF cluster, and observed lower prevalence of PBRM1 mutations (p<0.001) and enrichment of CDKN2A/B alterations (p<0.001) in the T-effector/Proliferative (#4), Proliferative (#5) and Stromal/Proliferative (#6) clusters (Figure 3B). The prevalence of TP53 mutations was highest in the Proliferative (#5) and Stromal/Proliferative (#6) clusters (p<0.001) and that of BAP1 mutations was highest in the T-effector/Proliferative cluster (#4) (p<0.01) (Figure 3B). When analyzing cluster distribution by mutation status, the Angiogenic cluster (#2) was enriched in PBRM1 and KDM5C mutants, while the Proliferative (#5) and Stromal/Proliferative (#6) clusters were enriched in CDKN2A/B mutants (Figure 3C).
We subsequently evaluated the association of somatic alterations present in at least 10% of the tumors with transcriptomic signatures discussed above (Figure 3D). Compared to non-mutants, tumors with mutations in PBRM1 or KDM5C exhibited higher expression of angiogenesis (PBRM1 p=3.46e-20; KDM5C p=0.001) and FAO/AMPK (PBRM1 p=4.59e-17; KDM5C p=3.79e-05) associated gene signatures, and reduced expression of the cell cycle gene signature (PBRM1 p=7.74e-12; KDM5C p=1.09e-04). In contrast, tumors harboring TP53, CDKN2A/B, and PTEN alterations showed upregulation of cell cycle (TP53 p=1.22e-13; CDKN2A/B p=5.00e-18; PTEN p=3.71e-04), FAS/pentose phosphate pathway (TP53 p=2.52e-09; CDKN2A/B p=1.97e-14), and stromal gene expression (TP53 p=4.69e-04; CDKN2A/B p=8.35e-06; PTEN p=2.46e-07). KMT2C mutations also showed higher expression of cell cycle genes (p=0.022). PTEN alterations were associated with higher myeloid inflammation (p=0.03). BAP1 mutations showed elevated expression of cell cycle (p=0.0028) and T-effector (p=8.64e-04) gene signatures, the latter supporting previously described association of BAP1 mutations with IFN-γ signaling (Clark et al., 2019; Wang et al., 2018).
Overall, somatic alteration profiles suggest a genetic basis for the distinct transcriptomic profiles in advanced RCC. Functional depletion of PBRM1 and/or KDM5C associate with a subtype typified by angiogenic features, whereas functional depletions of tumor suppressor genes including CDKN2A/B and TP53, associate with high proliferation, anabolic metabolism and stromal biology (Figure 3D).
Associations between somatic alterations and clinical outcome
Evaluation of clinical outcomes in somatic alteration subgroups showed that PBRM1 mutations conferred overall better prognosis, regardless of treatment arm (Figures 4A, 4C, S5E). Sunitinib-treated patients whose tumors harbored PBRM1 mutations showed longer PFS compared to those with non-mutant PBRM1 (HR 0.67, 95% CI 0.51, 0.87, mPFS 11.2 months vs. 6.9 months). This trend of longer PFS in PBRM1 mutant tumors was also observed in atezolizumab+bevacizumab treated patients, but did not reach statistical significance. When compared across treatment arms, there was no difference in PFS or ORR in PBRM1 mutated tumors. In patients with PBRM1 non-mutant tumors, atezolizumab+bevacizumab improved PFS (HR 0.74, 95% CI 0.58–0.94, mPFS atezolizumab+bevacizumab: 9.9 months; mPFS sunitinib: 6.9 months) (Figures 4A, S5E) and ORR (40% vs. 27%, p=0.036) (Figure 4B) vs. sunitinib.
Figure 4: Association between tumor somatic alterations and clinical outcomes.

A. Kaplan-Meier curves of progression-free survival (PFS) by treatment arm in patients with altered or non-altered tumors. B. Bar charts depicting objective response (OR) by arm and by alteration status for the same genes. P-values were obtained from Pearson’s Chi-squared test. [NE, not evaluable; PD, progressive disease; SD, stable disease; PR, partial response; CR, complete response; n.s., not statistically significant (p-value > 0.05); A/B, atezolizumab+bevacizumab; Sun, sunitinib]. C. Forest plot representing PFS hazard ratios in patients with altered vs non-altered tumors, by gene and treatment arm. (mPFS = median PFS).
Conversely, CDKN2A/B alterations conferred worse prognosis when compared to non-altered tumors (Figures 4A, 4C). When compared across treatment arms, patients whose tumors had CDKN2A/B alterations showed longer PFS (HR 0.63, 95% CI 0.41–0.96, mPFS 8.3 months vs. 4.1 months) (Figure 4A) and higher ORR (42% vs. 20%, p=0.045) (Figure 4B), including complete responses (11% vs. 0%) when treated with atezolizumab+bevacizumab vs. sunitinib. Patients with TP53 mutant tumors, which were largely non-overlapping with CDKN2A/B altered tumors (Figures S6C–D), also showed a statistically non-significant trend toward improved clinical benefit with atezolizumab+bevacizumab vs. sunitinib (Figures 4A–B).
Finally, this analysis revealed that patients with tumors harboring loss-of-function mutations in ARID1A and/or KMT2C had significantly better PFS when treated with atezolizumab+bevacizumab vs. sunitinib (ARID1A HR 0.50, 95% CI 0.26–0.96, mPFS 20.7 vs. 6.8 months; KMT2C HR: 0.47, 95% CI 0.27–0.83, mPFS 13.8 months vs. 7.0 months) (Figures 4A–B, S5E).
Overall, we identified five genes with frequent loss-of-function alterations that associate with distinct clinical outcomes to atezolizumab+bevacizumab vs. sunitinib, suggesting that targeted somatic mutation profiling in advanced RCC could help guide treatment selection.
Molecular characterization of sarcomatoid RCC tumors
RCC tumors that include a sarcomatoid component (sRCC) associate with poor prognosis and show limited response to standard-of-care treatment with VEGF pathway inhibitors (Golshayan et al., 2009). We therefore subsequently examined the molecular characteristics of sRCC tumors that distinguish it from non-sarcomatoid RCC (non-sRCC) tumors.
DGE analysis (FDR<0.05) identified 2917 overexpressed and 6309 under expressed genes in sRCC compared to non-sRCC tumors (Figure 5A). Gene set enrichment analysis demonstrated enrichment of transcriptional pathways involved in cell cycle/proliferation (E2F targets, G2M checkpoints, MYC targets, EMT and immune response (Allograft rejection, Interferon gamma response, Inflammatory response) and lower expression of genes involved in the VEGF pathway (Angiogenesis, Hypoxia) (Figure 5B) in sRCC. We further compared the distribution of sRCC and non-sRCC tumors in our transcriptomic NMF clusters and observed that sRCC tumors were enriched in the T-effector/Proliferative (#4), Proliferative (#5) and Stromal/Proliferative (#6) clusters, and were less prevalent in the Angiogenic/Stromal (#1) and Angiogenic (#2) clusters (Figure 5C). Moreover, evaluation of gene expression signatures confirmed lower expression of angiogenesis and FAO/AMPK signatures and higher expression of cell cycle, stromal, T-effector, and myeloid signatures in sRCC tumors compared to non-sRCC tumors (Figure 5D).
Figure 5: Genomic landscape and clinical outcomes in sarcomatoid tumors.
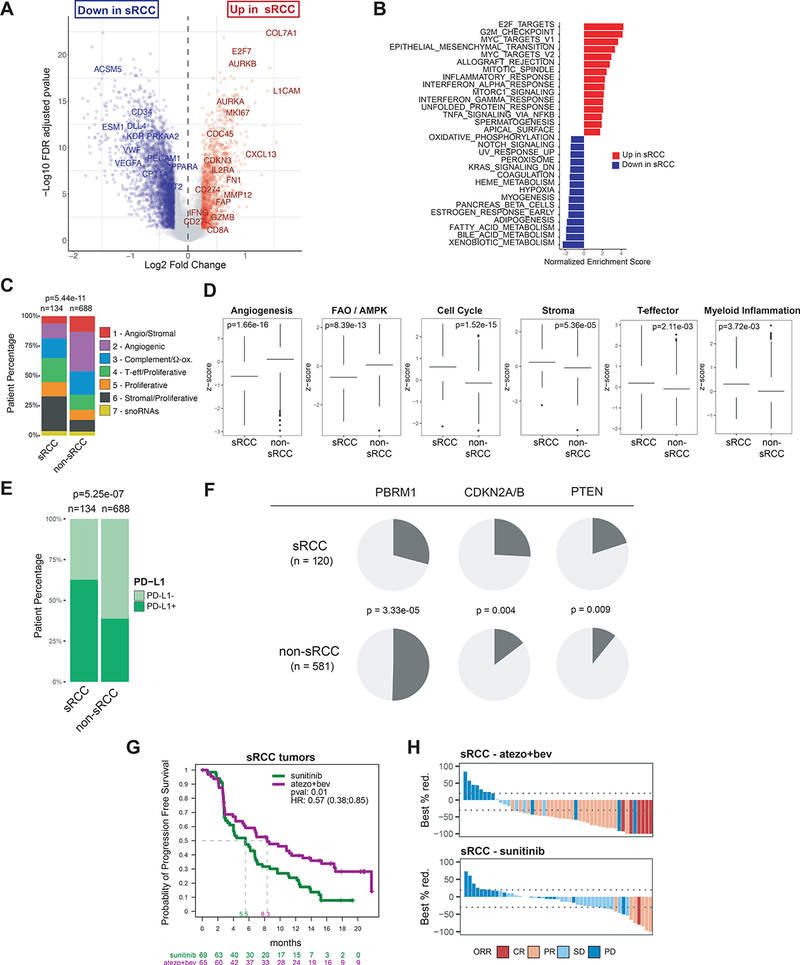
A. Volcano plot representing differentially expressed genes between sarcomatoid RCC (sRCC) and non sarcomatoid (non-sRCC) tumors. Genes with FDR-corrected p<0.05 and absolute log-fold change >= 0.25 are represented in red or blue. B. Bar chart representing pathway enrichment scores for the top 15 upregulated or downregulated MSigDb hallmark gene sets within the differentially expressed genes identified in A. C. Bar chart representing the distribution of non-negative matrix factorization (NMF) defined transcriptomic subgroups. D. Bar charts representing transcriptional signature z-scores, with p-values obtained from two-sided Mann-Whitney test. E. Bar chart depicting prevalence of PD-L1 expression by immunohistochemistry. F. Pie charts representing the distribution of somatic alterations for select genes in sRCC vs. non-sRCC tumors, with p-values obtained from Pearson’s Chi-squared test. G. Kaplan-Meier curves of progression-free survival (PFS) in sRCC patients treated with atezolizumab+bevacizumab or sunitinib. H. Waterfall plots depicting the best percent reduction from baseline in sum of longest diameters (SLD). Bar color indicates objective response defined by RECIST1.1. Objective response rate was 49% in sRCC patients treated with atezolizumab+bevacizumab, and 14% in sRCC patients treated with sunitinib, p=7.7e-05 with Pearson’s Chi-squared test. CR, complete response; PR, partial response; SD, stable disease; PD, progressive disease.
PD-L1 protein prevalence was significantly higher in sRCC vs non-sRCC (63% vs 39%, p<0.001, Figure 5E), confirming the increased presence of interferon gamma response observed by gene expression analysis, and reflective of adaptive upregulation of PD-L1 by interferon gamma in sRCC.
Somatic alteration analysis revealed lower prevalence of PBRM1 (29% vs 50%, p=3.33e-05) mutations in sRCC, which suggests a genomic basis for the observed lower angiogenesis gene expression in these tumors. Conversely, the prevalence of CDKN2A/B (26% vs 15%, p=0.004), and PTEN (20% vs 11%, p=0.009) alterations was significantly higher in sRCC, suggesting that somatic loss-of-function in these genes may contribute to the aggressive phenotype of sarcomatoid tumors (Figure 5F).
Given the differences in etiology between ccRCC and non-ccRCC, we compared molecular features between ccRCC non-sarcomatoid (ccRCC-NonSarc), ccRCC-Sarc and non-ccRCC-Sarc tumors. ccRCC-Sarc tumors showed enrichment of pathways associated with cell cycle/proliferation and immune response, and lower expression of genes associated with angiogenesis and hypoxia compared to ccRCC-NonSarc tumors (Figures S6A–B). This is noteworthy, as it confirms that the downregulation of angiogenesis pathways in the overall sarcomatoid subset (sRCC) is independent of non-ccRCC-Sarc tumors.
DGE analysis (FDR<0.05) comparing the two subsets of sarcomatoid tumors (ccRCC-Sarc versus non-ccRCC-Sarc) (Figure S6C–D) showed upregulation of VEGF pathway associated genes (hypoxia) in ccRCC-Sarc tumors and higher expression of cell cycle/proliferation pathways (G2M, E2F targets, EMT, MYC targets) in non-ccRCC-Sarc tumors. Compared with ccRCC-NonSarc tumors, PD-L1 expression was enriched in both ccRCC-Sarc and non-ccRCC-Sarc tumors (Figure S6E).
Comparison of the distribution of NMF clusters in the histological subtypes showed that ccRCC-Sarc tumors were enriched in T-effector/Proliferative (#4) and Stromal/Proliferative (#5) clusters, and non-ccRCC-Sarc tumors were enriched in Proliferative (#5) and Stromal/Proliferative (#6) clusters (Figure S6F).
Evaluation of somatic alterations across the three histological subtypes (Table S6) confirmed higher prevalence of VHL mutations in ccRCC subtypes reported in previous studies (Chen et al., 2016). The prevalence of PBRM1 mutations was lower and that of CDKN2A/2B and PTEN alterations was higher in ccRCC-Sarc and non-ccRCC-Sarc tumors compared to ccRCC-NonSarc tumors. Prevalence of BAP1 mutations was highest in ccRCC-Sarc, whereas non-ccRCC-Sarc showed enrichment in TP53 and RB1 alterations.
Overall, our analyses show that sRCC tumors exhibit a highly proliferative molecular phenotype, characterized by relatively low angiogenesis, and accompanied with high immune presence and PD-L1 expression, which may explain the increased sensitivity of sarcomatoid tumors to therapeutic intervention with atezolizumab+bevacizumab vs sunitinib (Figures 5G, 5H, Rini et al 2019c).
Discussion
This study reports comprehensive molecular analyses of 823 tumors from advanced RCC patients treated with atezolizumab+bevacizumab or sunitinib, representing the largest set of integrated multi-omics characterization of advanced RCC in a randomized global Phase III clinical trial. Our findings provide important new insights into key biological pathways underlying RCC progression, validate for the first time the prognostic and predictive capability of transcriptional signatures identified in a Phase II cohort in a randomized Phase III trial, describe distinct molecular subtypes that associate with differential overall outcome to antiangiogenics alone or combined with checkpoint blockade, and identify additional targets for future therapeutic development.
Our unsupervised transcriptomic analysis identified seven robust tumor subsets. (summarized in Figure 6). This subtyping scheme corroborates and significantly expands on recent reports on gene expression-based subgrouping in smaller RCC data sets (Beuselinck et al., 2015; Brannon et al., 2010; Clark et al., 2019; Hakimi et al., 2019). The substantially larger number of samples in our data set resulted in increased resolution and detection of additional transcriptomic features associated with these subsets, such as differential metabolic profiles. Importantly, we validated our clustering scheme in an independent transcriptomic data set from IMmotion150 (McDermott et al., 2018), which also enrolled patients with untreated advanced RCC. Overall, the concordance of molecular subtypes across these different studies strengthens the case for a unified molecular classification in advanced RCC and its utility in understanding differential prognosis and sensitivity to therapeutics, including antiangiogenics, CPIs, and their combinations, which are now standards of care in untreated advanced RCC.
Figure 6: Summary of molecular characteristics in transcriptomic subsets in tumors from advanced RCC patients.

Radar charts in the RNA profile panel represent mean z-scores for each gene signature in the respective cluster. MSKCC = Memorial Sloan-Kettering Cancer Center; FAS, fatty acid synthesis; AMPK, AMP-activated protein kinase.
Indeed, we could reproducibly associate RCC molecular subgroups with differential clinical responses to anti-angiogenics and a CPI. Patients in angiogenesis enriched clusters 1 and 2 demonstrated superior prognosis in both atezolizumab+bevacizumab and sunitinib-treated patients, with no significant difference in PFS between the two treatment arms, likely as a result of both treatment arms containing an angiogenesis inhibitor. In contrast, sunitinib showed worse clinical outcomes in the angiogenesis poor, but immune rich, and cell cycle enriched clusters 4 and 5, and atezolizumab+bevacizumab significantly improved ORR and PFS vs sunitinib in these subsets, consistent with the inclusión of an immunotherapeutic in the combination regimen.
The dual CPI combination of nivolumab plus ipilimumab showed improved OS and ORR in patients with intermediate and poor prognostic risk as assessed by the IMDC score, whereas patients with favorable risk showed numerically superior results for OS, PFS, and ORR with sunitinib (Motzer et al., 2018). In contrast, combined VEGF and checkpoint inhibition by atezolizumab+bevacizumab, avelumab+axitinib, and pembrolizumab+axitinib (Motzer et al., 2019; Rini et al., 2019a; Rini et al., 2019c) showed PFS benefit across clinical risk groups, including in patients with favorable prognostic risk. In our study, tumors from favorable risk patients were enriched in the Angiogenic/Stromal (#1) and the Angiogenic (#2) clusters, which exhibited higher expression of genes associated with the VEGF pathway. These findings provide a molecular explanation for improved clinical outcomes to combined CPI+VEGF inhibition vs. CPI only therapy across clinical risk categories and support treatment of favorable risk patients with therapeutic regimens that include VEGF pathway inhibitors. Moving forward, treatment of patients based on transcriptomic profiling of tumors, and independent of IMDC risk categorization, if prospectively validated, could allow for a more personalized, biology-based approach to treatment selection.
Integration of gene expression profiles with somatic alterations provided further insights into the molecular underpinnings of the transcriptomic subgroups. PBRM1 mutant tumors associated with higher expression of the angiogenesis gene signature, and in agreement with previous clinical findings (Carlo et al., 2017; Hakimi et al., 2019; McDermott et al., 2018; Voss et al., 2018), showed improved clinical outcomes to sunitinib vs. PBRM1 non-mutants. Recent preclinical studies have shown that PBRM1 loss in VHL deficient cell lines and mouse models induced amplification of HIF-1A/HIF-2A mediated hypoxia response (Gao et al., 2017; Nargund et al., 2017). Thus, evaluation of clinical activity of novel agents targeting hypoxia and angiogenesis, such as HIF-2A inhibitors (Jonasch et al., 2019), is especially warranted in PBRM1 mutant tumors.
Tumors harboring CDKN2A/2B alterations were more prevalent in T-effector/Proliferative (#4), Proliferative (#5), and Stromal/Proliferative (#6) clusters; and TP53 mutations were more prevalent in Proliferative (#5), and Stromal/Proliferative (#6) clusters. Atezolizumab+bevacizumab improved clinical outcomes vs. sunitinib in these highly proliferative and aggressive tumors. Importantly, patients whose tumors harbored CDKN2A/B loss and/or TP53 mutations showed overall worse prognosis and may additionally benefit from therapeutic approaches that target these specific aberrations, such as stromal disruptors, cytotoxic agents or CDK4/6 inhibitors. Preclinical studies have demonstrated immunomodulatory effects of CDK4/6 inhibition in tumor models, such as increase in antigen presentation by tumor cells, upregulation of PD-L1 expression, reduction in intratumoral regulatory T cells, and activation of CD8+ T cells, as well as enhancement of anti-tumor efficacy in combination with PD-L1 blockade (Deng et al., 2018; Goel et al., 2017; Schaer et al., 2018). Collectively, these data support clinical investigation of CDK4/6 inhibitors in combination with CPI in RCC.
Intriguingly, loss-of-function mutations in ARID1A and KMT2C associated with improved PFS in atezolizumab+bevacizumab vs. sunitinib-treated patients, in the absence of clear associations with transcriptional signatures. Alterations in ARID1A, a component of the chromatin remodeling SWI/SNF complex, and KMT2C, a histone methyl transferase, have been implicated in epigenetic dysregulation and DNA damage repair deficiency (Rampias et al., 2019; Shen et al., 2018). While the mechanistic basis for the differential clinical outcome in patients with either mutation remains to be elucidated in RCC, these observations support combining epigenetic regulators with CPI in subsets of patients with RCC.
Sarcomatoid dedifferentiation in RCC has been historically associated with poor outcomes to VEGF inhibition (Golshayan et al., 2009). In contrast, atezolizumab+bevacizumab, as well as other CPI-based therapies, have demonstrated substantial efficacy, including complete responses, in patients whose tumors include a sarcomatoid component (Choueiri et al., 2019; McDermott et al., 2019; Rini et al., 2019b; Rini et al., 2019c). The distinct genomic features of sarcomatoid tumors identified in our study suggest a molecular basis for the aggressive phenotype of sarcomatoid tumors, and provide a biological rationale for prioritizing checkpoint blockade-based therapy in patients with sarcomatoid RCC.
Overall, findings from this randomized Phase III study expand our understanding of RCC biology and provide a molecular basis for differential clinical outcomes and resistance mechanisms associated with angiogenesis blockade, checkpoint inhibition and their combinations in patients with untreated advanced RCC. Given that these combinations are under clinical evaluation and have shown promising activity in additional indications, such as hepatocellular carcinoma, non-small cell lung cancer, and endometrial cancer, the findings from this study may be applicable in interpreting clinical outcomes and developing personalized therapies across many cancers.
STAR Methods
RESOURCE AVAILABILITY
Lead Contact
Further information and requests for resources should be directed to and will be fulfilled by the Lead Contact, Mahrukh Huseni (huseni.mahrukh@gene.com)
Materials Availability
This study did not generate new unique reagents.
Data and Code Availability
Qualified researchers may request access to individual patient-level data through the clinical study data request platform (http://www.clinicalstudydatarequest.com). Further details on Roche’s criteria for eligible studies are available here: (https://clinicalstudydatarequest.com/Study-Sponsors/Study-Sponsors-Roche.aspx).
For further details on Roche’s Global Policy on the Sharing of Clinical Information and how to request access to related clinical study documents, see here (http://www.roche.com/research_and_development/who_we_are_how_we_work/clinical_trials/our_commitment_to_data_sharing.htm).
RNA-seq, somatic alteration, and clinical outcomes data supporting the findings in this manuscript are deposited in the European Genome-Phenome Archive under accession number EGAS00001004353.
EXPERIMENTAL MODEL AND SUBJECT DETAILS
Ethical Statement
IMmotion151 (NCT02420821) is a multicenter, open-label, Phase 3, randomized controlled trial of atezolizumab plus bevacizumab (n=454) vs. sunitinib (n=461) in patients with previously untreated advanced renal cell carcinoma (Rini et al., 2019c). The study protocol (Rini et al., 2019c) was approved by the institutional review board or independent ethics committee for each study site and was done in full accordance with the Guideline for Good Clinical Practice and the Declaration of Helsinki.
Human Tumor Specimens
All biological materials used in this study and their subsequent evaluations were in accordance with the informed consent agreements obtained from all subjects. Patient demographics are listed in Table S1.
METHOD DETAILS
Study design and participants
IMmotion151 (NCT02420821) is a multicenter, open-label, Phase 3, randomized controlled trial of atezolizumab plus bevacizumab (n=454) vs. sunitinib (n=461) in patients with previously untreated advanced renal cell carcinoma (Rini et al., 2019c). The study design, methods and primary clinical findings from IMmotion151 have been reported previously (Rini et al., 2019c). Briefly, previously untreated patients with unresectable locally advanced or metastatic renal cell carcinoma with any component of clear-cell or sarcomatoid histology were randomized to receive atezolizumab 1200 mg + bevacizumab 15 mg/kg (atezolizumab+bevacizumab) once every 3 weeks (n=454) or sunitinib 50 mg once daily (n=461; 4 weeks on, 2 weeks off). The co-primary endpoints were investigator-assessed progression-free survival (PFS) in patients with ≥ 1% expressing PD-L1 on immune cells (IC, PD-L1+) and overall survival (OS) in the intent-to-treat (ITT) population. Patients with PD-L1+ tumors who received atezolizumab+bevacizumab showed improved PFS vs. sunitinib (Hazard ratio, HR 0.74, 95% CI: 0.57–0.96; p=0.0217, median PFS [mPFS] 11.2 vs 7.7 months; Rini et al, 2019c).
In this study, pre-treatment tumors from 823/915 (90%) patients were transcriptionally profiled by RNA-seq. This subset comprised of 198 metastatic and 625 primary tumors, all of which were collected no longer than 2 years prior to enrollment in this study. In this biomarker evaluable tumor collection, 688 tumors were of clear cell histology without a sarcomatoid component, 110 tumors were of clear cell histology with any sarcomatoid component, 1 tumor was of clear cell histology with unknown sarcomatoid component, and 24 tumors were of non-clear cell histology with any sarcomatoid component. Pre-treatment tumors from 715 patients were assessed for somatic mutations and alterations using the FoundationOne assay (Foundation Medicine, MA). Overall, tumors from 702 patients were profiled both by RNA-seq and FoundationOne, representing the largest genomic biomarker dataset to date in a randomized trial in untreated advanced RCC. Validation of molecular classification was conducted in tumors collected from patients in the randomized Phase II trial, IMmotion150.
PD-L1 immunohistochemistry and scoring
PD-L1 expression was assessed by immunohistochemistry using the SP142 assay (Ventana, AZ). Tumors were characterized as PD-L1+ if PD-L1 staining of any intensity on immune cells covered >=1% of tumor area occupied by tumor cells, associated intratumoral, and contiguous peri-tumoral desmoplastic stroma.
RNA processing
Formalin-fixed paraffin-embedded (FFPE) tissue was macro-dissected for tumor area using H&E as a guide. RNA was extracted using the High Pure FFPET RNA Isolation Kit (Roche) and assessed by Qubit and Agilent Bioanalyzer for quantity and quality. First strand cDNA synthesis was primed from total RNA using random primers, followed by the generation of second strand cDNA with dUTP in place of dTTP in the master mix to facilitate preservation of strand information. Libraries were enriched for the mRNA fraction by positive selection using a cocktail of biotinylated oligos corresponding to coding regions of the genome. Libraries were sequenced using the Illumina sequencing method..
RNA-seq data generation and processing
Whole-transcriptome profiles were generated using TruSeq RNA Access technology (Illumina). RNA-seq reads were first aligned to ribosomal RNA sequences to remove ribosomal reads. The remaining reads were aligned to the human reference genome (NCBI Build 38) using GSNAP (Wu and Nacu, 2010; Wu et al., 2016) version 2013–10-10, allowing a maximum of two mismatches per 75 base sequence (parameters: ‘-M 2 -n 10 -B 2 -i 1 -N 1 -w 200000 -E 1-pairmax-rna = 200000 –clip-overlap). To quantify gene expression levels, the number of reads mapped to the exons of each RefSeq gene was calculated using the functionality provided by the R/Bioconductor package GenomicAlignments. Raw counts were adjusted for gene length using transcript-per-million (TPM) normalization, and subsequently log2-transformed. Raw and processed data are available under the data sharing agreement.
DNA mutation and copy-number profiling by Foundation One
Comprehensive genomic profiling (CGP) was carried out using the Foundation One T7 assay (Foundation Medicine Inc., Cambridge, MA, USA) in a Clinical Laboratory Improvement Amendments (CLIA)-certified, College of American Pathologists (CAP)-accredited laboratory. Approval for genetic evaluation was obtained from the Western Institutional Review Board (Protocol No. 20152817). Hybrid capture was carried out for all coding exons from up to 395 cancer-related genes plus select introns from up to 31 genes frequently rearranged in cancer. We assessed all classes of genomic alterations (GA) including short variant (missense, stop, nonstart, splice site point mutations as well as short indels), biallelic deletions, amplifications and rearrangement alterations, as previously described (Frampton et al., 2013). Shallow copy-number loss (CN=1) was called using similar methodology to arm-level calling. Normalized coverage data for exonic, intronic, and SNP targets accounting for stromal admixture were plotted on a logarithmic scale and minor allele SNP frequencies were concordantly plotted. Custom circular binary segmentation further clustered targets and minor allele SNPs to define upper and lower bounds of genomic segments. Signal-to-noise ratios for each segment were used to determine whether it was gained or lost. The sum of those segment sizes determined the fraction of each segment gained or lost. For gene alteration analyses described in this manuscript, we leveraged position-level information to define per-gene alteration profiles, and dichotomized every gene’s mutational profile as altered (including copy-number loss or gain) or non-altered.
Fusion detection
Paired trimmed/clipped and de-duplicated RNAseq reads were used to identify gene fusion events. Reads were aligned using STAR v2.7.2b with default parameters to the GRCh38 genome. This aligned output was used as input to STAR-Fusion v1.9.1 (Haas et al., 2019) using the developer-supplied gencode v33 CTAT library from April 6, 2020. We required each fusion gene to be supported by at least two reads.
T-effector and angiogenesis gene signature threshold definition and validation
RNA-seq data from the randomized Phase II trial IMmotion150 were processed as described above. Transcriptional signature scores were derived from T-effector and angiogenesis signatures (McDermott et al., 2018) for each sample, and hazard ratios were calculated at various gene expression scores. Gene expression score cutoffs of 2.93 (40% prevalence) and 5.82 (50% prevalence) were defined for the T-effector and angiogenesis signatures in IMmotion150 based on a combination of prevalence and Hazard Ratio plateauing. These absolute thresholds were prospectively applied to the IMmotion151 data to classify tumors with high and low T-effector and angiogenesis signatures. Cox-proportional hazard regression models were fit to compare PFS in atezolizumab+bevacizumab or sunitinib-treated patients in gene expression high and low subsets.
Non-negative matrix factorization (NMF)
We selected 3072 genes (top10%) with the highest variability across patients, using Median Absolute Deviation (MAD) analysis. Subclasses were then computed by reducing the dimensionality of the expression data from thousands of genes to a few metagenes using consensus NMF clustering (CRAN. R package version 0.22.0, Brunet et al., 2004). This method computes multiple k-factor factorization decompositions of the expression matrix and evaluates the stability of the solutions using a cophenetic coefficient. The most robust consensus NMF clustering of 823 patient samples using the 3072 most variable genes selected and testing k=2 to k=8 was identified as k=7.
Validation of NMF clustering in IMmotion150
To validate molecular subtypes derived in IMmotion151, we used the random forest machine learning algorithm (R package randomForest) to derive a classifier and then predict the NMF clusters in an independent data set (IMmotion150). A random forest classifier involves learning a large number of binary decision trees from random subsets of a training set. These trees in the classifier can then be used in a predication algorithm to identify the similarity of a given sample to a given class in the training set. Before learning the random forest classifier, we preprocessed the data to generate the training set. First, we limited the gene expression matrix in the test and training set to the top 10% most variable genes in IMmotion151 (n = 3,072), from which the initial NMF classification was derived and we normalized (z-score transformed) the gene expression values in each set to ensure that the test and training set were on the same scale. Finally, we learned the random forest classifier on the IMmotion151 derived trained data and then utilized the classifier to predict the NMF classes in IMmotion150. We subsequently evaluated expression of gene expression signatures assessed in IMmotion151 (Figure 1C) in the NMF clusters identified in IMmotion150. (Figure S4).
Quantitative set analysis for gene expression (QuSAGE)
To understand biological pathways underlying NMF clustering, we conducted QuSAGE analysis (R/Bionconductor qusage v2.18.0) to compare each cluster to all others, leveraging MSigDb hallmark gene sets to identify enriched pathways within each cluster. Enrichment scores were represented as a heatmap (Figure 1B).
Gene Signatures and scores
Gene signatures were defined as follows: Angiogenesis: VEGFA, KDR, ESM1, PECAM1, ANGPTL4, and CD34; T-effector: CD8A, EOMES, PRF1, IFNG, and CD274; Fatty Acid Oxidation /AMP-activated protein kinase (FAO/AMPK): CPT2, PPARA, CPT1A, PRKAA2, PDK2, PRKAB1; Cell cycle: CDK2, CDK4, CDK6, BUB1B, CCNE1, POLQ, AURKA, MKI67, CCNB2; Fatty Acid Synthesis (FAS)/Pentose Phosphate: CYP4F3, CYPFASN, PARP1, ACACA, G6PD, TKDT, TALDO1, PGD; Stroma: COL5A1, COL5A2, POSTN, COL1A1, COL1A2, MMP2; Myeloid Inflammation: CXCL1, CXCL2, CXCL3, CXCL8, IL6, PTGS2; Complement Cascade: F2, C1S, C1R, CFB, C3; Omega Oxidation: CYP4F3, CYP8B1, NNMT, MGST1, MAOA, CYP4F11, CYP4F2, CYP4F12; SNORDs: SNORD38A, SNORD104, SNORD32A, SNORD68, SNORD66, SNORD100. Signature scores are calculated as the median z-score of genes included in each signature for each sample. When summarized by patient group, as in Figure 1D, log2-transformed expression data were first aggregated by patient group using the mean, and subsequently converted to a group z-score.
QUANTIFICATION AND STATISTICAL ANALYSIS
All analyses were conducted using Rv3.6.1. Unless otherwise stated, all comparisons for continuous variables use the two-sided Mann-Whitney test (R function wilcox.test) for two groups and the Kruskal-Wallis test (R function kruskal.test) for more than two groups. Dunn’s post-hoc test was applied with Benjamini-Hochberg multiple testing correction for pairwise comparisons. For categorical variables, Pearson’s Chi-squared test with continuity correction was used (R function chisq.test). Unless otherwise stated, FDR-adjusted p-values are reported. *: p<0.05; **: p<0.01; ***: p<0.001. Survival analyses were conducted using Cox-proportional hazard models using the R survival package (v3.1.7). Log-rank p-values were reported for survival analyses including more than two groups. For all boxplots, the horizontal line represents the median. The lower and upper hinges correspond to the first and third quartiles. The upper whisker extends from the hinge to the largest value no further than 1.5 * IQR from the hinge (where IQR is the inter-quartile range, or distance between the first and third quartiles). The lower whisker extends from the hinge to the smallest value at most 1.5 * IQR of the hinge.
Supplementary Material
Supplementary Table 1: Patient and tumor characteristics, clinical outcomes, and gene alterations, Related to Figures 1, 2, 3, 4, and 5.
Supplementary Table 2: Summarized patient characteristics, Related to Figure 1.
Supplementary Table 3: NMF cluster gene and pathway level analyses, Related to Figure 1.
Supplementary Table 4: Univariate vs. multivariate PFS analyses in NMF subgroups, Related to Figure 2.
Supplementary Table 5: Genomic alterations in primary versus metastatic tumors, Related to Figure 3.
Supplementary Table 6: Genomic alterations in sarcomatoid subsets, Related to Figure 5.
KEY RESOURCES TABLE.
| REAGENT or RESOURCE | SOURCE | IDENTIFIER |
|---|---|---|
| Critical Commercial Assays | ||
| RNASeq | Q2 solutions | SQ1407 RNA Access |
| Targeted Gene Alterations | Foundation Medicine | FoundationOne (T7) |
| PD-LI IHC | Ventana | SP142 |
| Deposited Data | ||
| RNA-Seq files | This paper | EGAS00001004353 |
| Foundation One Targeted genomic profiling | This paper | EGAS00001004353 |
| Study related clinical data | This paper | EGAS00001004353 |
| Human reference genome NCBI build 37, GRCh37 | Genome Reference Consortium | http://www.ncbi.nlm.nih.gov/projects/genome/assembly/grc/human/ |
| Software and Algorithms | ||
| R v3.6.1 | R-project | https://www.r-project.org/ |
| R package ReactomePA v1.28.0 | Bioconductor | http://bioconductor.org/packages/release/bioc/html/ReactomePA.html |
| R package NMF 0.22.0 | CRAN | https://cran.r-project.org/web/packages/NMF/index.html |
| R package randomForest v4.6–14 | CRAN | https://cran.r-project.org/web/packages/randomForest/index.html |
| R package ComplexHeatmap v2.0.0 | Github | https://github.com/jokergoo/ComplexHeatmap |
| R package qusage v2.18.0 | Bioconductor | https://www.bioconductor.org/packages/release/bioc/html/qusage.html |
| R package forestplot v1.9 | CRAN | https://cran.r-project.org/web/packages/forestplot/index.html |
| R package survival v3.2.3 | CRAN | https://cran.r-project.org/web/packages/survival/index.html |
| STAR v2.7.2b | Github | https://github.com/alexdobin/STAR |
| STAR-Fusion v1.9.1 | Github | https://github.com/STAR-Fusion/STAR-Fusion/wiki |
Highlights.
Genomics of 823 RCC tumors, including 134 sarcomatoid tumors, reveals 7 subtypes
Subtype specific Angiogenesis, Immune, Metabolic, Stromal, and Cell Cycle profiles
Differential prevalence of PBRM1, KDM5C, CDKN2A/2B, and TP53 alterations in subsets
Differential outcomes to VEGF blockade alone or in combination with anti-PD-L1
Acknowledgments
We thank Gregg D. Fine, Daniel S. Chen, and Cathi Ahearn for their contributions to the study design and Carlos Bais, Craig Cummings, and Sarita Dubey for their input. Patients treated at Memorial Sloan Kettering Cancer Center (MSKCC) were supported in part by MSKCC Grant/Core Grant (P30 CA008748). Editorial assistance was provided by Anshin Biosolutions (Santa Clara, CA).
Declaration of Interests
RJM has received honoraria for advisory roles from Roche–Genentech (RGE), Pfizer, Novartis, Exelixis, Eisai, Lilly Oncology, Astra Zeneca (AZ), Incyte and Merck Sharp & Dohme (MSD), and institutional support from Bristol-Myers Squibb (BMS), RGE, Pfizer, Novartis, Exelixis, and Eisai outside of the submitted work. TP has received grants from AZ and RGE, and honoraria from AZ, RGE, BMS, Pfizer, Novartis, Exelixis, and MSD outside of the submitted work. DFM has received grants from BMS and Prometheus and honoraria for consulting roles from BMS, Pfizer, MSD, Novartis, Eisai, Exelixis, Array BioPharm, and RGE outside of the submitted work. MBA has received grants from RGE during the conduct of the study and honoraria for consulting roles outside of the submitted work from RGE, BMS, MSD, Novartis, Pfizer, Exelixis, and Esai. BE has received grants and honoraria from BMS, Novartis, Ipsen, and EUSA outside of the submitted work. BR has received grants and honoraria from RGE and Pfizer during the conduct of the study and has received grants to his institution from MSD, Peloton, Aveo, BMS, AZ, and honoraria for consulting roles from Novartis, Synthorx, Compugen, Corvus, Exelixis, Arravive, Surface Oncology, 3D Medicines and holds stock in PTC therapeutics, all outside of the submitted work. RB, HH, LL, NL, AA, JF, HK, JL, SM, MG, DT, and MAH are employees of Genentech Inc. SC is an employee of Calithera Biosciences Inc. KH is an employee of Crescendo Biologics Inc. PSH is an employee of Foundation Medicine Inc.
Footnotes
Publisher's Disclaimer: This is a PDF file of an unedited manuscript that has been accepted for publication. As a service to our customers we are providing this early version of the manuscript. The manuscript will undergo copyediting, typesetting, and review of the resulting proof before it is published in its final form. Please note that during the production process errors may be discovered which could affect the content, and all legal disclaimers that apply to the journal pertain.
References
- Aran D, Hu Z, and Butte AJ (2017). xCell: digitally portraying the tissue cellular heterogeneity landscape. Genome Biol 18, 220. [DOI] [PMC free article] [PubMed] [Google Scholar]
- Beuselinck B, Job S, Becht E, Karadimou A, Verkarre V, Couchy G, Giraldo N, Rioux-Leclercq N, Molinie V, Sibony M, et al. (2015). Molecular subtypes of clear cell renal cell carcinoma are associated with sunitinib response in the metastatic setting. Clin Cancer Res 21, 1329–1339. [DOI] [PubMed] [Google Scholar]
- Brady OA, Jeong E, Martina JA, Pirooznia M, Tunc I, and Puertollano R (2018). The transcription factors TFE3 and TFEB amplify p53 dependent transcriptional programs in response to DNA damage. Elife 7. [DOI] [PMC free article] [PubMed] [Google Scholar]
- Braicu C, Zimta AA, Harangus A, Iurca I, Irimie A, Coza O, and Berindan-Neagoe I (2019). The Function of Non-Coding RNAs in Lung Cancer Tumorigenesis. Cancers (Basel) 11. [DOI] [PMC free article] [PubMed] [Google Scholar]
- Brannon AR, Reddy A, Seiler M, Arreola A, Moore DT, Pruthi RS, Wallen EM, Nielsen ME, Liu H, Nathanson KL, et al. (2010). Molecular Stratification of Clear Cell Renal Cell Carcinoma by Consensus Clustering Reveals Distinct Subtypes and Survival Patterns. Genes Cancer 1, 152–163. [DOI] [PMC free article] [PubMed] [Google Scholar]
- Bray F, Ferlay J, Soerjomataram I, Siegel RL, Torre LA, and Jemal A (2018). Global cancer statistics 2018: GLOBOCAN estimates of incidence and mortality worldwide for 36 cancers in 185 countries. CA Cancer J Clin 68, 394–424. [DOI] [PubMed] [Google Scholar]
- Brunet JP, Tamayo P, Golub TR, and Mesirov JP (2004). Metagenes and molecular pattern discovery using matrix factorization. Proc Natl Acad Sci U S A 101, 4164–4169. [DOI] [PMC free article] [PubMed] [Google Scholar]
- Cancer Genome Atlas Research N (2013). Comprehensive molecular characterization of clear cell renal cell carcinoma. Nature 499, 43–49. [DOI] [PMC free article] [PubMed] [Google Scholar]
- Carlo MI, Manley B, Patil S, Woo KM, Coskey DT, Redzematovic A, Arcila M, Ladanyi M, Lee W, Chen YB, et al. (2017). Genomic Alterations and Outcomes with VEGF-Targeted Therapy in Patients with Clear Cell Renal Cell Carcinoma. Kidney Cancer 1, 49–56. [DOI] [PMC free article] [PubMed] [Google Scholar]
- Chen F, Zhang Y, Senbabaoglu Y, Ciriello G, Yang L, Reznik E, Shuch B, Micevic G, De Velasco G, Shinbrot E, et al. (2016). Multilevel Genomics-Based Taxonomy of Renal Cell Carcinoma. Cell Rep 14, 2476–2489. [DOI] [PMC free article] [PubMed] [Google Scholar]
- Choueiri TK, Larkin JMG, Pal SK, Motzer RJ, Venugopal B, Alekseev BY, Miyake H, Gravis G, Bilen MA, Chudnovsky A, et al. (2019). Efficacy and biomarker analysis of patients (pts) with advanced renal cell carcinoma (aRCC) with sarcomatoid histology (sRCC): Subgroup analysis from the phase III JAVELIN renal 101 trial of first-line avelumab plus axitinib (A plus Ax) vs sunitinib (S). Ann Oncol 30, 361–361.30715160 [Google Scholar]
- Choueiri TK, and Motzer RJ (2017). Systemic Therapy for Metastatic Renal-Cell Carcinoma. N Engl J Med 376, 354–366. [DOI] [PubMed] [Google Scholar]
- Clark DJ, Dhanasekaran SM, Petralia F, Pan J, Song X, Hu Y, da Veiga Leprevost F, Reva B, Lih TM, Chang HY, et al. (2019). Integrated Proteogenomic Characterization of Clear Cell Renal Cell Carcinoma. Cell 179, 964–983 e931. [DOI] [PMC free article] [PubMed] [Google Scholar]
- Dabestani S, Thorstenson A, Lindblad P, Harmenberg U, Ljungberg B, and Lundstam S (2016). Renal cell carcinoma recurrences and metastases in primary non-metastatic patients: a population-based study. World J Urol 34, 1081–1086. [DOI] [PubMed] [Google Scholar]
- Deng J, Wang ES, Jenkins RW, Li S, Dries R, Yates K, Chhabra S, Huang W, Liu H, Aref AR, et al. (2018). CDK4/6 Inhibition Augments Antitumor Immunity by Enhancing T-cell Activation. Cancer Discov 8, 216–233. [DOI] [PMC free article] [PubMed] [Google Scholar]
- Fabregat A, Jupe S, Matthews L, Sidiropoulos K, Gillespie M, Garapati P, Haw R, Jassal B, Korninger F, May B, et al. (2018). The Reactome Pathway Knowledgebase. Nucleic Acids Res 46, D649–D655. [DOI] [PMC free article] [PubMed] [Google Scholar]
- Frampton GM, Fichtenholtz A, Otto GA, Wang K, Downing SR, He J, Schnall-Levin M, White J, Sanford EM, An P, et al. (2013). Development and validation of a clinical cancer genomic profiling test based on massively parallel DNA sequencing. Nat Biotechnol 31, 1023–1031. [DOI] [PMC free article] [PubMed] [Google Scholar]
- Gao W, Li W, Xiao T, Liu XS, and Kaelin WG Jr. (2017). Inactivation of the PBRM1 tumor suppressor gene amplifies the HIF-response in VHL−/− clear cell renal carcinoma. Proc Natl Acad Sci U S A 114, 1027–1032. [DOI] [PMC free article] [PubMed] [Google Scholar]
- Gnarra JR, Tory K, Weng Y, Schmidt L, Wei MH, Li H, Latif F, Liu S, Chen F, Duh FM, et al. (1994). Mutations of the VHL tumour suppressor gene in renal carcinoma. Nat Genet 7, 85–90. [DOI] [PubMed] [Google Scholar]
- Goel S, DeCristo MJ, Watt AC, BrinJones H, Sceneay J, Li BB, Khan N, Ubellacker JM, Xie S, Metzger-Filho O, et al. (2017). CDK4/6 inhibition triggers anti-tumour immunity. Nature 548, 471–475. [DOI] [PMC free article] [PubMed] [Google Scholar]
- Golshayan AR, George S, Heng DY, Elson P, Wood LS, Mekhail TM, Garcia JA, Aydin H, Zhou M, Bukowski RM, et al. (2009). Metastatic sarcomatoid renal cell carcinoma treated with vascular endothelial growth factor-targeted therapy. J Clin Oncol 27, 235–241. [DOI] [PubMed] [Google Scholar]
- Gong J, Li Y, Liu CJ, Xiang Y, Li C, Ye Y, Zhang Z, Hawke DH, Park PK, Diao L, et al. (2017). A Pan-cancer Analysis of the Expression and Clinical Relevance of Small Nucleolar RNAs in Human Cancer. Cell Rep 21, 1968–1981. [DOI] [PubMed] [Google Scholar]
- Haas BJ, Dobin A, Li B, Stransky N, Pochet N, and Regev A (2019). Accuracy assessment of fusion transcript detection via read-mapping and de novo fusion transcript assembly-based methods. Genome Biol 20, 213. [DOI] [PMC free article] [PubMed] [Google Scholar]
- Hakimi AA, Voss MH, Kuo F, Sanchez A, Liu M, Nixon BG, Vuong L, Ostrovnaya I, Chen YB, Reuter V, et al. (2019). Transcriptomic Profiling of the Tumor Microenvironment Reveals Distinct Subgroups of Clear Cell Renal Cell Cancer: Data from a Randomized Phase III Trial. Cancer Discov 9, 510–525. [DOI] [PMC free article] [PubMed] [Google Scholar]
- Heng DY, Xie W, Regan MM, Warren MA, Golshayan AR, Sahi C, Eigl BJ, Ruether JD, Cheng T, North S, et al. (2009). Prognostic factors for overall survival in patients with metastatic renal cell carcinoma treated with vascular endothelial growth factor-targeted agents: results from a large, multicenter study. J Clin Oncol 27, 5794–5799. [DOI] [PubMed] [Google Scholar]
- Jonasch E, Plimack ER, Bauer T, Merchan JR, Papadopoulos KP, McDermott DF, Michaelson MD, Appleman LJ, Thamake S, Zojwalla N, et al. (2019). A first-in-human phase I/II trial of the oral HIF-2a inhibitor PT2977 in patients with advanced RCC. Ann Oncol 30. [Google Scholar]
- Kaelin WG Jr. (2007). The von Hippel-Lindau tumor suppressor protein and clear cell renal carcinoma. Clin Cancer Res 13, 680s–684s. [DOI] [PubMed] [Google Scholar]
- Kapur P, Pena-Llopis S, Christie A, Zhrebker L, Pavia-Jimenez A, Rathmell WK, Xie XJ, and Brugarolas J (2013). Effects on survival of BAP1 and PBRM1 mutations in sporadic clear-cell renal-cell carcinoma: a retrospective analysis with independent validation. Lancet Oncol 14, 159–167. [DOI] [PMC free article] [PubMed] [Google Scholar]
- Kauffman EC, Ricketts CJ, Rais-Bahrami S, Yang Y, Merino MJ, Bottaro DP, Srinivasan R, and Linehan WM (2014). Molecular genetics and cellular features of TFE3 and TFEB fusion kidney cancers. Nat Rev Urol 11, 465–475. [DOI] [PMC free article] [PubMed] [Google Scholar]
- Lebacle C, Pooli A, Bessede T, Irani J, Pantuck AJ, and Drakaki A (2019). Epidemiology, biology and treatment of sarcomatoid RCC: current state of the art. World J Urol 37, 115–123. [DOI] [PubMed] [Google Scholar]
- Liberzon A, Birger C, Thorvaldsdottir H, Ghandi M, Mesirov JP, and Tamayo P (2015). The Molecular Signatures Database (MSigDB) hallmark gene set collection. Cell Syst 1, 417–425. [DOI] [PMC free article] [PubMed] [Google Scholar]
- Linehan WM, Lerman MI, and Zbar B (1995). Identification of the von Hippel-Lindau (VHL) gene. Its role in renal cancer. JAMA 273, 564–570. [PubMed] [Google Scholar]
- Majmundar AJ, Wong WJ, and Simon MC (2010). Hypoxia-inducible factors and the response to hypoxic stress. Mol Cell 40, 294–309. [DOI] [PMC free article] [PubMed] [Google Scholar]
- McDermott DF, Choueiri TK, Motzer RJ, Aren OR, George S, Powles T, Donskov F, Harrison MR, Cid JRRR, Ishii Y, et al. (2019). CheckMate 214 post-hoc analyses of nivolumab plus ipilimumab or sunitinib in IMDC intermediate/poor-risk patients with previously untreated advanced renal cell carcinoma with sarcomatoid features. Journal of Clinical Oncology 37. [Google Scholar]
- McDermott DF, Huseni MA, Atkins MB, Motzer RJ, Rini BI, Escudier B, Fong L, Joseph RW, Pal SK, Reeves JA, et al. (2018). Clinical activity and molecular correlates of response to atezolizumab alone or in combination with bevacizumab versus sunitinib in renal cell carcinoma. Nat Med 24, 749–757. [DOI] [PMC free article] [PubMed] [Google Scholar]
- Motzer RJ, Mazumdar M, Bacik J, Berg W, Amsterdam A, and Ferrara J (1999). Survival and prognostic stratification of 670 patients with advanced renal cell carcinoma. J Clin Oncol 17, 2530–2540. [DOI] [PubMed] [Google Scholar]
- Motzer RJ, Penkov K, Haanen J, Rini B, Albiges L, Campbell MT, Venugopal B, Kollmannsberger C, Negrier S, Uemura M, et al. (2019). Avelumab plus Axitinib versus Sunitinib for Advanced Renal-Cell Carcinoma. N Engl J Med 380, 1103–1115. [DOI] [PMC free article] [PubMed] [Google Scholar]
- Motzer RJ, Tannir NM, McDermott DF, Aren Frontera O, Melichar B, Choueiri TK, Plimack ER, Barthelemy P, Porta C, George S, et al. (2018). Nivolumab plus Ipilimumab versus Sunitinib in Advanced Renal-Cell Carcinoma. N Engl J Med 378, 1277–1290. [DOI] [PMC free article] [PubMed] [Google Scholar]
- Mouallem NE, Smith SC, and Paul AK (2018). Sarcomatoid renal cell carcinoma: Biology and treatment advances. Urol Oncol 36, 265–271. [DOI] [PubMed] [Google Scholar]
- Nargund AM, Pham CG, Dong Y, Wang PI, Osmangeyoglu HU, Xie Y, Aras O, Han S, Oyama T, Takeda S, et al. (2017). The SWI/SNF Protein PBRM1 Restrains VHL-Loss-Driven Clear Cell Renal Cell Carcinoma. Cell Rep 18, 2893–2906. [DOI] [PMC free article] [PubMed] [Google Scholar]
- Pena-Llopis S, Vega-Rubin-de-Celis S, Liao A, Leng N, Pavia-Jimenez A, Wang S, Yamasaki T, Zhrebker L, Sivanand S, Spence P, et al. (2012). BAP1 loss defines a new class of renal cell carcinoma. Nat Genet 44, 751–759. [DOI] [PMC free article] [PubMed] [Google Scholar]
- Rampias T, Karagiannis D, Avgeris M, Polyzos A, Kokkalis A, Kanaki Z, Kousidou E, Tzetis M, Kanavakis E, Stravodimos K, et al. (2019). The lysine-specific methyltransferase KMT2C/MLL3 regulates DNA repair components in cancer. EMBO Rep 20. [DOI] [PMC free article] [PubMed] [Google Scholar]
- Ricketts CJ, De Cubas AA, Fan H, Smith CC, Lang M, Reznik E, Bowlby R, Gibb EA, Akbani R, Beroukhim R, et al. (2018). The Cancer Genome Atlas Comprehensive Molecular Characterization of Renal Cell Carcinoma. Cell Rep 23, 3698. [DOI] [PubMed] [Google Scholar]
- Rini BI, Campbell SC, and Escudier B (2009). Renal cell carcinoma. Lancet 373, 1119–1132. [DOI] [PubMed] [Google Scholar]
- Rini BI, Plimack ER, Stus V, Gafanov R, Hawkins R, Nosov D, Pouliot F, Alekseev B, Soulieres D, Melichar B, et al. (2019a). Pembrolizumab plus Axitinib versus Sunitinib for Advanced Renal-Cell Carcinoma. N Engl J Med 380, 1116–1127. [DOI] [PubMed] [Google Scholar]
- Rini BI, Plimack ER, Stus V, Gafanov R, Hawkins R, Nosov D, Pouliot F, Soulieres D, Melichar B, Vynnychenko I, et al. (2019b). Pembrolizumab (pembro) plus axitinib (axi) versus sunitinib as first-line therapy for metastatic renal cell carcinoma (mRCC): Outcomes in the combined IMDC intermediate/poor risk and sarcomatoid subgroups of the phase 3 KEYNOTE-426 study. Journal of Clinical Oncology 37. [Google Scholar]
- Rini BI, Powles T, Atkins MB, Escudier B, McDermott DF, Suarez C, Bracarda S, Stadler WM, Donskov F, Lee JL, et al. (2019c). Atezolizumab plus bevacizumab versus sunitinib in patients with previously untreated metastatic renal cell carcinoma (IMmotion151): a multicentre, open-label, phase 3, randomised controlled trial. Lancet 393, 2404–2415. [DOI] [PubMed] [Google Scholar]
- Rooney MS, Shukla SA, Wu CJ, Getz G, and Hacohen N (2015). Molecular and genetic properties of tumors associated with local immune cytolytic activity. Cell 160, 48–61. [DOI] [PMC free article] [PubMed] [Google Scholar]
- Roumenina LT, Daugan MV, Petitprez F, Sautes-Fridman C, and Fridman WH (2019). Context-dependent roles of complement in cancer. Nat Rev Cancer 19, 698–715. [DOI] [PubMed] [Google Scholar]
- Schaer DA, Beckmann RP, Dempsey JA, Huber L, Forest A, Amaladas N, Li Y, Wang YC, Rasmussen ER, Chin D, et al. (2018). The CDK4/6 Inhibitor Abemaciclib Induces a T Cell Inflamed Tumor Microenvironment and Enhances the Efficacy of PD-L1 Checkpoint Blockade. Cell Rep 22, 2978–2994. [DOI] [PubMed] [Google Scholar]
- Semenza GL (2013). HIF-1 mediates metabolic responses to intratumoral hypoxia and oncogenic mutations. J Clin Invest 123, 3664–3671. [DOI] [PMC free article] [PubMed] [Google Scholar]
- Senbabaoglu Y, Gejman RS, Winer AG, Liu M, Van Allen EM, de Velasco G, Miao D, Ostrovnaya I, Drill E, Luna A, et al. (2016). Tumor immune microenvironment characterization in clear cell renal cell carcinoma identifies prognostic and immunotherapeutically relevant messenger RNA signatures. Genome Biol 17, 231. [DOI] [PMC free article] [PubMed] [Google Scholar]
- Shen J, Ju Z, Zhao W, Wang L, Peng Y, Ge Z, Nagel ZD, Zou J, Wang C, Kapoor P, et al. (2018). ARID1A deficiency promotes mutability and potentiates therapeutic antitumor immunity unleashed by immune checkpoint blockade. Nat Med 24, 556–562. [DOI] [PMC free article] [PubMed] [Google Scholar]
- Siegel RL, Miller KD, and Jemal A (2018). Cancer statistics, 2018. CA Cancer J Clin 68, 7–30. [DOI] [PubMed] [Google Scholar]
- Turajlic S, Xu H, Litchfield K, Rowan A, Chambers T, Lopez JI, Nicol D, O’Brien T, Larkin J, Horswell S, et al. (2018a). Tracking Cancer Evolution Reveals Constrained Routes to Metastases: TRACERx Renal. Cell 173, 581–594 e512. [DOI] [PMC free article] [PubMed] [Google Scholar]
- Turajlic S, Xu H, Litchfield K, Rowan A, Horswell S, Chambers T, O’Brien T, Lopez JI, Watkins TBK, Nicol D, et al. (2018b). Deterministic Evolutionary Trajectories Influence Primary Tumor Growth: TRACERx Renal. Cell 173, 595–610 e511. [DOI] [PMC free article] [PubMed] [Google Scholar]
- Voss MH, Reising A, Cheng Y, Patel P, Marker M, Kuo F, Chan TA, Choueiri TK, Hsieh JJ, Hakimi AA, et al. (2018). Genomically annotated risk model for advanced renal-cell carcinoma: a retrospective cohort study. Lancet Oncol 19, 1688–1698. [DOI] [PMC free article] [PubMed] [Google Scholar]
- Wang T, Lu R, Kapur P, Jaiswal BS, Hannan R, Zhang Z, Pedrosa I, Luke JJ, Zhang H, Goldstein LD, et al. (2018). An Empirical Approach Leveraging Tumorgrafts to Dissect the Tumor Microenvironment in Renal Cell Carcinoma Identifies Missing Link to Prognostic Inflammatory Factors. Cancer Discov 8, 1142–1155. [DOI] [PMC free article] [PubMed] [Google Scholar]
- Wu TD, and Nacu S (2010). Fast and SNP-tolerant detection of complex variants and splicing in short reads. Bioinformatics 26, 873–881. [DOI] [PMC free article] [PubMed] [Google Scholar]
- Wu TD, Reeder J, Lawrence M, Becker G, and Brauer MJ (2016). GMAP and GSNAP for Genomic Sequence Alignment: Enhancements to Speed, Accuracy, and Functionality. Methods Mol Biol 1418, 283–334. [DOI] [PubMed] [Google Scholar]
- Yaari G, Bolen CR, Thakar J, and Kleinstein SH (2013). Quantitative set analysis for gene expression: a method to quantify gene set differential expression including gene-gene correlations. Nucleic Acids Res 41, e170. [DOI] [PMC free article] [PubMed] [Google Scholar]
Associated Data
This section collects any data citations, data availability statements, or supplementary materials included in this article.
Supplementary Materials
Supplementary Table 1: Patient and tumor characteristics, clinical outcomes, and gene alterations, Related to Figures 1, 2, 3, 4, and 5.
Supplementary Table 2: Summarized patient characteristics, Related to Figure 1.
Supplementary Table 3: NMF cluster gene and pathway level analyses, Related to Figure 1.
Supplementary Table 4: Univariate vs. multivariate PFS analyses in NMF subgroups, Related to Figure 2.
Supplementary Table 5: Genomic alterations in primary versus metastatic tumors, Related to Figure 3.
Supplementary Table 6: Genomic alterations in sarcomatoid subsets, Related to Figure 5.
Data Availability Statement
Qualified researchers may request access to individual patient-level data through the clinical study data request platform (http://www.clinicalstudydatarequest.com). Further details on Roche’s criteria for eligible studies are available here: (https://clinicalstudydatarequest.com/Study-Sponsors/Study-Sponsors-Roche.aspx).
For further details on Roche’s Global Policy on the Sharing of Clinical Information and how to request access to related clinical study documents, see here (http://www.roche.com/research_and_development/who_we_are_how_we_work/clinical_trials/our_commitment_to_data_sharing.htm).
RNA-seq, somatic alteration, and clinical outcomes data supporting the findings in this manuscript are deposited in the European Genome-Phenome Archive under accession number EGAS00001004353.