

Abstract
PURPOSE:
High-dose-rate (HDR) prostate brachytherapy uses volumetric imaging for treatment planning. Our institution transitioned from computed tomography (CT)-based planning to MRI-based planning with the hypothesis that improved visualization could reduce treatment-related toxicity. This study aimed to compare the patient-reported health-related quality of life (hrQOL) and physician-graded toxicity outcomes of CT-based and MRI-based HDR prostate brachytherapy.
METHODS:
From 2016 to 2019, 122 patients with low- or intermediate-risk prostate cancer were treated with HDR brachytherapy as monotherapy. Patients underwent CT only or CT and MRI imaging for treatment planning and were grouped per treatment planning imaging modality. Patient-reported hrQOL in the genitourinary (GU), gastrointestinal (GI), and sexual domains was assessed using International Prostate Symptom Score and Expanded Prostate Cancer Index Composite Short Form-26 questionnaires. Baseline characteristics, changes in hrQOL scores, and physician-graded toxicities were compared between groups.
RESULTS:
The median follow-up was 18 months. Patient-reported GU, GI, and sexual scores worsened after treatment but returned toward baseline over time. The CT cohort had a lower baseline mean International Prostate Symptom Score (5.8 vs. 7.8, p = 0.03). The other patient-reported GU and GI scores did not differ between groups. Overall, sexual scores were similar between the CT and MRI cohorts (p = 0.08) but favored the MRI cohort at later follow-up with a smaller decrease in Expanded Prostate Cancer Index Composite Short Form-26 sexual score from baseline at 18 months (4.9 vs. 19.8, p = 0.05). Maximum physician-graded GU, GI, and sexual toxicity rates of grade ≥2 were 68%, 3%, and 53%, respectively, with no difference between the cohorts (p = 0.31).
CONCLUSION:
Our study shows that CT- and MRI-based HDR brachytherapy results in similar rates of GU and GI toxicity. MRI-based planning may result in improved erectile function recovery compared with CT-based planning. Published by Elsevier Inc. on behalf of American Brachytherapy Society.
Keywords: High-dose-rate brachytherapy, Prostate cancer, Computed tomography planning, Magnetic resonance imaging planning, Patient-reported toxicity, Quality of life
Introduction
High-dose-rate (HDR) brachytherapy as monotherapy has been shown to be a safe and effective method of treating men with low- and intermediate-risk prostate cancer (1–6). Modern imaging aids in brachytherapy planning and allows for improved delivery of high doses of radiation to the prostate while reducing dose to adjacent, normal organs (7–8). Computed tomography (CT) imaging is widely available in radiation oncology departments and is the most commonly used imaging modality in prostate brachytherapy planning. HDR brachytherapy with CT-based planning demonstrates high levels of disease control with an acceptable toxicity profile (3–6). However, poor soft tissue contrast in CT scans can lead to imprecise and variable delineation of the prostate resulting in potential underdosing of the target or overdosing nearby normal tissues (9–11). Ultrasound-based treatment planning is a frequently used alternative imaging modality for HDR treatment planning. However, ultrasound-based treatment planning requires a unique workflow and a shielded operating room, which may not be available to all treatment centers (12).
Magnetic resonance imaging (MRI) has excellent soft tissue contrast and has the potential to address the difficulty of target delineation with CT-based HDR planning (13–15). Studies in the setting of external beam radiotherapy have shown that prostate delineation with MRI resulted in smaller target volumes and less variability as compared with CT (13,16). This has the potential to reduce dose to normal tissues, and thereby potentially reduce treatment-related toxicity.
We have previously reported our institutional experience incorporating MRI imaging into our CT-based prostate brachytherapy workflow(17). We found that the use of MRI for prostate brachytherapy target delineation resulted in a smaller planning target volume (PTV) adjusted for baseline prostate size. However, it is unknown whether these dosimetric differences between CT-based and MRI-based prostate HDR brachytherapy planning results in differences in clinical outcomes. The objective of our study was to determine if MRI-based prostate HDR brachytherapy planning was associated with reduced treatment-related toxicity compared with CT-based treatment, as measured by patient-reported hrQOL and physician-graded toxicity.
Methods and materials
Study design and patient selection
We performed a retrospective cohort study of a prospectively maintained, institutional review board-approved database of patients treated with HDR brachytherapy for prostate cancer at our institution from 2016 to 2019. All patients provided informed consent before participating. We selected all patients treated at our institution with National Cancer Center Network low -or intermediate -risk prostate cancer who underwent definitive HDR brachytherapy as monotherapy. Patient prostate gland size was assessed before treatment with preoperative multiparametric MRI when available, otherwise via transrectal ultrasound. Patients received 13.5 Gy × two fractions delivered over two implants, given one to two weeks apart. Patients who received supplemental external beam radiation or androgen deprivation therapy were excluded from the study.
HDR treatment
Our HDR brachytherapy implant procedure and treatment planning details have been previously described (18). In brief, patients were implanted with between 17 and 22 catheters based on gland size under transrectal ultrasound guidance. After implantation, CT and, as described below, MRI of the prostate were obtained and registered for target delineation in the MRI group. The prostate was segmented, and an asymmetric planning target volume of 0–5 mm was created and extended to encompass the proximal seminal vesicles. The second fraction was given one to two weeks after initial treatment, based on patient, physician, and operating room availability. Our target dose constraints for each treatment consisted of PTV V100 ≥ 95%, PTV V150 ≤ 35%, PTV V200 ≤ 20%, urethra D0.1 cc < 120%, urethra D10% < 115%, bladder V75%< 1 cc, and rectum V75% < 1 cc.
Exposure and outcome variables of interest
Our institution had historically used CT-based planning for HDR brachytherapy. In 5/2017, we began using MRI-based planning to aid in prostate delineation. Patients treated before 5/2017 were planned using only CT imaging. After 5/2017, a 1.5 T T2 MRI with axial, sagittal, and coronal acquisitions of the prostate and 3 mm slice thickness was acquired for most patients undergoing HDR brachytherapy. For those patients, the postimplant MRI and CT scans were coregistered together and used for target and organs at risk delineation. Patients were dichotomized as a function of the treatment planning imaging they underwent: CT only (CT cohort) or CT and MRI (MRI cohort). The primary outcomes of interest were patient-reported hrQOL and physician-graded toxicities. These outcomes were compared between both groups.
Patient-reported health-related QOL and physician-graded toxicity assessment
Patient-reported genitourinary (GU), gastrointestinal (GI), and sexual quality of life (QOL) were assessed using the International Prostate Symptom Score (IPSS) and the Expanded Prostate Cancer Index Composite Short Form (EPIC-26) (19,20). Baseline patient-reported hrQOL scores in the GU, GI, and sexual domains were obtained before each patient’s first HDR treatment. Patient-reported hrQOL scores were assessed at each of the patient’s follow-up appointments. Follow-up appointments typically occurred at 1 month, 3 months, 6 months, 12 months, and subsequently every 6 months after the second HDR treatment. For the first 39 patients, only IPSS evaluations were used to assess patient-reported QOL. For the subsequent patients, both IPSS and EPIC-26 GU, GI, and sexual function questionnaires were used to assess patient-reported hrQOL.
Physician-graded toxicity was assessed using Common Terminology Criteria for Adverse Events v5.0 criteria (21). Physician-graded toxicity was assessed at each follow-up visit and reported as the highest grade reported during any follow-up examination.
Minimal clinically important differences
To further evaluate the patient-reported hrQOL, we characterized statistically significant differences in IPSS or EPIC-26 scores over time or between groups as clinically important or not clinically important through the use of previously reported minimal clinically important difference (MCID) assessments (22–24). For the IPSS, we used previously reported data which showed that a change of 3.0 points or greater represent a clinically meaningful change in urinary function. (23). For the EPIC-26 scores, we used previously reported data that showed that a change of six points for urinary incontinence score, five points for urinary obstruction score, four points for bowel score, and 10 points for sexual score to represent an MCID (24).
Statistical analysis
Patient demographic, clinical, and dosimetric characteristics were compared between the two treatment groups. Linear regression analysis was used to compare patient age, gland size, pretreatment prostate specific antigen (PSA), and dosimetric parameters by treatment planning modality. Chi-square analysis was used to compare patients based on T-stage, PSA group, Gleason group, National Cancer Center Network risk group, pretreatment medical comorbidities, pretreatment urinary and erectile medication utilization, use of urinary and erectile medication at last follow-up, and maximum reported physician-graded toxicity. Changes in patient-reported hrQOL over time and between groups were compared using mixed linear effects models. The change in patient-reported hrQOL score from baseline (ΔIPSS and ΔEPIC) was calculated at each follow-up assessment. The difference in the ΔIPSS and ΔEPIC scores at each follow-up assessment was compared between cohorts using linear regression. Effects were deemed statistically significant if they had a p-value ≤ 0.05. If a statistically significant difference was found at any time point between the two groups, additional evaluation was performed to see if the numerical difference in the assessment led to an MCID as described previously. The software system SPSS (IBM SPSS Statistics for Windows, version 25.0; IBM Corp., Armonk, NY, USA) was used for data analysis.
Results
One hundred and twenty-two patients were included in the study. The CT and MRI cohorts each consisted of 61 patients. The median follow-up was 18 months (range: 1–43 months). The CT-cohort had longer median follow-up (25 months vs. 13 months, p < 0.001). The demographic, oncologic, and dosimetric specifics of the treated population and the two treatment cohorts are outlined in Table 1. The prostate gland size did not differ between the two groups (36.4 cc vs. 35 cc, p = 0.624). The mean PTV volume was larger in the CT cohort than the MRI cohort (89.9 cc vs 75.4 cc, p = −0.002) due to the improved ability to visualize the boundaries of the prostate on MRI during target delineation. The PTV V200% (p < 0.001), PTV V150% (p < 0.001), and urethra D 0.1 cc (p = 0.019) were lower in CT cohort than the MRI cohort. The bladder V75% was higher in the CT cohort than the MRI cohort (p = 0.012). At baseline, the CT cohort had a lower mean IPSS than the MRI cohort (5.8 vs. 7.8, p = 0.03). There were no other differences in the baseline demographic, oncologic, or dosimetric parameters between the two cohorts.
Table 1.
Patient demographic, oncologic, and dosimetric specifics
| Characteristic | Treated population | CT cohort | MRI cohort | p-value |
|---|---|---|---|---|
| Number | 122 | 61 | 61 | — |
| Median follow-up: months | 18 | 25 | 13 | <0.001 |
| Age: median (range) | 67.5 (47–78) | 68 (54–78) | 67 (47–78) | 0.639 |
| Gland size: median (range) | 36 cc (14.5–91.9) | 36.4 cc (17–77.8) | 35 cc (14.5–91.9) | 0.624 |
| PSA: median (range) | 6.42 (0.52–16.4) | 6.46 (1.2–16.4) | 6.18 (0.52–14.6) | 0.307 |
| PSA group: n (%) | 0.158 | |||
| PSA < 10 | 100 (82%) | 47 (77%) | 53 (87%) | |
| 10≤PSA≤20 | 22 (18%) | 14 (23%) | 8 (13%) | |
| T-stage: n (%) | 0.485 | |||
| T1c | 95 (78%) | 50 (82%) | 45 (74%) | |
| T2a | 22 (18%) | 10 (16%) | 12 (20%) | |
| T2b | 4 (3%) | 1 (2%) | 3 (5%) | |
| T2c | 1 (1%) | 0 (0%) | 1 (1%) | |
| Gleason group: n (%) | 0.409 | |||
| Group 1 | 36 (30%) | 21 (34%) | 15 (25%) | |
| Group 2 | 64 (52%) | 31 (51%) | 33 (54%) | |
| Group 3 | 22 (18%) | 9 (15%) | 13 (21%) | |
| Risk group: n (%) | 0.661 | |||
| Low | 29 (24%) | 16 (26%) | 13 (21%) | |
| Favorable intermediate | 61 (50%) | 31 (51%) | 30 (49%) | |
| Unfavorable intermediate | 32 (26%) | 14 (23%) | 18 (30%) | |
| Medical comorbidities: n (%) | ||||
| Hypertension | 62 (51%) | 31 (51%) | 31 (51%) | 1 |
| Hyperlipidemia | 63 (52%) | 34 (56%) | 29 (48%) | 0.469 |
| Diabetes mellitus | 30 (25%) | 17 (28%) | 13 (21%) | 0.539 |
| Coronary artery disease | 11 (9%) | 5 (8%) | 6 (10%) | 1 |
| Congestive heart failure | 4 (3%) | 2 (3%) | 2 (3%) | 1 |
| Medication use at baseline: n (%) | ||||
| Urinary medication | 28 (23%) | 13 (21%) | 15 (25%) | 0.667 |
| Erectile medication | 36 (30%) | 18 (30%) | 18 (30%) | 1 |
| Medication use at last follow-up: n (%) | ||||
| Urinary medication | 72 (59%) | 34 (56%) | 38 (62%) | 0.46 |
| Erectile medication | 62 (51%) | 32 (53%) | 30 (49%) | 0.72 |
| Dosimetric parameters: mean (SD) | ||||
| PTV volume | 82.6 cc (25.9) | 89.9 cc (26.5) | 75.4 cc (23.2) | 0.002 |
| PTV V200% | 8.5% (1.4%) | 7.8% (1.2%) | 9.1% (1.3%) | <0.001 |
| PTV VI50% | 31.4% (2.9%) | 30.3% (3.2%) | 32.6% (1.8%) | <0.001 |
| PTV VI00% | 96.9% (1.2%) | 96.7% (1.2%) | 97.1% (1.2%) | 0.079 |
| Urethra DO. 1 cc | 114.7% (2.1%) | 114.3% (2.3%) | 115.2% (1.7%) | 0.019 |
| Urethra D10% | 109.4% (17.1%) | 106.7 (21.4%) | 112.1% (10.5%) | 0.085 |
| Bladder V75% | 0.84 cc (0.51) | 0.95 cc (0.65) | 0.72 cc (0.26) | 0.012 |
| Rectum V75% | 0.72 cc (0.52) | 0.80 cc (0.46) | 0.65 cc (0.56) | 0.102 |
Genitourinary QOL
The changes in the patient-reported GU QOL scores over time for the whole treated population are shown in Table 2 and Fig. 1. There was a significant increase in IPSS with reciprocal decline in EPIC-26 urinary incontinence and EPIC-26 urinary obstruction scores from baseline, with gradual return toward baseline over time. The increase above baseline in IPSS at the 1-, 3-, and 6-month assessments constituted a MCID. The decrease in EPIC-26 urinary incontinence scores at the 1-, 3-, 12-, and 18-month assessments constituted an MCID. The decrease EPIC-26 urinary obstruction scores at the 1- and 3-month assessments constituted an MCID.
Table 2.
Patient-reported hrQOL outcomes over time compared with baseline
| Follow-up assessment | ||||||
|---|---|---|---|---|---|---|
| Patient-reported outcome | Baseline | 1 mo. | 3 mo. | 6 mo. | 12 mo. | 18 mo. |
| IPSS | ||||||
| Number | 119 | 88 | 93 | 87 | 74 | 58 |
| Mean | 6.8 | 14.7 | 9.9 | 10.0 | 9.1 | 9.4 |
| (SD) | (5.1) | (7.5) | (5.6) | (6.8) | (6.2) | (5.4) |
| ΔIPSS | — | 7.9 | 3.1 | 3.2 | 2.3 | 2.6 |
| (p- value) | — | (<0.001) | (<0.001) | (<0.001) | (<0.001) | (<0.001) |
| Urinary incontinence | ||||||
| Number | 79 | 66 | 77 | 79 | 71 | 50 |
| Mean | 90.2 | 76.9 | 81.9 | 84.7 | 82.34 | 84.2 |
| (SD) | (16.9) | (21.7) | (21.6) | (18.6) | (18.9) | (13.9) |
| ΔEPIC | — | −13.3 | −8.3 | −5.5 | −7.7 | −6.0 |
| (p- value) | — | (0.034) | (<0.001) | (<0.001) | (<0.001) | (0.002) |
| Urinary obstruction | ||||||
| Number | 80 | 63 | 77 | 79 | 69 | 49 |
| Mean | 87.7 | 66.9 | 80.6 | 84.3 | 83.9 | 83.7 |
| (SD) | (15.4) | (27.4) | (18.6) | (16.0) | (16.1) | (15.0) |
| ΔEPIC | — | −20.8 | −7.1 | −3.4 | −3.8 | −4.0 |
| (p- value) | — | (<0.001) | (0.002) | (0.057) | (0.099) | (0.281) |
| Bowel | ||||||
| Number | 83 | 66 | 82 | 82 | 71 | 53 |
| Mean | 93.0 | 86.3 | 90.7 | 91.3 | 90.8 | 92.2 |
| (SD) | (14.0) | (18.1) | (14.5) | (15.0) | (16.3) | (13.4) |
| ΔEPIC | — | −6.7 | −2.3 | −1.7 | −2.2 | −0.8 |
| (p- value) | — | (0.003) | (0.007) | (0.030) | (0.291) | (0.245) |
| Sexual | ||||||
| Number | 80 | 59 | 79 | 79 | 72 | 52 |
| Mean | 51.2 | 21.9 | 24.7 | 23.0 | 27.5 | 36.5 |
| (SD) | (29.3) | (22.2) | (22.5) | (22.0) | (22.2) | (24.3) |
| ΔEPIC | — | −29.3 | −26.6 | −28.3 | −23.7 | −14.8 |
| (p- value) | — | (<0.001) | (<0.001) | (<0.001) | (<0.001) | (<0.001) |
Fig. 1.

Mean International Prostate Symptom Scores (IPSS) and Expanded Prostate Cancer Index Composite (EPIC) scores in the urinary incontinence, urinary obstruction, bowel, and sexual domains with corresponding 95% confidence intervals of the entire treated population over time.
The comparison in patient-reported GU QOL scores between the two cohorts is outlined in Table 3 and Figs. 2a–2c. Overall, the IPSS of the CT cohort was lower than the MRI cohort (p = 0.02). This was driven by a lower baseline IPSS in the CT cohort (5.8 vs. 7.8, p = 0.03). This difference did not meet criteria for the MCID. There were no significant differences in the ΔIPSS at any follow-up assessment between the two groups.
Table 3.
Comparison of patient-reported hrQOL over time and from baseline between CT and MRI cohorts
| Follow-up assessment | ||||||
|---|---|---|---|---|---|---|
| Patient-reported Outcome | Baseline | 1 mo. | 3 mo. | 6 mo. | 12 mo. | 18 mo. |
| IPSS | ||||||
| CT | ||||||
| Number | 59 | 44 | 51 | 45 | 41 | 37 |
| Mean (SD) | 5.8 (4.5) | 13.6 (6.7) | 8.9 (5.9) | 9.6 (7.5) | 9.7 (6.8) | 9.5 (5.7) |
| ΔIPSS | — | −7.8 | −3.1 | −3.8 | −4.0 | −3.7 |
| MRI | ||||||
| Number | 60 | 44 | 42 | 42 | 33 | 21 |
| Mean (SD) | 7.8 (5.5) | 15.8 (8.2) | 11.2 (5.4) | 10.4(6.2) | 8.3 (5.3) | 9.2 (4.8) |
| ΔIPSS | — | −8.0 | −3.4 | −2.6 | −0.5 | −1.4 |
| Difference in ΔIPSS (p-value) | 0.2 (0.94) | 0.3 (0.86) | 1.2 (0.45) | 3.5 (0.06) | 2.3 (0.26) | |
| Urinary incontinence | ||||||
| CT | ||||||
| Number | 29 | 27 | 28 | 29 | 29 | 29 |
| Mean (SD) | 91.3 (15.8) | 81.2 (21.0) | 82.3 (22.5) | 86.3 (19.3) | 83.0 (19.2) | 85.3 (15.0) |
| ΔEPIC | — | 10.0 | 9.0 | 5.0 | 8.2 | 5.9 |
| MRI | ||||||
| Number | 50 | 39 | 49 | 50 | 42 | 21 |
| Mean (SD) | 89.5 (17.6) | 73.8 (21.9) | 81.5 (21.1) | 83.0 (17.9) | 81.8 (18.7) | 82.1 (11.8) |
| ΔEPIC | — | 15.7 | 8.0 | 6.5 | 7.7 | 7.4 |
| Difference in ΔEPIC (p-value) | 5.7 (0.39) | 1.0 (0.89) | 1.5 (0.79) | 0.5 (0.93) | 1.4 (0.80) | |
| Urinary obstruction | ||||||
| CT | ||||||
| Number | 29 | 26 | 28 | 29 | 29 | 29 |
| Mean (SD) | 89.7 (19.0) | 72.1 (22.5) | 83.0 (18.1) | 85.1 (16.0) | 82.7 (16.3) | 84.5 (13.3) |
| ΔEPIC | — | 17.6 | 6.7 | 4.7 | 7.0 | 5.3 |
| MRI | ||||||
| Number | 52 | 37 | 49 | 50 | 40 | 20 |
| Mean (SD) | 86.5 (13.1) | 63.2 (30.2) | 78.3 (18.9) | 83.4 (16.1) | 85.3 (16.0) | 82.0 (18.5) |
| ΔEPIC | — | 23.4 | 8.3 | 3.1 | 1.3 | 4.5 |
| Difference in ΔEPIC (p-value) | 5.8 (0.44) | 1.6 (0.78) | 1.6 (0.76) | 5.7 (0.28) | 0.8 (0.89) | |
| Bowel | ||||||
| CT | ||||||
| Number | 31 | 27 | 30 | 31 | 31 | 30 |
| Mean (SD) | 95.4 (10.3) | 88.6 (14.2) | 93.4 (13.7) | 93.0 (13.9) | 92.1 (14.1) | 92.4 (13.0) |
| ΔEPIC | — | 6.8 | 2.0 | 2.4 | 3.3 | 3.0 |
| MRI | ||||||
| Number | 52 | 39 | 52 | 51 | 40 | 23 |
| Mean (SD) | 91.7 (15.5) | 84.7 (20.3) | 88.2 (14.9) | 89.5 (16.1) | 89.3 (18.6) | 91.9 (14.5) |
| ΔEPIC | — | 7.0 | 3.5 | 2.2 | 2.4 | 0.2 |
| Difference in ΔEPIC (p- value) | 0.2 (0.60) | 1.5 (0.35) | 0.2 (0.61) | 0.9 (0.75) | 3.2 (0.84) | |
| Sexual | ||||||
| CT | ||||||
| Number | 30 | 24 | 29 | 30 | 30 | 29 |
| Mean (SD) | 50.9 (30.7) | 23.6 (26.2) | 23.3 (23.9) | 20.4 (23.9) | 25.1 (21.3) | 31.2 (23.5) |
| ΔEPIC | — | 27.3 | 27.6 | 30.5 | 25.8 | 19.8 |
| MRI | ||||||
| Number | 50 | 35 | 50 | 49 | 42 | 23 |
| Mean (SD) | 51.4 (28.8) | 20.7 (19.3) | 25.9 (21.4) | 25.3 (20.2) | 31.0 (23.1) | 46.5 (23.2) |
| ΔEPIC | — | 30.7 | 25.5 | 26.1 | 20.4 | 4.9 |
| Difference in ΔEPIC (p-value) | 3.4 (0.72) | 2.1 (0.81) | 4.6 (0.60) | 5.4 (0.61) | 14.9 (0.05) | |
Fig. 2.

A comparison of the mean (a) International Prostate Symptom Scores (IPSS), (b) Expanded Prostate Cancer Index Composite (EPIC) urinary incontinence scores, (c) EPIC urinary obstruction scores, (d) EPIC bowel scores, and (e) EPIC sexual scores and corresponding 95% confidence intervals over time between the CT cohort (CT) and the MRI cohort (MRI).
There were no significant differences in the overall EPIC-26 urinary incontinence QOL (p = 0.13) or EPIC-26 urinary obstruction QOL scores (p = 0.18) between the two groups. There were no significant differences in the ΔEPIC urinary incontinence or ΔEPIC urinary obstruction QOL scores at any follow-up assessment between the two groups.
Gastrointestinal QOL
The EPIC-26 bowel QOL scores for the whole cohort are shown in Table 2 and Fig. 1. For the treated population, there was a significant decrease in the EPIC-26 bowel scores at the 1- and 3-month follow-up assessment as compared with baseline. Only the decrease in the EPIC-26 score at the 1-month follow-up assessment met criteria for the MCID.
The comparison in EPIC-26 bowel scores between the two cohorts is outlined in Table 3 and Fig. 2d. Overall, there was no significant difference in EPIC-26 bowel QOL scores between the CT and MRI cohorts (p = 0.08). There were no significant differences in the ΔEPIC bowel QOL scores at any follow-up assessment between the two groups.
Sexual hrQOL
The EPIC-26 sexual QOL scores for the treated population are shown in Table 2 and Fig. 1. There was a significant decrease in the EPIC-26 sexual QOL score at all follow-up assessments as compared with baseline. The decreases in EPIC-26 sexual QOL scores at each follow-up assessment met criteria for MCID.
The comparison in EPIC-26 sexual QOL scores over time between the two cohorts is outlined in Table 3 and Fig. 2e. Overall, there was no significant difference in EPIC-26 sexual QOL scores between the CTand MRI cohorts (p = 0.08). However, at 18-month follow-up, the MRI-cohort reported a smaller ΔEPIC sexual QOL score than the CT-cohort (4.9 vs. 19.8, difference of 14.9, p = 0.05).
Physician-graded toxicity and acute urinary retention
The overall and comparative rates of the maximum physician-graded toxicity are outlined in Fig. 3. The overall rate of Grade 2 GU, GI, and sexual physician-graded toxicity was 67%, 3%, and 52%, respectively. There was a single incident of Grade 3 GU toxicity in the CT cohort and a single incident of Grade 3 sexual toxicity in the MRI cohort. There were no reported Grade 3 GI toxicities. There were no Grade 4 or 5 toxicities. There was no difference in the rates of GU (p = 0.391), GI (p = 0.227), or sexual (p = 0.310) physician-graded toxicities between the CT and MRI cohorts. There were six total incidents of acute urinary retention (2 CT vs. 4 MRI, p = 0.402), for a rate of 5% overall.
Fig. 3.
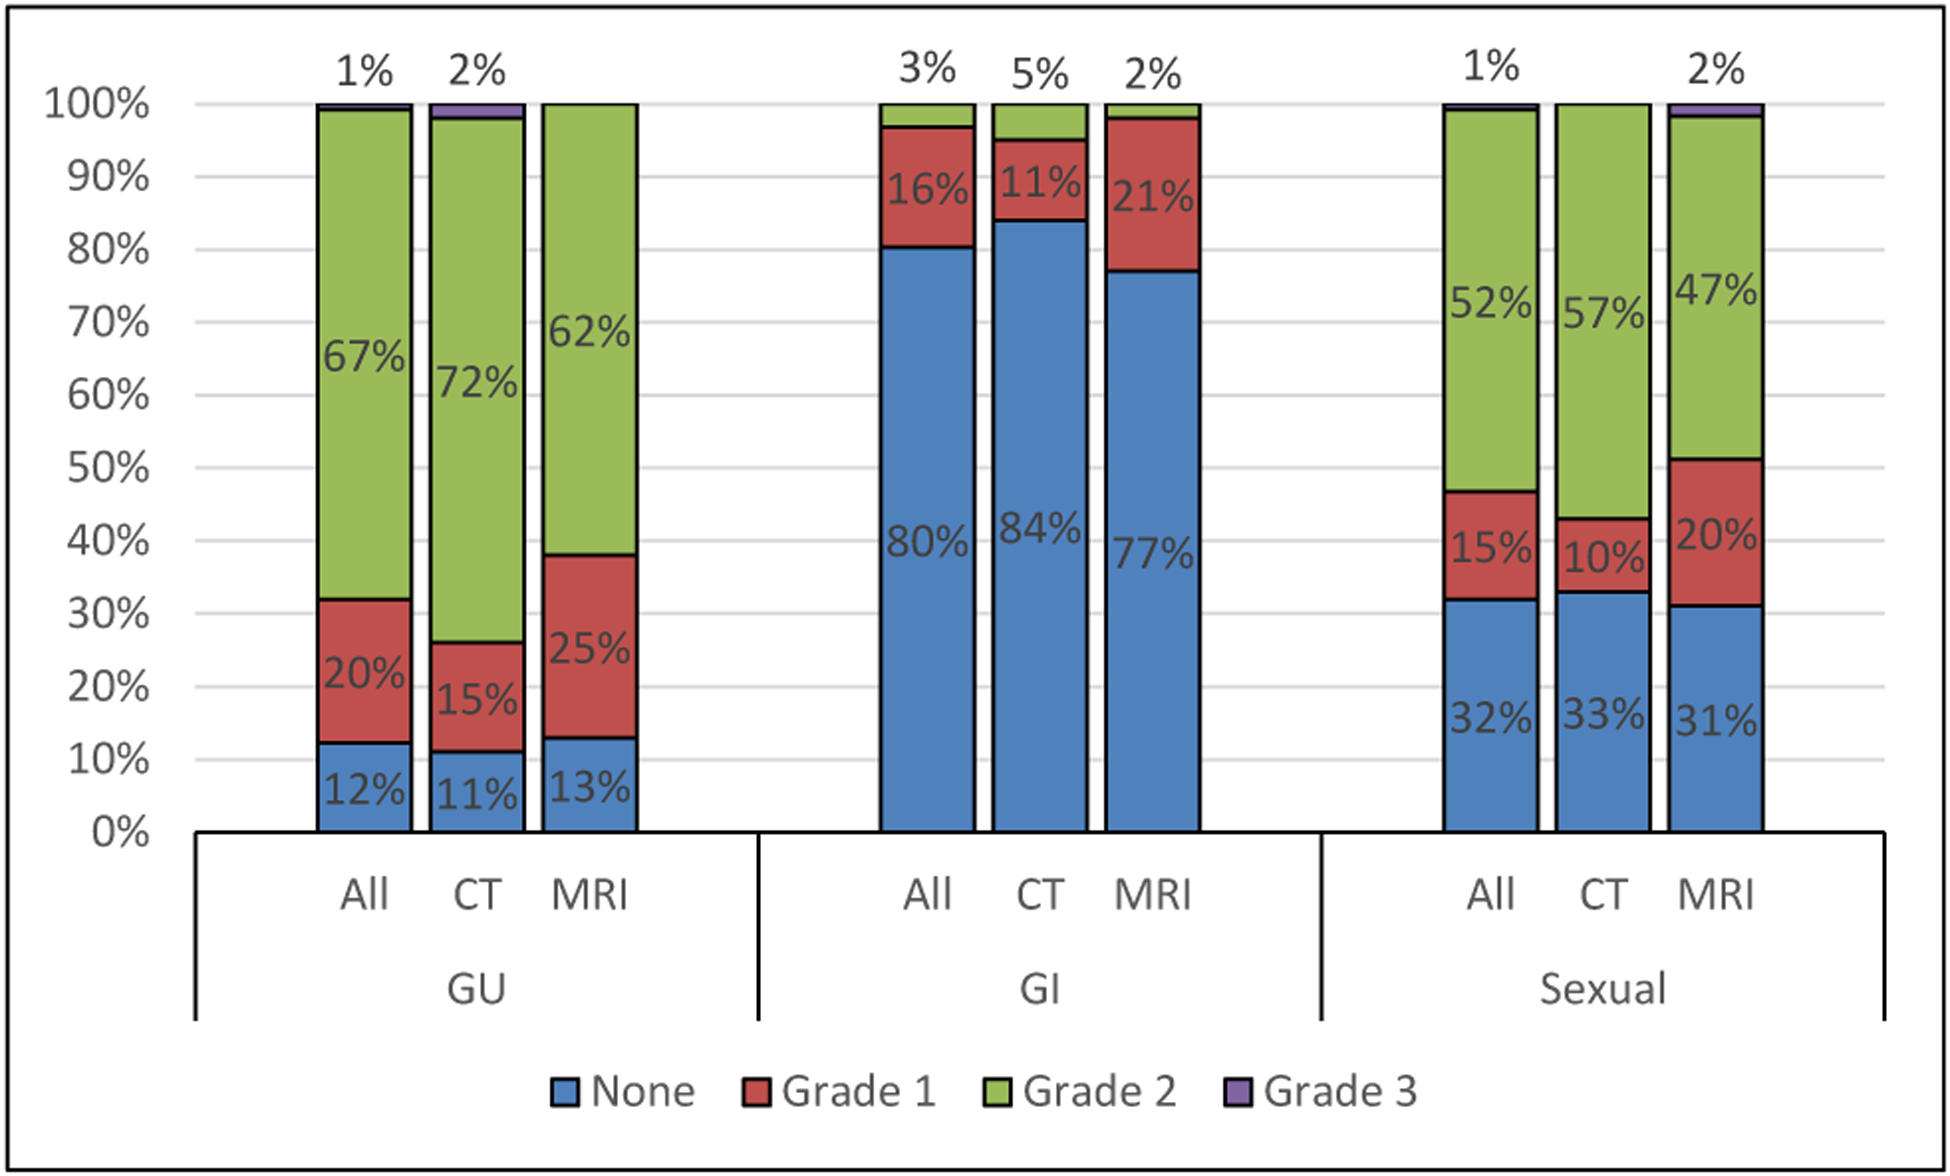
A comparison of the maximum reported physician-graded toxicity in the genitourinary (GU), gastrointestinal (GI), and sexual domains between the entire treated cohort (all), CT cohort (CT), and the MRI cohort (MRI).
Discussion
We performed a retrospective cohort study of patients with low- and intermediate-risk prostate cancer undergoing definitive HDR prostate brachytherapy monotherapy with 27 Gy in two fractions. Half of the patients were planned using CT imaging and the other half planned with the addition of MRI imaging with the catheters in position. We aimed to compare patient-reported hrQOL and physician-graded toxicity as a function of treatment planning imaging modality. We found no differences in patient-reported GU or GI QOL scores and no differences in physician-graded toxicity rates between the two cohorts. However, patients planned using MRI imaging showed a more robust recovery of their EPIC-26 sexual scores at later follow-up, with a 15-point improvement in mean EPIC-26 sexual QOL score at 18- month posttreatment. This sexual QOL score improvement constitutes an MCID and suggests that the superior soft tissue delineation made possible with MRI may lead to reduced impact of treatment on long-term erectile function.
HDR brachytherapy is a well studied and widely used method of treating localized prostate cancer. Modern imaging techniques have allowed for improved target delineation and treatment planning. In a series similar to ours, Gaudet et al. reported on their single institutional results of treating 30 patients with low- or intermediate-risk prostate cancer with 27 Gy over two implants using CT-based treatment planning (25). They collected patient-reported hrQOL results using the IPSS and EPIC questionnaires and found 57% of patients treated experienced moderate to severe urinary symptoms at the 1-month assessment after implantation, with a rapid recovery toward baseline over time. In contrast, GI symptoms did not change from baseline, whereas sexual symptoms decreased after implantation, and failed to return to baseline. Our results mirror this experience, with similar rates of patient-reported hrQOL scores and physician-graded toxicities. The patients in our study reported GU and GI QOL scores that worsened immediately after treatment, with a return toward baseline over time. However, the patient-reported sexual QOL dropped after treatment and had a gradual trend toward a return to baseline. Our data show higher rates of maximum physician-graded GU toxicity rates. This is likely due in part to our prophylactic use of tamsulosin. Patients who continued tamsulosin after the implant out of preference were technically Grade 2 based on Common Terminology Criteria for Adverse Events v5.0 criteria. GI and sexual toxicity were substantially lower.
The wide availability of CT scanning in radiation oncology departments has made CT-based planning the most common form of image-based prostate brachytherapy planning. However, CT has poor soft tissue contrast as compared with other imaging modalities. In prostate radiotherapy, this often leads to increased prostate target volume and greater variability in target delineation. In one study, Roach et al. examined the impact of treatment planning imaging on target delineation in external beam radiation therapy by comparing prostate volumes obtained from CT imaging and MRI imaging. They found that when using MRI, the target volume outlined was 32% smaller than the same volume outlined using CT. The posterior aspect and the apex were the areas with the greatest degree of difference between the different imaging modalities. (12). Rasch et al. found similar findings when they noted an average of 30% decrease in target volume when physicians used MRI for contouring the prostate as compared with the same target contoured using CT. In this study, however, they noted no difference in rectal volume contouring between CT and MRI (16). Both studies were in the setting of external beam radiation therapy. We previously reported our institutional experience comparing differences in the delineation target volumes and organs at risk in the prostate HDR brachytherapy setting. We had found that the use of MRI in treatment planning resulted in a smaller PTV when accounting for baseline prostate volume (17). However, none of these studies assess for the potential clinical impact of these findings.
The question remained, do these smaller target volumes manifest into differences in the rates of treatment-related toxicity, and are these potential differences clinically meaningful? The difference in target volume as a function of imaging modality was also found in this study, with patients planned using MRI-based imaging having a 16% smaller PTV volume than those planned with CT-based imaging. Our hrQOL results suggest that late sexual toxicity is improved with the use of MRI in prostate delineation, with a clinically meaningful difference in the EPIC-26 sexual QOL score at 18 months, favoring MRI. This difference is likely due to smaller target volumes, leading to decreased dose to the adjacent critical structures involved in sexual function, including the periprostatic neurovascular tissues, external urethral sphincter, and the penile bulb. There was no significant difference in GU or GI patient-reported hrQOL. There were also no differences in physician-graded toxicity as a function of imaging modality.
Because of our sample size, we could not conduct sub-group analyses to determine the impact of baseline erectile function on outcomes with each imaging modality. Therefore, we cannot make conclusions regarding the impact of treatment planning imaging modality based on specific baseline erectile function status (i.e. no function, limited erectile function, and good erectile function). However, given that both groups were balanced in terms of baseline EPIC-26 sexual function scores, our results can be applied to the general population undergoing HDR.
To the authors’ knowledge, there are no other studies that have explored the relationship between brachytherapy planning imaging modality and toxicity outcomes. The next steps in this research are to evaluate the effect of dose to the adjacent critical structures involved in sexual function to determine potential dose constraints to prevent toxicity. Our group is actively studying the dose to the MRI-defined periprostatic neurovascular tissues, external urethral sphincter, and the penile bulb. We aim to evaluate how these organs at risk potentially impact sexual function and if the dose delivered to these organs are influenced by imaging modality. In addition, we plan on assessing late toxicity effects and oncologic outcomes as a function of brachytherapy planning imaging modality. Longer follow-up and a larger patient cohort are required to assess for potential differences in late toxicity, biochemical control, and overall survival. We plan to calculate these clinical end points from these data in the future.
An inherent limitation to this study is the retrospective study design and its single institution nature. There may be unique aspects of our patient population and treatment delivery that may confound the relationship between imaging modality and outcomes. Furthermore, the risk of selection bias exists. In addition, the temporal differences in the use of CT- versus MRI-introduced differences in the median follow-up as well as the number of completed hrQOL questionnaires available for both baseline and long-term follow-up assessments between the cohorts. These findings may influence the differences in hrQOL scores we evaluated. We attempted to mitigate these issues by evaluating the difference in differences, but these issues may still confound our findings. Further multiinstitutional and prospective data with a larger number of patients with longer follow-up are needed to validate these findings.
Conclusions
MRI-based treatment planning is feasible and preliminary data indicate similar patient-reported and physician-graded outcomes compared with CT-based planning, with suggestion of improved erectile function recovery when MRI-based planning is used. These data are hypothesis generating. Longer follow-up is needed to determine long-term differences between imaging modalities, and prospective validation in a multiinstitution setting is warranted.
Funding sources:
This research did not receive any specific grant from funding agencies in the public, commercial, or not-for-profit sectors.
Footnotes
Disclosure: The authors report no proprietary or commercial interest in any product mentioned or concept discussed in this article.
References
- [1].Yoshioka Y, Konishi K, Sumida I, et al. Monotherapeutic high-dose-rate brachytherapy for prostate cancer: five-year results of an extreme hypofractionation regimen with 54 GY in nine fractions. Int J Radiat Oncol Biol Phys, 80, 469–475. [DOI] [PubMed] [Google Scholar]
- [2].Yoshioka Y, Konishi K, Oh R, et al. High-dose-rate brachytherapy without external beam irradiation for locally advanced prostate cancer. Radiother Oncol, 80, 62–68. [DOI] [PubMed] [Google Scholar]
- [3].Demanes DJ, Martinez AA, Ghilezan M, et al. High-dose-rate monotherapy: safe and effective brachytherapy for patients with localized prostate cancer. Int J Radiat Oncol Biol Phys 2011;81: 1286–1292. [DOI] [PubMed] [Google Scholar]
- [4].Hoskin P, Rojas A, Ostler P, et al. High-dose-rate brachytherapy with two or three fractions as monotherapy in the treatment of locally advanced prostate cancer. Radiother Oncol 2014;112:63–67. [DOI] [PubMed] [Google Scholar]
- [5].Strouthos I, Tselis N, Chatzikonstantinou G, et al. High dose rate brachytherapy as monotherapy for localised prostate cancer. Radiother Oncol 2018;126:270–277. [DOI] [PubMed] [Google Scholar]
- [6].Barkati M, Williams SG, Foroudi F, et al. High-dose-rate brachytherapy as a monotherapy for favorable-risk prostate cancer: a Phase II trial. Int J Radiat Oncol Biol Phys 2012;82:1889–1896. [DOI] [PubMed] [Google Scholar]
- [7].Yang X, Rossi PJ, Jani AB, et al. Improved prostate delineation in prostate HDR brachytherapy with TRUS-CT deformable registration technology: a pilot study with MRI validation. J Appl Clin Med Phys 2017;18:202–210. [DOI] [PMC free article] [PubMed] [Google Scholar]
- [8].Marko J, Gould CF, Bonavia GH, et al. State-of-the-art imaging of prostate cancer. Urol Oncol 2016;34:134–146. [DOI] [PubMed] [Google Scholar]
- [9].Crook J, Milosevic M, Catton P, et al. Interobserver variation in postimplant computed tomography contouring affects quality assessment of prostate brachytherapy. Brachytherapy 2002;1:66–73. [DOI] [PubMed] [Google Scholar]
- [10].Al-Qaisieh B, Ash D, Bottomley DM, et al. Impact of prostate volume evaluation by different observers on CT-based postimplantation dosimetry. Radiother Oncol 2002;62:267–273. [DOI] [PubMed] [Google Scholar]
- [11].Fiorino C, Reni M, Bolognesi A, et al. Intra- and inter observer variability in contouring prostate and seminal vesicles: implications for conformal treatment planning. Radiother Oncol 1998;47:285–292. [DOI] [PubMed] [Google Scholar]
- [12].Morton GC. Prostate high-dose-rate brachytherapy: transrectal ultrasound based planning, a technical note. Pract Radiat Oncol 2015;5: 238–240. [DOI] [PubMed] [Google Scholar]
- [13].Roach M III, Faillace-Akazawa P, Malfatti C, et al. Prostate volumes defined by magnetic resonance imaging and computerized tomographic scans for three dimensional conformal radiotherapy. Int J Radiat Oncol Biol Phys 1996;3:1011–1018. [DOI] [PubMed] [Google Scholar]
- [14].Bruno F, Arrigoni F, Mariani S, et al. Advanced magnetic resonance imaging (MRI) of soft tissue tumors: techniques and applications. Radiol Med 2019;124:243–252. [DOI] [PubMed] [Google Scholar]
- [15].Venkatesan AM, Stafford RJ, Duran C, et al. Prostate magnetic resosnance imaging for brachytherapists: anatomy and technique. Brachytherapy 2017;16:679–687. [DOI] [PubMed] [Google Scholar]
- [16].Rasch C, Barillot I, Remeijer P, et al. Definition of the prostate in CT and MRI: a multi-observer study. Int J Radiat Oncol Biol Phys 1999; 43:57–66. [DOI] [PubMed] [Google Scholar]
- [17].Jordan GA, Stang K, Harris A, et al. MRI-based treatment planning for prostate high dose rate brachytherapy leads to decreased target size and rectal dose. Brachytherapy 2018;17:S83. [Google Scholar]
- [18].Solanki AA, Mysz ML, Patel R, et al. Transitioning from a low-dose-rate to a high-dose-rate prostate brachytherapy program: comparing initial dosimetry and improving workflow efficiency through targeted interventions. Adv Radiat Oncol 2018;4:103–111. [DOI] [PMC free article] [PubMed] [Google Scholar]
- [19].Barry MJ, Fowler FJ Jr, O’Leary MP, et al. The American Urological Association symptom index for benign prostatic hyperplasia. The Measurement Committee of the American Urological Association. J Urol 1992;148(5):1549e1557 10.1016/s0022-5347(17)36966-5. discussion 1564. PMID: 1279218. [DOI] [PubMed] [Google Scholar]
- [20].Wei JT, Dunn RL, Litwin MS, et al. Development and validation of the expanded prostate cancer index composite (EPIC) for comprehensive assessment of health-related quality of life in men with prostate cancer. Urology 2000;56:899–905. [DOI] [PubMed] [Google Scholar]
- [21].Common Terminology Criteria for Adverse Events (CTCAE). Version 5.0. U.S. Department of Health and Human Services Website Published: November 27. https://ctep.cancer.gov/protocoldevelopment/electronic_applications/docs/CTCAE_v5_Quick_Reference_5×7.pdf; 2017. Accessed September 29, 2020.
- [22].McGlothlin AE, Lewis RJ. Minimal clinically important difference: defining what really matters to patients. JAMA 2014;312:1342–1343. [DOI] [PubMed] [Google Scholar]
- [23].Barry MJ, Williford WO, Chang Y, et al. Benign prostatic hyperplasia specific health status measures in clinical research: how much change in the American urological association symptom index and the benign prostatic hyperplasia impact index is perceptible to patients? J Urol 1995;154:1770–1774. [DOI] [PubMed] [Google Scholar]
- [24].Skolarus TA, Dunn RL, Sanda MG, et al. Minimally important difference for the expanded prostate cancer index composite Short form. Urology 2015;85:101–105. [DOI] [PMC free article] [PubMed] [Google Scholar]
- [25].Gaudet M, Pharand-Charbonneau M, Desrosiers MP, et al. Early toxicity and health-related quality of life results of high-dose-rate brachytherapy as monotherapy for low and intermediate-risk prostate cancer. Brachytherapy 2018;17:524–529. [DOI] [PubMed] [Google Scholar]