

Abstract
Background
Although evidence suggests that demographic characteristics including minority ethnicity increase the risk of infection with Severe Acute Respiratory Syndrome Coronavirus 2 (SARS-CoV-2), it is unclear whether these characteristics, together with occupational factors, influence anti-SARS-CoV-2 IgG seroprevalence in hospital staff.
Methods
We conducted cross-sectional surveillance examining seroprevalence of anti-SARS-CoV-2 IgG amongst staff at University Hospitals of Leicester (UHL) NHS Trust. We quantified seroprevalence stratified by ethnicity, occupation and seniority of practitioner and used logistic regression to examine demographic and occupational factors associated with seropositivity.
Results
A total of 1148/10662 (10.8%) hospital staff members were seropositive. Compared to White staff (seroprevalence 9.1%), seroprevalence was higher in South Asian (12.3%) and Black (21.2%) staff. The occupations and department with the highest seroprevalence were nurses/healthcare assistants (13.7%) and the Emergency Department (ED)/Acute Medicine (17.5%), respectively. Seroprevalence decreased with seniority in medical/nursing practitioners. Minority ethnicity was associated with seropositivity on an adjusted analysis (South Asian: aOR 1.26; 95%CI: 1.07–1.49 and Black: 2.42; 1.90–3.09). Anaesthetics/ICU staff members were less likely to be seropositive than ED/Acute medicine staff (0.41; 0.27–0.61).
Conclusions
Ethnicity and occupational factors, including specialty and seniority, are associated with seropositivity for anti-SARS-Cov-2 IgG. These findings could be used to inform occupational risk assessments for front-line healthcare workers.
Keywords: COVID-19, ethnicity, healthcare worker, SARS-CoV-2, seroprevalence
Introduction
Severe Acute Respiratory Syndrome Coronavirus 2 (SARS-CoV-2), the causative agent of coronavirus disease 2019 (COVID-19), was first identified in China in January 2020.1 Since then, it has rapidly spread across the world. As the pandemic progressed, it became clearer that certain demographic characteristics, including increasing age, male gender, deprivation, certain chronic conditions, obesity and minority ethnicity predispose to the acquisition of COVID-19.2–5 Occupational risk of acquiring SARS-CoV-2 infection amongst healthcare workers has been an ongoing concern, with the Office for National Statistics (ONS) estimating a 6-fold increased prevalence amongst those working in health or social care settings as compared to the general population.6 Furthermore, there have been reports of increased infection rates, morbidity and mortality in ethnic minority healthcare workers7 which have led to new guidance on risk assessment in ethnic minority staff for NHS employers.8
How these observations translate to anti-SARS-CoV-2 IgG seropositivity, a reflection of previous SARS-CoV-2 infection, in a multi-ethnic healthcare workforce is less clear. A study in Belgium found that prior symptomatology consistent with COVID-19 and household, but not clinical, contact with suspected/confirmed COVID-19 was associated with the presence of anti-SARS-CoV-2 antibodies in hospital staff.9 Smaller studies (both <500 healthcare staff) in Germany demonstrated a low seroprevalence (1.6–2.9%) of anti-SARS-COV-2 antibodies.10,11 In London (UK), seroprevalence amongst a small number of patient-facing healthcare workers was 45.0% and in Birmingham (UK) seroprevalence in hospital staff was shown to be 24.4%.12,13 Although Shields et al.13 found that ethnic minority staff were more likely than their White counterparts to be seropositive, their study was limited by its small sample size, only examining differences in seroprevalence between two ethnic groups (White and ‘Black, Asian and Minority Ethnic—BAME’) and inability to examine the impact of specific occupational roles or seniority of a practitioner.
It is, therefore, crucial that larger studies ascertain the seroprevalence of anti-SARS-CoV-2 antibodies in healthcare staff and, given the evidence of increased risk of infection and adverse outcome in minority ethnic groups,4,14 there is an urgent need to understand whether seroprevalence of anti-SARS-CoV-2 IgG differs according to ethnicity and other demographic factors including job roles in hospital staff. These results would have major implications for policymakers involved in designing occupational health risk assessments and safe systems of work for healthcare workers in advance of a ‘second-wave’ of the pandemic.
Furthermore, emerging evidence suggests that the Abbott SARS-CoV-2 IgG assay (detecting IgG antibodies to the nucleocapsid protein) may decrease in sensitivity over time,15 examination of the effect of time between a positive SARS-CoV-2 polymerase chain reaction (PCR) test and serology testing using this assay on the likelihood of seropositivity for anti-SARS-CoV-2 is important for informing laboratory practice and future seroprevalence studies.
We, therefore, conducted cross-sectional surveillance examining the seroprevalence of anti-SARS-CoV-2 IgG amongst hospital staff employed at University Hospitals of Leicester (UHL) NHS Trust one of the largest, and most ethnically diverse, hospital trusts in the UK.
Methods
Design of surveillance programme
We undertook this surveillance programme at UHL NHS Trust. Around 36% of staff employed by the trust are from minority ethnic backgrounds.16 UHL is the only acute hospital trust serving the population of Leicester, Leicestershire and Rutland and cares for the vast majority of hospital attenders with COVID-19 from these areas.
Staff serology testing
UHL introduced voluntary anti-SARS-CoV-2 serology testing for staff members in May 2020. All staff were invited to attend a clinic within the hospital on a voluntary basis to have blood collected.
Population
We included all staff members who provided a blood sample for anti-SARS-CoV-2 IgG testing between 29 May 2020 and 13 July 2020. Those who were symptomatic or had a positive PCR assay for SARS-CoV-2 within the previous three weeks were advised not to attend.
Anti-SARS-CoV-2 IgG assay
Serum samples were analysed using the Abbott SARS-CoV-2 IgG assay (detecting IgG antibodies to the nucleocapsid protein) on the Abbott Architect i2000SR, according to manufacturer’s instructions (for details see supplementary information).
Data collection
We extracted data from the occupational health record concerning age, sex, self-reported ethnicity, occupational role, specialty, whether there was a record of a COVID-19-related absence from work and the reason given and previous result for any PCR test for SARS-CoV-2 (for details see Supplementary Tables 1–4). We used residential postcode to obtain the Index of Multiple Deprivation (IMD) quintile using an online tool provided by the UK government.17 IMD is the official measure of relative deprivation for small areas of the UK. We used postcode to derive population density in the area of residence using an ONS dataset.18 We combined these data with the result of the anti-SARS-CoV-2 IgG assay (either positive or negative).
Data analysis
We summarized continuous demographic variables as median and interquartile range (IQR) and categorical variables as count and percentage. Demographic characteristics were compared using Wilcoxon rank-sum test for non-parametric continuous variables and chi-square statistic for categorical variables. We used logistic regression to (i) evaluate factors associated with seropositivity (ii) estimate the odds ratio of antibody positivity and a spline transformation of time between PCR and serology test. For temporal analyses, subjects who underwent serology testing prior to PCR were excluded. Observations with missing data were excluded from all analyses. For further details on data analysis see supplementary information.
All analyses were conducted using Stata (StataCorp. 2017. Stata Statistical Software: Release 15.1 College Station, TX: StataCorp LLC.). P-values < 0.05 were considered statistically significant.
Ethics
This surveillance was approved and registered by the UHL NHS Trust clinical audit department (Reference number 10633). Ethical approval was not required for this surveillance.
Results
Description of cohort
Recruitment is outlined in Supplementary Figure 1. Of the 16 000 staff employed by UHL,16 11 769 (73.6%) staff attended for serology testing, of whom 10 662 (66.6%) were included in the final analysis. Supplementary Table 5 summarizes excluded observations.
Table 1 shows a description of the cohort stratified by ethnicity. A large proportion of the cohort were female (79.8%) and the median age was 44 years (IQR 33–53). In total, 23.4% were South Asian and 5.2% were Black. As compared to White staff, higher proportions of South Asian and Black staff resided in areas corresponding to the most deprived IMD quintile (14.2% versus 12.1% and 38.5% versus 12.1%). Compared to White colleagues, a greater proportion of ethnic minority staff nurses and HCAs lived in areas corresponding to the most deprived IMD quintile (28.2% versus 22.3% for HCAs, 28.8% versus 8.9% for staff nurses—Supplementary Table 6).
Table 1.
Description of the cohort stratified by ethnicity
| Ethnicity | |||||
|---|---|---|---|---|---|
| Total | White | South Asian | Black | Other | |
| Total, n(%) | 10 662 (100.0%) | 6960 (65.3%) | 2494 (23.4%) | 553 (5.2%) | 655 (6.1%) |
| Age (years), median (IQR) | 44 (33–53) | 46 (34–55) | 41 (31–50) | 42 (32–49) | 42 (33–49) |
| Sex, n(%) | |||||
| Female | 8503 (79.8%) | 5796 (83.3%) | 1817 (72.9%) | 447 (80.8%) | 443 (67.7%) |
| Male | 2159 (20.3%) | 1164 (16.7%) | 677 (27.2%) | 106 (19.2%) | 212 (32.4%) |
| Occupation, n(%) | |||||
| Doctors | 1243 (11.7%) | 545 (7.8%) | 479 (19.2%) | 54 (9.8%) | 165 (25.2%) |
| Nurses/Midwives/HCAs | 4631 (43.4%) | 3175 (45.6%) | 793 (31.8%) | 339 (61.3%) | 324 (49.5%) |
| AHPs | 550 (5.2%) | 435 (6.3%) | 75 (3.0%) | 15 (2.7%) | 25 (3.8%) |
| Pharmacy | 116 (1.1%) | 38 (0.6%) | 66 (2.7%) | * | 9 (1.4%) |
| Administrative/executive/managerial | 2078 (19.5%) | 1483 (21.3%) | 478 (19.2%) | 45 (8.1%) | 72 (11.0%) |
| Radiographers | 241 (2.3%) | 165 (2.4%) | 47 (1.9%) | 23 (4.2%) | 6 (0.9%) |
| Healthcare scientists | 528 (5.0%) | 346 (5.0%) | 145 (5.8%) | 17 (3.1%) | 20 (3.1%) |
| Estates | 1154 (10.8%) | 675 (9.7%) | 396 (15.9%) | 57 (10.3%) | 26 (4.0%) |
| Other | 121 (1.1%) | 98 (1.4%) | 15 (0.6%) | * | 8 (1.2%) |
| Specialty, n(%) | |||||
| ED & Acute medicine | 831 (7.8%) | 466 (6.7%) | 205 (8.2%) | 89 (16.1%) | 71 (10.8%) |
| Medicine (other than acute) | 1498 (14.1%) | 935 (13.4%) | 362 (14.6%) | 86 (15.6%) | 115 (17.6%) |
| Surgery | 1718 (16.1%) | 1010 (14.5%) | 442 (17.7%) | 120 (21.7%) | 146 (22.3%) |
| Paediatrics | 519 (4.9%) | 393 (5.7%) | 89 (3.6%) | 15 (2.7%) | 22 (3.4%) |
| Haematology & Oncology | 327 (3.1%) | 228 (3.3%) | 69 (2.8%) | 12 (2.2%) | 18 (2.8%) |
| Radiology & Imaging | 512 (4.8%) | 344 (4.9%) | 115 (4.6%) | 28 (5.1%) | 25 (3.8%) |
| Obstetrics & Gynaecology & Maternity | 652 (6.1%) | 530 (7.6%) | 90 (3.6%) | 17 (3.1%) | 15 (2.3%) |
| Anaesthetics & ICU | 524 (4.9%) | 300 (4.3%) | 139 (5.6%) | 31 (5.6%) | 54 (8.2%) |
| Laboratory based | 677 (6.4%) | 432 (6.2%) | 190 (7.6%) | 22 (4.0%) | 33 (5.0%) |
| Pharmacy | 251 (2.4%) | 111 (1.6%) | 118 (4.7%) | * | 18 (2.8%) |
| Community & Outpatients | 277 (2.6%) | 240 (3.5%) | 28 (1.1%) | * | 6 (0.9%) |
| Estates & Facilities | 884 (8.3%) | 520 (7.5%) | 290 (11.6%) | 52 (9.4%) | 22 (3.4%) |
| Administrative & Corporate | 605 (5.7%) | 435 (6.3%) | 132 (5.3%) | 16 (2.9%) | 22 (3.4%) |
| Other clinical services | 566 (5.3%) | 453 (6.5%) | 81 (3.3%) | 11 (2.0%) | 21 (3.2%) |
| Other | 821 (7.7%) | 563 (8.1%) | 144 (5.8%) | 47 (8.5%) | 67 (10.2%) |
| IMD quintile, n(%) | |||||
| 1 (most deprived) | 1556 (14.6%) | 841 (12.1%) | 355 (14.2%) | 213 (38.5%) | 147 (22.4%) |
| 2 | 2155 (20.2%) | 1067 (15.3%) | 797 (32.0%) | 141 (25.5%) | 150 (22.9%) |
| 3 | 1879 (17.6%) | 1161 (16.7%) | 504 (20.2%) | 83 (15.0%) | 131 (20.0%) |
| 4 | 2340 (22.0%) | 1770 (25.4%) | 401 (16.1%) | 63 (11.4%) | 106 (16.2%) |
| 5 (least deprived) | 2732 (25.6%) | 2121 (30.5%) | 437 (17.5%) | 53 (9.6%) | 121 (18.5%) |
| Population density (people per 1000 m2), median (IQR) | 3.2 (1.3–5.7) | 2.5 (0.9–4.9) | 4.9 (2.2–7.2) | 5.4 (2.5–7.7) | 4.3 (2.0–6.9) |
| Reason for work absence | |||||
| No absence | 7828 (73.4%) | 5250 (75.4%) | 1733 (69.5%) | 413 (74.7%) | 432 (66.0%) |
| Symptomatic | 1872 (17.6%) | 1107 (15.9%) | 515 (20.7%) | 97 (17.5%) | 153 (23.4%) |
| Household/track and trace contact | 835 (7.8%) | 516 (7.4%) | 217 (8.7%) | 40 (7.2%) | 62 (9.5%) |
| Shielding | 110 (1.0%) | 75 (1.1%) | 26 (1.0%) | * | 6 (0.9%) |
| Other | 17 (0.2%) | 12 (0.2%) | * | * | * |
*values ≤ 5 redacted due to potential for identification of individual participants.
Anti-SARS-CoV-2 IgG seroprevalence
Table 2 shows anti-SARS-CoV-2 IgG seroprevalence stratified by ethnicity. Overall, 1148/10 662 (10.8%) of hospital staff were seropositive. Compared to White staff (seroprevalence 9.1%), seroprevalence was significantly higher in South Asian (12.3% [chi-square P < 0.001]) and Black (21.2% [chi-square P < 0.001]) staff.
Table 2.
Anti-SARS-CoV-2 IgG seroprevalence stratified by ethnicity
| Ethnicity | ||||||||||
|---|---|---|---|---|---|---|---|---|---|---|
| Total | White | South Asian | Black | Other | ||||||
| IgG positive | IgG negative | IgG positive | IgG negative | IgG positive | IgG negative | IgG positive | IgG negative | IgG positive | IgG negative | |
| Total, n(%) | 1148 (10.8%) | 9514 (89.2%) | 632 (9.1%) | 6328 (90.9%) | 307 (12.3%) | 2187 (87.7%) | 117 (21.2%) | 436 (78.8%) | 92 (14.1%) | 563 (86.0%) |
| Age (years), median (IQR) | 42 (31–53) | 44 (33–53) | 46 (31–55) | 46 (34–54) | 39 (28–47) | 41 (31–50) | 41 (32–49) | 42 (32–50) | 43 (35–49) | 42 (33–49) |
| Sex, n(%) | ||||||||||
| Female | 935 (11.0%) | 7568 (89.0%) | 531 (9.2%) | 5265 (90.8%) | 240 (13.2%) | 1577 (86.8%) | 97 (21.7%) | 350 (78.3%) | 67 (15.1%) | 376 (84.9%) |
| Male | 213 (9.9%) | 1946 (90.1%) | 101 (8.7%) | 1063 (91.3%) | 67 (9.9%) | 610 (90.1%) | 20 (18.9%) | 86 (81.1%) | 25 (11.8%) | 187 (88.2%) |
| Occupation, n(%) | ||||||||||
| Doctors | 128 (10.3%) | 1115 (89.7%) | 48 (8.8%) | 497 (91.2%) | 58 (12.1%) | 421 (87.9%) | 9 (16.7%) | 45 (83.3%) | 13 (7.9%) | 152 (92.1%) |
| Nurses/Midwives/HCAs | 632 (13.7%) | 3999 (86.4%) | 349 (11.0%) | 2826 (89.0%) | 140 (17.7%) | 653 (82.4%) | 81 (23.9%) | 258 (76.1%) | 62 (19.1%) | 262 (80.9%) |
| AHPs | 57 (10.4%) | 493 (89.6%) | 39 (9.0%) | 396 (91.0%) | 13 (17.3%) | 62 (82.7%) | * | 12 (80.0%) | * | 23 (92.0%) |
| Pharmacy | * | 113 (97.4%) | * | 37 (97.4%) | * | 64 (97.0%) | * | * | * | 9 (100.0%) |
| Administrative/executive/ managerial | 141 (6.8%) | 1937 (93.2%) | 91 (6.1%) | 1392 (93.9%) | 40 (8.4%) | 438 (91.6%) | * | 43 (95.6%) | 8 (11.1%) | 64 (88.9%) |
| Radiographers | 24 (10.0%) | 217 (90.0%) | 11 (6.7%) | 154 (93.3%) | * | 42 (89.4%) | 7 (30.4%) | 16 (69.6%) | * | * |
| Healthcare scientists | 43 (8.1%) | 485 (91.9%) | 26 (7.5%) | 320 (92.5%) | 9 (6.2%) | 136 (93.8%) | * | 12 (70.6%) | * | 17 (85.0%) |
| Estates | 112 (9.7%) | 1042 (90.3%) | 63 (9.3%) | 612 (90.7%) | 37 (9.3%) | 359 (90.6%) | 10 (17.5%) | 47 (82.5%) | * | 24 (92.3%) |
| Other | 8 (6.6%) | 113 (93.4%) | * | 94 (95.9%) | * | 12 (80.0%) | * | * | * | 7 (87.5%) |
| Specialty, n(%) | ||||||||||
| ED & Acute medicine | 145 (17.5%) | 686 (82.6%) | 60 (12.9%) | 406 (87.1%) | 48 (23.4%) | 157 (76.6%) | 23 (25.8%) | 66 (74.2%) | 14 (19.7%) | 57 (80.3%) |
| Medicine (other than acute) | 241 (16.1%) | 1257 (83.9%) | 122 (13.1%) | 813 (87.0%) | 70 (19.3%) | 292 (80.7%) | 32 (37.2%) | 54 (62.8%) | 17 (14.8%) | 98 (85.2%) |
| Surgery | 207 (12.1%) | 1511 (88.0%) | 103 (10.2%) | 907 (89.8%) | 60 (13.6%) | 382 (86.4%) | 20 (16.7%) | 100 (83.3%) | 24 (16.4%) | 122 (83.6%) |
| Paediatrics | 30 (5.8%) | 489 (94.2%) | 22 (5.6%) | 371 (94.4%) | 6 (6.7%) | 83 (93.3%) | * | 14 (93.3%) | * | 21 (95.5%) |
| Haematology & Oncology | 30 (9.2%) | 297 (90.8%) | 22 (9.7%) | 206 (90.4%) | * | 64 (92.8%) | * | 11 (91.7%) | * | 16 (88.9%) |
| Radiology & Imaging | 36 (7.0%) | 476 (93.0%) | 17 (4.9%) | 327 (95.1%) | 10 (8.7%) | 105 (91.3%) | 7 (25.0%) | 21 (75.0%) | * | 23 (92.0%) |
| Obstetrics & Gynaecology & Maternity | 52 (8.0%) | 600 (92.0%) | 39 (7.4%) | 491 (92.6%) | 7 (7.8%) | 83 (92.2%) | * | 14 (82.4%) | * | 12 (80.0%) |
| Anaesthetics & ICU | 35 (6.7%) | 489 (93.3%) | 21 (7.0%) | 279 (93.0%) | * | 134 (96.4%) | 6 (19.4%) | 25 (80.7%) | * | 51 (94.4%) |
| Laboratory based | 43 (6.4%) | 634 (93.7%) | 21 (4.9%) | 411 (95.1%) | 17 (9.0%) | 173 (91.1%) | * | 18 (81.8%) | * | 32 (97.0%) |
| Pharmacy | 11 (4.4%) | 240 (95.6%) | 6 (5.4%) | 105 (94.6%) | * | 113 (95.8%) | * | * | * | 18 (100.0%) |
| Community & Outpatients | 20 (7.2%) | 257 (92.8%) | 17 (7.1%) | 223 (92.9%) | * | 27 (96.4%) | * | * | * | * |
| Estates & Facilities | 82 (9.3%) | 802 (90.7%) | 53 (10.2%) | 467 (89.8%) | 18 (6.2%) | 272 (93.8%) | 9 (17.3%) | 43 (82.7%) | * | 20 (90.9%) |
| Administrative & Corporate | 38 (6.3%) | 567 (93.7%) | 23 (5.3%) | 412 (94.7%) | 12 (9.1%) | 120 (90.9%) | * | 16 (100.0%) | * | 19 (86.4%) |
| Other clinical services | 70 (12.4%) | 496 (87.6%) | 51 (11.3%) | 402 (88.7%) | 11 (13.6%) | 70 (86.4%) | * | 6 (54.6%) | * | 18 (85.7%) |
| Other | 108 (13.2%) | 713 (86.9%) | 55 (9.8%) | 508 (90.2%) | 32 (22.2%) | 112 (77.8%) | 6 (12.8%) | 41 (87.2%) | 15 (22.4%) | 52 (77.6%) |
| IMD quintile, n(%) | ||||||||||
| 1 (most deprived) | 205 (13.2%) | 1351 (86.8%) | 88 (10.5%) | 753 (89.5%) | 51 (14.4%) | 304 (85.6%) | 43 (20.2%) | 170 (79.8%) | 23 (15.7%) | 124 (84.4%) |
| 2 | 282 (13.1%) | 1873 (86.9%) | 116 (10.9%) | 951 (89.1%) | 104 (13.1%) | 693 (87.0%) | 38 (27.0%) | 103 (73.1%) | 24 (16.0%) | 126 (84.0%) |
| 3 | 198 (10.5%) | 1681 (89.5%) | 108 (9.3%) | 1053 (90.7%) | 60 (11.9%) | 444 (88.1%) | 16 (19.3%) | 67 (80.7%) | 14 (10.7%) | 117 (89.3%) |
| 4 | 226 (9.7%) | 2114 (90.3%) | 157 (8.9%) | 1613 (91.1%) | 42 (10.5%) | 359 (89.5%) | 14 (22.2%) | 49 (77.8%) | 13 (12.3%) | 93 (87.7%) |
| 5 (least deprived) | 237 (8.7%) | 2495 (91.3%) | 163 (7.7%) | 1958 (92.3%) | 50 (11.4%) | 387 (88.6%) | 6 (11.3%) | 47 (88.7%) | 18 (14.9%) | 103 (85.1%) |
| Population density (people per 1000 m2), median (IQR) | 3.9 (1.6–6.3) | 3.1 (1.3–5.7) | 2.9 (0.9–5.1) | 2.5 (0.9–4.9) | 5.4 (2.8–8.0) | 4.9 (2.1–7.1) | 5.8 (3.9–8.4) | 5.3 (2.3–7.6) | 5.0 (2.2–6.8) | 4.3 (2.0–6.9) |
| Reason for work absence, n(%) | ||||||||||
| No absence | 514 (6.6%) | 7314 (93.4%) | 298 (5.7%) | 4952 (94.3%) | 122 (7.0%) | 1611 (93.0%) | 65 (15.7%) | 348 (84.3%) | 29 (6.7%) | 403 (93.3%) |
| Symptomatic | 420 (22.4%) | 1452 (77.6%) | 207 (18.7%) | 900 (81.3%) | 132 (25.6%) | 383 (74.4%) | 36 (37.1%) | 61 (62.9%) | 45 (29.4%) | 108 (70.6%) |
| Household/track and trace contact | 202 (24.2%) | 633 (75.8%) | 115 (22.3%) | 401 (77.7%) | 53 (24.8%) | 164 (75.6%) | 16 (40.0%) | 24 (60.0%) | 18 (29.0%) | 44 (71.0%) |
| Shielding | 8 (7.3%) | 102 (92.7%) | 8 (10.7%) | 67 (89.3%) | * | 26 (100.0%) | * | * | * | 6 (100.0%) |
| Other | * | 13 (76.5%) | * | 8 (66.7%) | * | * | * | * | * | * |
*values ≤ 5 redacted due to potential for identification of individual participants.
Occupational and ethnicity factors associated with anti-SARS-CoV-2 seropositivity
Table 2 shows seroprevalence by occupational role and specialty. Compared to doctors (seroprevalence 10.3%), nurses/HCAs had a significantly higher (13.7% [chi-square p = 0.002]), and pharmacists a significantly lower (2.6% [chi-square P = 0.007]), seroprevalence. Departments with the highest seroprevalence were ED/acute medicine and medicine (17.5% and 16.1%, respectively), and those with the lowest seroprevalence were paediatrics (5.8%), radiology (7.0%) and anaesthetics/Intensive care (ICU) (6.7%).
South Asian and Black nurses had significantly higher seropositivity rates than their White counterparts (17.7% versus 11.0 [chi-sqaure P < 0.001] and 23.9% versus 11.0% [chi-square P < 0.001], respectively). Ethnic differences in seroprevalence amongst medical staff were not significant. In total, 514 (44.8%) of the seropositive cohort had not registered a COVID-19 related absence from work.
Variation in anti-SARS-CoV-2 IgG seropositivity by ethnicity and job role
Supplementary Table 7 shows seroprevalence of anti-SARS-CoV-2 IgG by grade of doctor and nurse/HCA. Amongst doctors, seropositivity decreased with increasing seniority from 25.9% amongst foundation year 1 (FY1, junior) doctors to 7.7% amongst consultants. A similar pattern was seen amongst nursing staff, with a higher seroprevalence amongst staff nurses and HCAs (15.0%) compared to matrons (10.3%). No significant differences were found when comparing White and ethnic minority seropositivity rates at each grade of medical staff, however, seroprevalence was significantly higher amongst ethnic minority HCAs (21.5% versus 13.0% [chi-square P < 0.001]) and staff nurses (18.8% versus 11.2% [chi-square P < 0.001]) as compared to their White counterparts.
Sickness
As compared to those with no absence, seroprevalence was significantly higher in those who took an absence from work due to having symptoms of COVID-19 or due to having a household contact with suspected/confirmed COVID-19 (6.6% versus 22.4% and 6.6% versus 24.2%, [chi-square P < 0.001 for both], respectively). Ethnic minority staff taking leave due to COVID-19 symptoms had significantly higher seroprevalence than White staff (25.6% versus 18.7%, [chi-square P = 0.001] for South Asian and 37.1% versus 18.7% [chi-square P < 0.001] for Black) (Table 2).
Demographic and occupational factors associated with anti-SARS-CoV-2 IgG seropositivity
In a fully adjusted model, seropositivity for anti-SARS-CoV-2 IgG was more likely in those of South Asian (aOR 1.26; 95%CI: 1.07–1.49), Black (2.42; 1.90–3.09), and Other (1.35, 1.05–1.74) staff compared to White staff (Table 3). Those working in specialties including paediatrics and anaesthetics/ICU were significantly less likely to have detectable anti-SARS-CoV-2 IgG than those working in ED/Acute medicine. Leave of absence due to symptoms of COVID-19 or a household contact with suspected/confirmed infection were significantly associated with seropositivity (aOR 3.99; 3.43–4.64 and 4.38; 3.62–5.31, respectively).
Table 3.
Unadjusted and adjusted analysis of factors associated with anti-SARS-CoV-2 antibodies
| Variable | n seropositive/n total 1148/10 662 (10.8%) | OR (95% CI) | P-value | aOR (95% CI) | P-value |
|---|---|---|---|---|---|
| Age (years) | |||||
| <30 | 252/1852 (13.6%) | – | – | – | – |
| 30–39 | 256/2430 (10.5%) | 0.75 (0.62–0.90) | 0.002 | 0.80 (0.66–0.98) | 0.03 |
| 40–49 | 256/2625 (9.8%) | 0.69 (0.57–0.83) | <0.001 | 0.76 (0.62–0.93) | 0.007 |
| 50–59 | 296/2760 (10.7%) | 0.76 (0.64–0.91) | 0.003 | 1.02 (0.83–1.24) | 0.85 |
| ≥60 | 88/995 (8.8%) | 0.62 (0.48–0.80) | <0.001 | 0.98 (0.74–1.30) | 0.91 |
| Sex | |||||
| Female | 935/8503 (11.0%) | – | – | – | – |
| Male | 213/2159 (9.9%) | 0.89 (0.76–1.04) | 0.13 | 0.94 (0.79–1.13) | 0.53 |
| Ethnicity | |||||
| White | 632/6960 (9.1%) | – | – | – | – |
| South Asian | 307/2494 (12.3%) | 1.41 (1.22–1.62) | <0.001 | 1.26 (1.07–1.49) | 0.005 |
| Black | 117/553 (21.2%) | 2.69 (2.16–3.35) | <0.001 | 2.42 (1.90–3.09) | <0.001 |
| Other | 92/655 (14.1%) | 1.64 (1.29–2.07) | <0.001 | 1.35 (1.05–1.74) | 0.02 |
| Occupation | |||||
| Doctors | 128/1243 (10.3%) | – | – | – | – |
| Nurses/Midwives/HCAs | 632/4631 (13.7%) | 1.38 (1.13–1.68) | 0.002 | 1.10 (0.87–1.39) | 0.45 |
| AHPs | 57/550 (10.4%) | 1.01 (0.72–1.40) | 0.97 | 0.72 (0.46–1.13) | 0.15 |
| Pharmacy | * | 0.23 (0.07–0.74) | 0.01 | 0.39 (0.09–1.59) | 0.19 |
| Administrative/executive/managerial | 141/2078 (6.8%) | 0.63 (0.49–0.81) | <0.001 | 0.68 (0.51–0.91) | 0.01 |
| Radiographers | 24/241 (10.0%) | 0.96 (0.61–1.53) | 0.87 | 1.62 (0.85–3.09) | 0.14 |
| Healthcare scientists | 43/528 (8.1%) | 0.77 (0.54–1.11) | 0.16 | 0.84 (0.53–1.32) | 0.45 |
| Estates | 112/1154 (9.7%) | 0.94 (0.72–1.22) | 0.63 | 0.95 (0.63–1.43) | 0.79 |
| Other | 8/121 (6.6%) | 0.62 (0.29–1.29) | 0.2 | 0.88 (0.39–1.96) | 0.75 |
| Specialty | |||||
| ED & Acute Medicine | 145/831 (17.5%) | – | – | – | – |
| Medicine (other than acute) | 241/1498 (16.1%) | 0.91 (0.72–1.14) | 0.4 | 1.07 (0.84–1.36) | 0.6 |
| Surgery | 207/1718 (12.1%) | 0.65 (0.51–0.82) | <0.001 | 0.79 (0.62–1.01) | 0.06 |
| Paediatrics | 30/519 (5.8%) | 0.29 (0.19–0.44) | <0.001 | 0.38 (0.25–0.57) | <0.001 |
| Haematology & Oncology | 30/327 (9.2%) | 0.48 (0.32–0.72) | 0.001 | 0.70 (0.45–1.08) | 0.11 |
| Radiology & Imaging | 36/512 (7.0%) | 0.36 (0.24–0.52) | <0.001 | 0.41 (0.24–0.70) | 0.001 |
| Obstetrics & Gynaecology/Maternity | 52/652 (8.0%) | 0.41 (0.29–0.57) | <0.001 | 0.57 (0.40–0.82) | 0.002 |
| Anaesthetics & ICU | 35/524 (6.7%) | 0.34 (0.23–0.50) | <0.001 | 0.41 (0.27–0.61) | <0.001 |
| Laboratory based (inc Histo/Chem path/Micro) | 43/677 (6.4%) | 0.32 (0.22–0.46) | <0.001 | 0.53 (0.34–0.81) | 0.003 |
| Pharmacy | 11/251 (4.4%) | 0.22 (0.12–0.41) | <0.001 | 0.39 (0.18–0.86) | 0.02 |
| Community/Outpatients | 20/277 (7.2%) | 0.37 (0.23–0.60) | <0.001 | 0.62 (0.37–1.04) | 0.07 |
| Estates/Facilities | 82/884 (9.3%) | 0.48 (0.36–0.65) | <0.001 | 1.05 (0.67–1.62) | 0.84 |
| Administrative/Corporate | 38/605 (6.3%) | 0.32 (0.22–0.46) | <0.001 | 0.72 (0.47–1.08) | 0.11 |
| Other clinical services | 70/566 (12.4%) | 0.67 (0.49–0.91) | 0.01 | 1.16 (0.76–1.78) | 0.49 |
| Other | 108/821 (13.2%) | 0.72 (0.55–0.94) | 0.02 | 0.99 (0.74–1.32) | 0.95 |
| IMD quintile | |||||
| 1 (most deprived) | 205/1556 (13.2%) | – | – | – | – |
| 2 | 282/2155 (13.1%) | 0.99 (0.82–1.20) | 0.94 | 1.09 (0.89–1.35) | 0.4 |
| 3 | 198/1879 (10.5%) | 0.78 (0.63–0.96) | 0.02 | 0.96 (0.77–1.20) | 0.74 |
| 4 | 226/2340 (9.7%) | 0.70 (0.58–0.86) | 0.001 | 0.95 (0.76–1.19) | 0.65 |
| 5 (least deprived) | 237/2732 (8.7%) | 0.63 (0.51–0.76) | <0.001 | 0.94 (0.75–1.18) | 0.6 |
| Population density of output area (people per 1000 m2) | – | 1.04 (1.02–1.05) | <0.001 | 1.01 (0.99–1.02) | 0.39 |
| Reason for absence from work | |||||
| No absence | 514/7828 (6.6%) | – | – | – | – |
| Symptomatic | 420/1872 (22.4%) | 4.12 (3.58–4.74) | <0.001 | 3.99 (3.43–4.64) | <0.001 |
| Household contact | 202/835 (24.2%) | 4.54 (3.79–5.45) | <0.001 | 4.38 (3.62–5.31) | <0.001 |
| Shielding | 8/110 (7.3%) | 1.12 (0.54–2.30) | 0.77 | 1.12 (0.54–2.32) | 0.77 |
| Other | * | 4.38 (1.42–13.48) | 0.01 | 4.17 (1.33–13.08) | 0.01 |
*Values ≤ 5 redacted due to potential for identification of individual participants.
Description of those who underwent SARS-CoV-2 PCR testing
In total, 819 (7.7% of the analysed cohort) also had a PCR test sent at a date prior to their serology test (Supplementary Table 8). 205 (25.0%) of these were found to be PCR positive. 174 (84.9%) of the PCR positive and 79 (12.9%) of the PCR negative cohort were found to be seropositive for anti-SARS-CoV-2 IgG (P < 0.001).
Temporal effects on seropositivity rates in healthcare workers with prior SARS-CoV-2 infection
Supplementary Figure 2 shows the proportion of positive serology tests in those with a positive SARS-CoV-2 PCR test stratified by time in days between swab date and serology test date. This proportion peaked at 1.0 in the time period 35–42 days and decreased to 0.63 at ≥77 days. On adjusted analysis, with reference to those undergoing serology testing 14 days after PCR testing, those tested 40 days after PCR testing had around an 8-fold increased odds of seropositivity and those tested at any time after 55 days were less likely to be seropositive (Fig. 1).
Fig. 1.
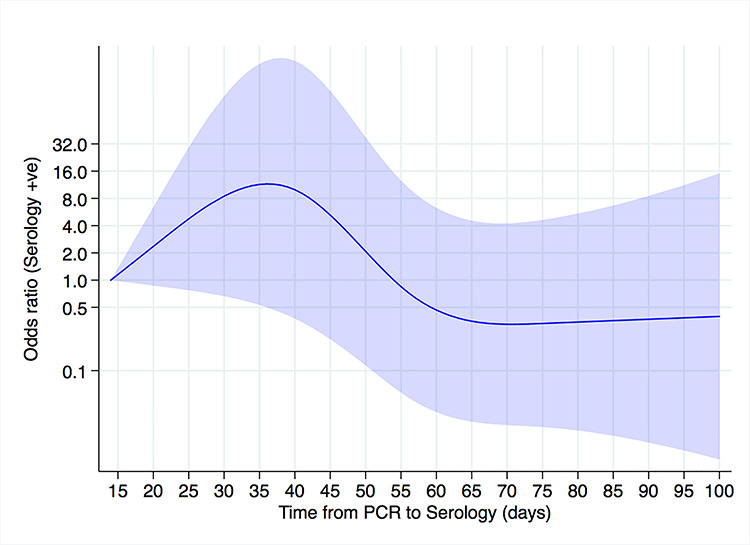
Temporal effects on adjusted odds of seropositivity in healthcare workers with confirmed SARS-CoV-2 infection. Reference (odds ratio = 1) corresponds to the minimum number of days between the PCR and serology test (14 days). Areas indicate 95% confidence intervals. There were 205 tests (174 antibody positive). Adjusted for age, sex, ethnicity, job, specialty, population density, IMD quintile and reason for absence from work.
Discussion
This cross-sectional surveillance programme is the largest healthcare worker anti-SARS-CoV-2 IgG seroprevalence survey to date and captures data from 10 662 staff, representing over 66% of the entire workforce of a large University Hospital in the UK. We found that anti-SARS-CoV-2 IgG seropositivity was significantly higher in ethnic minority groups and varied in relation to certain occupational roles, seniority and specialty.
Anti-SARS-CoV-2 IgG seroprevalence in our cohort was 10.8% which is higher than both recent PHE estimates of community seroprevalence in the Midlands and that presented in a recent UK-wide community serosurvey (which found a seroprevalence of 4.2% in the East Midlands), although we do not have information on the seroprevalence in Leicester city.19,20 This indicates that healthcare workers are at greater risk of acquiring infection with SARS-CoV-2 than the general population either through contact with infected patients, from acquiring infection in the community, via contact with infected colleagues or exposure to fomites,21 for example, in shared office spaces. We report a higher anti-SARS-CoV-2 seroprevalence in hospital workers than a smaller Belgian study (6.4%)9 and two German studies (1.6–2.9%)10,11 and a lower seroprevalence than that reported in a small cohort of healthcare workers in London, UK (45.0%)12 and Birmingham (24.4%).13 Community seroprevalence rates vary widely between countries/regions22–24 and some of these differences may be ascribed to differences in COVID-19 case-load. Other factors that may contribute to differences in seroprevalence include the point during the pandemic at which the studies were performed and the ethnicity of the staff and the departments in which they worked, which were not reported in the majority of the previous studies.
We found hospital staff of South Asian, Black and Other ethnicities were more likely to be seropositive than White staff. This adds weight and granularity to the findings of a smaller UK study which compared White to ‘BAME’ hospital staff and found the latter group to be more likely to have antibodies against SARS-CoV-2.13 Prior studies examining SARS-CoV-2 PCR status in patients seeking medical attention have demonstrated that ethnic minority individuals are at greater risk of acquiring COVID-19,3,5 although the mechanisms underlying this association remain unclear. Differing occupational roles have been suggested to be a potential driver in the relationship between ethnicity and infection risk.25–27 However, our analysis identifies that amongst a population comprising only hospital workers, ethnic minority staff are disproportionately more likely than their White colleagues to have evidence of previous SARS-CoV-2 infection. In light of the mounting evidence for increased risk of adverse outcome from COVID-19 in ethnic minority individuals,4,14 our finding that certain ethnic groups are at increased risk of having been infected with SARS-CoV-2 underscore the urgent need to develop effective, individualized, occupational risk assessments to protect these front-line workers.
We found that staff working in ED/acute medicine, specialities likely to have amongst the most frequent occupational contact with patients infected with SARS-CoV-2, as compared to many others (e.g. surgery, paediatrics and radiology) were more likely to have evidence of previous SARS-CoV-2 infection. Additionally, in keeping with a recent small study,13 we found those working in anaesthetics/ICU were less likely to be seropositive than those working in ED/acute medicine. PPE recommendations for staff in ICU contrast with those for workers on medical wards. In ICU, long-sleeved gowns and respirator facemasks are worn at all times due to the infection risk posed by Aerosol Generating Procedures—a common occurrence in ICU. As this higher level of PPE was recommended at all times, appraisal of risk by individual staff members on a patient-by-patient basis was not required, as it was on medical wards. These differences may partly explain the lower seroprevalence amongst ICU/anaesthetic staff and the lower reported death rates in these occupations.7
We found that seroprevalence was highest amongst nurses/HCAs. The duties of these staff groups necessitate frequent, prolonged contact with patients and, therefore, greater exposure to those with COVID-19, particularly as compared to those in administrative/executive roles who were more likely to be seronegative for anti-SARS-CoV-2 IgG. These results suggest that occupational exposure is an important risk factor for acquiring an infection.
A large proportion of those seropositive for anti-SARS-CoV-2 in our cohort did not register a COVID-19-related absence from work. This raises the possibility that a high proportion of staff may have acquired an asymptomatic infection (either at work or in the community) and serological evidence of this event has been captured through our surveillance.
Within nursing and medical professionals, we demonstrated a trend for decreasing seroprevalence with seniority of a practitioner. Junior members of staff generally have greater patient contact and less administrative and managerial responsibilities, factors which may draw their more senior colleagues away from direct patient care, and thus be more likely to acquire infection from patients. Another explanation may be increased staff-to-staff transmission, with junior staff being more likely to share breakrooms and office space. Interestingly, we demonstrate a significantly higher seroprevalence amongst ethnic minority junior nursing/HCA staff than their White counterparts but the same relationship is not observed amongst junior doctors. A potential explanation for this observation is that a much higher proportion of ethnic minority, as compared to White, junior nursing/HCA staff live in areas corresponding to the lowest quintile of IMD (deprivation), a trend not observed amongst junior doctors. Living in more deprived areas may be associated with acquisition of SARS-CoV-2 infection.2,28,29 This could be driven by increased population density making social distancing more difficult.30 Additionally, a higher number of residents may be engaged in professions that cannot be performed from home28,31 enhancing occupational exposure and thence community transmission. These findings should be interpreted with caution as we did not demonstrate an association between seropositivity and IMD on multivariable analysis.
Our analysis of the temporal effects on seroprevalence in healthcare workers with a history of SARS-CoV-2 PCR positivity demonstrates that the likelihood of seropositivity was highest 5–6 weeks after PCR testing and decreases thereafter. Interpretation of these findings is limited as concerns have been raised around the loss of sensitivity of the Abbott SARS-CoV-2 IgG assay after day 61 post PCR, this was not seen in other commercial assays using the nucleocapsid as the target antigen, suggesting the issue is assay specific32 and this may explain our findings.
This surveillance programme had limitations. The data are from a single centre. We lack information on the medical history of our participants and whether they worked on a COVID-19 cohort ward and cannot control for these factors in our analysis. Testing was voluntary, which could have introduced a volunteer bias, however, with such a large proportion of the workforce being tested this is unlikely to have a significant impact on results. Exclusion of observations with missing data may have introduced bias; however, we have no reason to suspect that those excluded are systematically different from those included in the final analysis, and excluded observations comprise less than 10% of those tested. The seroprevalence rate presented herein may underestimate the proportion of staff who have been infected with SARS-CoV-2 due to the issues with decreased sensitivity of the Abbott assay mentioned above,32 staff infected early in the pandemic may not have detectable antibodies at the time they attended for serological testing, leading to an underestimate of the proportion of staff that have been infected.
In summary, we found certain demographic characteristics, particularly ethnicity, and occupational factors, including specialty, job role and seniority, were associated with anti-SARS-CoV-2 seropositivity in hospital staff. Further work is required to determine how these factors mediate their influence on infection risk and the relative contributions of occupational and community transmission of SARS-CoV-2. Nonetheless, our findings have significant implications for employers and policymakers in the healthcare sector and should inform the design of holistic and individualized occupational risk assessments aimed at preventing acquisition of SARS-CoV-2 infection in front-line workers.
Conflicts of interest
Dr. Pareek reports grants and personal fees from Gilead Sciences and personal fees from QIAGEN, outside the submitted work. Prof. Khunti is a member of Independent SAGE and national lead for ethnicity and diversity for National Institute for Health Applied Research Collaborations and Director for the University of Leicester Centre for Black Minority Ethnic Health.
Funding
This work was supported by the National Institute of Health Research (NIHR). MP is supported by an NIHR Development and Skills Enhancement award (NIHR301192) and is in receipt of funding from United Kingdom Research and Innovation/Medical Research Council (UKRI/MRC) (MR/V027549/1). The funders had no role in design, data collection and analysis, decision to publish, or preparation of the manuscript.
Author contributions
PP, KK and MP conceived the idea for the surveillance. CG and PP collected the data. CAM and FZ analysed the data. CAM wrote the first draft of the manuscript with the help of MP, KK and PP. All other authors contributed to planning and management, data analysis and revision of the manuscript and were in agreement to submit it for publication.
Data sharing statement
The patient cohort was extracted under Caldicott Guardian approval for a specific purpose and as part of our undertaking with them, we are not to further routinely share these data. The data are held in an institutional repository and interested parties, with appropriate approvals, can apply for data access through the Corresponding author. Reasonable requests will be assessed on a case-by-case basis in discussion with the Caldicott Guardian.
Supplementary Material
Acknowledgements
CAM is a National Institute of Health Research (NIHR) Academic Clinical Fellow. KK is supported by the NIHR Applied Research Collaboration East Midlands (ARC EM). KK and MP are supported by NIHR Leicester Biomedical Research Centre (BRC). The views expressed are those of the authors and not necessarily those of the NIHR, NHS or the Department of Health and Social Care.
Christopher A. Martin, Academic Clinical Fellow in Infectious Diseases
Prashanth Patel, Consultant in Chemical Pathology and Metabolic medicine
Charles Goss, Consultant in Occupational Health
David R. Jenkins, Consultant in Microbiology
Arthur Price, Consultant in Immunology
Linda Barton, Consultant in Haematology
Pankaj Gupta, Consultant in Chemical Pathology and Metabolic Medicine
Francesco Zaccardi, Senior Clinical Research Fellow
Helen Jerina, Senior Clinical Scientist
Sai Duraisingham, Senior Clinical Scientist
Nigel J. Brunskill, Professor of Renal Medicine
Kamlesh Khunti Professor of Primary Care Diabetes and Vascular Medicine
Manish Pareek, Associate Clinical Professor in Infectious Diseases
Contributor Information
Christopher A Martin, Department of Respiratory Sciences, University of Leicester, Leicester LE1 7RH, UK; Department of Infection and HIV Medicine, University Hospitals of Leicester NHS Trust, Leicester LE1 5WW, UK.
Prashanth Patel, Department of Chemical Pathology and Metabolic Diseases, University Hospitals of Leicester NHS Trust, Leicester LE1 5WW, UK; Department of Cardiovascular Sciences, University of Leicester, Leicester LE1 7RH, UK.
Charles Goss, Department of Occupational Health, University Hospitals of Leicester NHS Trust, Leicester LE1 5WW, UK.
David R Jenkins, Department of Clinical Microbiology, University Hospitals of Leicester NHS Trust, Leicester LE1 5WW, UK.
Arthur Price, Department of Immunology, University Hospitals of Leicester NHS Trust, Leicester LE1 5WW, UK.
Linda Barton, Department of Haematology, University Hospitals of Leicester NHS Trust, Leicester LE1 5WW, UK.
Pankaj Gupta, Department of Chemical Pathology and Metabolic Diseases, University Hospitals of Leicester NHS Trust, Leicester LE1 5WW, UK; Department of Cardiovascular Sciences, University of Leicester, Leicester LE1 7RH, UK.
Francesco Zaccardi, Diabetes Research Centre, Leicester General Hospital, University of Leicester, Leicester LE5 4PW, UK; Leicester Real World Evidence Unit, Diabetes Research Centre, Leicester General Hospital, University of Leicester, Leicester LE5 4PW, UK.
Helen Jerina, Department of Chemical Pathology and Metabolic Diseases, University Hospitals of Leicester NHS Trust, Leicester LE1 5WW, UK.
Sai Duraisingham, Department of Immunology, University Hospitals of Leicester NHS Trust, Leicester LE1 5WW, UK.
Nigel J Brunskill, Department of Cardiovascular Sciences, University of Leicester, Leicester LE1 7RH, UK; Department of Nephrology, Leicester General Hospital, Leicester LE5 4PW, UK.
Kamlesh Khunti, Diabetes Research Centre, Leicester General Hospital, University of Leicester, Leicester LE5 4PW, UK; NIHR Leicester Biomedical Research Centre, Leicester LE3 9QP, UK; NIHR Applied Research Collaboration-East Midlands, Leicester LE5 4PW, UK.
Manish Pareek, Department of Respiratory Sciences, University of Leicester, Leicester LE1 7RH, UK; Department of Infection and HIV Medicine, University Hospitals of Leicester NHS Trust, Leicester LE1 5WW, UK; NIHR Leicester Biomedical Research Centre, Leicester LE3 9QP, UK; NIHR Applied Research Collaboration-East Midlands, Leicester LE5 4PW, UK.
References
- 1. World Health Organisation Novel coronavirus (2019-nCoV) situation report 1. https://www.who.int/docs/default-source/coronaviruse/situation-reports/20200121-sitrep-1-2019-ncov.pdf (21 June 2020, date last accessed).
- 2. Niedzwiedz CL, O’Donnell CA, Jani BD et al. Ethnic and socioeconomic differences in SARS-CoV-2 infection: prospective cohort study using UK biobank. BMC Med 2020;18(1):160. [DOI] [PMC free article] [PubMed] [Google Scholar]
- 3. Lusignan S, Dorward J, Correa A et al. Risk factors for SARS-CoV-2 among patients in the Oxford Royal College of general practitioners research and surveillance Centre primary care network: a cross-sectional study. Lancet Infect Dis 2020;20 (9):1034–42. [DOI] [PMC free article] [PubMed] [Google Scholar]
- 4. Pan D, Sze S, Minhas JS et al. The impact of ethnicity on clinical outcomes in COVID-19: a systematic review. EClinicalMedicine 2020;23:100404. [DOI] [PMC free article] [PubMed] [Google Scholar]
- 5. Martin CA, Jenkins DR, Minhas JS et al. Socio-demographic heterogeneity in the prevalence of COVID-19 during lockdown is associated with ethnicity and household size: results from an observational cohort study. EClinicalMedicine 2020;25:100466. [DOI] [PMC free article] [PubMed] [Google Scholar]
- 6. Office for National Statistics Coronavirus (COVID-19) Infection Survey pilot: England, 14 May 2020. https://www.ons.gov.uk/peoplepopulationandcommunity/healthandsocialcare/conditionsanddiseases/bulletins/coronaviruscovid19infectionsurveypilot/england14may2020 (23 June 2020, date last accessed).
- 7. Cook T, Kursumovic E, Lennane S. Exclusive: deaths of NHS staff from covid-19 analysed. Health Serv J 2020. https://www.hsj.co.uk/exclusive-deaths-of-nhs-staff-from-covid-19-analysed/7027471.article (28 October 2020, date last accessed). [Google Scholar]
- 8. NHS employers Risk assessments for staff. https://www.nhsemployers.org/covid19/health-safety-and-wellbeing/risk-assessments-for-staff (9 July 2020, date last accessed).
- 9. Steensels D, Oris E, Coninx L et al. Hospital-wide SARS-CoV-2 antibody screening in 3056 staff in a tertiary Center in Belgium. JAMA 2020;324(2):195–7. [DOI] [PMC free article] [PubMed] [Google Scholar]
- 10. Korth J, Wilde B, Dolff S et al. SARS-CoV-2-specific antibody detection in healthcare workers in Germany with direct contact to COVID-19 patients. J Clin Virol 2020;128:104437. [DOI] [PMC free article] [PubMed] [Google Scholar]
- 11. Schmidt SB, Grüter L, Boltzmann M, Rollnik JD. Prevalence of serum IgG antibodies against SARS-CoV-2 among clinic staff. PLoS One 2020;15(6):e0235417. [DOI] [PMC free article] [PubMed] [Google Scholar]
- 12. Houlihan CF, Vora N, Byrne T et al. Pandemic peak SARS-CoV-2 infection and seroconversion rates in London frontline health-care workers. The Lancet 2020;396:e6–e7. [DOI] [PMC free article] [PubMed] [Google Scholar]
- 13. Shields A, Faustini SE, Perez-Toledo M et al. SARS-CoV-2 seroprevalence and asymptomatic viral carriage in healthcare workers: a cross-sectional study. Thorax 2020. [DOI] [PMC free article] [PubMed] [Google Scholar]
- 14. Williamson EJ, Walker AJ, Bhaskaran K et al. OpenSAFELY: factors associated with COVID-19 death in 17 million patients. Nature 2020;584:430–6. [DOI] [PMC free article] [PubMed] [Google Scholar]
- 15. Ibarrondo FJ, Fulcher JA, Goodman-Meza D et al. Rapid decay of anti–SARS-CoV-2 antibodies in persons with mild Covid-19. N Engl J Med 2020;383:1085–7. [DOI] [PMC free article] [PubMed] [Google Scholar]
- 16. University Hospitals of Leicester NHS trust Equality and inclusion annual report. http://www.library.leicestershospitals.nhs.uk/EandD/Shared%20Documents/Equality%20and%20Diversity/Equality%20Annual%20Report%202018-19%20-%20final.pdf (13 July 2020, date last accessed).
- 17. Ministry of Housing, Communities and Local Government. English Indices of Deprivation 2019. https://www.gov.uk/government/statistics/english-indices-of-deprivation-2019 (21 June 2020, date last accessed).
- 18. Office for National Statistics Lower layer super output area population density (National Statistics). https://www.ons.gov.uk/peoplepopulationandcommunity/populationandmigration/populationestimates/datasets/lowersuperoutputareapopulationdensity (8 July 2020, date last accessed).
- 19. Public Health England. Weekly Coronavirus Disease 2019 (COVID-19) surveillance report. Summary of COVID - 19 surveillance systems. https://assets.publishing.service.gov.uk/government/uploads/system/uploads/attachment_data/file/897199/Weekly_COVID19_Surveillance_report_-_week_27.pdf (6 July 2020, date last accessed).
- 20. Ward H, Atchison CJ, Whitaker M et al. Antibody prevalence for SARS-CoV-2 in England following first peak of the pandemic: REACT2 study in 100,000 adults. medRxiv 2020. doi: 10.1101/2020.08.12.20173690 (28 October 2020, date last accessed). [DOI] [Google Scholar]
- 21. World Health Organisation Transmission of SARS-CoV-2: implications for infection prevention precautions. https://www.who.int/news-room/commentaries/detail/transmission-of-sars-cov-2-implications-for-infection-prevention-precautions (19 July 2020, date last accessed).
- 22. Pollán M, Pérez-Gómez B, Pastor-Barriuso R et al. Prevalence of SARS-CoV-2 in Spain (ENE-COVID): a nationwide, population-based seroepidemiological study. The Lancet 2020;396 (10250):535–544. [DOI] [PMC free article] [PubMed] [Google Scholar]
- 23. Stringhini S, Wisniak A, Piumatti G et al. Seroprevalence of anti-SARS-CoV-2 IgG antibodies in Geneva, Switzerland (SEROCoV-POP): a population-based study. The Lancet 2020;396 (10247):313–9. [DOI] [PMC free article] [PubMed] [Google Scholar]
- 24.Bobrovitz N, Arora RK, Rahim H, et al. Lessons from a rapid systematic review of early SARS-CoV-2 serosurveys. medRxiv doi: 10.1101/2020.05.10.20097451 (28 October 2020, date last accessed). [DOI]
- 25. Pareek M, Bangash MN, Pareek N et al. Ethnicity and COVID-19: an urgent public health research priority. The Lancet 2020;395 (10234):1421–2. [DOI] [PMC free article] [PubMed] [Google Scholar]
- 26. Office for National Statistics Coronavirus (COVID-19) related deaths by occupation, England and Wales: deaths registered up to and including 20 April 2020. https://www.ons.gov.uk/peoplepopulationandcommunity/healthandsocialcare/causesofdeath/bulletins/coronaviruscovid19relateddeathsbyoccupationenglandandwales/deathsregistereduptoandincluding20april2020 (21 June 2020, date last accessed).
- 27. Khunti K, Singh AK, Pareek M, Hanif W. Is ethnicity linked to incidence or outcomes of covid-19? BMJ 2020;369:m1548. [DOI] [PubMed] [Google Scholar]
- 28. Public Health England Disparities in the risk and outcomes of COVID-19. London: Public Health England, 2020. [Google Scholar]
- 29. Wadhera RK, Wadhera P, Gaba P et al. Variation in COVID-19 hospitalizations and deaths across New York City boroughs. JAMA 2020;323(21):2192–5. [DOI] [PMC free article] [PubMed] [Google Scholar]
- 30. Yancy CW. COVID-19 and African Americans. JAMA 2020;323 (19):1891–2. [DOI] [PubMed] [Google Scholar]
- 31. UK Government Employment by occupation. https://www.ethnicity-facts-figures.service.gov.uk/work-pay-and-benefits/employment/employment-by-occupation/latest?fbclid=IwAR2vzNhzkn7K8WR-7xDacJlhfS-FaPnQTw2fKnaVaT2al_Wgnjf8uVBeGTg#by-ethnicity-and-type-of-occupation (20 June 2020, date last accessed).
- 32. Muecksch F, Wise H, Batchelor B et al. Longitudinal analysis of clinical serology assay performance and neutralising antibody levels in COVID19 convalescents. medRxiv 2020. 10.1101/2020.08.05.20169128 (28 October 2020, date last accessed). [DOI] [Google Scholar]
Associated Data
This section collects any data citations, data availability statements, or supplementary materials included in this article.