

Abstract
Across sensory systems, temporal frequency information is progressively transformed along ascending central pathways. Despite considerable effort to elucidate the mechanistic basis of these transformations, they remain poorly understood. Here we used a novel constellation of approaches, including whole-cell recordings and focal pharmacological manipulation, in vivo, and new computational algorithms that identify conductances resulting from excitation, inhibition and active membrane properties, to elucidate the mechanisms underlying the selectivity of midbrain auditory neurons for long temporal intervals. Surprisingly, we found that stimulus-driven excitation can be increased and its selectivity decreased following attenuation of inhibition with gabazine or intracellular delivery of fluoride. We propose that this nonlinear interaction is due to shunting inhibition. The rate-dependence of this inhibition results in the illusion that excitation to a cell shows greater temporal selectivity than is actually the case. We also show that rate-dependent depression of excitation, an important component of long-interval selectivity, can be decreased after attenuating inhibition. These novel findings indicate that nonlinear shunting inhibition plays a key role in shaping the amplitude and interval selectivity of excitation. Our findings provide a major advance in understanding how the brain decodes intervals and may explain paradoxical temporal selectivity of excitation to midbrain neurons reported previously.
Keywords: Whole-cell recording, in vivo, temporal selectivity, shunting inhibition, midbrain, GABA
1. INTRODUCTION
A fundamental property of sensory systems involves transformations of representations such that individual neurons encode highly specific information i.e., show ‘sparse coding’ (Beyeler et al., 2019, Chacron et al., 2011, Olshausen and Field, 2004). A primary objective in neuroscience is to understand the computational mechanisms underlying this response selectivity (Paton and Buonomano, 2018, Rose, 2014). While some progress has been made, these mechanisms are often challenging to elucidate and, hence, poorly understood. A well-known example involves how interval information i.e., the timing of successive acoustic elements, is represented and processed in auditory systems. In the peripheral nervous system, interval information is represented in the timing of discharges of auditory-nerve fibers. This temporal pattern is then decoded in the brain by discrete classes of interval-selective neurons (Rose and Capranica, 1983, Rose, 2014). Here we focus on the mechanisms that underlie selectivity for long intervals (Alder and Rose, 2000, Edwards et al., 2008).
Long-interval selective neurons respond to single sound pulses and show band- or low-pass selectivity for sinusoidally amplitude-modulated stimuli, but fast pulse rates (PRs) elicit either no spikes or phasic-onset responses (Alder and Rose, 2000; Edwards et al., 2008). The mechanisms that underlie these temporal computations have proven to be extremely difficult to uncover (Rose, 2014; Paton and Buonomano, 2018). Extracellular recordings in anurans (Hall, 1994) and bats (Grothe, 1994) showed that selectivity of neurons for slow rates of AM (amplitude modulation) was substantially reduced following blocking inhibition. From this work, low-pass temporal filtering i.e., long-interval selectivity (Figure 1A), has been proposed to result from interplay between excitation and lagging (Atkins et al., 1988, Grothe, 1994) inhibition (Figure 1B); inhibition overlaps with and cancels excitation at fast PRs. Subsequent whole-cell ‘patch’ recordings from neurons in the anuran homolog of the inferior colliculus (ICan) provided evidence that inhibition could either lead or lag excitation (Figure 1B), with PSP amplitude showing rate-dependent depression (Edwards et al., 2008). The latter study, however, did not disambiguate the roles of inhibition vs. depression of excitation in the rate-dependent depression of PSP amplitude. Further, stimulus-driven excitatory and inhibitory conductances were not determined, and it is not clear whether excitatory input decreases for fast PRs (short intervals). Studies in electrosensory systems, however, suggest that selectivity for long intervals can result from integrating rate-dependent depression of excitation and inhibition that depresses less quickly (Baker and Carlson 2014). The mechanisms that underlie selectivity for long intervals in acoustic signals have not been determined (Paton and Buonomano, 2018; Rose, 2014).
Figure 1: Range and mechanistic models of long-interval selectivity.
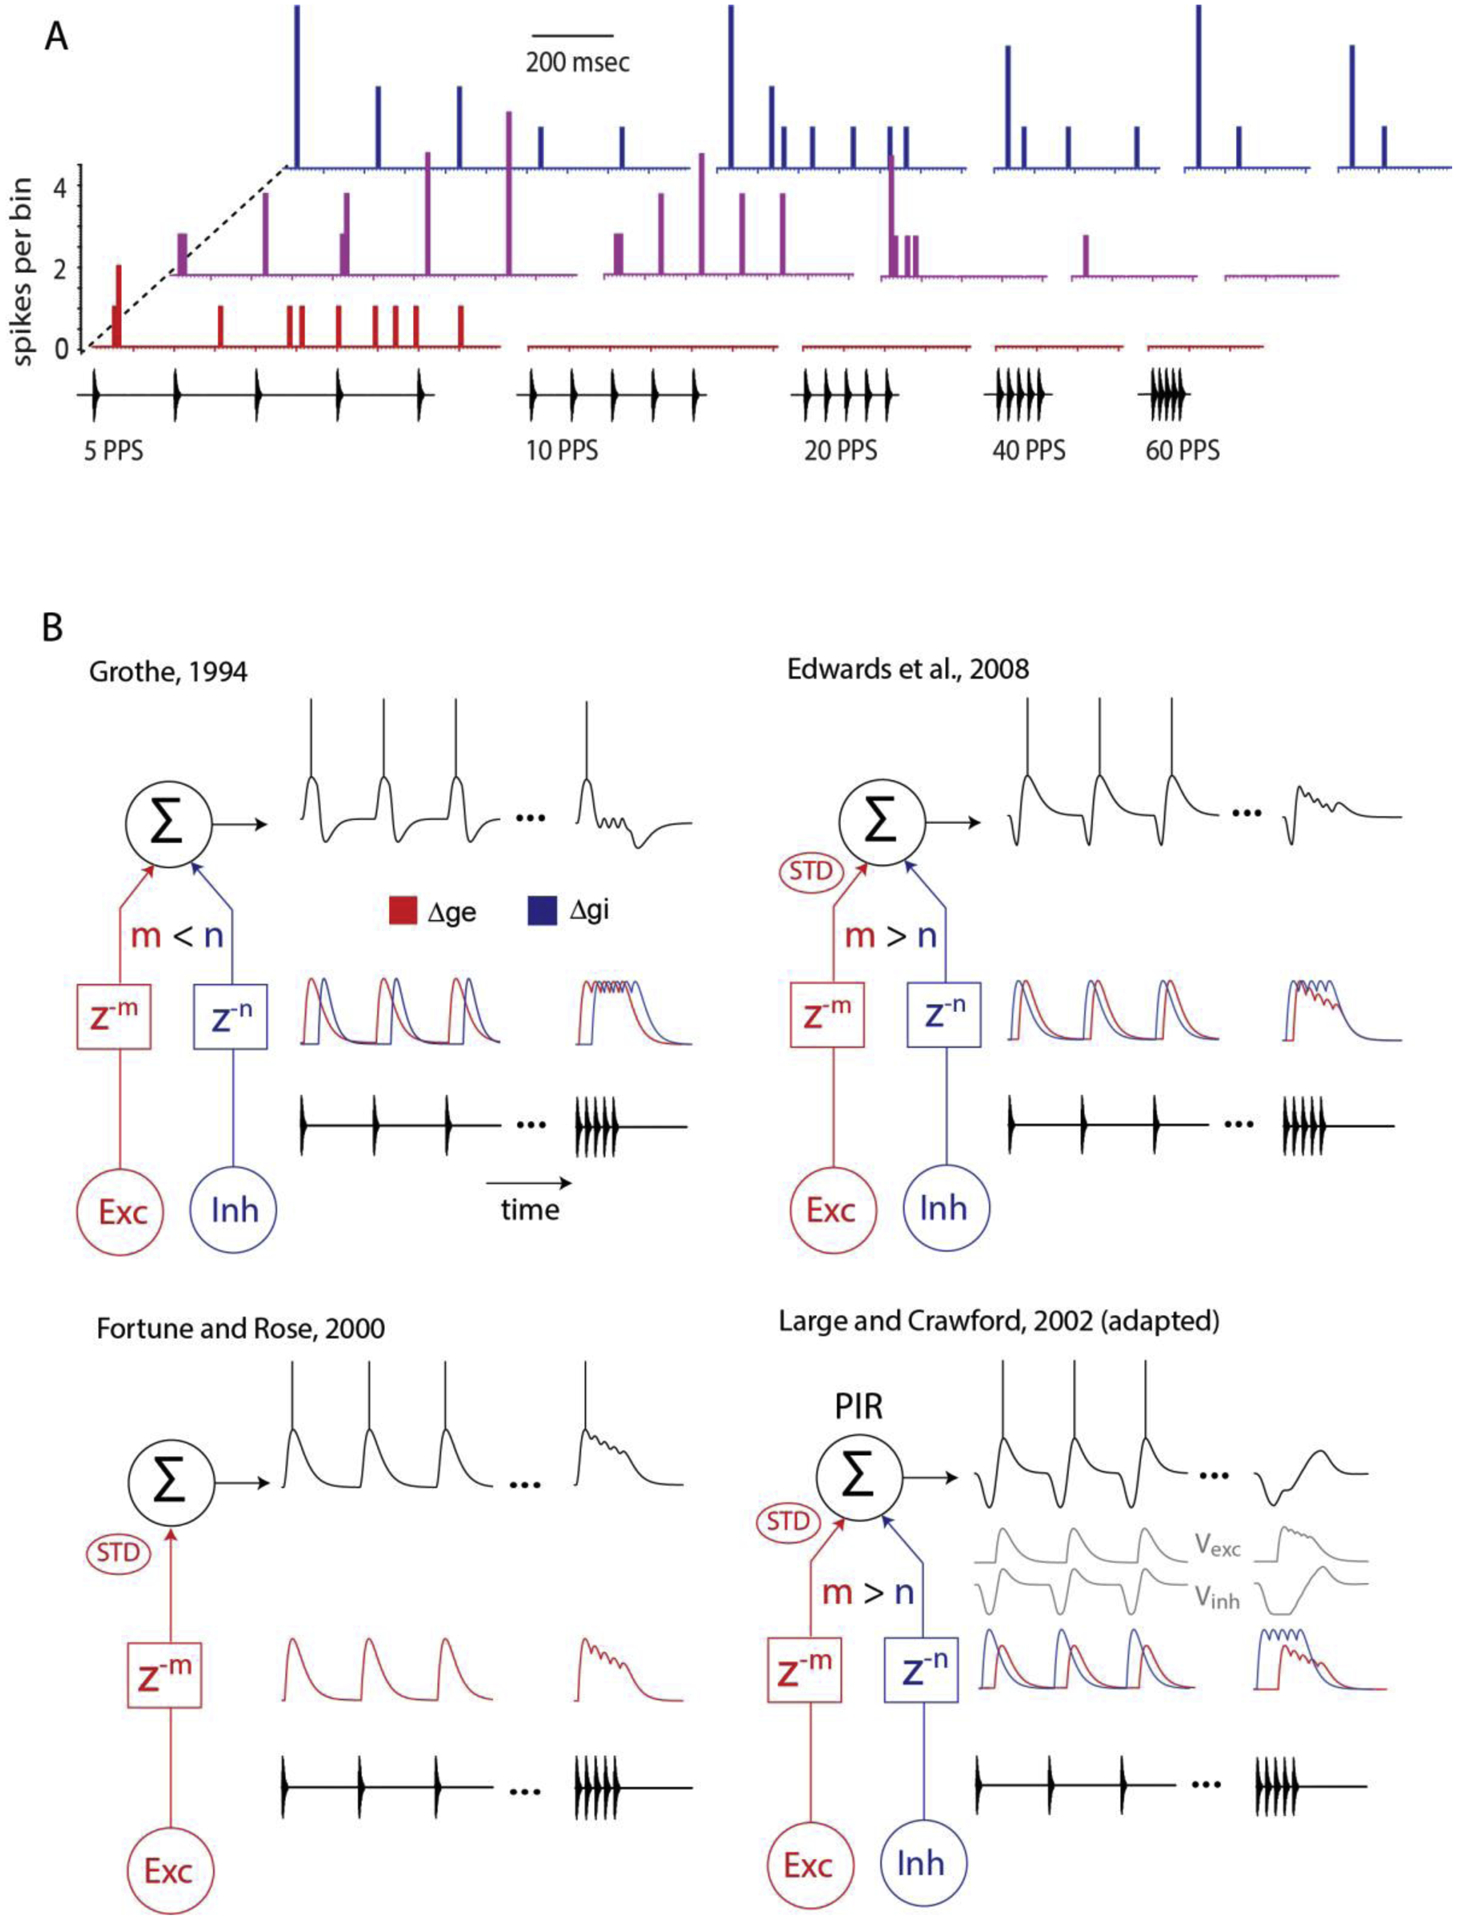
(A) Peristimulus time histograms (PSTHs) of spike occurrences (bin size of 10 ms) per stimulus repetition, recorded from 3 cells in the anuran (L. pipiens) inferior colliculus, that represent the observed range of selectivity to long intervals; stimulus pulse rates (pulses per second, pps) are displayed on the x axis. Top blue, weakly selective neuron with phasic-onset type response; middle (magenta) and bottom (red) histograms show PSTHs for moderately and strongly selective long-interval neurons. (B) Models illustrate how interplay between excitation (Exc, red) and inhibition (Inh, blue) alone (upper left), or with short-term depression (STD) of excitation could generate long-interval selectivity. Inhibition either lags (m < n; z−m is delay by m samples) or precedes (m > n) excitation. Additionally, postinhibitory rebound (PIR) depolarization as postulated by Large and Crawford (2002) could contribute to long-interval selectivity.
Here, we investigated the mechanisms of long-interval selectivity in the auditory system of anuran amphibians. Anurans are model study subjects because the calls of many species consist of pulses that are repeated at regular intervals (Supplemental Figure 1A) and this temporal information is critical for species identity and recognition of various call types that vary in PR (Gerhardt, 2001, Rose and Brenowitz, 1997, Rose and Brenowitz, 2002). Also, because of cutaneous respiration, anurans provide a highly stable in vivo neurophysiological recording preparation (Rose et al., 2021). Interval-selective neurons have been previously described in the ICan that reflect differences in the PRs of the territorial call and mating call of Lithobates pipiens (Supplemental Figure 1A). To investigate the mechanisms underlying long-interval selectivity, we 1) locally applied antagonists of glutamate and GABA receptors while making in vivo whole-cell recordings, 2) used potassium fluoride to attenuate inhibition at the recorded neuron, and 3) mathematically extracted the time courses of glutamatergic excitation and GABAergic inhibition from whole-cell current-clamp data. This represents the first time that this constellation of techniques has been used to reveal the mechanisms that underlie selectivity for temporal features in any sensory system. We also present a new extraction algorithm that brings together recent advances in computational neuroscience and neurophysiology. This new algorithm teases apart excitatory and inhibitory conductances even in the presence of non-linear changes in membrane potential.
Our results reveal an unexpected complexity of GABAergic inhibition in shaping long-interval selectivity. For example, in addition to the conventional role of imparting postsynaptic inhibition (IPSPs), in some cells GABAergic neurotransmission reduced the amplitude and temporal selectivity of excitatory inputs to midbrain neurons. We also show that depression of excitation for fast PRs results in some cases from nonlinear interactions between excitation and inhibition, and provide evidence that shunting-type inhibition (Gidon and Segev, 2012, Koch and Poggio, 1985) contributes to these properties. Because of the importance of interval properties in acoustic courtship signals, speech and music, and other sensory modalities as well, understanding the mechanisms that underlie interval selectivity is of considerable importance.
2. METHODS
2.1. Subject details.
Wild-caught male and female northern leopard frogs (Lithobates pipiens) were group-housed at the University of Utah in a 3’ × 2’ × 1’ plastic container with 1” of water at the bottom, situated in a room with a 12:12 hour light/dark cycle. Frogs were fed live crickets twice a week. All care adhered to protocols approved by The University of Utah Animal Welfare Committee, and follow NIH guidelines.
2.2. Surgical preparation.
Frogs were anesthetized by immersion in 3% urethane or 0.1% MS-222 and by topical application of 2% lidocaine hydrochloride to the skin of the dorsal surface of the head, where a small craniotomy was performed to expose the optic tectum (Supplemental Figure 1B). After an overnight recovery period, frogs were immobilized by intramuscular injection of pancuronium bromide (4 μg/g) for electrophysiological recordings. Whole-cell patch recordings were made from neurons in the ICan, in vivo, according to methods described previously (Edwards et al., 2007; Rose and Fortune, 1996). Recordings were made in an audiometric chamber that was maintained at 18–20°C. All procedures were conducted in compliance with the Society for Neuroscience’s Policy on the Use of Animals in Neuroscience Research and the National Institutes of Health guidelines and were approved by The University of Utah’s Institutional Animal Care and Use Committee.
2.3. Electrode construction.
Patch pipettes were constructed from high-borate borosilicate capillary glass (Schott #8250, A-M Systems #5960; 1 mm outer diameter (OD), 0.58 mm inner diameter (ID)) using a Flaming/Brown type puller (Sutter Instruments, model P-97). These pipettes had outside tip diameters of approximately 1.1–1.3 μm. Electrode tips were back-filled with a solution (pH = 7.4) consisting of (values in mM) 100 potassium gluconate, 2 KCl, 1 MgCl2, 5 EGTA, 10 HEPES, 20 KOH, and 20 biocytin. Biocytin was replaced by mannitol (20 mM) in the solution used to fill pipette shanks. These pipettes had resistances between 8 and 20 MΩ. To block chloride channels, K+ gluconate and KCl were replaced with KF. Extracellular recording pipettes were manufactured from the same glass used for making patch pipettes, but had tip diameters of 2–3 μm and were filled with 2M NaCl; resistances varied between 0.7 and 1.0 MΩ.
2.4. Whole-cell recording procedure.
‘Whole-cell’ recordings were made with patch-type pipettes, as described previously (Rose and Fortune, 1996). Briefly, recording pipettes were advanced into the brain using an ‘inch-worm’ microdrive (Burleigh Corp., model 6000 Controller) or a 3-axis microdrive (Scientifica PLC, model IVM-3000) while applying positive pressure to the pipette fluid. After reaching the location for whole-cell recording, the pipette was advanced in 1.5 μm increments while maintaining positive pressure and passing - 0.1 nA square-wave pulses (500 ms) to monitor resistance; cell contact was indicated by a small increase (10%) in the voltage change. Negative pressure was then applied to the pipette to increase the seal resistance to giga-ohm levels. Subsequent to seal formation, negative current (~ −0.5 nA) was applied to rupture the patch and attain a whole-cell recording. Seal resistances were typically greater than 1.5 GΩ. Reported resting potentials are uncorrected for liquid junction potential. Recordings were made in ‘currentclamp’ vs. voltage-clamp mode. Computer simulations (Johnston and Brown, 1983, Spruston et al., 1993) and direct experimental measurements (Williams and Mitchell, 2008) have demonstrated that it is not possible to accurately control the voltage in dendritic compartments using the somatic voltage-clamp method. Stimulus-driven changes in excitatory and inhibitory conductances could be estimated (described below) using recordings at several levels of constant, negative current injection (Priebe and Ferster, 2005). While both methods can estimate synaptic conductances only as they affect changes in the somatic membrane potential, the current-clamp method has several advantages: compensations for voltage drops across series resistances (electrode and patch) at the time of the recording are not required and injection of positive current, which is used in voltage-clamp experiments and activates voltage-dependent conductances, is avoided.
2.5. Pharmacological procedure.
Drugs were delivered by iontophoresis, using 3- to 5-barrel micropipettes (Fig 1b), which were manufactured from multibarrel, with microfilament, borosilicate capillary glass (Corning #7740, A-M Systems; 1.2 mm OD, 0.60 mm ID) using a vertical puller (Narishige, model PE-2). The tips of multibarrel pipettes were visualized under a stereo-dissecting microscope and broken to 10–15 μm diameter. Individual barrels were filled with L-glutamate (100 mM, pH=8.0), NaCl (150 mM) for current balance, gabazine (3 mM in 150 mM NaCl, pH=4.0) to block GABAA receptors, 5 mM NBQX (1,2,3,4-tetrahydro-6-nitro2,3-dioxo-benzo [f]quinoxaline-7-sulfonamide) (pH 9.0 in 150 mM NaCl), and 10 mM CPP ((+)-3-(2-carboxypiperazin-4-yl)-propyl-1-phosphonic acid) (pH=8.0 in 150 mM NaCl) to block AMPA/Kainate or NMDA-type glutamate receptors, respectively. Each barrel of the assembly was connected via a Ag/AgCl wire to a constant-current iontophoresis device (Dagan Corp., model 6400). Approximately 50–100 nA constant current was used to iontophoretically deliver pharmacological compounds (negative for glutamate, positive for other agents). We iontophoresed glutamate to activate recorded cells and to assess whether the multibarrel pipette was sufficiently close for conducting pharmacological manipulations (Rose et al., 2013). To minimize leakage of agents, retention currents of approximately 5 nA (opposite the polarity used to deliver the agents) were applied to barrels that contained drugs. Multibarrel pipettes were advanced into the brain using a single-axis hydraulic manipulator (Siskiyou Corporation, model MX610). For experiments involving intracellular fluoride, potassium gluconate in the intracellular solution (see 2.3) was replaced by potassium fluoride. Attenuation of inhibition from injection of KF was marked by an increase in spike rate or strength of depolarizations, these were clearly observed on an average of approximately 3 mins after KF was delivered using negative current (> −0.1nA) for a duration of 10 sec or longer. Baseline recordings were made at lower negative current injections as soon as cell access was achieved; recordings with KF-attenuated inhibition were, on an average, approximately 13 mins after achieving access to the cell. In several cases, 2 mM calixarene (4-sulphocalix[4]arene) was added to the standard intracellular solution in an attempt to block chloride channels; inhibition was attenuated with intracellular fluoride, but not calixarene.
2.6. Stimulus generation and delivery.
Acoustic stimuli were generated using an auditory stimulus generator (Tucker Davis Technologies, systems II & III) and custom software developed in Matlab environment (MathWorks, Inc.). Search stimulus carrier frequencies were systematically varied from 150 to 1600 Hz with modulation frequencies (in the case of sinusoidal amplitude modulation, SAM) ranging from 10 Hz to 100 Hz. To test for interval selectivity, pulse duration and number were held constant and only pulse rate was varied, usually from 5 – 80 pulses/s. Stimuli were presented free-field and contralateral to the recording site in an audiometric room (Alder and Rose, 2000).
2.7. Data acquisition and analyses.
Recordings were acquired and digitized at 10 kHz using a data acquisition interface (Cambridge Electronic Design, Model: Power 1401), then stored and analyzed using Spike2 software, also from the same supplier.
Spike threshold Et (Supplemental Figure 1C) was approximated across responses for repeated stimulus presentations. The subthreshold (V < Et) membrane potential changes consisted of two parts: 1) linear changes in synaptic currents and membrane potential (gray trace) and 2) non-linear changes due to voltage-dependent activation of synaptic and/or intrinsic currents (magenta trace). We define the boundary between linear and non-linear variations (near-threshold) as the activation potential (Eact). The subthreshold linear changes in V (≤ Eact) can be accurately modelled using equation (1); however, this is not the case for non-linear subthreshold variations (Priebe and Ferster, 2008).
| (1) |
where C is the cell capacitance, Ei and Ee are the reversal potentials of the inhibitory and excitatory conductances, V is the membrane potential, gleak =1/Rinput (represents the sum of conductances responsible for holding the cell at its resting potential, Er), and Iinj is the current injected into the cell through the patch pipette (electrode). The input resistance (Rinput) and time constant (τ) were estimated from brief negative current pulses delivered to the neuron; the voltage drop across the electrode and access resistances, which had a faster time course, was subtracted from the total voltage change produced by these current injection steps. In addition to measuring this voltage drop and subtracting it from the apparent membrane potential, we used a spike-threshold based method of determining V (Anderson et al., 2001). This approach is based on the assumption that spike threshold for a particular neuron should, on average, be constant across current clamp conditions. Thus, to determine the actual membrane potential following current injection, the spike threshold drop was subtracted from the apparent membrane potential change. The mean input resistance of neurons in this study was approximately 411 MΩ, SD = 192 MΩ. The capacitance of each neuron was calculated as: C = τ/Rinput. The inhibitory reversal potential for each cell was estimated to be the V at which IPSPs reversed from hyperpolarizations to depolarizations; in some cases, carrier frequencies that elicited primarily inhibition were used for determining these reversal potentials. The excitatory reversal potential was based on measurements where EPSPs were reversed from depolarizations to hyperpolarizations. While the relative magnitudes of changes in excitation (Δge) and inhibition (Δgi) changed slightly for different values of these reversal potentials, the time courses of these conductances were not affected. The computed Δge and Δgi values represent estimates of stimulus-related changes in conductances relative to pre-stimulus baseline levels; background (no stimulus present) excitatory and inhibitory conductances contributed to the ‘leak’ conductance, gleak. Recordings without current injection and at small levels of current clamp in some cases showed evidence of active membrane properties that amplified depolarizations. These active properties were evidenced as apparent decreases in Δgi below baseline (blue traces in linear estimation, (Supplementary Figure 1 C,D); this artefact was small in estimations using responses where non-linearity was minimal (Alluri et al., 2016). In some cases, negative Δgi values could be minimized or eliminated by excluding such recordings from the analyses. To further address this issue in cases where active membrane properties appeared to also contribute to responses at several current-clamp levels (Alluri et al., 2016), we also performed analyses in which a nonlinear term, based on the hybrid model suggested by (Izhikevich, 2010), was added to the above equation.
Our modifications (Eq. 2) and subsequent estimation algorithm allowed tuning of conductance constants to attenuate artefactual estimates vis-a-vis near-threshold active variations.
| (2) |
where α and β are conductance constants (S) that model subthreshold (V < Et) active components. Threshold potential Et, measured in volts, is obtained during whole-cell recording. The α and β currents together define the steady-state subthreshold relationship of the model’s IV relationship. Unlike Hodgkin-Huxley models that define physiological parameters for conductance, ion-channel gating and their relationship to action potentials, Izhikevich’s hybrid model defines the non-linear dynamics of sub- and suprathreshold responses of a neuron; this enables us to filter out non-linear parts of the I-V relationship. The alpha current, −α(V(t) − Et)(V(t) − Er), defines a non-linear I-V relationship whose maxima and zero-crossings could be adjusted by the beta current −β(V(t) − Er). These currents act in concert to define the activation of subthreshold active currents that show up as an inflection (V = Eact) in the depolarizing phase (Supplemental Figure 1C). Physiologically, this current from the alpha term, closely relates to the transition of voltage-gated channels from close to open, hence primarily contributes to the amplitude of inflection. In addition, beta corresponds most closely to the maximum conductance of voltage gated channels, its term providing an inward depolarizing current that increases with V. As seen in the Supplemental Figure 1C, the active currents, at times, are strong enough to drive the membrane to threshold and beyond; Eact, the minimum potential required for driving the V to Et and generating an action potential, was approximated to be the rheobase i.e., the maxima (slope=0 at V=Eact) of the subthreshold IV relationship.
The values of α and β determine the I-V characteristics of the model, a good fit of the model to the recordings can be achieved by accurately tuning the constants α and β. For this purpose, we made use of two subthreshold boundary conditions viz., V = Eact and V = Er. The subthreshold steady state (Eq. 3) can be achieved by injecting constant current (Iinj(t) = I) such that the membrane potential is constant (V(t) = V and V ≤ Eact); in the absence of stimulus, the changes in stimulus-driven excitatory and inhibitory conductances are zero.
| (3) |
At V = Eact, the slope of the subthreshold I-V relationship is zero:
| (4) |
Rearranging equation (4) gives us a relation between the conductance constants α. β and lumped leakage conductance (gl):
| (5) |
At the second boundary condition V = Er, the active current terms α(V − Et)(V − Er) and β(V − Er) are zero and the slope of the subthreshold I-V relationship is equal to g1.
| (6) |
Rearranging equation (6) gives us an additional relationship between α and β:
| (7) |
Solving equations (5) and (7) provides us with the tuning formulas for conductance constants and are shown in equations (8) and (9):
| (8) |
| (9) |
In computational terms, α and β act as filter coefficients to filter out subthreshold active currents; calculating g1 and identifying Eact are important for accurately estimating the conductance constants. Hyperpolarizing or depolarizing the cell by injecting current could alter the potential at which voltage-dependent conductances are activated; this could be due to the changes in the rate of climb of depolarization or activating/deactivating more voltage-dependent channels. Therefore, α and β were calculated for each current clamp used in conductance estimations. The contribution of active currents was maximal at more positive current clamps and minimal at more negative current clamp levels. When tuned accurately the conductance constants canceled each other as long as V(t) ≤ Eact and resulted in zero net current; however when V(t) > Eact they filtered out the contribution of non-linear components and thus attenuated the negative-going inhibitory estimate. In cases with higher order non-linearities, the conductance constants were further tuned manually.
We used a least-squares approach to estimate the changes in excitatory (Δge) and inhibitory (Δgi) conductances of a neuron in response to stimuli. This minimization process involved over-determining the system i.e., using recordings at multiple levels of negative current clamp (injected current) to obtain more equations than the number of unknown parameters (in this case, Δge and Δgi). We approximated Δge and Δgi at each sample point in time (0.1 ms) as the values that provided the best fit i.e., minimized the difference between measured and calculated changes in membrane potential, for the recordings across all current clamp levels.
To compare estimations of changes in excitatory and inhibitory conductance from equations (1) and (2), we computed estimates of excitatory and inhibitory conductances from current-clamp recordings made before and after attenuating excitation to two ICan neurons that responded well to single pulses (Supplemental figure 1D). The excitatory postsynaptic potentials of these cells were large and their membranes depolarized beyond their respective Eact, resulting in positive inflections that are indicative of active membrane properties. Conductance estimates made using the model described by equation (1) showed the expected negative inflections in Δgi (Supplemental figure 1D, E; ‘linear estimation’). Estimates of Δgi made using the ‘non-linear model’ (Eq. 2), however, did not show negative components (Supplemental figure 1D, E; Non-linear estimation); the time courses of Δge where highly similar for the two methods. To evaluate our estimates, we focally iontophoresed AMPA and NMDA receptor antagonists, CPP and NBQX, to attenuate excitation; this revealed the true time course of inhibition in both membrane hyperpolarizations and in conductance estimates. Note that negative Δgi estimates are either minimal (Supplemental figure 1D; CPP + NBQX) or not observed (Supplemental figure 1E; CPP + NBQX), and the time courses of Δgi correspond well to those calculated using the nonlinear (active estimation) model, equation (2).
To quantify Δge and Δgi, we computed the mean of their time courses for the duration of response, i.e. sum of values at every time sample divided by the total number of samples; subtracting the means of changes in excitation and inhibition results in net Δge and Δgi. Net Δge is the mean of positive values and net Δgi is the mean of negative values of the difference (Δge – Δgi) at each time point. Therefore, Net Δge represents the resultant excitation that is not counteracted by inhibition and net Δgi represents the resultant inhibition that is not counteracted by excitation. The drop in the means and net conductances across pulse rate were calculated as ((mean Δg slow PR – mean Δg fast PR)/mean Δg slow PR) × 100 and as ((net Δg slow PR – net Δg fast PR)/net Δg slow PR) × 100, respectively. Long-interval selectivity was quantified as: (Response slow PR – Response fast PR) / Response slow PR × 100, where Responses were the number of spikes per stimulus presentation or mean depolarization. For comparing excitatory and inhibitory conductance amplitudes across pulse rates, mean values of responses of cells to each stimulus condition were computed. To quantify the effects of active currents we computed the mean of the active current (Eq. 10) at small negative or zero current clamps.
| (10) |
The voltage-dependent conductances are most prominent at zero current clamp or recordings with small negative current injections (Alluri et al., 2016); this can also be seen in supplemental figure 1D,E (gray traces). In linear estimation (using Eq. 1), since voltage-dependent conductances are more prominent when V(t) is closer to the excitatory reversal potential (Ee) than to inhibitory reversal potential (Ei), these active conductances manifest as negative inflections in inhibitory conductance (Δgi) and not as larger Δge. Using more negative current clamps to reconstruct conductances resulted in substantial reduction in the negative phase of Δgi (Alluri et al., 2016).
3. RESULTS
Recordings were made from 48 long-interval neurons (LINs). The range of long-interval selectivity is shown in Figure 1A. Stimuli differed only in pulse rate (PR) i.e., pulse duration, shape and number were held constant; responses, therefore, reflected interval selectivity per se (Alder and Rose, 2000; Edwards et al., 2008). LINs at one end of this range, responded phasically to the onset of mid or fast pulse-rate stimuli (blue, upper PSTHs). Progressing towards the other end of the spectrum, LINs showed greater selectivity and 11/48 (23%) (extracellular and whole-cell recordings) responded either weakly or not at all to fast pulse rates (lower 2 rows of PSTHs, Figure 1A).
To investigate the integrative processes that underlie the range of long-interval selectivity shown in Figure 1A, we made current-clamp recordings (in vivo, whole-cell) from 37 long-interval neurons. We acquired sufficient current-clamp data to reconstruct (estimate) inhibitory (Δgi) and excitatory (Δge) conductances for 20 of these cases.
3.1. Long-interval selectivity is related to the relative pulse-rate dependence, timing and amplitude of excitation and inhibition.
Most LINs showed phasic-onset responses to fast PRs e.g., upper panels, Figure 1A). Whole-cell recordings and estimates of Δge and Δgi from an exemplar of this type (Figure 2A) show that excitation led inhibition at all PRs (range in advance of peak Δge, relative to that for Δgi = 8.3–8.6 ms), resulting in phasic responses to each pulse at slow PRs and phasic-onset responses for fast PRs (40–60 pulses/s or pps). The phasic-onset responses at fast PRs occurred because inhibition from successive pulses overlapped and counteracted the excitation, except at stimulus onset. These net excitatory conductances (mean of the resulting function, Δge – Δgi), decreased across PRs more strongly than the mean Δge (68.4 % vs. 36 % decrease, respectively). Thus, the selectivity of this cell type for slow PRs was greater than could be explained by the apparent selectivity of the excitation alone, and appeared to result from integrating excitatory inputs that showed some long-interval selectivity with longer-latency inhibition.
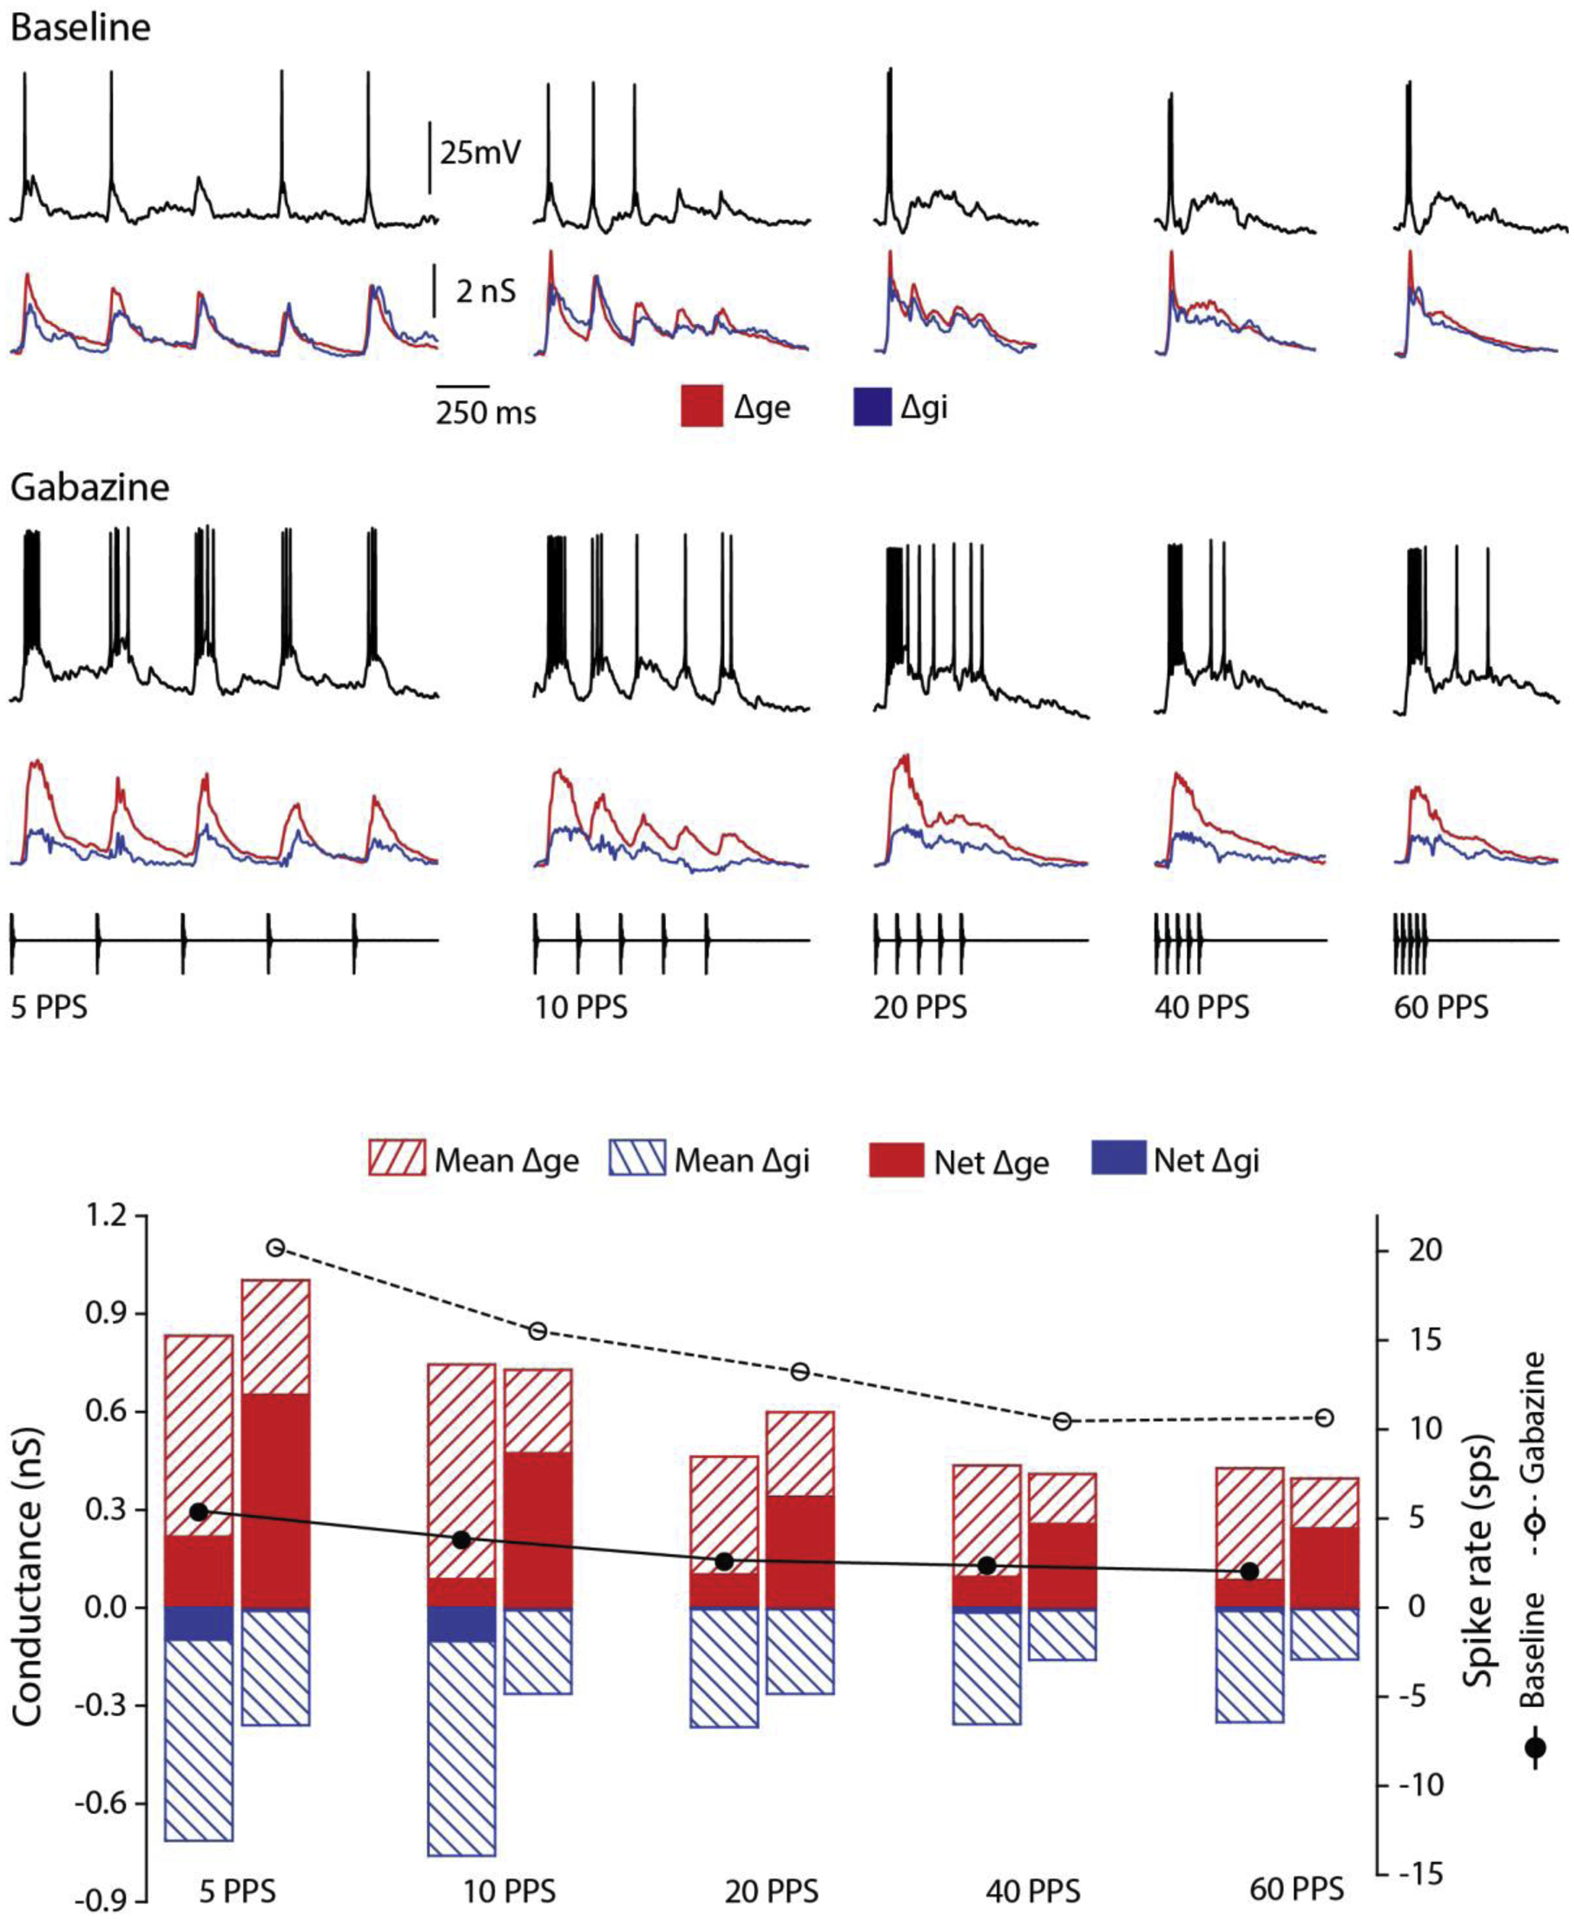
Figure 2. Inhibition that precedes excitation and is tonic generates strongest long-interval selectivity.
(A) Long-interval neuron showing phasic responses to stimulus onset at fast pulse rates (pulses/s, pps). Whole-cell membrane potential recordings of single (black traces) and averaged (gray traces) responses, at 0nA current injection, to stimulus pulse rates shown; spikes were removed for averaging. Changes in leading excitatory (Δge, red) and lagging inhibitory (Δgi, blue) conductances in response to sound stimuli are shown below voltage traces. Bar plots (right) show the mean Δge (red, striped) and Δgi (blue, striped), net Δge (Δge – Δgi, red) and Δgi (blue), and spike rate measured as spikes per stimulus (sps; black line with solid circle markers) at presented pulse rates. Resting potential = −45 mV; carrier frequency = 375 Hz. stimulus amplitude = 66 dB SPL. (B) Neuron strongly selective for long intervals. Stimulus-elicited inhibition precedes and completely overlaps excitation at fast rates (60 pps). Resting potential = −67 mV; carrier frequency = 600 Hz. stimulus amplitude = 42 dB SPL.
The cell shown in Figure 2B is representative of LINs (n = 6) for which inhibition led excitation and showed particularly strong selectivity for slow PRs; these neurons did not spike, or rarely spiked, to fast pulse rates. Individual pulses e.g., 5 pps stimulus, elicited short-latency hyperpolarizations, followed by longer-latency depolarizations that sometimes elicited spikes. Consistent with these changes in membrane potential, the latency to peak of Δgi was approximately ~ 27 ms shorter than that of Δge. This neuron did not spike to the 60 pps stimulus, with a mean excitation that was 26% of its value at 5 pps. For the 60 pps stimulus, Δgi preceded (~5.9 ms) Δge and was approximately 69% greater in amplitude. Because Δgi, and Δge, overlapped extensively at 60 pps, the net excitatory conductance decreased more strongly with pulse rate than did the mean (97.2 % vs 76.4 %) drop in net vs mean Δge, respectively, over this range in PR). The preponderance of inhibition and overlap with excitation at fast pulse rates appeared, therefore, to contribute to the strong long-interval selectivity of this class of LIN.
The greater decline in the net vs. mean Δge with PR suggested that inhibition contributed to long-interval selectivity. Across cells, the net Δge drop (slow vs fast PRs) significantly predicted LIN selectivity (Figure 3A), as measured by mean stimulus-elicited depolarization (filled circles, r2 = .65, F1,19 = 33.1, p<.0002) or spike rate (+ symbols, r2= .33, F1,19 =9.13, p<.01). In contrast, the drop in mean excitation with PR (Figure 3B) marginally predicted the observed variation in long-interval selectivity based on mean depolarization (r2=.19, F1,19 = 4.26, p=.0538), and failed to predict selectivity based on spike rate (r2= .004). This result does not imply, however, that the PR dependent decrease in mean Δge did not contribute to long-interval selectivity; many of the neurons that showed strong long-interval selectivity also showed pronounced decrease in mean Δge with PR. The finding that the drop in net Δge across PR was a better predictor of selectivity than that of mean Δge strongly suggests that inhibition is important in generating long-interval selectivity. We observed inhibition in all LINs but, as shown below, the net and mean excitation decreased more similarly with PR for neurons in which Δge and Δgi were more temporally congruent.
Figure 3. Decrease in net excitation across pulse rates best predicts long-interval selectivity.
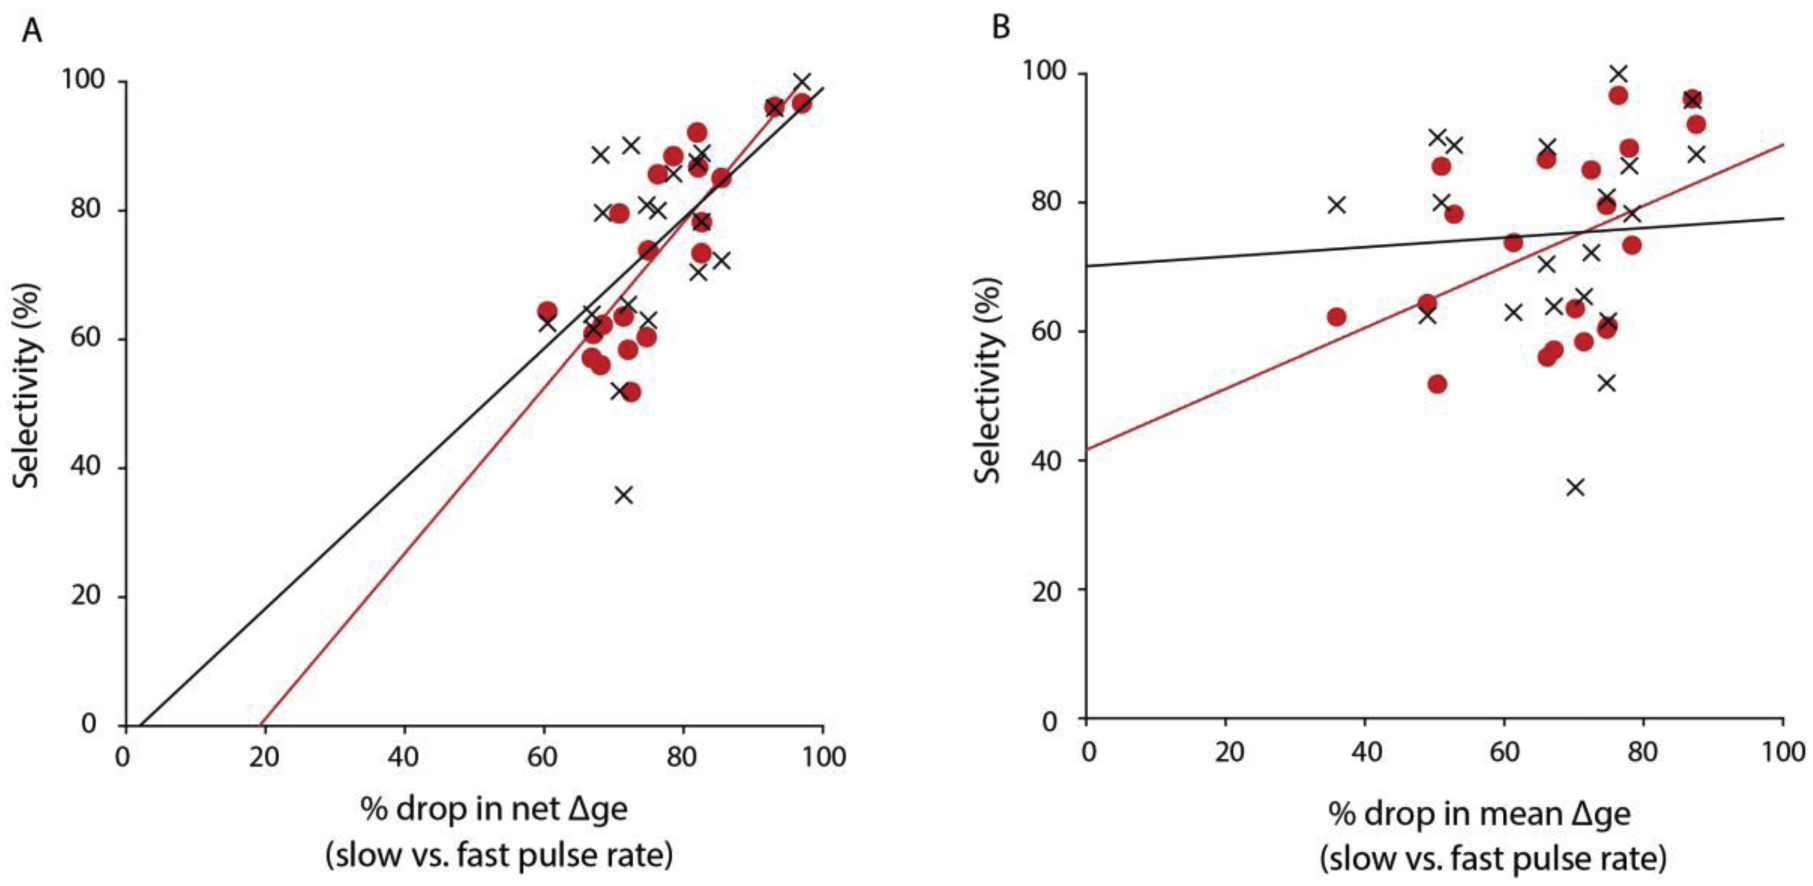
Drop in (A) net excitation (Δge – Δgi) or (B) mean Δge, from slow (5–10 pulses/s) to fast (40–60 pulses/s) pulse rates vs. long-interval selectivity (measured as drop in mean depolarization, red filled circles and regression line, or drop in spike rate, black crosses and regression line) for 20 neurons. The slope of the regression line (1.283) indicates a strong dependence between net excitation and long-interval selectivity. Results suggest a critical role for inhibition and its interaction with rate-dependent drop in excitation in generating selectivity for long intervals.
To address the role of sub-threshold active currents, we performed multiple regression analysis of the effects of Δge and mean active current (Iactive, Eq. 10) on mean depolarization response, this improved the explanation of variance by 7% (from r2 of 0.646 to 0.717). Mean Iactive marginally contributed (p=0.058) to long-interval selectivity (measured as the drop in mean depolarization across rates).
Rate-dependent depression of excitation appeared to contribute to the decrease in mean Δge with PR (e.g., figures 2A, 5A). Depression of postsynaptic excitation at fast PRs could be a property of afferents that are already long-interval selective and/or result from depression at the synapses onto the IC neurons. However, an intriguing alternative hypothesis is that inhibition might shape the excitation, either by shunting synaptic currents in the dendrites or acting presynaptically. To evaluate these possible mechanisms and directly determine the roles that inhibition plays in long-interval selectivity, we analyzed current-clamp recordings made before and after iontophoresing gabazine, a GABAA receptor antagonist, to attenuate inhibition.
Figure 5. Inhibition shapes strength and time course of excitatory inputs.
(A,B) Representative cases of neurons that exhibited decreased selectivity with attenuation of inhibition. Membrane potential recordings (black traces) and spike rate measures (spikes per stimulus presentation, sps) during baseline (filled circles, solid line) and after gabazine iontophoresis (A, 4 min; B, 3 min) (open circles, dotted line); depolarizations and spike rate increased at every pulse rate (PR). Phasic excitation (Δge, red) led inhibition (Δgi, blue) resulting in a phasic onset response at all PRs. (A) Attenuating inhibition increased the strength of excitatory conductance changes (Δge), and transformed the time course from phasic to tonic. Bar plots, corresponding to the markers, show the mean Δge (red, striped) and Δgi (blue, striped), the net Δge (red) and Δgi (blue) at PRs shown. Resting potential = −59 mV; carrier frequency = 1600 Hz. stimulus amplitude = 46 dB SPL. (B) Attenuating inhibition broadened selectivity of the neuron, as seen by spike rate differences at baseline vs. gabazine. In this case, however, the time course of Δge wasn’t altered despite an increase in strength. Resting potential = −62mV; carrier frequency = 340 Hz; stimulus amplitude = 54 dB SPL.
3.2. Attenuating inhibition increases response gain and, in some cells, broadens long-interval tuning and unmasks excitation.
Results presented above indicated that although inhibition was present in all LINs, its relative contribution to selectivity vs. response gain might vary across cells. To evaluate this hypothesis and determine whether inhibition shapes excitatory input to LINs, we focally iontophoresed gabazine to attenuate inhibition while making whole-cell recordings from 12 neurons. Stimulus-driven inhibition was attenuated in 7 of these cells, Following iontophoresis of gabazine, the 7 cells showed at least a 70% increase in stimulus-driven spike activity ; in other 5 cases, spike rate changed by < 5% (baseline vs. gabazine). Long-interval selectivity was decreased substantially in 4 cases following GABAA receptor blockade (Figure 4, circles); that is, points fell well below the 1:1 line, indicating that selectivity was decreased. In the other 3 cases, however, the primary effect was to increase gain i.e., proportionately increase response amplitude across PR.
Figure 4. Inhibition is critical for selectivity in most long-interval neurons.
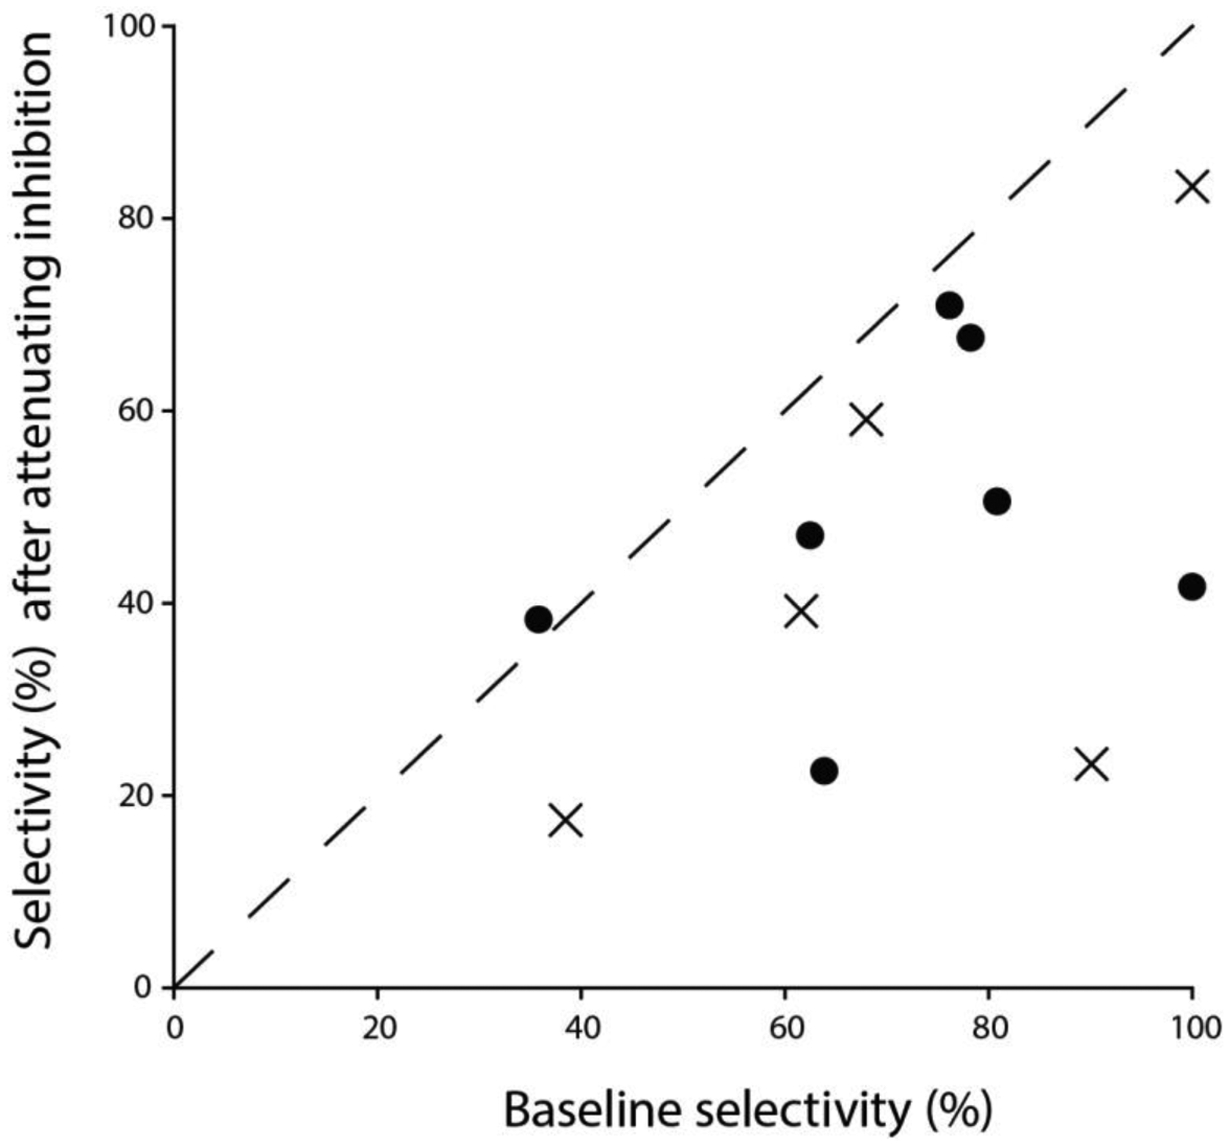
Relation between long-interval selectivity (% change in spike rate for slow vs. fast pulse rates, PRs) before (baseline, x-axis) and after attenuating inhibition (y-axis); maximum selectivity = 100%. Inhibition was attenuated in two ways: 1) focal iontophoresis of gabazine (circles) or 2) intracellular loading of the cell with fluoride (crosses); pipette solution contained potassium fluoride. The dotted line represents no change in selectivity.
For the cell shown in Figure 5A, gabazine decreased long-interval selectivity (selectivity index (SI) = 80.8% (baseline) vs 50% (gabazine)) and increased response gain (e.g., ~660% of baseline, at 5 pps). Surprisingly, mean excitation was increased by 943% at 60 pps, due to increases in both amplitude and duration of Δge after gabazine-mediated attenuation of inhibition. Further, the mean Δge increased most for fast PRs, resulting in a decrease in long-interval selectivity; for 5 vs. 60 pps, the drop in mean Δge was 74.7% before and 46.3% after gabazine. Thus, inhibition in this case appeared to increase the amplitude and shape the PR selectivity of the excitation. Similarly, for the cell shown in Figure 5B, gabazine decreased long-interval selectivity (73% (baseline) vs. 34.5% (gabazine)), and increased mean Δge by 175%, at 60 pps. The decline in mean Δge with PR (10 vs 60 pps) was substantially less after gabazine (67.2% baseline vs. 34.2% gabazine), indicating that inhibition strongly enhanced the long-interval selectivity of excitation to the cell. However, in contrast to the former case, the mean Δge was similar in duration before and after gabazine. Thus, although gabazine differentially increased the amplitude and duration of Δge for these two neurons, long-interval selectivity was comparably decreased; apparently inhibition similarly counteracted and shaped excitation to these neurons, thereby contributing to their long-interval selectivity. Greatest decreases in selectivity following gabazine (Figure 4) were observed in cases where inhibition decreased the selectivity of excitation.
The cell shown in Figure 6 represents the other end of the spectrum of gabazine effects. In contrast to the previous cases, gabazine caused little or no increase in Δge for PRs of 10 to 60 pps. After gabazine iontophoresis, mean Δgi was decreased and net Δge was increased (e.g., 202% at 5pps, and 189% at 60 pps) across pulse rates, indicating an attenuation of inhibition that appreciably overlapped temporally with the excitation; this amplified responses. Following gabazine, the decline in mean Δge with PR (5 vs 60 pps) increased slightly (50%, baseline vs. 60.2%, gabazine). However, this increase in selectivity of the mean excitation after gabazine was atypical and was due to mean Δge being slightly greater for the 5 pps stimulus; no gabazine effect on selectivity was observed when comparing the drop in mean excitation for 10 vs. 60 pps. In further support of the conclusion that inhibition did not contribute appreciably to the long-interval selectivity of this neuron, following gabazine there was little change in the drop in net Δge (5 vs 60 pps) (60% baseline vs. 62% gabazine), or the selectivity of the cell, as measured by mean depolarization (64.3% vs. 63.4%). Attenuating inhibition strongly amplified responses across the range of pulse rates tested (Figure 6, black traces, Gabazine), and the long-interval selectivity of the cell, based on spike rate, decreased slightly (62.5% vs. 47%). This decrease in selectivity appeared to be due to the neuron showing suprathreshold and less phasic responses for fast PRs. The long-interval selectivity of this neuron appeared, therefore, to stem from the phasic nature of Δge for fast PRs and inhibition counteracting excitation such that stimulus-elicited depolarizations were only slightly suprathreshold for eliciting spikes.
Figure 6. Inhibition can decrease response gain without affecting interval selectivity.
Representative case for neurons that showed little or no change in selectivity with attenuation of inhibition (Δgi, blue) despite increased response levels (black traces) across stimulus pulse rates, indicating the role of inhibition in regulating response gain. Iontophoresis of gabazine for 5 min had relatively little effect on the amplitude or time course of excitation (Δge, red). Spike responses, measured as spikes per stimulus presentation (sps) are shown for baseline (solid circles and line) and gabazine (open circles, dotted line) conditions. Bar plots, corresponding to the markers, show the mean Δge (red, striped) and Δgi (blue, striped), the net Δge (red) and Δgi (blue) at presented pulse rates. Resting potential = −69 mV; carrier frequency = 425 Hz. stimulus amplitude = 63 dB SPL.
Together, these results support the hypothesis that inhibition can nonlinearly shape the excitatory input to cells, possibly by acting presynaptically or by shunting excitatory dendritic current.
3.3. Attenuating inhibition with intracellular delivery of fluoride can increase the amplitude and decrease the long-interval selectivity of excitatory inputs.
The observed effects of gabazine on Δge, support the hypothesis that inhibition can shape the excitatory input to LINs, possibly through shunting-type dendritic processes. However, PR-dependent increases in Δge might also occur if gabazine blocked inhibition onto presynaptic terminals or to putative local interneurons that might provide excitation to the recorded cell. To directly validate our gabazine experiments on the question, whether attenuating inhibition to a single neuron alters stimulus-driven excitatory conductances (as calculated from current-clamp recordings), we substituted K-fluoride for K-gluconate in the recording pipette to block chloride channels. In these experiments, 9 of the 26 whole-cell recordings made were from neurons that showed either low-pass or band-pass selectivity for slow pulse rates. We were able to estimate Δge and Δgi before and after fluoride-mediated attenuation of inhibition in 5 of these cells. For these cases, the mean Δge in response to the 60 pps stimulus increased, on average, by approximately 140%. For the example shown in Figure 7A, the calculated mean Δge was greater across PRs after KF attenuated inhibition. As seen in several of the gabazine cases, KF increased the excitation amplitude without appreciably altering the PR selectivity of the excitation (Figure 7A bar plot: 74.92% (baseline) and 69% (KF) drop in mean Δge); long-interval selectivity based on spike rate decreased moderately (0.6 vs. 0.4) following KF. For the cell shown in figure 8B, however, the decrease in the mean Δge for 5 vs. 60 pps was 50.42% during the baseline period, compared to only 21.26% after inhibition was attenuated; selectivity calculated from spike rate measures decreased strongly (0.9 vs. 0.3). Thus, blocking inhibition to the recorded cell, intracellularly, resulted in increased amplitude and decreased PR selectivity of the calculated excitation; the apparent selectivity of the mean excitation was largely due to the action of inhibition. In 6 additional recordings, we added 2 mM calixarene to the standard intracellular pipette solution; but, in all of these cases, calixarene failed to attenuate inhibition. Combining results from gabazine iontophoresis and intracellular fluoride, attenuating inhibition significantly decreased long-interval selectivity (Wilcoxon Signed-Rank Test, z = −2.98, p < .001, n=12).
Figure 7. Evidence for shunting inhibition: Fluoride-mediated attenuation of inhibition to recorded cells increases the amplitude and can decrease the long-interval selectivity of excitation.
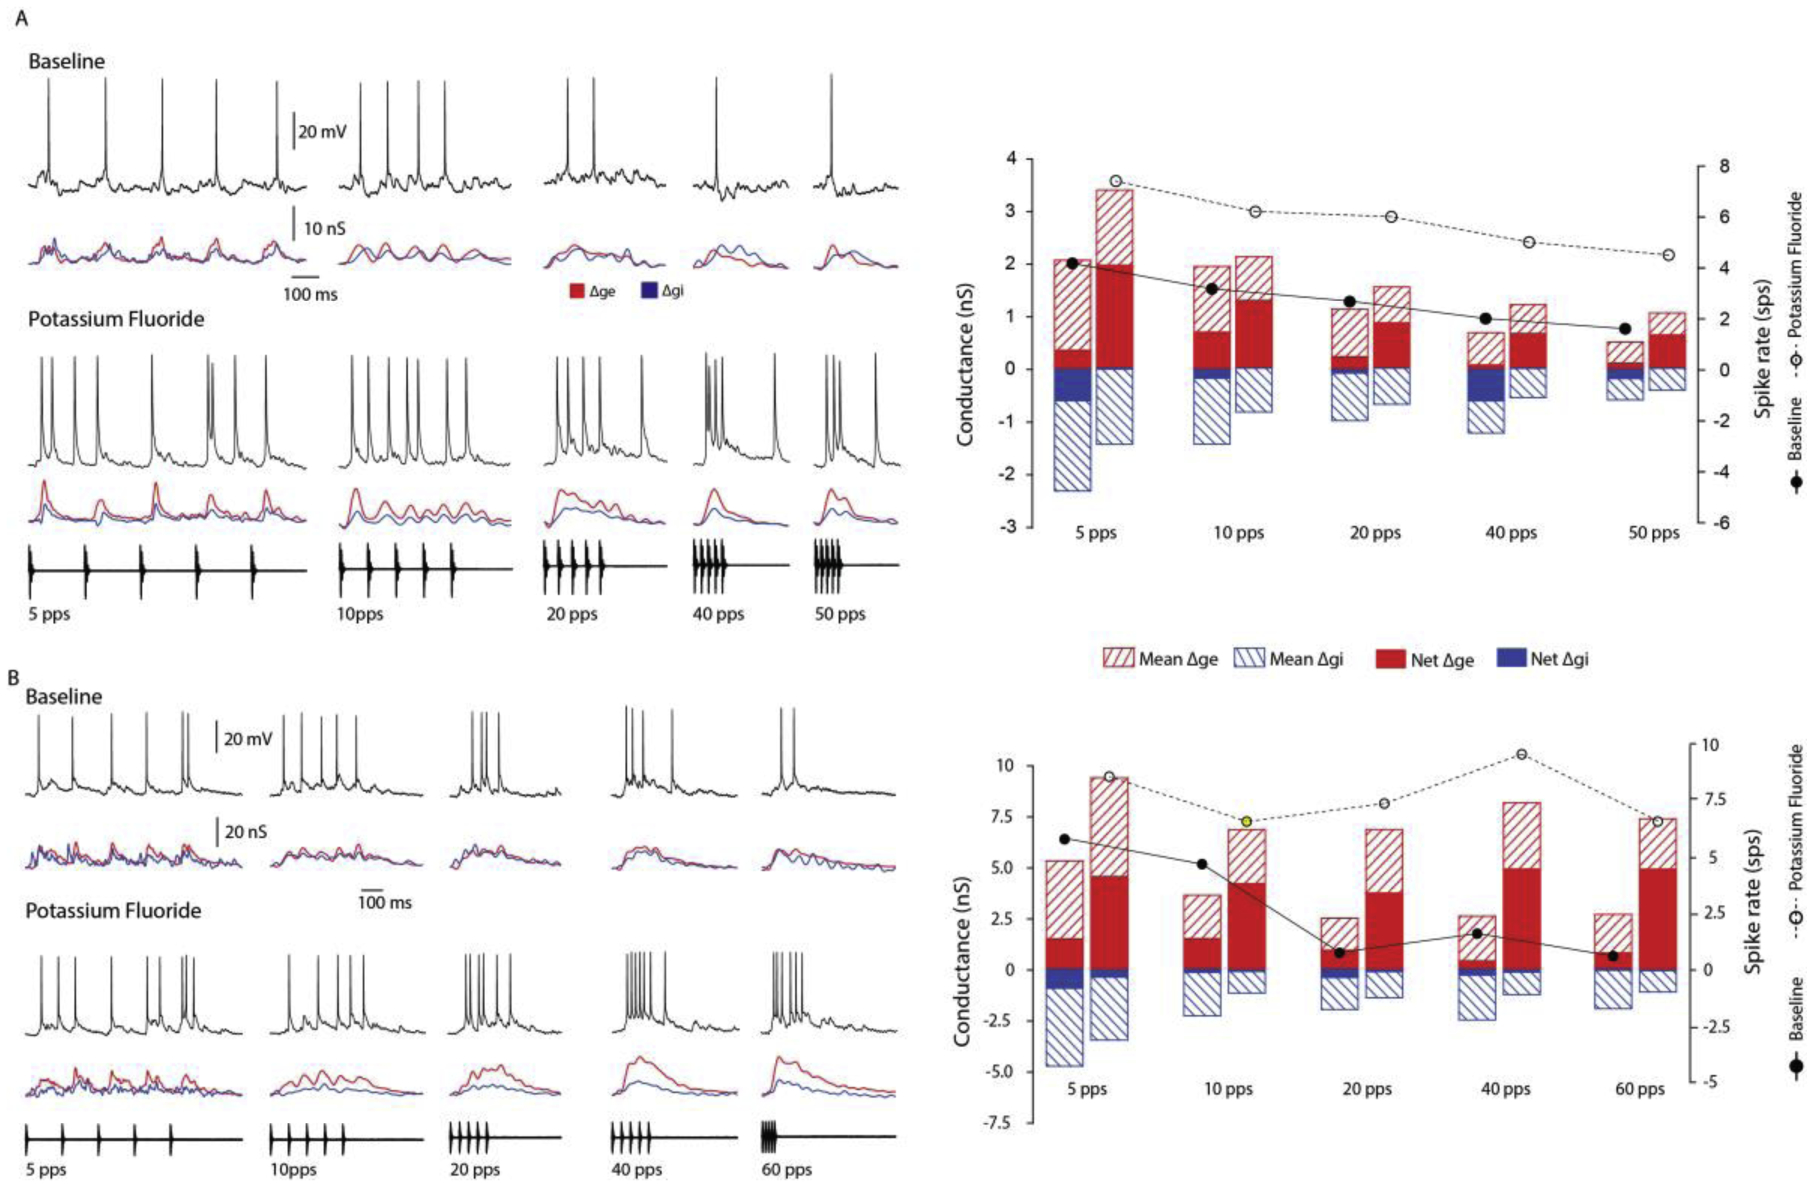
(A,B) Membrane potential responses (black traces) and estimates of changes in excitatory (Δge, red traces) and inhibitory (Δgi, blue traces) conductances of two neurons to 12 ms sound pulses presented at the rates shown, before and after (A, 2 min; B, 5 min) loading with fluoride to attenuate inhibition. Excitation preceded (A) or lagged (B) inhibition. Bar plots (right) present mean and net Δge and Δgi before (bars below filled symbols) and after (bars below open symbols) fluoride-mediated attenuation of inhibition. Fluoride moderately (A) or strongly (B) decreased long-interval selectivity, as measured from spike responses (spikes/stimulus presentation, SPS). Fluoride also increased the amplitude and decreased the long-interval selectivity of the mean Δge, suggesting a shunting-type role for inhibition in long-interval selectivity. (A,B) Resting potentials = −51, −45 mV; carrier frequency = 180, 675 Hz. stimulus amplitude = 67, 43 dB SPL.
Figure 8. Postinhibitory rebound depolarization does not contribute to long-interval selectivity.
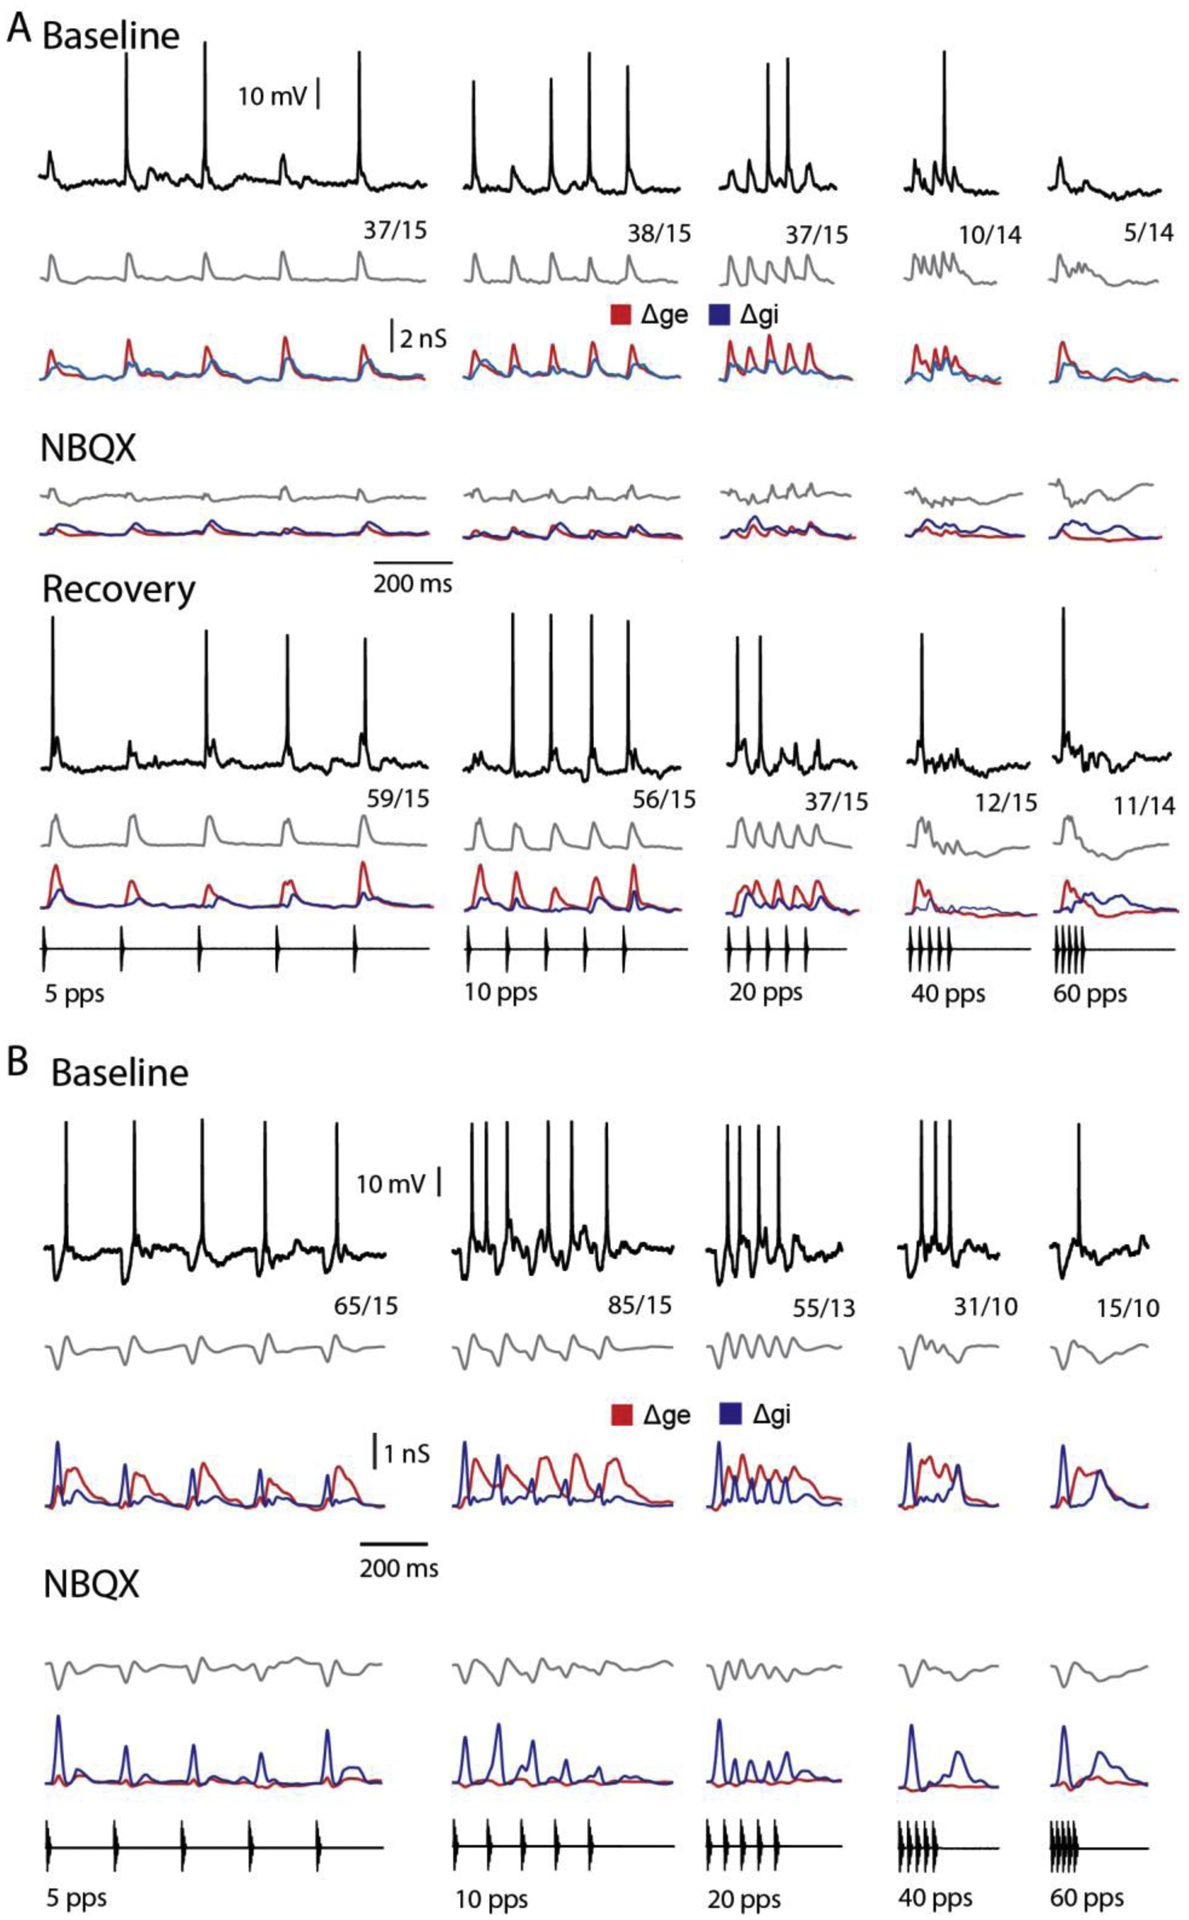
(A, B) Responses (representative, black traces; averaged, grey traces) of two long-interval neurons, to presented stimuli are shown; the spikes per stimulus repetition are presented adjacent to the traces. Estimates of excitation (Δge, red trace) preceded (A) or lagged (B) that of inhibition (Δgi, blue trace). Iontophoresis of NBQX (A, 6.5 min; B 7.2 min) attenuated excitatory input to the cells; a phasic depolarization at the end of the inhibitory time course, a characteristic of postinhibitory rebound was not observed. Following recovery (A, 20 minutes after stopping iontophoresis), the strength of excitation was restored. (A, B) Resting potential = −72, −59 mV; carrier frequency = 1500, 250 Hz; stimulus amplitude = 71, 57 dB SPL.
3.4. Postinhibitory rebound appears to not contribute to long-interval selectivity.
In most cases, inhibition coincided with or trailed excitation. Postinhibitory rebound depolarization was, therefore, unlikely to augment responses of these cells to slow PRs, and contribute to long-interval selectivity. In addition, the small, delayed IPSPs did not elicited rebound depolarizations e.g., Figures 2A, 5A&B. For cells in which inhibition preceded excitation and elicited IPSPs, however, postinhibitory rebound could augment depolarization. To determine whether postinhibitory rebound depolarization might contribute to long-interval selectivity, in two cases we iontophoresed the AMPA-receptor antagonist, NBQX, to attenuate excitation. In one cell (Figure 8A), inhibition (Δgi) appeared to be relatively weak and lagged excitation (Δge). Even after excitation was attenuated, stimulus pulses elicited only small hyperpolarizations; temporal summation of inhibition at fast pulse rates (40 and 60 pps) did, however, result in delayed hyperpolarizations that were particularly clear in both NBQX and recovery conditions. Postinhibitory rebound depolarization was not evident and, therefore, appeared to play little, if any, role in augmenting responses to pulses presented at slow rates. The second cell (Figure 8B), showed strong inhibition that preceded excitation and, unexpectedly, showed depression at PRs of 5 and 10 pps. Even in this case, however, little or no postinhibitory rebound depolarization was observed. Although there was considerable temporal overlap in Δgi and Δge in both cells, these small temporal disparities between excitation and inhibition appeared to permit suprathreshold depolarizations in response to pulses presented at slow rates (5–10 pps). For pulse rates greater than approximately 20 pps, however, inhibition from successive pulses fused temporally; for 40 and 60 pps stimuli, Δgi showed a bimodal time course, which was also evident in the membrane potential traces.
In both cases we also recorded responses, at several levels of negative current clamp, after iontophoresing NBQX (5mM), to attenuate excitation (middle and lower panels, Figure 8A&B, respectively). In both cells, the time courses of stimulus-elicited Δgi were highly similar to those derived from recordings before excitation was attenuated; this suggests that inhibition to these cells is not from a local interneuron. For the first neuron, nearly full recovery of excitation was observed approximately 20 minutes following termination of iontophoresis. Interestingly, these cells showed comparable long-interval selectivity (0.83 (a) and 0.78 (b)). This result was surprising because, in the second case, inhibition led excitation and was proportionately greater than in the former cell; as presented earlier (Figure 1B), short-latency inhibition could, at fast pulse rates, effectively counteract longer-latency excitation. For this second cell (Figure 8B), however, Δgi depressed quickly at fast PRs, permitting the longer-latency excitation to depolarize the cell to threshold; the ‘late’ inhibition then reversed this depolarization, resulting in a phasic response. The first cell also responded phasically for fast PRs, apparently because Δgi was more sustained and Δge depressed quickly. In both cases, decreases in excitatory conductances with pulse rate appeared to contribute to long-interval selectivity.
4. DISCUSSION
Our results provide the first whole-cell recordings from long-interval selective auditory neurons in the IC of vertebrates, made while focally blocking GABAA or glutamate receptors, in vivo. We also show the first estimates of stimulus-driven excitatory and inhibitory conductances for interval-selective auditory neurons. Incorporating nonlinear terms in the differential equations that describe how a cell’s membrane potential changes over time permitted, for the first time, estimates of excitatory and inhibitory conductances for cases in which active membrane properties contributed to subthreshold responses, as well as estimates of the latter. Comparison of Δgi estimates before and after pharmacologically attenuating excitation indicate that this method effectively minimizes artifactual conductance changes e.g., negative-going inflections of Δgi, that result from the activity of voltage-dependent conductances. Results of these experiments provide unparalleled understanding of the mechanisms that underlie long-interval selectivity.
4.1. The multifaceted role of inhibition and relations to existing models.
Integration of excitation, inhibition and their pulse-rate dependencies appear to be important in creating long-interval selectivity, as predicted by current models (Figure 1B); these incorporate inhibition that is either delayed (Grothe, 1994) or advanced (Edwards et al., 2008) relative to the excitation. However, existing models assume a mostly linear integration of excitation and inhibition, which cannot account for the response profiles of most of the sampled neurons. We found evidence of strongly nonlinear interactions between excitation and inhibition. This result was surprising, especially considering that predominantly linear integration of excitation and inhibition underlies short-pass duration selectivity in IC neurons of anurans (Alluri et al. 2016).
From synaptic conductance analyses alone, it appeared that excitatory inputs to LINs already show appreciable long-interval selectivity, and that interplay between rate-dependent excitation and inhibition enhances selectivity in some cases and regulates response amplitude in others. However, our results indicate that inhibition plays a greater and more complex role in the long-interval selectivity of most cells than previously expected. Measures of the drop in net excitation with PR accounted for approximately 65% of the variation in long-interval selectivity; this measure reflects the contributions of both inhibition and rate-dependent decrease in excitation to selectivity. In contrast, the drop in excitation alone was only marginally effective in predicting long-interval selectivity. These results indicated that inhibition plays a dominant role in this low-pass temporal filtering process. To directly assess the contribution of local inhibition to long-interval selectivity, we focally iontophoresed gabazine to block GABAA receptors and, in separate experiments, used fluoride intracellularly to block chloride channels. Each method of attenuating GABAA-type inhibition has its strengths and weaknesses. Gabazine is a highly selective antagonist of GABAA receptors, and strongly attenuated inhibition to long-interval neurons. However, with this method, attenuation of inhibition to local neurons is also expected. Using fluoride to block chloride channels intracellularly has the advantage that inhibition is attenuated at only the recorded neuron, however baseline recording information must be acquired quickly, before fluoride has appreciable effects on the neuron. Although most studies have found potassium fluoride to selectively attenuate inhibition (Khazipov et al., 1997, Smirnov et al., 1999), there is one report of it also attenuating excitation (Atherton et al., 2016). In our system, fluoride effectively blocked inhibition without attenuating excitatory inputs. We showed that, in most cases, long-interval selectivity was decreased after attenuating inhibition with these methods. Long-interval selectivity decreased most for neurons that showed more sustained excitatory conductances at fast PRs, and in which inhibition preceded excitation. In these cells inhibition from successive pulses overlapped at fast pulse rates and counteracted concurrent excitation. Unexpectedly, however, attenuating inhibition using either method increased excitation to LINs, particularly for fast PRs. Thus local inhibition can attenuate, in a rate-dependent fashion, excitation and thereby contribute to long-interval selectivity. In this nonlinear interaction, inhibition augments the long-interval selectivity of the excitation that was previously suggested to result primarily from rate-dependent depression (Edwards et al. 2008).
These nonlinear interactions might result from excitatory current being shunted by concurrently active inhibitory synapses in the dendrites, such that little current is conducted to and depolarizes the soma (Gidon and Segev, 2012). Distal ‘off-path’ inhibition has been shown to be particularly effective for shunting excitatory current away from the source-to-soma path (Gidon and Segev, 2012). Our finding that blocking chloride channels with intracellular delivery of fluoride increased excitation amplitude and decreased PR selectivity supports this ‘shunting hypothesis’ i.e., attenuating inhibition to just the recorded cell can alter the excitation that reaches the soma. We cannot, however, completely rule out an additional presynaptic action of inhibition on the terminals of excitatory synapses and/or on local cells that putatively provide excitatory input to the recorded neuron. Future studies in which gabazine is iontophoresed after blocking chloride channels with intracellular fluoride could test whether additional presynaptic/local inhibition contributes to shaping excitatory input to long-interval cells.
4.2. Relations to other studies.
Our findings raise the question of whether shunting-type inhibition can shape the excitation to central cells in other systems. We suggest that similar effects of inhibitory inputs on estimates of Δge in response to stimuli may underlie instances of apparent ‘paradoxical selectivity of afferent excitation’. For example, analyses of in-vivo current-clamp recordings from FM-selective neurons in the IC of bats, indicate that excitation amplitude depends on FM direction, despite substantial evidence that afferents to the IC do not show selectivity for FM direction (Gittelman and Li, 2011, Gittelman et al., 2009). These paradoxical findings might be resolved if, like for LIN cells in the anuran IC, measurements of Δge are reduced when inhibition is concurrent with excitation i.e., for the non-preferred direction of FM.
4.3. Roles of active membrane properties.
We found that the PR-dependent decline in the estimated current contributed by voltage-dependent conductances accounted for approximately 7% of the variation in long-interval selectivity after considering the net excitation; together these two properties accounted for 72% of the observed variation in long-interval selectivity. Although the contribution of voltage-dependent conductances was marginally nonsignificant (p=0.058), there was a clear trend for these active-membrane properties to amplify responses at slow PRs and thereby contribute to long-interval selectivity. The contributions of voltage-dependent conductances to responses varied across cells, and this variation is a likely basis of the marginal statistical significance.
Postinhibitory rebound depolarization, which has been implicated in band-pass selectivity for pulse rate (Schöneich et al., 2015) appeared to play little role in long-interval selectivity. This conclusion is based on the absence of depolarizations following hyperpolarizing IPSPs, which would be expected if postinhibitory rebound depolarization was present. However, we could not exclude the possibility of PIR in cases where excitation immediately followed inhibition. Therefore, in two cases, we blocked excitation pharmacologically, thereby isolating and accentuating IPSPs, and still did not see postinhibitory rebound depolarizations. Together, these results suggest that this property does not contribute appreciably to long-interval selectivity. Considering the difficulty of performing pharmacological manipulations while making whole-cell recordings in vivo, and the accumulating negative evidence, we elected to not pursue additional experiments aimed at this question; future experiments could further investigate whether PIR contributes to the responses of some cells in which inhibition precedes excitation.
4.4. Inhibition, gain control and short-term plasticity.
As mentioned above, attenuating inhibition did not completely eliminate long-interval selectivity. Moreover, for 3 neurons, blocking GABAA receptors increased overall response gain without appreciably decreasing long-interval selectivity, and phasic-onset responses remained. In most cases, attenuating inhibition proportionately increased response amplitude across pulse rates; that is, decreasing inhibition did not disproportionately unmask excitation at fast pulse rates. These results indicate that, for many LINs, inhibition primarily attenuates response amplitude, but does not contribute to interval selectivity (beyond that due to spike threshold processes). Similarly, extracellular recordings from IC neurons in bats showed that blocking inhibition increased the strength of responses but did not alter selectivity for AM rate (Burger and Pollak, 1998). In these cases, rate-dependent synaptic depression of excitation could operate alone or in conjunction with inhibition to generate long-interval selectivity. Rate-dependent synaptic depression of excitation has been postulated to contribute to selectivity for long intervals in the electrosensory systems of electric fish (Baker and Carlson, 2014, Fortune and Rose, 2000), low-pass temporal selectivity of visual cortical cells (Carandini et al., 2002) and appears to be a mechanism of general importance (Klug et al., 2012). Baker and Carlson (2014) found that excitation depressed more quickly and to a larger extent than inhibition, which temporally summated (George et al., 2011), in electrosensory midbrain neurons that were selective for long interpulse intervals. Similarly, we found that in at least 3/7 cases depression of excitation appeared to be the primary factor underlying long-interval selectivity. However, we also found that inhibition could influence the within-stimulus depression of Δge that occurred for fast pulse rates; thus, this property was not necessarily due to synaptic depression at excitatory synapses or upstream processes. As stated above, these nonlinear interactions might result from excitatory current being shunted by concurrently active inhibitory synapses in the dendrites, such that little current is conducted to and depolarizes the soma (Gidon and Segev, 2012).
Depression of excitation may result from decreased release of transmitter from presynaptic terminals, desensitization of postsynaptic receptors, or occur upstream of the midbrain i.e., be a property of the excitatory inputs to IC neurons (Condon et al., 1991). In our pharmacological experiments, we observed sustained activity in response to iontophoresis of glutamate, suggesting that depression of excitation is not primarily due to desensitization of postsynaptic receptors. To determine whether synaptic depression contributes to long-interval selectivity (Fortune and Rose, 2000), specific afferents could be directly activated at various rates, possibly using optogenetic methods, while recording from IC cells.
In conclusion, we have shown that selectivity for long intervals between successive sounds is mechanistically diverse. For example, inhibition is computationally important in some neurons, but primarily mediates gain control in others. We also show that shunting inhibition can shape the gain and interval selectivity of excitatory inputs to IC. Our results shed new light on the diversity of mechanisms for decoding time intervals and contribute to a growing body of data implicating the balance of excitation and inhibition as critical in the function of neural circuits (George et al., 2011, Haider et al., 2013, Higley and Contreras, 2006, Vogels et al., 2011, Wehr and Zador, 2003).
Supplementary Material
Supplemental Figure 1(A) Oscillograms and sound spectrograms of advertisement (mating) and aggressive (chuckle) calls used in the acoustic communication of leopard frogs Lithobates (Rana) pipiens.
(B) Representation of the neurophysiological methods, including whole-cell recording from neurons and concurrent microiontophoresis in the anuran inferior colliculus; the morphology of a neuron that showed long-interval selectivity is shown.
(C) Membrane potential responses of a neuron to single pulses of sound. The three traces are natural variations in cell responses to this stimulus, recorded at the same current clamp level and 10 sec intervals. Eact: Potential at which near-threshold non-linear conductances are activated; note that this is subthreshold. Et: Threshold for action potential generation, seen as an inflection. Black trace represents spiking response of the neuron; during this response, the membrane depolarizes beyond spike threshold. Magenta trace represents the neural response that did not cross spike threshold; notice voltage-dependent conductances are present as the membrane depolarizes beyond Eact. Gray trace represents neural response with linear currents, which did not depolarize beyond Eact. (D) Responses of a midbrain neuron with a strong active component in its responses to a single pulse of sound (pulse duration = 10ms, carrier frequency = 470 Hz, resting potential = −67.8 mV). Estimates of changes in excitatory (red) and inhibitory (blue) conductances using linear (α = 0, β = 0) and non-linear estimation techniques (Eqn. 2) are shown; linear estimations after iontophoresis of NBQX (5mV, +94nA) are presented for comparison. The number of spikes elicited over the number of repetitions is shown above each averaged response for 0 nA current clamp. Stimulus amplitude = 59 dB SPL. (E) Responses of another midbrain neuron that responds to a single pulse of sound before and after ~8 min iontophoresis of NBQX (5 mM, +70 nA) and CPP (10 mM, +50 nA) to block AMPA- and NMDA-type glutamate receptors, respectively. Voltage recordings of responses to tone bursts (carrier frequency = 470 Hz) of 20 ms durations were made at the current-clamp levels shown; as in D, linear and non-linear estimation of conductances and linear estimation after iontophoresis are presented for comparison. Resting potential = −70.5 mV and −74 mV before and after blocking excitation, respectively; stimulus amplitude = 62 dB SPL.
Highlights.
Whole-cell recordings, in vivo, and focal pharmacology were combined.
New synaptic-conductance estimation algorithm is presented.
Mechanisms of auditory selectivity for long-intervals are elucidated.
Shunting inhibition acts to attenuate and shape the interval selectivity of excitation.
Acknowledgments:
We thank Madeline Bernardo, Michael Lindstrom, Caleb Herrick, Dina Krikova and Harsha Gadhiraju for assistance. This work was supported by NIDCD grant R01 DC0003788.
Footnotes
Publisher's Disclaimer: This is a PDF file of an unedited manuscript that has been accepted for publication. As a service to our customers we are providing this early version of the manuscript. The manuscript will undergo copyediting, typesetting, and review of the resulting proof before it is published in its final form. Please note that during the production process errors may be discovered which could affect the content, and all legal disclaimers that apply to the journal pertain.
References
- ALDER TB & ROSE GJ 2000. Integration and recovery processes contribute to the temporal selectivity of neurons in the midbrain of the northern leopard frog, Rana pipiens. J Comp Physiol A, 186, 923–37. [DOI] [PubMed] [Google Scholar]
- ALLURI RK, ROSE GJ, HANSON JL, LEARY CJ, VASQUEZ-OPAZO GA, GRAHAM JA & WILKERSON J 2016. Phasic, suprathreshold excitation and sustained inhibition underlie neuronal selectivity for short-duration sounds. Proceedings of the National Academy of Sciences, 113, E1927–E1935. [DOI] [PMC free article] [PubMed] [Google Scholar]
- ANDERSON JS, LAMPL I, GILLESPIE DC & FERSTER D 2001. Membrane potential and conductance changes underlying length tuning of cells in cat primary visual cortex. The Journal of Neuroscience, 21, 2104–2112. [DOI] [PMC free article] [PubMed] [Google Scholar]
- ATHERTON LA, BURNELL ES & MELLOR JR 2016. Assessment of methods for the intracellular blockade of GABAA receptors. PloS one, 11, e0160900. [DOI] [PMC free article] [PubMed] [Google Scholar]
- ATKINS G, CHIBA A, ATKINS S & STOUT JF 1988. Low-pass filtering of sound signals by a high-frequency brain neuron and its input in the cricketAcheta domestica L. Journal of Comparative Physiology A, 164, 269–276. [Google Scholar]
- BAKER CA & CARLSON BA 2014. Short-term depression, temporal summation, and onset inhibition shape interval tuning in midbrain neurons. J Neurosci, 34, 14272–87. [DOI] [PMC free article] [PubMed] [Google Scholar]
- BEYELER M, ROUNDS EL, CARLSON KD, DUTT N & KRICHMAR JL 2019. Neural correlates of sparse coding and dimensionality reduction. PLoS computational biology, 15, e1006908. [DOI] [PMC free article] [PubMed] [Google Scholar]
- CARANDINI M, HEEGER DJ & SENN W 2002. A synaptic explanation of suppression in visual cortex. Journal of Neuroscience, 22, 10053–10065. [DOI] [PMC free article] [PubMed] [Google Scholar]
- CHACRON MJ, LONGTIN A & MALER L 2011. Efficient computation via sparse coding in electrosensory neural networks. Current opinion in neurobiology, 21, 752–760. [DOI] [PMC free article] [PubMed] [Google Scholar]
- CONDON CJ, CHANG S-H & FENG AS 1991. Processing of behaviorally relevant temporal parameters of acoustic stimuli by single neurons in the superior olivary nucleus of the leopard frog. Journal of Comparative Physiology A, 168, 709–725. [DOI] [PubMed] [Google Scholar]
- EDWARDS CJ, LEARY CJ & ROSE GJ 2007. Counting on inhibition and rate-dependent excitation in the auditory system. Journal of Neuroscience, 27, 1338413392. [DOI] [PMC free article] [PubMed] [Google Scholar]
- EDWARDS CJ, LEARY CJ & ROSE GJ 2008. Mechanisms of long-interval selectivity in midbrain auditory neurons: roles of excitation, inhibition, and plasticity. J Neurophysiol, 100, 3407–16. [DOI] [PMC free article] [PubMed] [Google Scholar]
- FORTUNE ES & ROSE GJ 2000. Short-term synaptic plasticity contributes to the temporal filtering of electrosensory information. The Journal of Neuroscience, 20, 7122–7130. [DOI] [PMC free article] [PubMed] [Google Scholar]
- GEORGE AA, LYONS-WARREN AM, MA X & CARLSON BA 2011. A diversity of synaptic filters are created by temporal summation of excitation and inhibition. J Neurosci, 31, 14721–34. [DOI] [PMC free article] [PubMed] [Google Scholar]
- GERHARDT HC 2001. Acoustic communication in two groups of closely related treefrogs. Advances in the Study of Behavior. Elsevier. [Google Scholar]
- GIDON A & SEGEV I 2012. Principles governing the operation of synaptic inhibition in dendrites. Neuron, 75, 330–341. [DOI] [PubMed] [Google Scholar]
- GITTELMAN JX & LI N 2011. FM velocity selectivity in the inferior colliculus is inherited from velocity-selective inputs and enhanced by spike threshold. Journal of Neurophysiology (Bethesda), 106, 2399–2414. [DOI] [PMC free article] [PubMed] [Google Scholar]
- GITTELMAN JX, LI N & POLLAK GD 2009. Mechanisms underlying directional selectivity for frequency-modulated sweeps in the inferior colliculus revealed by in vivo whole-cell recordings. The Journal of Neuroscience, 29, 13030–13041. [DOI] [PMC free article] [PubMed] [Google Scholar]
- GROTHE B 1994. Interaction of excitation and inhibition in processing of pure tone and amplitude-modulated stimuli in the medial superior olive of the mustached bat. J Neurophysiol, 71, 706–21. [DOI] [PubMed] [Google Scholar]
- HAIDER B, HÄUSSER M & CARANDINI M 2013. Inhibition dominates sensory responses in the awake cortex. Nature, 493, 97–100. [DOI] [PMC free article] [PubMed] [Google Scholar]
- HALL JC 1994. Central processing of communication sounds in the anuran auditory system. American Zoologist, 34, 670–684. [Google Scholar]
- HIGLEY MJ & CONTRERAS D 2006. Balanced excitation and inhibition determine spike timing during frequency adaptation. Journal of Neuroscience, 26, 448–457. [DOI] [PMC free article] [PubMed] [Google Scholar]
- IZHIKEVICH EM 2010. Hybrid spiking models. Philosophical Transactions of the Royal Society of London A: Mathematical, Physical and Engineering Sciences, 368, 5061–5070. [DOI] [PubMed] [Google Scholar]
- JOHNSTON D & BROWN TH 1983. Interpretation of voltage-clamp measurements in hippocampal neurons. Journal of Neurophysiology, 50, 464–486. [DOI] [PubMed] [Google Scholar]
- KHAZIPOV R, LEINEKUGEL X, KHALILOV I, GAIARSA J & BEN-ARI Y 1997. Synchronization of GABAergic interneuronal network in CA3 subfield of neonatal rat hippocampal slices. The Journal of Physiology, 498, 763–772. [DOI] [PMC free article] [PubMed] [Google Scholar]
- KLUG A, BORST JGG, CARLSON BA, KOPP-SCHEINPFLUG C, KLYACHKO VA & XU-FRIEDMAN MA 2012. How do short-term changes at synapses fine-tune information processing? The Journal of Neuroscience, 32, 14058–14063. [DOI] [PMC free article] [PubMed] [Google Scholar]
- KOCH C & POGGIO T 1985. The synaptic veto mechanism: does it underlie direction and orientation selectivity in the visual cortex.
- OLSHAUSEN BA & FIELD DJ 2004. Sparse coding of sensory inputs. Current opinion in neurobiology, 14, 481–487. [DOI] [PubMed] [Google Scholar]
- PATON JJ & BUONOMANO DV 2018. The neural basis of timing: distributed mechanisms for diverse functions. Neuron, 98, 687–705. [DOI] [PMC free article] [PubMed] [Google Scholar]
- PRIEBE NJ & FERSTER D 2005. Direction selectivity of excitation and inhibition in simple cells of the cat primary visual cortex. Neuron, 45, 133–145. [DOI] [PubMed] [Google Scholar]
- PRIEBE NJ & FERSTER D 2008. Inhibition, spike threshold, and stimulus selectivity in primary visual cortex. Neuron, 57, 482–497. [DOI] [PubMed] [Google Scholar]
- ROSE G & CAPRANICA RR 1983. Temporal selectivity in the central auditory system of the leopard frog. Science, 219, 1087–9. [DOI] [PubMed] [Google Scholar]
- ROSE GJ 2014. Time computations in anuran auditory systems. Front Physiol, 5, 206. [DOI] [PMC free article] [PubMed] [Google Scholar]
- ROSE GJ, ALLURI RK, VASQUEZ-OPAZO GA, ODOM SE, GRAHAM JA & LEARY CJ 2013. Combining pharmacology and whole-cell patch recording from CNS neurons, in vivo. J Neurosci Methods, 213, 99–104. [DOI] [PMC free article] [PubMed] [Google Scholar]
- ROSE GJ & BRENOWITZ EA 1997. Plasticity of aggressive thresholds inHyla regilladiscrete accommodation to encounter calls. Animal Behaviour, 53, 353–361. [Google Scholar]
- ROSE GJ & BRENOWITZ EA 2002. Pacific treefrogs use temporal integration to differentiate advertisement from encounter calls. Animal Behaviour, 63, 11831190. [Google Scholar]
- ROSE GJ & FORTUNE ES 1996. New techniques for making whole-cell recordings from CNS neurons in vivo. Neurosci Res, 26, 89–94. [DOI] [PubMed] [Google Scholar]
- ROSE GJ, LEARY CJ & BEE M, 2021. Anuran auditory systems as models for understanding sensory processing and the evolution of communication. The Senses. 2nd edn. Elsevier. [Google Scholar]
- SCHÖNEICH S, KOSTARAKOS K & HEDWIG B 2015. An auditory feature detection circuit for sound pattern recognition. Science Advances, 1, e1500325. [DOI] [PMC free article] [PubMed] [Google Scholar]
- SMIRNOV S, PAALASMAA P, UUSISAARI M, VOIPIO J & KAILA K 1999. Pharmacological isolation of the synaptic and nonsynaptic components of the GABA-mediated biphasic response in rat CA1 hippocampal pyramidal cells. Journal of Neuroscience, 19, 9252–9260. [DOI] [PMC free article] [PubMed] [Google Scholar]
- SPRUSTON N, JAFFE DB, WILLIAMS SH & JOHNSTON D 1993. Voltage-and space-clamp errors associated with the measurement of electrotonically remote synaptic events. Journal of neurophysiology, 70, 781–802. [DOI] [PubMed] [Google Scholar]
- VOGELS T, SPREKELER H, ZENKE F, CLOPATH C & GERSTNER W 2011. Inhibitory plasticity balances excitation and inhibition in sensory pathways and memory networks. Science, 334, 1569–1573. [DOI] [PubMed] [Google Scholar]
- WEHR M & ZADOR AM 2003. Balanced inhibition underlies tuning and sharpens spike timing in auditory cortex. Nature, 426, 442–446. [DOI] [PubMed] [Google Scholar]
- WILLIAMS SR & MITCHELL SJ 2008. Direct measurement of somatic voltage clamp errors in central neurons. Nature neuroscience, 11, 790–798. [DOI] [PubMed] [Google Scholar]
Associated Data
This section collects any data citations, data availability statements, or supplementary materials included in this article.
Supplementary Materials
Supplemental Figure 1(A) Oscillograms and sound spectrograms of advertisement (mating) and aggressive (chuckle) calls used in the acoustic communication of leopard frogs Lithobates (Rana) pipiens.
(B) Representation of the neurophysiological methods, including whole-cell recording from neurons and concurrent microiontophoresis in the anuran inferior colliculus; the morphology of a neuron that showed long-interval selectivity is shown.
(C) Membrane potential responses of a neuron to single pulses of sound. The three traces are natural variations in cell responses to this stimulus, recorded at the same current clamp level and 10 sec intervals. Eact: Potential at which near-threshold non-linear conductances are activated; note that this is subthreshold. Et: Threshold for action potential generation, seen as an inflection. Black trace represents spiking response of the neuron; during this response, the membrane depolarizes beyond spike threshold. Magenta trace represents the neural response that did not cross spike threshold; notice voltage-dependent conductances are present as the membrane depolarizes beyond Eact. Gray trace represents neural response with linear currents, which did not depolarize beyond Eact. (D) Responses of a midbrain neuron with a strong active component in its responses to a single pulse of sound (pulse duration = 10ms, carrier frequency = 470 Hz, resting potential = −67.8 mV). Estimates of changes in excitatory (red) and inhibitory (blue) conductances using linear (α = 0, β = 0) and non-linear estimation techniques (Eqn. 2) are shown; linear estimations after iontophoresis of NBQX (5mV, +94nA) are presented for comparison. The number of spikes elicited over the number of repetitions is shown above each averaged response for 0 nA current clamp. Stimulus amplitude = 59 dB SPL. (E) Responses of another midbrain neuron that responds to a single pulse of sound before and after ~8 min iontophoresis of NBQX (5 mM, +70 nA) and CPP (10 mM, +50 nA) to block AMPA- and NMDA-type glutamate receptors, respectively. Voltage recordings of responses to tone bursts (carrier frequency = 470 Hz) of 20 ms durations were made at the current-clamp levels shown; as in D, linear and non-linear estimation of conductances and linear estimation after iontophoresis are presented for comparison. Resting potential = −70.5 mV and −74 mV before and after blocking excitation, respectively; stimulus amplitude = 62 dB SPL.