

Abstract
Fractals are geometric objects that are self-similar at different scales and whose geometric dimensions differ from so-called fractal dimensions. Fractals describe complex continuous structures in nature. Although indications of self-similarity and fractality of complex networks has been previously observed, it is challenging to adapt the machinery from the theory of fractality of continuous objects to discrete objects such as networks. In this article, we identify and study fractal networks using the innate methods of graph theory and combinatorics. We establish analogues of topological (Lebesgue) and fractal (Hausdorff) dimensions for graphs and demonstrate that they are naturally related to known graph-theoretical characteristics: rank dimension and product dimension. Our approach reveals how self-similarity and fractality of a network are defined by a pattern of overlaps between densely connected network communities. It allows us to identify fractal graphs, explore the relations between graph fractality, graph colourings and graph descriptive complexity, and analyse the fractality of several classes of graphs and network models, as well as of a number of real-life networks. We demonstrate the application of our framework in evolutionary biology and virology by analysing networks of viral strains sampled at different stages of evolution inside their hosts. Our methodology revealed gradual self-organization of intra-host viral populations over the course of infection and their adaptation to the host environment. The obtained results lay a foundation for studying fractal properties of complex networks using combinatorial methods and algorithms.
Keywords: fractal network, self-similarity, Lebesgue dimension, Hausdorff dimension, Kolmogorov complexity, graph colouring, clique, hypergraph
1. Introduction
Fractals are geometric objects that are widespread in nature and appear in many research domains, including dynamical systems, physics, biology and behavioural sciences [1]. By Mandelbrot’s classical definition, geometric fractal is a topological space (usually a subspace of an Euclidean space), whose topological (Lebesgue) dimension is strictly smaller than the fractal (Hausdorff) dimension. It is also usually assumed that fractals have some form of geometric or statistical self-similarity [1]. Lately, there was a growing interest in studying self-similarity and fractal properties of complex networks, which is largely inspired by applications in biology, sociology, chemistry and computer science [2–5]. Although such studies are usually based on genuine ideas from graph theory and general topology and provided a deep insight into structures of complex networks and mechanisms of their formation, they are often not supported by a rigorous mathematical framework. As a result, such methods may not be directly applicable to many important classes of graphs and networks [6,7]. In particular, many studies translate the definition of a topological fractal to networks by considering a graph as the finite metric space with the metric being the standard shortest path length, and identifying graph fractal dimension with the Minkowski–Bouligand (box-counting) dimension [4,5].
However, direct applications of the continuous definition to discrete objects such as networks can be problematic. Indeed, under this definition many real-life networks do not have well-defined fractal dimension and/or are not fractal and self-similar. This is in particular due to the fact that these networks have so-called ‘small-world’ property, which implies that their diameters are exponentially smaller than the numbers of their vertices [5]. Moreover, even if the box-counting dimension of a network can be defined and calculated, it is challenging to associate it with graph structural/topological properties. As regards to the phenomenon of network self-similarity, previous studies described it as the preservation of network properties under a length-scale transformation [5]. However, geometric fractals possess somewhat stronger property: they are comprised of parts topologically similar to the whole rather than just have similar features at different scales. Finally, many computational tasks associated with the continuous definitions cannot be formulated as well-defined algorithmic problems and studied within the framework of theory of computational complexity, discrete optimization and machine learning. Thus, it is highly desirable to develop an understanding of graph dimensionsionality, self-similarity and fractality based on innate ideas and machineries of graph theory and combinatorics. There are several studies that translate certain notions of topological dimension theory to graphs using combinatorial methods [8,9]. However, to the best of our knowledge, a rigorous combinatorial theory of graph-theoretical analogues of topological fractals still has not been developed. In this article, we propose a combinatorial approach to the fractality of graphs, which consider natural network analogues of Lebesgue and Hausdorff dimensions of topological spaces from the graph-theoretical point of view. This approach allows to overcome the aforementioned difficulties and provides mathematically rigorous, algorithmically tractable and practical framework for study of network self-similarity and fractality. Roughly speaking, our approach suggests that fractality of a network is more naturally related to a pattern of overlaps between densely connected network communities rather than to the distances between individual nodes. It is worth noting that overlapping community structure of complex networks received considerable attention in network theory and has been a subject of multiple studies [10,11]. Furthermore, such approach allows us to exploit the duality between partitions of networks into communities and encoding of networks using set systems. This duality has been studied in graph theory for a long time [12] and allows for topological and information-theoretical interpretations of network self-similarity and fractality.
The major results of this study can be summarized as follows:
(1) Lebesgue and Hausdorff dimensions of graphs are naturally related to known characteristics from the graph theory and combinatorics: rank dimension [12] and product (or Prague or Nešetřil–Rödl) dimension [13]. These dimensions are associated with the patterns of overlapping cliques in graphs. We underpin the connection between general topological dimensions and their network analogues by demonstrating that they measure the analogous characteristics of the respective objects:
Topological Lebesgue dimension and graph rank dimension are both associated with the representation of general compact metric spaces and graphs by intersecting families of sets. Such representations have been extensively studied in graph theory [12], where it has been shown that any graph of a given rank dimension encodes the pattern of intersections of a family of finite sets with particular properties. It turned out, that general compact metric spaces of a given Lebesgue dimension also can be approximated by intersecting families of sets with analogous properties.
Product dimension is a measure of a graph self-similarity, as it defines a decomposition of a graph into its own images under stronger versions of graph homomorphisms.
(2) Fractal graphs naturally emerge as graphs whose Lebesgue dimensions are strictly smaller than Hausdorff dimensions. We analyse in detail the fractality and self-similarity of scale-free networks, Erdös–Renyi graphs and cubic and subcubic graphs. For such graphs, fractality is closely related to edge colourings, and separation of graphs into fractals and non-fractals could be considered as a generalization of one of the most renowned dichotomies in graph theory—the separation of graphs into class 1 and class 2 [14] (i.e. graphs whose edge chromatic number is equal to  or
or  , where
  is the maximum vertex degree of a graph). One of the examples of graph fractals is the remarkable class of snarks [15,16]. Snarks turned out to be the basic cubic fractals, with other cubic fractals being topologically reducible to them.
(3) Lebesgue and Hausdorff dimension of graphs are related to their Kolmogorov complexity—one of the basic concepts of information theory, which is often studied in association with fractal and chaotic systems [17]. These dimensions measure the complexity of graph encoding using so-called set and vector representations. Non-fractal graphs are the graphs for which these representations are equivalent, while fractal graphs possesses additional structural properties that manifest themselves in extra dimensions needed to describe them using the latter representation.
(4) Analytical estimations and experimental results reveal high self-similarity of sparse Erdös–Renyi and Wattz–Strogatz networks, and lower self-similarity of preferential attachment and dense Erdös–Renyi networks. Numerical experiments suggest that fractality is a rare phenomenon for basic network models but could be significantly more common for real networks.
(5) The proposed theory can be used to infer information about the mechanisms of real-life network formation. As an example, we analysed genetic networks representing structures of 323 intra-host Hepatitis C populations sampled at different infection stages. The analysis revealed the increase of network self-similarity over the course of infection, thus suggesting intra-host viral adaptation and emergence of self-organization of viral populations over the course of their evolution.
We expect that the theory of graph fractals developed in this article will facilitate study of fractal properties of graphs and complex networks. One of its possible applications is a representation of various combinatorial tasks as algorithmic problems to be studied within the framework of theory of algorithms and computational complexity.
2. Basic definitions and facts from measure theory, dimension theory and graph theory
Let  be a compact metric space. A family
  of open subsets of
  is a cover, if
  . A cover
  is
is  -cover, if every
  belongs to at most
  sets from
  ;
;  -cover, if for every set
  its diameter
  does not exceed
  ;
;  -cover, if it is both
  -cover and
  -cover. Lebesgue dimension
  of
of  is the minimal integer
  such that for every
  there exists
  -cover of
  .
.
Let  be a semiring of subsets of a set X. A function
  is a measure, if
  and for any countable collection of pairwise disjoint sets
  , one has
  .
.
Let now  be a subspace of an Euclidean space
  . Hyper-rectangle
  is a Cartesian product of semi-open intervals:
  , where
  ; the volume of a the hyper-rectangle
  is equal to
  . The
. The  -dimensional Jordan measure of the set
  is defined as
 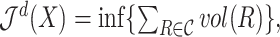 where the infimum is taken over all finite covers
  of
of  by disjoint hyper-rectangles. The
  -dimensional Lebesgue measure of a measurable set
  is defined analogously, with the infimum taken over all countable covers
  of
of  by (not necessarily disjoint) hyper-rectangles. Finally, the
  -dimensional Hausdorff measure of the set
  is defined as
 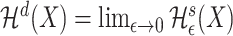 , where
 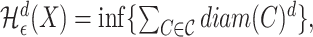 and the infimum is taken over all
  -covers of
  . These three measures are related: the Jordan and Lebesgue measures of the set
  are equal, if the former exists, while Lebesgue and Hausdorff measures of Borel sets differ only by a multiplicative constant.
Hausdorff dimension  of the set
  is the value
 |
(2.1) |
Lebesgue and Hausdorff dimension of  are related as follows:
 |
(2.2) |
The set  is a fractal (by Mandelbrot’s definition) [18], if the inequality (2.2) is strict.
Now let  be a simple graph. The notation
  indicates that the vertices
  are adjacent, and
  denotes the maximum vertex degree of
  . We denote by
  the complement of
  , that is, the graph on the same vertex set and with two vertices being adjacent whenever they are not adjacent in
  . Connected components of
  are called co-connected components of
  . A graph is biconnected, if there is no vertex or edge (called a bridge), whose removal makes it disconnected.
A graph  is a subgraph of
  , if
, if  and
and  . A subgraph
  is induced by a vertex subset
  , if it contains all edges with both endpoints in
  . The complete graph, the chordless path and the chordless cycle on
  vertices are denoted by
  ,
,  and
and  , respectively. A star
  is the graph on
  vertices with one vertex of the degree
  and
and  vertices of the degree 1.
A clique of  is a set of pairwise adjacent vertices. A clique number
  is the number of vertices in the largest clique of
  . The family of cliques
  of
of  is a clique cover, if every edge
  is contained in at least one clique from
  . The subgraphs forming the cover are referred to as its clusters. A cover
  is
is  -cover, if every vertex
  belongs to at most
  clusters. A cluster
  separates vertices
  , if
, if  . A cover is separating, if every two distinct vertices are separated by some cluster.
Now consider a hypergraph  (i.e. a finite set
  together with a family of its subsets
  called edges). Simple graphs are special cases of hypergraphs. The rank
  is the maximal size of an edge of
  . A hypergraph
  is strongly
  -colourable, if one can assign colours from the set
  to its vertices in such a way that vertices of every edge receive different colours. The vertices of the same colour form a colour class. Strongly
  -colourable simple graphs are called bipartite. The edge
  -colouring and edge colour classes of a hypergraph are defined analogously, with the condition that the edges that share a vertex receive different colours. Chromatic number
  and edge chromatic number
  are minimal numbers of colours required to colour vertices and edges of a hypergraph, respectively.
Intersection graph  of a hypergraph
  is a simple graph with a vertex set
  in a bijective correspondence with the edge set of
  and two distinct vertices
  being adjacent, if and only if
  . The following theorem establishes a connection between intersection graphs and clique
  -covers:
Theorem 2.1
[12] A graph
is an intersection graph of a hypergraph of rank
if and only if it has a clique
-cover.
Rank dimension [19]  of a graph
  is the minimal
  such that
  satisfies Theorem 2.1. In particular, graphs with
 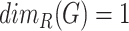 are disjoint unions of cliques (such graphs are called equivalence graphs [20] or
  -graphs [21]).
Categorical product of graphs  and
and  is the graph
  with the vertex set
  with two vertices
  and
and  being adjacent whenever
  and
and  . Product dimension (or Prague dimension or Nešetřil–Rödl in different sources)
  is the minimal integer
  such that
  is an induced subgraph of a categorical product of
  complete graphs [13].
Equivalent  -cover of the graph
  is a cover of its edges by equivalence graphs. It can be equivalently defined as a clique cover
  such that the hypergraph
  is edge
  -colourable. Relations between product dimension, clique covers and intersection graphs are described by the following theorem that comprises results obtained in several prior studies:
Theorem 2.2
[13,22] The following statements are equivalent:
(1)
;
(2) there exists a separating equivalent
-cover of
;
(3)
is an intersection graph of strongly
-colourable hypergraph without multiple edges;
(4) there exists an injective mapping
,
such that
whenever
for some
.
3. Lebesgue dimension of graphs
Lebesgue dimension of a metric space is defined through  -covers by sets of arbitrary small diameter. It is natural to transfer this definition to graphs using graph
  -covers by subgraphs of smallest possible diameter, that is, by cliques. Thus in light of Theorem 2.1, we define Lebesgue dimension of a graph through its rank dimension:
 |
(3.1) |
An analogy between Lebesgue dimension of a metric space and rank dimension of a graph is reinforced by Theorem 3.1. This theorem basically extends the analogy from graph theory back to general topology by stating that any compact metric spaces of bounded Lebesgue measure could be approximated by intersection graphs of (infinite) hypergraphs of bounded rank. To prove it, we will use the following fact:
Lemma 3.1
[18] Let
be a compact metric space and
be its open cover. Then there exists
(called a Lebesgue number of
) such that for every subset
with
there is a set
such that
.
Theorem 3.1
Let
be a compact metric space with a metric
. Then
if and only if for any
there exists a number
and a hypergraph
on a finite vertex set
with an edge set
, which satisfies the following conditions:
(1)
;
(2)
for every
such that
;
(3)
for every
such that
;
(4) for every
the set
is open.
Proof.
Suppose that
,
and let
be the corresponding
-cover of
. Since
is compact, we can assume that a cover
is finite, that is,
. Let
be the Lebesgue number of
.
For a point
let
. Consider a hypergraph
with
and
. Then
satisfies conditions (1)–(4). Indeed,
, since
is
-cover. If
, then by Lemma 3.1 there is
such that
, that is,
. Condition
means that
, and so
, since
. Finally, for every
we have
, and thus
is open.
Conversely, let
be a hypergraph with
satisfying conditions (1)–(4). Then, it is straightforward to check that
is an open
-cover of
. □
So,  whenever for any
  there is a hypergraph
  of
of  with edges in bijective correspondence with points of
  such that two points are close if and only if corresponding edges intersect.
Clique cover consisting of all edges of  is a
is a  -cover. It implies the following upper bound for
  :
:
Proposition 3.2
. The equality holds, if
is triangle-free.
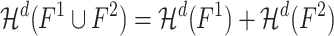
4. Hausdorff dimension of graphs
The goal of this section is to demonstrate that the complement product dimension is a graph-theoretical analogue of the Hausdorff dimension. First, we establish a formal connection by proving that this dimension is associated with a graph measure analogous to the Hausdorff measure of topological spaces. Second, we demonstrate that this dimension is associated with a graph self-similarity.
4.1 Graph measure
In order to rigorously define a graph analogue of Hausdorff dimension, we need to define the corresponding measure first. Note that in any meaningful finite graph topology every set is a Borel set. As mentioned above, for measurable Borel sets in  Jordan, Lebesgue and Hausdorff measures are equivalent. Thus, further we will consider the graph analogue of Jordan measure. We propose a parameter which is aimed to serve as the graph analogue of the Jordan measure and prove that it indeed satisfies the axioms of measure. Finally, based on this parameter we define the Hausdorff dimension of a graph.
It is known, that every graph  is isomorphic to an induced subgraph
  of a categorical product
  of complete graphs [13]. Without loss of generality we may assume that
  , that is,
  is an induced subgraph of the graph
 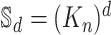 .
.  will be referred to as a space of dimension
  and
and  as an embedding of
  into
into  . After assuming that
  , we may say that every vertex
  is a vector
 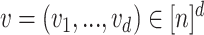 , and two vertices
  and
and  are adjacent if and only if
  for every
  .
.
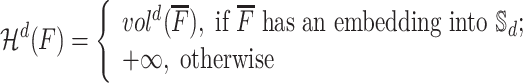
Hyper-rectangle  is a subgraph of
  , that is defined as follows:
  , where for every
  the set
  is non-empty. The volume of
  is naturally defined as
  .
.
The family 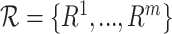 of hyper-rectangles is a rectangle co-cover of
  , if the subgraphs
  are pairwise vertex-disjoint,
  and
and  covers all non-edges of
  , that is, for every pair of non-adjacent vertices
  there exists
  such that
  . We define
  - volume of a graph
  as
as
 |
(4.1) |
where the first minimum is taken over all embeddings  of
of  into
into  -dimensional spaces
  and the second minimum—over all rectangle co-covers of
  . For example, Fig. 1 (left) demonstrates that the two-dimensional volume of the path
  is equal to 6.
Fig. 1.

Top: Embedding of  into a 2-dimensional space
  and its rectangle co-cover by a hyper-rectangle of volume
  . Bottom: equivalent
  -cover defining a self-similarity of a graph
  . From left to right: the graph
  ; an equivalent 2-cover
  of
of  with the clusters of the same colour highlighted in red and green; subgraphs
  and
and  such that
 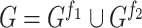 for the contracting family
  defined by
  ; contractions
  and
and 
Based on the definition of  -volume, we define a
  -measure of a graph
  as follows:
 |
(4.2) |
The main theorem of this section confirms that  indeed satisfy the axioms of a measure:
Theorem 4.1
Let
and
be two graphs, and
is their disjoint union. Then
(4.3)
The proof of Theorem 4.1 is presented in Supplementary Materials.
Following the analogy with Hausdorff dimension of topological spaces (2.1), we define a Hausdorff dimension of a graph  as
as
 |
(4.4) |
Thus, Hausdorff dimension of a graph can be identified with a Prague dimension of its complement.
According to Theorem 2.2, graph Hausdorff dimension is defined by the existence of a separating equivalent clique cover. In a typical case, the colouring requirement is more important than separation requirement. Indeed, two vertices may not be separated by some cluster of a given clique cover only if these two vertices are true twins, that is, they have the same closed neighbourhoods. In most network models and experimental networks presence of such vertices in highly unlikely; besides in most situations they can be collapsed into a single vertex without changing the majority of important network topological properties.
4.2 Self-similarity
The self-similarity of compact metric space  is defined using the notion of a contraction [18]. An open mapping
  is a similarity mapping, if
  for all
  , where
  is called its similarity ratio (such mapping is obviously continuous). If
  , then it is a contraction. The space
  is self-similar, if there exists a family of contractions
  such that
  .
.
This definition cannot be directly applied to discrete metric spaces such as graphs, since for them contractions in the strict sense do not exist. To formally and rigorously define the self-similarity of graphs, we proceed as follows. It is convenient to assume that every vertex is adjacent to itself. For two graphs  and
and  , a homomorphism [13] is a mapping
  which maps adjacent vertices to adjacent vertices, that is,
  for every
  . A homomorphism
  is a similarity mapping, if inverse images of adjacent vertices are also adjacent, that is,
  whenever
  (it is possible that
  ). In other words, for a similarity mapping, images and inverse images of cliques are cliques. With a similarity mapping
  we can associate a subgraph
  of
of  , which is formed by all edges
  such that
  (Fig. 1).
A family of graph similarity mappings  ,
,  , is a contracting family, if every edge of
  is contracted by some mapping, i.e. for every
  there exists
  such that
  . The graphs
  are contractions of
  . Finally, a graph
  is self-similar, if
  (Fig. 1).
Proposition 4.2
Graph
is self-similar with a contracting family
if and only if there is an equivalent separating
-cover of
.
Proof.
For a given contracting family
and any
, the sets
, consist of disjoint cliques. By the definition, every edge of
is covered by one of these cliques. Therefore
is an equivalent
-cover of
. Furthermore, due to the self-similarity of
, for every edge
there is a mapping
that does not contract it, that is,
. Thus,
and
are separated by the cliques
and
, and therefore
is a separating cover.
Conversely, let
be a separating equivalent
-cover, where
is the set of connected components of the
th equivalence graph (some of them may consist of a single vertex). Construct a graph
by contracting every clique
into a single vertex
and the mapping
by setting
. Then the collection
is a contracting family. □
According to Proposition 4.2, all graphs could be considered as self-similar—for example, we can construct  trivial similarity mappings by individually contracting each edge. Thus, it is natural to concentrate our attention on non-trivial similarity mappings and measure the degree of the graph self-similarity by the minimal number of similarity mappings in a contracting family, that is, by its Hausdorff dimension. Smaller number of similarity mappings indicates the denser packing of a graph by its contraction subgraphs, that is, the higher self-similarity degree. In particular, the normalized Hausdorff dimension
  could serve as a measure of self-similarity.
5. Fractal graphs: analytical study
In this section, we consider only connected graphs. Importantly, the relation (2.2) between Lebesgue and Hausdorff dimensions of topological spaces remains true for graphs.
Proposition 5.1
For any graph
,

Proof.
Let product dimension of a graph
is equal to
. Then by Theorem 2.2
is an intersection graph of strongly
-colourable hypergraph. Since rank of every such hypergraph obviously does not exceed
, Theorem 2.1 implies, that
. □
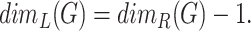
Thus, Proposition 5.1 allows us to define graph fractals analogously to the definition of fractals for topological spaces: a graph  is a fractal, if
  , that is,
  . In particular, we say that a fractal graph
  is
is  -fractal, if
  . For example, the graph
  on Fig. 1 (right) is self-similar, but not fractal, since
  .
.
As the first example of a fractal graph, we consider so-called Sierpinski gasket graphs  [23]. They are associated with the Sierpinski gasket—well-known topological fractal with a Hausdorff dimension
  . Edges of
  are line segments of the
  th approximation of the Sierpinski gasket, and vertices are intersection points of these segments (Fig. 2). Figure 2 demonstrates that Sierpinski gasket graph
  is 1-fractal. In fact, all Sierpinski gasket graphs are fractals, as the following theorem indicates (the proof can be found in Supplementary material):
Fig. 2.

Sierpinski gasket graphs  and the optimal equivalent separating
  -cover of
  . Clusters of the same colour are highlighted in red, green and blue.
  is a fractal: every vertex is covered by 2 clusters, while the clusters can be coloured using three colours.
Theorem 5.2
For every
Sierpinski gasket graph
is a fractal with
and
In the remaining part of this section, we will study fractality of more substantial classes of networks.
5.1 Triangle-free graphs
Let  denotes the edge chromatic number of a graph
  . Classical Vizing’s theorem [14] states that
  , that is, the set of all graphs can be partitioned into two classes: graphs, for which
  (class 1) and graphs, for which
  (class 2).
By Proposition 3.2,  , if
, if  contains no triangles. For such graphs, we have
Proposition 5.3
Triangle-free fractals are exactly triangle-free graphs of class 2.
Proof.
The statement holds, if
. Suppose that
has
vertices. For such graphs, every clique cover is a collection of its edges and vertices. However, since
is connected, for every pair of vertices there is an edge that separates them. Therefore, we may assume that the clique cover consists only of edges, and a feasible assignment of colours to the cliques is an edge colouring. Thus, it is true that
(i.e.
), and the statement of the proposition follows. □
In particular, bipartite graphs are triangle-free graphs of class 1 [24]. Therefore bipartite graphs (and trees in particular) are not fractals, even though some of them may have high degree of self-similarity (e.g. binary trees). It also should be noted that although some known geometric fractals are called trees (e.g. so-called  -trees), they are not discrete object, and their fractality is associated with their drawings on a plane; thus our framework does not apply to them.
5.2 Scale-free graphs
Recall that scale-free networks are graphs whose degree distribution (asymptotically) follows the power-law, that is, the probability that a given vertex has a degree  could be approximated by the function
  , where
  is a constant and
  is a scaling exponent. There is a number of models of scale-free networks of different degree of mathematical rigour known in the literature, including various modifications of the preferential attachment scheme. Following [25,26], we will consider a more formal probabilistic model. Assume without loss of generality that
  [26]. For each vertex
  , we assign a weight
  . Then, we construct a graph
  by independently connecting any pair of vertices
  by an edge with the probability
  , where
  and
and  is a constant.
From now on, we will use the following standard nomenclature [27]. An induced subgraph isomorphic to a cycle is a hole, a hole with the odd number of vertices is an odd hole. The star  is the claw, the 4-vertex graph consisting of two triangles with a common edge is the diamond and the 5-vertex graph consisting of two triangles with a common vertex is the butterfly.
Theorem 5.4
For graphs
with
and
, with high probability
and
.
Proof.
It has been proved in [26] that the clique number of a graph
with the scaling constant
is either 2 or 3 with high probability, that is,
as
for
-vertex scale-free graphs
that have power-law degree distribution with the exponent
. The following lemma complements this fact:
Lemma 5.1
(1) For
, graphs
with high probability do not contain diamonds.
(2) For
, graphs
with high probability do not contain butterflies.
Proof.
(1) Let vertices
form a diamond, where
and
are non-adjacent. For the probability of this event, we have
Thus, the total probability that these vertices form a diamond can be estimated as
(5.1) Let
be the number of diamonds in
. For the expected value of this random variable, we have
(5.2) Using an integral upper bound, it is easy to see that
(5.3) Furthermore,
whenever
.
Select
such that
. Then, we have
. Thus
. Finally, by Markov’s inequality we have
as
.
(2) Similarly to (1), for the probability
that vertices
form a butterfly with the centre
we have
Thus, for the number of butterflies
its expectation satisfy the following chain of inequalities:
(5.4)
(5.5) Like in (1), select a small number
such that
). Then by (5.3), we have
and
. Thus,
. After applying Markov’s inequality the claim follows. □


Thus, a typical scale-free graph with the scaling exponent  has only cliques of size 2 and 3, and every vertex belongs to at most one triangle. For such graphs, a minimal clique cover defining
  consists of all triangles and the edges that do not belong to triangles. Let
  be the number of triangles which include a vertex
  . Then with high probability
  , and the statement about
  follows. By Vizing’s theorem, two-vertex clusters of this cover could be coloured by at most
  colour, and one additional colour could be used to colour the triangles. Thus,
 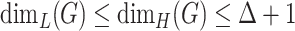 , which proves the statement for
  .
.
Note that the similar arguments may be used to prove Theorem 5.4 for more general model, when the weights  are identically distributed random variables with power-law-distributed tail (see [26]). In particular, for preferential attachment graph
  following this model, Theorem 5.4 and the estimations of
  from [28,29] imply that its Hausdorff dimension is roughly asymptotically equivalent to
  (up to an arbitrarily slowly growing multiplicative factor).
5.3 Erdös–Renyi graphs
Similar properties of dimensions hold for sparse Erdös–Renyi graphs  , where
  :
:
Theorem 5.5
For Erdös–Renyi graphs,
with
and
, with high probability
and
.
Indeed, it is implied by the following simple statement and considerations analogous to the ones in Theorem 5.4:
Lemma 5.2
(1) For
, graphs
with high probability do not contain
.
(2) For
, graphs
with high probability do not contain diamonds.
(3) For
, graphs
with high probability do not contain butterflies.
Proof.
Let
be the number of diamonds in
. Then
, and (2) follows from Markov’s inequality. Other statements can be proved analogously. □
Note that for sparse Erdös–Renyi graphs,  [30] and thus
  . For dense Erdös–Renyi graphs, the asymptotics is described by Theorem 6.2 (see Section on information-theoretic connection).
5.4 Cubic and subcubic graphs
A graph is cubic, if all its vertices have the degree three. Cubic graphs arise naturally in graph theory, topology, physics and network theory [31,32], and has been extensively studied. Among cubic graphs, the class of so-called snarks is distinguished in graph theory (the most famous snark—Petersen graph—is shown on Fig. 3). Snark is defined as a biconnected cubic graph of class 2 [15]. Snark is non-trivial, if it is triangle-free [15]. Snarks constitute important class of graphs, which has been studied for more than a century and whose structural properties continue to puzzle researchers to this day [15]. Discovery of new non-trivial snarks is a valuable scientific result1, not unlike the discovery of new fractals, with many known snarks also possessing high degree of symmetry and being constructed by certain recursive procedures. According to Proposition 5.3, this analogy is well-justified, as non-trivial snarks are indeed fractals according to our definition. As shown by Theorem 5.7, the inverse relation also holds, as cubic fractals could be reduced to snarks.
Fig. 3.

Left: Pendant triple contraction (top) and pendant edge identification (bottom) operations. Identified vertices and edges are highlighted in red. Right: Transformations of a cubic graph  . For each transformation, removed edges are highlighted in blue, vertices involved in the pendant triple contraction are highlighted in red, and vertices and edges involved in the pendant edge identification are highlighted in green. The top transformation converts
  into the Petersen snark, which is a fractal. However,
  is not fractal, since the bottom transformation converts it into 3-edge-colourable cubic graph.
The connection between fractality and class 2 graphs continues to hold for wider class of subcubic graphs (i.e. the graphs with  ). Indeed, consider a graph
  obtained from
  by removal of edges of all its triangles. Given that
  , the following theorem describes subcubic fractals:
Theorem 5.6
Let
be a subcubic connected graph with
vertices.
(1)
 is 1-fractal, if and only if it is claw-free, but contains the diamond or an odd hole.
(2)
 is 2-fractal, if and only if it contains the claw and
  is of class 2.
Proof.
First we will prove (1). By Theorem 2.1,
if and only if
is a line graph of a multigraph. Such graphs are characterized by a list of seven forbidden induced subgraphs, only one of which (
) has the maximal degree, which does not exceed 3 [12]. Therefore
if and only if
is claw-free. By Theorem 2.2,
if and only if
is a line graph of a bipartite graph. These graphs are exactly (claw,diamond,odd-hole)-free graphs [27]. By combining these facts, we get that
,
if and only if
is claw-free, but contains diamond or odd hole.
Now we will prove (2). Suppose that
contains the claw or, synonymously, some vertex of
does not belong to a triangle. In this case,
,
and therefore
is either 3- or 4-edge colourable. We will demonstrate that
if and only if
is of class 1. The necessity is obvious, so it remains to prove the sufficiency. Let
be a 3-edge colouring of
, and
be the clique cover of
with all clusters being single edges, whose colours are set by
. The cover
could be extended to the equivalent
-cover of
as follows. Given that
, there are two possible arrangements between pairs of triangles in
.
(1) There are two triangles
and
which share an edge
. Suppose also that
and
,
(it is possible that
). If, without loss of generality
, then the edges of
and
could be covered by single-edge cliques, whose colours could be set as
,
,
,
. If, say,
,
, then we may cover
and
by the cliques
,
,
with colours
,
,
.
(2) A triangle
does not share edges with other triangles. Suppose that
,
,
,
. All these vertices are distinct, and
and
do not belong to any triangles and therefore are present in
. If the colours
and
are distinct, then cover
by single-edge cliques with colours
,
,
. If, alternatively, some of these colours are identical, then there is a colour
not present among them. In this case cover
with the single clique
of the colour
.
If in the resulting cover some vertex
is covered by a single triangle
, add the single-vertex clique
with an appropriate colour
. Thus, the constructed cover is a separating equivalent
-cover of
. This concludes the proof. □
Theorem 5.6 states that subcubic 1-fractals are reducible to the diamond and odd cycles, while subcubic 2-fractals could be reduced to class 2 graphs. The next theorem will demonstrate, that cubic 2-fractals could be reduced to snarks.
Let  be a cubic graph with
 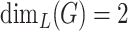 . In this case every vertex of
  has the degree
  ,
,  or
or  . Vertices of degree 1 are further referred to as pendant vertices, and edges incident to pendant vertices as pendant edges. We will establish the deeper relation between the topology of general cubic fractals and snarks. By Theorem 5.6, the case of 1-fractals is rather simple, so we will concentrate on 2-fractals. Thus, we will assume that
  contains a claw. Consider the following graph operations:
(O1) Pendant triple contraction consists in replacement of pendant vertices
 ,
,  and
and  by a single vertex
  , which is adjacent to all neighbours of
  ,
,  and
and  (Fig. 3).
(O2) Pendant edge identification of two edges
 and
and  with
with  and
and  consists in removal of
  and
and  and replacement of
  and
and  with the edge
  (Fig. 3).
Let  be the graph obtained from
  by removal of isolated vertices and edges.
  is of class 1 if and only if so is
  .
.
Lemma 5.3
Suppose that
is of class 1. Let
be its 3-edge colouring and
,
and
be the numbers of pendant edges with colours 1, 2 and 3, respectively. Then
,
,
are either all odd or all even.
Proof.
Let
, where
. For each colour
, consider
pairs of
-coloured pendant edges, identify the edges from each pair, and assign to each newly added edge the colour
. So, the resulting graph
is also of class 1, has all vertex degrees equal to 1 or 3 and contains
pendant edges of colour
.
Now consider a subgraph
of
formed by edges of colours
and
. Obviously,
is a disjoint union of even cycles and, possibly, a single path with distinctly coloured end-edges. If the path is not present, then
, otherwise
. □
Theorem 5.7
The cubic graph
is 2-fractal if and only if it contains a claw and any cubic graph obtained from
by pendant edge identifications and pendant triple contractions either has a bridge or is a snark.
Proof.
It can be easily shown that if a cubic graph has a bridge, then it is of class 2 [15]. Thus, the statement of the theorem is equivalent to the following statement: the cubic graph
, which contains a claw, is not 2-fractal if and only if it is possible to construct a cubic graph of class 1 from
by pendant edge identifications and pendant triple contractions.
To prove the necessity, suppose that
is not 2-fractal, for example, the graph
is of class 1. Consider any 3-edge colouring of
and identify pendant edges of the same colour, as described in Lemma 5.3. If after this operation all pendant edges are eliminated, then the desired graph
of class 1 is constructed. Otherwise, by Lemma 5.3
contains three pendant edges of pairwise distinct colours. Then the desired graph can be constructed by contracting the pendant end-vertices of these edges.
Conversely, suppose that the graph
of class 1 is obtained from
by pendant edge identifications and pendant triple contractions. Consider any 3-edge colouring
of
. Obviously,
could be transformed into a 3-edge colouring of
by assigning the colour
to the identified edges
and
. □
Thus, Theorem 5.7 states that the biconnected cubic graph is 2-fractal whenever any sequence of removal of triangle edges, isolated edges and vertices, pendant triple contractions and pendant edge identifications, which preserve the graph connectivity, transforms it into a snark. Figure 3 provides an example of such transformations.
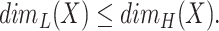
6. Network fractality and network complexity
Theorems 2.1 and 2.2 allow to interpret graph Lebesgue and Hausdorff dimensions and fractality from the information-theoretical point of view. Indeed, graphs  with
with 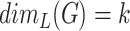 could be described by assigning to every vertex
  a set of integer ‘coordinates’ represented by hyperedges of a
  -uniform hypergraph
  such that
  . Importantly, these coordinates are non-ordered, and edges of
  are defined by a presence of a shared coordinate for their end vertices. In contrast, graphs with
  are defined by ordered vectors of coordinates (Theorem 2.2,4), and an adjacency of a pair of vertices is determined by a presence of a shared coordinate on the same position. Thus, non-fractal graphs are the graphs for which the set and vector representations are equivalent, while fractal graphs have additional structural properties that manifest themselves in extra dimensions needed to describe them using a vector representation. The whole concept is illustrated on Fig. 4.
Fig. 4.

(A) Sierpinski gasket graph  ; (B) Its optimal equivalent separating
  -cover. Clusters of the same colour are highlighted in red, green and blue. (C) Left: hypergraph
  such that
  . The edges of
  correspond to the vertices of
  , with two vertices being adjacent if and only if the corresponding edges intersect. Right: table with the corresponding unordered set coordinates encoding the graph
  . (D) Left: embedding of the graph
  into 3-dimensional space
  such that two vertices are adjacent whenever they share a coordinate. Colours highlight different clusters. Right: table with the corresponding ordered vector coordinates encoding the graph
  .
.  is a fractal, and thus the dimensionalities of encodings (C) and (D) differ.
Relations between graph dimension and information complexity could be analysed using a Kolmogorov complexity. Informally, Kolmogorov complexity of a string  could be described as a length of its shortest lossless encoding. Formally, let
  be the set of all finite binary strings and
  be a computable function. Kolmogorov complexity
  of a binary string
  with respect to
  is the minimal length of a string
  such as
  . Since Kolmogorov complexities with respect to any two functions differ by an additive constant [17], it can be assumed that some canonical function
  is fixed. For two strings
  , a conditional Kolmogorov complexity
  is a length of a shortest encoding of
  , if
, if  is known in advance.
Every connected graph  can be encoded using the string representation of an upper triangle of its adjacency matrix. Kolmogorov complexity
  of a graph
  could be defined as a Kolmogorov complexity of that string [33]. In addition, the conditional graph Kolmogorov complexity
  is often considered, which is the complexity given that the number of vertices is known. Obviously,
  and
and  . Alternatively,
  -vertex connected labelled graph can be represented as a list of edges with ends of each edge encoded using their binary representations concatenated with a binary representation of
  . It gives estimations
  ,
,  [17,33].
Let  and
and  . Then
  is an induced subgraph of a product
 |
(6.1) |
where  . Thus, by Theorem 2.2,
  and
and  could be encoded using a collection of vectors
  ,
,  ,
,  . Such encoding could be stored as a string containing binary representations of coordinates
  using
using  bits concatenated with a binary representations of
  and
and  ,
,  . The length of this string is
  . Analogously, if
  and
and  are given, then the length of encoding is
  . Thus, the following estimations hold:
Proposition 6.1
(6.2)
(6.3)


Let  . Then we have
 By minimality of the representation (6.1), we have
  . Thus
  ,
,  . So, Hausdorff (Prague) dimension could be considered as a measure of descriptive complexity of a graph.
Relations between Hausdorff (Prague) dimension and Kolmogorov complexity could be used to derive lower bound for Hausdorff dimension of a dense Erdös–Renyi random graph. Formally, let  be a graph property and
  be the set of labelled n-vertex graphs having this property. The property
  holds for almost all graphs [34], if
  as
as  , that is, the probability that the sparse Erdös–Renyi random graph
  has the property
  converges to 1 as
  . We will use the following lemma:
Lemma 6.1
[35] For every
and
, there are at least
-vertex labelled graphs
such that
.
The following theorem states that almost all sparse Erdös–Renyi graphs have large Hausdorff dimension:
Theorem 6.2
For every
, almost all sparse Erdös–Renyi graphs have Hausdorff dimension such that
(6.4) where
is a constant.

Proof.
The upper bound has been proved in [36], so we will prove the lower bound. Let
. Consider a graph
with
. From (6.3), we have
. Using the fact, that
, it is straightforward to check that
. Therefore, we have
(6.5) Let
be the set of all graphs
such that
(6.6) Using Lemma 6.1 with
, we conclude that
, and so almost all graphs have the property
.
Now, it is easy to see that for graphs with the property
and with
the inequality (6.4) holds. It follows by combining inequalities (6.5)-(6.6) and using the fact that
. □


7. Fractality and self-similarity of networks: experimental study
7.1 Calculation of Lebesgue and Hausdorff dimensions
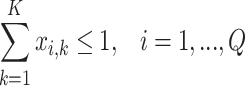
The problems of calculating Hausdorff and Lebesgue dimension of graphs are algorithmically hard. Indeed, the problem of verifying whether  is NP-complete for
  [37] (the complexity for
  is unknown). It is easy to see that the problems of checking whether
  and deciding whether a given graph is a fractal are also NP-complete. It follows from Proposition 5.3 and NP-completeness of the edge chromatic number problem for triangle-free cubic graphs [38]. Therefore, we use Integer Linear Programming (ILP) for calculation of Hausdorff and Lebesgue dimensions and detection of fractal graphs. Let us call a clique
  -cover and a separating equivalent
  -cover optimal, if
 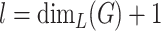 and
and 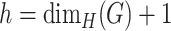 . For Lebesgue dimension, we are looking for an optimal clique cover which consists of a minimal number of clusters. For such cover, every maximal clique of
  contains at most one cluster (otherwise, we can join the clusters contained in the same clique). Using this fact, we proceed as follows. Let
  be the list of maximal cliques of
  found using Bron–Kerbosch algorithm [39]. Then, an optimal clique cover is found by solving the following ILP problem:
 |
(7.1) |
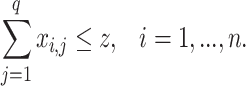 |
(7.2) |
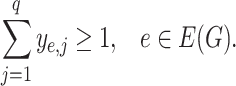 |
(7.3) |
 |
(7.4) |
 |
(7.5) |
Here,  is the variable representing the rank dimension of
  ; the binary variables
  and
and  indicate whether a vertex
  and an edge
  are covered by a cluster contained in
  ;
;  and
and  are binary constants indicating whether a corresponding vertex/edge belongs to
  and
and  . The constraints (7.2) state that every vertex is covered by at most
  cliques; the constraints (7.3) enforce the requirement that every edge is covered by at least one clique and the constraints (7.4) ensure that an edge is covered by a clique if and only if both its ends are covered by it.
As before, we assume that a given graph has no true twins. In this case, the Hausdorff dimension of the graph is found by generating the set  of all cliques of
  and solving the following ILP problem:
 |
(7.6) |
 |
(7.7) |
 |
(7.8) |
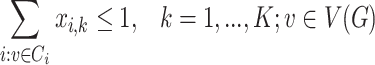 |
(7.9) |
 |
(7.10) |
Here,  is an upper bound on the Hausdorff dimension of the graph
  . The binary variable
  indicates whether the clique
  is coloured by a colour
  , and the binary variable
  indicates whether the colour
  is used; the relation between these variables is enforced by the constraints (7.7). The constraints (7.9) state that every clique receives at most one colour; it is possible that a clique does not have any colour, which means that a clique is not selected as a cluster. By the constraints (7.9), all cliques containing any given vertex
  receive different colours, and the constraints (7.10) ensure that at least one of the cliques covering any edge
  receives a colour (i.e. selected as a cluster). If the Lebesgue dimension has been previously estimated, then the calculations could be accelerated by removal from
  of all cliques that intersect at most
  other cliques.
For all networks described below, Lebesgue and Hausdorff dimensions were calculated using Gurobi 8.1.1.
7.2 Network models
Three common models have been considered: preferential attachment, Erdös–Renyi and Watts–Strogatz. For each model, 1350 networks with 20–150 vertices have been generated using MIT Matlab Toolbox for Network Analysis [40]. For a given network size, the model parameters were selected in a way resulting in the same network density for all three models.
For preferential attachment and Erdös–Renyi networks, their average Hausdorff dimensions grew as  (
( ) and
) and  (
( ), respectively, just as suggested by the estimations in Section 5 (Fig. 5). Hausdorff dimension of Watts–Strogatz networks showed the behaviour similar to that of the latter (
 ). Importantly, none of the analysed preferential attachment and Erdös–Renyi networks were fractal. In contrast, Watts–Strogatz fractal networks have been observed, although their proportion exponentially decreases with the growth of
  (Fig. 5). It suggests, that for the analysed models the network fractality is rare. It is known that almost all graphs (in the sense of Erdös–Renyi graphs
  ) are of class 1 [34]. Thus graph fractality inherits the asymptotic behaviour of edge colourings dichotomy.
Fig. 5.

Top: expected Hausdorff dimensions for Preferential Attachment (left), Erdös-Renyi (center) and Watts-Strogatz (right) networks. Bottom: (left) observed frequency of fractal networks for Wattz-Strogatz model; (right): distributions of normalized Hausdorff dimensions for genetic networks of recent and persistent intra-host HCV populations.
7.2 Real networks with known communities
To calculate Lebesgue and Hausdorff dimensions of a graph  , it is required to find the sets of communities of
  representing clusters of its optimal
  -cover and equivalent separating
  -cover. If the communities
  are known in advance, we may consider restricted Lebesgue dimension
  and restricted Hausdorff dimension
  with respect to these communities that can be defined as follows: given a hypergraph
  with all twin vertices removed,
  and
and  .
.
We calculated the restricted dimensions of eight real-life networks with known ground-truth communities from Stanford Large Network Dataset [41]. To calculate Hausdorff dimensions, the standard ILP formulation for the Vertex Colouring problem has been utilized. If the solver was not able to handle the full community dataset, we analysed 5000 communities of highest quality provided by the database’s curators. Three out of eight networks have been found to be fractal. It is significantly higher proportion than suggested by the analysis of network models above, thus suggesting that for real networks the fractality is more prevalent.
7.4 Viral genetic networks
For a given biological population, the vertices of its genetic network [42] are genomes of the members of the population, and two vertices are adjacent if and only if the corresponding genomes are genetically close. Genetic network represents a snapshot of the mutational landscape of the population, whose structure is shaped by selection pressures, epistatic interactions and other evolutionary factors [43].
RNA viruses exist in infected hosts as highly heterogeneous populations of genomic variants or quasispecies. Recently, indications of self-similarity in quasispecies genetic networks were found (D.S. Campo, personal communication). We investigated this phenomenon using the proposed theoretical framework. We considered genetic networks of intra-host Hepatitis C (HCV) populations of  infected individuals at early (
 ) and persistent (
 ) stages of infection [44]. The networks were constructed using high-throughput sequencing data of HCV Hypervariable Region 1 (HVR1), with two HVR1 sequences being adjacent, if they differ by a single mutation. For each network, the dimensions of the largest connected component has been calculated with the time limit of
  s. Solutions have been obtained for
  networks with
  vertices in average.
The normalized Hausdorff dimensions  of networks of persistent populations was found to be significantly lower than for recent populations (
 , Kruskal–Wallis test, Fig. 5), thus indicating significantly higher level of their self-similarity. This finding is biologically significant. Indeed, one of fundamental questions in the study of pathogens is the role of different evolutionary mechanisms in the infection progression. For HCV, the standard assumption, that the major driving force of intra-host viral evolution is the continuous immune escape, has been put into question by the series of observations that suggest high level of intra-host viral adaptation [42,45]. Increase in self-similarity of HCV genetic networks implies the gradual self-organization of viral populations and emergence of structural patterns in population composition and points to the presence of a dynamical mechanism of their formation at later stages of infection, which may be associated with the higher level of adaptation and specialization of viral variants. Thus, it supports the adaptation hypothesis and is consistent with the recently proposed models of viral antigenic cooperation [46,47], which suggests the emergence of complementary specialization of viral variants and their adaptation to the host environment as a quasi-social system.
8. Conclusions
We presented a theoretical framework for study of fractal properties of networks, which is based on the combinatorial and graph-theoretical notions and methods. We anticipate that the proposed framework could be useful for theoretical studies of properties of network models as well as for analysis of experimental networks which arise in biology, epidemiology and social sciences. In particular, this study has been triggered by biological questions raised by studies of genetic and cross-immunoreactivity networks of RNA viruses, such as HIV and Hepatitis C [42,47].
We would like to emphasize that combinatorial Lebesgue and Hausdorff dimensions described in this article should not be considered as approximations of their previously studied variants based on box-counting approach. The reason is that they are based on different theoretical frameworks and reflect different network features. One of the goals of this article was to demonstrate that for finite graphs the combinatorial framework is more appropriate than the straightforward translation of continuous definitions, especially when we are interested in studying graph fractality. Our major arguments in favour of this claim could be summarized as follows:
-
Box-counting definition of a fractal dimension involves a limit transition. Therefore strictly speaking it is applicable to graph sequences rather than individual graphs. This makes the reliable estimation of box-counting dimensions of real networks problematic, because their intrinsic finiteness and discreteness prevents the accumulation of a sufficient number of data points to get reliable finite approximations of continuous functions—the fact previously noted in the literature [48,49]. In particular, this applies to biological networks studied in this article. In contrast, we define a fractal dimension as a combinatorial parameter that can be calculated for any finite graph without the need for approximation.
The conventional topological graph dimension is 1, while the box-counting dimension is usually greater than 1. This makes almost all graphs fractal in terms of Mandelbrot’s definition. Such understanding of fractality is not practically useful. In contrast, the combinatorial definition allows only some graphs to be fractal, and lead to substantial and deep structural properties distinguishing fractal graphs from non-fractal graphs.
The properties of combinatorial Lebesgue dimension, Hausdorff dimension and fractality of graphs very well agree with the properties of the corresponding notions from general topology: they are naturally related to structural self-similarity of graphs, representations of graph as measurable spaces and by set systems, as well as their descriptive complexity as information systems. To the best of our knowledge, few such connections have been established for box-counting definitions.
Combinatorial approach approach is also practically useful and reflect the properties of real systems, as demonstrated by the example with viral genetic networks.
All of the above do not mean that combinatorial dimension and box-counting dimension have nothing in common. On the contrary, the example of Sierpinski gasket graph demonstrate that these notions agree with each other, when the scheme for construction of the continuous fractal is essentially combinatorial. In that case, for example, the combinatorial Hausdorff dimension is obtained by rounding of the continuous dimension. We expect that more such examples will be found in the future.
The ideas presented in this article may facilitate study of properties of networks using convergent machineries of graph theory, general topology, algorithmic information theory and discrete optimization. Furthermore, the problems of detection of fractal properties could be now formulated and studied as rigorously defined algorithmic problems. One such problem is the detection of fractal graphs, another—calculation of invariants measuring how close is the given graph from being a fractal (in terms of number of edges or certain modification operations). It should be noted, however, that these problems are likely to be algorithmically hard since, as discussed above, the fractality recognition problem is NP-complete. Thus, approximation algorithms and heuristics for these problems should be developed, and the graph classes where the problems become polynomially solvable should be identified. Another important direction of future research is a deeper understanding of structural properties of graph fractals in general and in particular graph classes, as well as identification of network construction models which produce fractals. In particular, our results suggest that fractality is more common for real-life networks than can be concluded from analysis of standard network models.
Supplementary Material
Acknowledgements
The authors thank David S. Campo and Yury Khudyakov (CDC) for useful discussions of the biological relevance of obtained results.
Footnotes
1Thus the name of this graph class introduced by Gardner [16].
Contributor Information
Pavel Skums, Department of Computer Science, Georgia State University, 1 Park Pl NE, Atlanta, GA 30303, USA.
Leonid Bunimovich, School of Mathematics, Georgia Institute of Technology, 686 Cherry St NW, Atlanta, GA 30313, USA.
Supplementary data
Supplementary data are available at COMNET online.
Funding
The National Institutes of Health (1R01EB025022) ‘Viral Evolution and Spread of Infectious Diseases in Complex Networks: Big Data Analysis and Modeling’.
References
- 1. Falconer, K. (2004) Fractal Geometry: Mathematical Foundations and Applications. Chichester, England: Wiley. [Google Scholar]
- 2. Dorogovtsev, S. N. & Mendes, J. F. (2013) Evolution of Networks: From Biological Nets to the Internet and WWW. Oxford: OUP. [Google Scholar]
- 3. Newman, M. E. (2003) The structure and function of complex networks. SIAM Rev., 45, 167–256. [Google Scholar]
- 4. Shanker, O. (2007) Defining dimension of a complex network. Mod. Phys. Lett. B, 21, 321–326. [Google Scholar]
- 5. Song, C., Havlin, S. & Makse, H. A. (2005) Self-similarity of complex networks. Nature, 433, 392–395. [DOI] [PubMed] [Google Scholar]
- 6. Li, L., Alderson, D., Doyle, J. C. & Willinger, W. (2005) Towards a theory of scale-free graphs: definition, properties, and implications. Internet Math., 2, 431–523. [Google Scholar]
- 7. Willinger, W., Alderson, D. & Doyle, J. C. (2009) Mathematics and the internet: a source of enormous confusion and great potential. Notices Am. Math. Soc., 56, 586–599. [Google Scholar]
- 8. Evako, A. V. (1994) Dimension on discrete spaces. Int. J. Theor. Phys., 33, 1553–1568. [Google Scholar]
- 9. Smyth, M. B., Tsaur, R. & Stewart, I. (2010) Topological graph dimension. Discrete Math., 310, 325–329. [Google Scholar]
- 10. Ahn, Y.-Y., Bagrow, J. P. & Lehmann, S. (2010) Link communities reveal multiscale complexity in networks. Nature, 466, 761–. [DOI] [PubMed] [Google Scholar]
- 11. Palla, G., Derényi, I., Farkas, I. & Vicsek, T. (2005) Uncovering the overlapping community structure of complex networks in nature and society. Nature, 435, 814–. [DOI] [PubMed] [Google Scholar]
- 12. Berge, C. (1984) Hypergraphs: Combinatorics of Finite Sets, vol. 45. Amsterdam, The Netherlands: Elsevier. [Google Scholar]
- 13. Hell, P. & Nešetril, J. (2004) Graphs and Homomorphisms, vol. 28. Oxford Lecture Series in Mathematics and its Applications. Oxford, UK: Oxford University Press. [Google Scholar]
- 14. Vizing, V. G. (1964) On an estimate of the chromatic class of a p-graph. Discret Analiz, 3, 25–30. [Google Scholar]
- 15. Chladnỳ, M. & Škoviera, M. (2010) Factorisation of snarks. Electron. J. Combin., 17, 32–. [Google Scholar]
- 16. Gardner, M. (1977) Mathematical games. Sci. Am., 236, 121–127. [Google Scholar]
- 17. Li, M. & Vitànyi, P. (2009) An Introduction to Kolmogorov Complexity and Its Applications. New York, NY: Springer Science & Business Media. [Google Scholar]
- 18. Edgar, G. (2007) Measure, Topology, and Fractal Geometry. New York, NY: Springer Science & Business Media. [Google Scholar]
- 19. Metelsky, Y. & Tyshkevich, R. (2003) Line graphs of Helly hypergraphs. SIAM J. Discrete Math., 16, 438–448. [Google Scholar]
- 20. Alon, N. (1986) Covering graphs by the minimum number of equivalence relations. Combinatorica, 6, 201–206. [Google Scholar]
- 21. Tyshkevich, R. (1989) Matroid decompositions of graphs. Discretnaya Matematika, 1, 129–138. [Google Scholar]
- 22. Babaitsev, A. & Tyshkevich, R. (1996) K-dimensional graphs (in Russian). Vestnik Akademii nauk Belarusi, 75–81. [Google Scholar]
- 23. Klavžar, S., Peterin, I. & Zemljič, S. S. (2013) Hamming dimension of a graph—. The case of Sierpiński graphs. Eur. J. Combin., 34, 460–473. [Google Scholar]
- 24. König, D. (1916) Über graphen und ihre anwendung auf determinantentheorie und mengenlehre. Math. Ann., 77, 453–465. [Google Scholar]
- 25. Chung, F. & Lu, L. (2002) Connected components in random graphs with given expected degree sequences. Ann. Combin., 6, 125–145. [Google Scholar]
- 26. Janson, S., Łuczak, T. & Norros, I. (2010) Large cliques in a power-law random graph. J. Appl. Prob., 47, 1124–1135. [Google Scholar]
- 27. Brandstädt, A., Le, V. B. & Spinrad, J. P. (1999) Graph Classes: A Survey. Philadelphia, PA: SIAM. [Google Scholar]
- 28. Bollobàs, B. & Riordan, O. M. (2003) Mathematical results on scale-free random graphs. Handbook of Graphs and Networks: From the Genome to the Internet (Bornholdt Stefan and Schuster Hans Georg eds), Weinheim, Germany: Wiley-VCH, pp. 1–34. [Google Scholar]
- 29. Flaxman, A., Frieze, A. & Fenner, T. (2005) High degree vertices and eigenvalues in the preferential attachment graph. Internet Math., 2, 1–19. [Google Scholar]
- 30. Bollobàs, B. (2001) Random Graphs, vol. 73. Cambridge, UK: Cambridge University Press. [Google Scholar]
- 31. McDiarmid, C. & Skerman, F. (2017) Modularity of regular and treelike graphs. J. Complex Netw., 6, 596–619. [Google Scholar]
- 32. Woodhouse, F. G., Forrow, A., Fawcett, J. B. & Dunkel, J. (2016) Stochastic cycle selection in active flow networks. Proc. Natl. Acad. Sci. USA, 113, 8200–8205. [DOI] [PMC free article] [PubMed] [Google Scholar]
- 33. Mowshowitz, A. & Dehmer, M. (2012) Entropy and the complexity of graphs revisited. Entropy, 14, 559–570. [Google Scholar]
- 34. Erdős, P. & Wilson, R. J. (1977) On the chromatic index of almost all graphs. J. Combin. Theory B, 23, 255–257. [Google Scholar]
- 35. Buhrman, H., Li, M., Tromp, J. & Vitànyi, P. (1999) Kolmogorov random graphs and the incompressibility method. SIAM J. Comput., 29, 590–599. [Google Scholar]
- 36. Cooper, J. R. (2010) Product dimension of a random graph. PhD Thesis, Miami University. [Google Scholar]
- 37. Poljak, S., Rödl, V. & Turzik, D. (1981) Complexity of representation of graphs by set systems. Discrete Appl. Math., 3, 301–312. [Google Scholar]
- 38. Holyer, I. (1981) The NP-completeness of edge-coloring. SIAM J. Comput., 10, 718–720. [Google Scholar]
- 39. Bron, C. & Kerbosch, J. (1973) Algorithm 457: finding all cliques of an undirected graph. Commun. ACM, 16, 575–577. [Google Scholar]
- 40. Bounova, G. & De Weck, O. (2012) Overview of metrics and their correlation patterns for multiple-metric topology analysis on heterogeneous graph ensembles. Phys. Rev. E, 85, 016117–. [DOI] [PubMed] [Google Scholar]
- 41. Leskovec, J. & Krevl, A. (2014) SNAP Datasets: Stanford Large Network Dataset Collection. http://snap.stanford.edu/data. [Google Scholar]
- 42. Campo, D. S., Dimitrova, Z., Yamasaki, L., Skums, P., Lau, D. T., Vaughan, G., Forbi, J. C., Teo, C.-G. & Khudyakov, Y. (2014) Next-generation sequencing reveals large connected networks of intra-host HCV variants. BMC Genomics, 15, S4. [DOI] [PMC free article] [PubMed] [Google Scholar]
- 43. Schaper, S., Johnston, I. G. & Louis, A. A. (2011) Epistasis can lead to fragmented neutral spaces and contingency in evolution. Proc. R. Soc. B, 279, 1777–1783. [DOI] [PMC free article] [PubMed] [Google Scholar]
- 44. Lara, J., Teka, M. & Khudyakov, Y. (2017) Identification of recent cases of hepatitis C virus infection using physical-chemical properties of hypervariable region 1 and a radial basis function neural network classifier. BMC Genomics, 18, 880–. [DOI] [PMC free article] [PubMed] [Google Scholar]
- 45. Gismondi, M. I., Carrasco, J. M. D., Valva, P., Becker, P. D., Guzmàn, C. A., Campos, R. H. & Preciado, M. V. (2013) Dynamic changes in viral population structure and compartmentalization during chronic hepatitis C virus infection in children. Virology, 447, 187–196. [DOI] [PubMed] [Google Scholar]
- 46. Domingo-Calap, P., Segredo-Otero, E., Duràn-Moreno, M. & Sanjuàn, R. (2019) Social evolution of innate immunity evasion in a virus. Nat. Microbiol., 4, 1006–. [DOI] [PMC free article] [PubMed] [Google Scholar]
- 47. Skums, P., Bunimovich, L. & Khudyakov, Y. (2015) Antigenic cooperation among intrahost HCV variants organized into a complex network of cross-immunoreactivity. Proc. Natl. Acad. Sci. USA, 112, 6653–6658. [DOI] [PMC free article] [PubMed] [Google Scholar]
- 48. Song, C., Gallos, L.K., Havlin, S. and Makse, H.A. (2007) How to calculate the fractal dimension of a complex network: the box covering algorithm. J. Stat. Mech. Theory Exp., 2007, P03006. [Google Scholar]
- 49. Xu, Y., Gurfinkel, A.J. and Rikvold, P.A. (2014) Architecture of the Florida power grid as a complex network. Physica A, 401, 130-140. [Google Scholar]
- 50. Babai, L. & Frankl, P. (1992) Linear Algebra Methods in Combinatorics with Applications to Geometry and Computer Science. Chicago, IL: Department of Computer Science, The University of Chicago. [Google Scholar]
Associated Data
This section collects any data citations, data availability statements, or supplementary materials included in this article.