

Abstract
The outbreak of COVID‐19 has weakened the economy of Australia and its capital market since early 2020. The overall stock market has declined. However, some sectors become highly vulnerable while others continue to perform well even in the crisis period. Given this new reality, we seek to investigate the initial volatility and the sectoral return. In this study, we analyse data for eight sectors such as, transportation, pharmaceuticals, healthcare, energy, food, real estate, telecommunications and technology of the Australian stock market. In doing so, we obtain data from Australian Securities Exchange (ASX) and analysed them based on ‘Event Study’ method. Here, we use the 10‐days window for the event of official announcement of the COVID‐19 outbreak in Australia on 27 February 2020. The findings of the study show that on the day of announcement, the indices for food, pharmaceuticals and healthcare exhibit impressive positive returns. Following the announcement, the telecommunications, pharmaceuticals and healthcare sectors exhibit good performance, while poor performance is demonstrated by the transportation industry. The findings are vital for investors, market participants, companies, private and public policymakers and governments to develop recovery action plans for vulnerable sectors and enable investors to regain their confidence to make better investment decisions.
Keywords: abnormal returns, Australian Securities Exchange (ASX), coronavirus, COVID‐19, event study, stock indices
1. INTRODUCTION
Due to COVID‐19, the world's stock markets tumbled virtually everywhere and in all major economies. Since the outbreak of this pandemic, only a very few studies have been done to understand its impact on the economy of Australia. Although there is generally a negative relationship between new cases of infection and stock returns (Al‐Awadhi, 2020), the severity of the outbreak varies from country to country. Moreover, coronavirus has already reduced investors' confidence in the stock market due to increased uncertainties (Liu, Manzoor, Wang, Zhang & Manzoor, 2020) that coloured past experiences (Anusakumar, Ali & Hooy, 2017; Fan, 2003).
Due to movement control orders, transportation industry as well as energy industry lose huge revenue. Except some emergency cases, all types of transportation usage are completely shut down. Same scenario emerges for all other types of industries that causes massive decline of energy demand. The food industry is dealing with the challenges and opportunities of COVID‐19 quite well. The closing down of many restaurants disturbs the supply chains of food items from the production fields to the retail stores and consumers. Due to panic buy, supermarkets and grocery stores did quite well in terms of volume of revenue and profits. Many technology companies stop doing business because of shipment delays in electronic goods and in the real estate industry. However, COVID‐19 causes to increase the demand for medical equipment and medicine which leads to more revenue for pharmaceuticals and healthcare companies. Similarly, the revenue of telecommunications industry also boosts up due to high demand of Internet for Online based activities such as remote learning, remote office and so on. Air pollution increases the risk of COVID‐19 infection, so the demand for the use of masks and alcohol‐based standard sterilisers demonstrate record growth in demand (Paital, 2020), resulting in huge increases in sales of masks and alcohol‐based standard sterilisers. Therefore, we choose to examine the short‐term fluctuations of the Australian stock market and check its sectoral performance.
To understand the short‐term impacts of COVID‐19 on different sectors of the stock market, this study analyses the influence of the official announcement of the COVID‐19 outbreak on the Australian stock market. Its findings are expected to help investors, business managements, capital market regulatory bodies, and government to better understand the short‐term fluctuations and performance of selected industry sectors and help them make better decisions about the future impacts and restoring market sentiment despite the CODIV‐19 outbreak.
This study selects the Australian economy as its sample because Australia is one of the developed countries which has controlled the epidemic very well (Figure 1) in comparison to other developed nations (Wyeth, 2020). However, its market still remains affected like those of the other developed countries. Its stock market experiences a great loss about a 21.67% pull back (Figure 2) and relatively a very high volatility of daily returns (Table 1). Therefore, the Australian market is not so highly impacted by COVID‐19 infections as it has been observed in other markets. Thus, it could generate interesting insights into investors' behaviours during the COVID‐19 crisis.
FIGURE 1.

Daily new confirmed cases and total confirmed cases of COVID‐19 in Australia. Data Source: ourworldindata.org [Color figure can be viewed at wileyonlinelibrary.com]
FIGURE 2.

Return of stock markets indices from January to April 2020 during the COVID‐19 period. Data Source: ourworldindata.org [Color figure can be viewed at wileyonlinelibrary.com]
TABLE 1.
Standard deviation of daily returns for a few market indices from 02 January to 7 May 2020
| S&P_ASX300 | DAX | FTSE100 | S&P500 | Shanghai composite | Nikkei 225 | |
|---|---|---|---|---|---|---|
| SD of daily return | 0.027442 | 0.028386 | 0.025610 | 0.033112 | 0.015264 | 0.022598 |
2. LITERATURE REVIEW
2.1. Impacts of the pandemic on the transportation industry
In the wake of globalisation, transportation has boomed over the last few decades. In 2003, SARS created a huge impact on this industry. Loh (2006) finds that airlines listed in Canada, China, Hong Kong, Singapore and Thailand are more sensitive to SARS news than non‐airline stocks, and that the negative effects of SARS on equities increase volatility rather than lower average returns. They also find that airline stocks tend to be ‘aggressive’ after the SARS outbreak. For example, Harbison (2003) points out that during the SARS outbreak, when it peaks in March 2003, the number of passenger traffic declines by 5.6%, forcing some airlines operating in the Asia‐Pacific region to delay orders and to downsize the number of staff with a view to minimising the cost of service. A declining trend in profit making for airlines operation in the region and a sharp fall in the quality of international service have been cited in some newspapers. Wang (2013) tests the link between international events and international airline stocks return from 1996 to 2010, proving that major international events may have a risk impact on airlines' share price earnings.
Borenstein and Zimmerman (1988) use Capital Asset Pricing Model to examine the influence of 74 air accidents on the aviation industry in the United States from the 1960s to 1985. The result shows that an aviation accident has a negative effect on the income growth. Flouris and Walker (2007) analyses two Canadian airlines' accounts and stock price performance, and discuss the effect of the 9/11 attacks on the aviation industry. Their findings show that low operating costs, high consumer confidence, products, organisational structure and execution of projects are major factors leading to effective risk reduction. Kim and Gu (2004) measure the impact of the 9/11 terrorist attacks on the returns and uncertainties of airline stocks on the stock market. The results show that while the average weekly return on airline stocks does not change dramatically after 9/11, there has been a substantial rise in the systemic risk and overall value of airline stocks. According to research by Sparaco (2001) in the 5 weeks after the terrorist attacks, passenger traffic of European airlines declines by 36.2%, forcing them to cut 30,000 jobs. Barnard (2002) estimates the 9/11 attacks directly costing European airlines more than $3 billion.
Comparing the performance of North American and European airlines' stock portfolios, Sato (2013) finds that the global financial crisis of 2008–2009 has a major effect on the North American market compared to the European one. The fluctuation in aviation market is the result of both internal and external factors, and the development of financial instruments plays an important role on the liquidity dependence of investment. SARS outbreak in 2003 had a major impact on international air transport, bus transport, subway transport and cargo transport by air in Beijing (Beutels et al. 2009). Likewise, movement control orders in many countries also hit the transportation industry caused by the high infections of COVID‐19. Sobieralski (2020) explains that due to COVID‐19, travel restrictions are made and that leads to global incapacity in the airlines sector.
2.2. Impacts of the pandemic on the pharmaceutical and healthcare industry
In the face of the SARS crisis, Taiwan biotech's stock returns take a positive turn. Chen, Chen, Tang and Huang (2009) argue that during the SARS epidemic in Taiwan, demand for medical and healthcare equipment increases significantly. Moreover, these products are the main output of the biotechnology industry, so their share prices are bound to rise. Jingwen (2005) investigates the link between SARS information disclosure and market sensitivity among listed companies in China's pharmaceutical industry. They find that when the SARS outbreak disclosure is not significant, stock performance in the pharmaceutical industry is not significant. However, when SARS information is significantly disclosed, the market reaction of listed companies in the pharmaceutical industry is significantly positive. These results suggest that Chinese investors may wield a significant effect. Al‐Awadhi, Al‐Saifi, Al‐Awadhi and Alhamadi (2020) shows that during the COVID‐19 outbreak in China, technology and pharmaceuticals outperform compared to other sectors in the stock market.
The high barriers that hinder the development of new vaccines have the potential to be monopolistic. As vaccine development is much more complex and technologically advanced than that of the production of medicinal products, it is not possible to produce a universal vaccine (Hinman, Orenstein, Santoli, Rodewald & Cochi, 2006). This leads to an increase in vaccine shortages, particularly for U‐vaccines (Hinman et al., 2006). Thus, with the increase in medical subsidies, the emergence of dangerous diseases globally may be regarded as a potential market for vaccine manufacturers. Furthermore, Lee and McKibbin (2004) and Smith, Yago, Millar and Coast (2005) assert that the impact of SARS and antimicrobial resistance on the non‐health industries is greater than those on the healthcare sector.
2.3. Impacts of the pandemic on the energy industry
The international energy industry has not remained stable during this period, for example, WTI crude price does down for the first time in history. Maijama'a, Musa, Garba and Baba (2020) suggest that the total population is positively linked with the total number of corona virus cases, while the price of crude oil corresponds negatively to the overall number of cases of corona virus. Broadstock, Cao and Zhang (2012) believe that Chinese stock investors, especially those in the energy sector, are more sensitive to price fluctuations in the international crude oil market, because the sudden rise in oil prices will increase the returns on investments which is also linked with energy. In the pre‐crisis period, stock market performance of oil and gas are greatly impacted by oil price shifts (Reboredo & Rivera‐Castro, 2014). A rise in the demand or in the price of oil will increase the return on Canadian oil and gas stocks (Perry, 2001).
2.4. Impacts of the pandemic on the food industry
Control orders of people's movement issued by governments of many countries have led to the closure of restaurants and bars in a bid to slow the spread of the virus, which affect food industry globally. Furthermore, the closure of the restaurant industry has caused a chain reaction in food production, alcohol, wine, beer production, food and beverage transportation, fisheries, agriculture and other related industries. The results show that positive (negative) events caused by direct actions within the company lead to higher (lower) expected returns, while events related to third‐party opinions lead to less change in expected returns within the short‐term event window (Deak & Karali, 2014).
2.5. Impacts of the pandemic on the real estate industry
The global economic slowdown significantly affects the demand for real estate industry. In this context, possible wage cuts would also have a significant impact on demand for housing and commercial projects. Moreover, demand will be squeezed as people try to hold on to their cash to meet daily needs. Secondly, the movement of workers engaged in construction activities and the lack of access to inputs during the blockade will also lead to delay in housing projects. As new equity investment slows, property companies will struggle to get funding. Therefore, the impact of corona virus on the real estate industry should not be underestimated. In India, the real estate agency NAREDCO (National Real Estate Development Council) estimates that the industry will suffer a loss of Rs. 100,000 crore due to COVID‐19 and property prices will fall by 10–15% (Chopra, 2020). However, Wong (2008) finds that the housing market in Hong Kong does not overreact during the SARS crisis.
2.6. Impacts of the pandemic on the telecommunications and technology industry
With the spread of the pandemic, global conferences and activities are being cancelled or postponed. Over the whole period, the telecommunications industry does relatively well, as the demand for services supporting work at home skyrockets (Ramelli & Wagner, 2020). The technology industry may face the problems of delay to shipments of electronic goods and because of movement control regulations. Many technology companies have to stop doing business. In addition to the significant loss of human life caused by the pandemic, COVID‐19 is expected to wield a huge and long‐term impact on biometrics companies and related technology developers and markets (Carlaw, 2020).
3. METHODOLOGY
3.1. Data and sampling
The Australian government announces the outbreak of the epidemic on 27 February 2020 (Prime Minister of Australia, 2020). This study considers a 10‐day window for data analysis and calculates the return for 10 working days before and 10 working days after the announcement of event data. This study uses the Australian stock exchange as its sample based on the indices of eight industries, these are transportation, pharmaceuticals, healthcare, energy, food, real estate, telecommunications and technology. It does so in order to assess the impact of COVID‐19 outbreak on the performance of these sectors because these sectors are highly vulnerable and demonstrate high volatility at the time of previous pandemic events (Table 2). The stock data are collected from the investing.com website.
TABLE 2.
Description of data sampling
| Sector | Australian market and industry index name |
|---|---|
| Market index | S&P/ASX 300 |
| Transportation | S&P/ASX 300 transportation |
| Pharmaceutical | S&P/ASX 300 Pharmaceuticals & Biotechnology |
| Healthcare | S&P/ASX 300 Healthcare |
| Energy | S&P/ASX 300 Energy Industry |
| Food | S&P/ASX 300 Food Beverage & Tobacco |
| Real estate | S&P/ASX 300 Real Estate |
| Telecommunications | S&P/ASX 300 Telecommunication Services Industry |
| Technology | S&P/ASX 300 Information Technology |
3.2. Method of analysis
This study relies on the Event Study method to analyse data. An event study is an empirical statistical method for investigating the relationship between stock prices and economic events (Dyckman, Philbrick & Stephan, 1984). Stankeviciene and Akelaitis (2014) provide valuable evidences on how stock prices react to public announcements. Event Study may reveal how a stock market could be sensitive to a particular event. In their case studies of events, Campbell and Lo (1997) and Brown and Warner (1985) suggest using 120 days prior to the event date as the estimated period, which is sufficient to form a baseline of normal returns.
Hence, this report uses an estimation window of 120 days and a 10‐day event window. Here, the Day 0 refers to the announcement of the Corona virus pandemic in Australia, on 27 February 2020. Figure 3 immediately below illustrates the timeline for event study.
FIGURE 3.
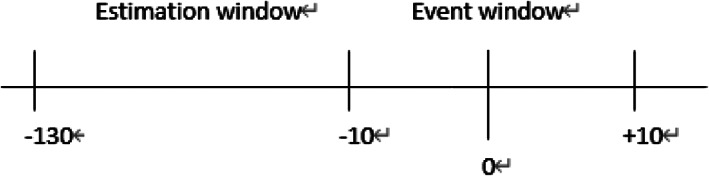
Event study timeline
Abnormal return, the difference between the actual return and the expected return during the test period, can test the effects of a given event. Firstly, the daily return of each security price is calculated through the estimation window and the event window, and the formula is as follows:
| (1) |
where R 𝑡 = stock daily returns on t day, P t = stock closing price on t day and P t−1 = stock closing price on t−1 day.
The expected return for the Event Study is calculated based on a simple regression, in which the parameters are identified in the estimation window. As a statistical model, a market model relates return to shares to market index returns. In this study, a simple regression is conducted by using stock returns and market return. The market model is written below:
| (2) |
where E(R) t = expected return on stock for day t, α = intercept of the regression equation, β = stock's Beta value (slope) and R ASX = return on ASX index for day t.
Abnormal return (AR) is also used in an Event analysis to measure the impacts of an Event. The AR of a stock is given as equation at time t,
| (3) |
where AR t = the abnormal return for day t, R t = actual return on stock for day t and E(R) t = expected return on stock for day t.
In most Event studies, abnormal returns are accumulated in a given period. This may adjust uncertainties about the date of the event or capture the influence of the event on the stock price. In the given period, cumulative abnormal return (CAR) for a stock across the event period is calculated in the following way:
| (4) |
Then, the average CAR across all the observations in the given time is shown as,
| (5) |
A test statistic is a measure of the likelihood that the actual value of the parameter is not zero. Therefore, employing statistical hypothesis for significance, this study finds that the t‐statistic is larger than the critical value, meaning that the results are significant. The equation is shown below:
| (6) |
where t CAR = test statistic of cumulative abnormal return, it = the CAR for each category, σ CAR = the standard deviation of the CAR and n = number of observations.
4. RESULTS AND FINDINGS
The AR of eight industry indices in the event period of −10 to 10, as well as their significant level are documented in Table 3. Before the announcement of the coronavirus epidemic, the index for healthcare and pharmaceuticals, as well as the telecommunications index, show a significantly positive AR in Day −6 and Day −3, respectively, while there is negative AR on technology index from Day −6 to Day −5.
TABLE 3.
Abnormal return in the event window (−10, 10)
| Event day | Energy | Food | Healthcare | Pharmaceuticals | Real estate | Telecommunications | Transportation | Technology |
|---|---|---|---|---|---|---|---|---|
| −10 | 0.36% | −2.31% | −0.13% | 0.33% | 0.83% | −1.00% | 0.37% | 0.22% |
| −9 | −1.58% | −0.12% | −0.24% | −0.54% | −0.34% | −0.22% | 0.13% | −1.03% |
| −8 | 0.81% | 1.04% | 0.25% | 0.28% | 1.67% | −1.05% | −1.15% | 1.22% |
| −7 | −0.79% | 0.48% | −0.61% | −0.40% | −0.66% | 0.39% | −0.25% | −1.06% |
| −6 | 0.52% | 1.18% | 2.18%** | 2.18%** | −2.62% | 0.37% | 0.58% | −3.35%** |
| −5 | −0.04% | 2.12% | −1.23% | −1.21% | −1.53% | 0.73% | −0.18% | −2.16%** |
| −4 | −0.59% | −0.88% | −0.62% | −0.47% | −0.04% | −0.70% | 0.12% | −0.36% |
| −3 | −1.30% | −0.96% | −0.47% | −0.73% | −1.94% | 1.71%** | −0.46% | −1.22% |
| −2 | −0.40% | −0.20% | 0.90% | 1.29% | 1.16% | −0.64% | −0.12% | 1.53% |
| −1 | 0.32% | 0.95% | −1.04% | −1.48% | −1.69% | 0.12% | −0.21% | −0.92% |
| 0 | −1.12% | 3.16%** | 1.99%** | 2.86%** | −0.90% | −0.73% | 0.14% | −0.98% |
| 1 | 0.69% | 1.17% | 1.01% | 1.20% | −1.95% | 3.21%** | 0.28% | −0.66% |
| 2 | 2.15%** | 1.04% | 0.00% | −0.29% | 1.59% | 0.82% | 0.12% | 1.51% |
| 3 | −1.05% | 1.90% | 1.51%** | 1.16% | 2.51% | 1.24% | 0.36% | 1.63% |
| 4 | −0.56% | 0.25% | −0.42% | −0.18% | −2.36% | 1.52% | 1.18% | −1.93%** |
| 5 | −0.64% | 0.35% | 1.26%** | 1.86%** | 1.06% | 1.31% | −1.50%** | −0.03% |
| 6 | 0.24% | 1.98% | 2.22%** | 2.45%** | −1.77% | 3.25%** | 0.11% | −0.74% |
| 7 | −11.7%** | 1.66% | 2.85%** | 2.87%** | −3.57% | 5.73%** | 1.50%** | −0.09% |
| 8 | −0.11% | 1.02% | 0.02% | 0.49% | 2.75% | −2.58%** | −2.95%** | 0.60% |
| 9 | 0.73% | 0.91% | 1.82%** | 2.40%** | −0.37% | 1.19% | −0.67% | 1.09% |
| 10 | 0.29% | 2.80%** | 1.34%** | 1.21% | −1.78% | 0.44% | −1.63%** | 1.70% |
Note: ‘**’ means significance at the 5% level.
After the announcement, almost every sector reveals a significant reaction in the stock markets, except the real estate sector, which did not show any significant AR within event window, implying that real estate is not affected in the short‐term, but it may be impacted in the long term.
The energy sector index does not exhibit significant average abnormal returns before and at the event date, but it has significant AR with 2.15% at Day 2, and −11.70% at Day 7. The greatly negative AR on Day 7 may also be due to the negative impact of two things: the oil price war between Saudi and Russia and low global demand for oil.
The transportation sector index does not exhibit significant average abnormal returns before and at the Event date, but it has significant AR with −1.5% at Day 5, 1.5% at Day 7, −2.95% at Day 8 and −1.63% at Day 10. The negative performance is due to transportation firms losing one of the main profit sources, due to the great decline in passenger flow.
The technology index has negative AR at a significant level, specifically −3.35% at Day 5, −2.16% at Day −4 and −1.93% at Day 4. The reason for this negative performance may be due to the technology companies having to shut down their business, leading to, instead of shipping of electronic commodities and related goods.
The healthcare and pharmaceuticals sectors exhibit significantly positive AR before the announcement with 2.18% at Day −6. Also, at and after the event date, the index of healthcare and that of pharmaceuticals show a 7‐day positive AR and 5‐day abnormal return, respectively. It is obvious that the event wields a positive influence on the performance of these two indices. This is because increasing demand for medical equipment and medicine will motivate the two industries.
The telecommunications index depicts a significantly positive AR before the announcement with 1.71% at Day −3, but there is no significant change at the announcement date. After that day, it shows a significantly positive AR with 3.21%, 3.25% and 5.73% at Day 1, Day 6 and Day 7, respectively. This positive performance is explained by the increasing demand for distance learning and tele‐work. Meanwhile, index displays a significantly negative AR with −2.58% at Day 8.
The food sector index does not exhibit significant average abnormal returns before the event date while it has significant AR with 3.16% at Day 0, 2.80% at Day 10. The food industry is also in high demand due to panic buying and hoarding of food, which may constitute the main reason leading to positive abnormal return.
Overall, during Day 0 to Day 10, the industry indices, except for technology index and real estate index, have relatively stable CARs (Figure 4). After the announcement, food, pharmaceuticals, telecommunications and healthcare sectors indicate a clearly increasing trend of CARs, while energy and real estate industry tend to fall, while for transportation and technology it remains relatively steady.
FIGURE 4.

Cumulative abnormal return of industry indices within the test period (−10, 10) [Color figure can be viewed at wileyonlinelibrary.com]
5. DISCUSSIONS
The findings suggest that some industry indices are sensitive to the official announcement of the epidemic in Australia. After the declaration of the epidemic on 27 February 2020, the food, healthcare, pharmaceuticals and telecommunications industries perform better on AR compared to the others in the post‐event window. This is because the Corona virus enhances the demand for medical equipment and drugs, which is consistent with the research on SARS by Chen et al. (2009). In addition, Ramelli and Wagner (2020) explain that the travel restrictions regulations and demand for working at home accelerate the development of the telecommunications industry. Obviously, investors expect that the possible implementation of quarantine policy means good prospects for the telecommunications industry. The Corona virus triggers soaring demand for food in the form of panic‐buying and stockpiling of food products (Nicola et al., 2020).
However, after the announcement, another four sectors show negative abnormal returns. The negative impact of the announcement on the transportation industry replicates past experiences. Harbison (2003) argue that the epidemic would lead to much fewer passengers in the transportation industry. On Day 7, the energy industry has the minimum significant value (−11.70%) of abnormal return, caused by the oil price war between Saudi Arabia and Russia, and subsequently facilitating a sharp fall in the price of oil on 8 March 2020. Moreover, home‐quarantine policy forces the public to use their cars less and cancels a huge number of flights, which cuts the demand for petrol and profits of the energy companies. The real estate index is the only industry index showing no clear evidence affected by the declaration of an epidemic in the short‐term, which is consistent with the findings of Wong (2008) in Hong Kong during SARS. A few months of isolation would make it difficult for these companies in the shopping and technology industries to survive because of costs incurred in employing personnel and unused fixed assets in China (Wang, Cheng, Yue & McAleer, 2020).
In terms of long‐term impact, the performance of different sectoral indicators depends on how well the epidemic can be contained in the future. There are few studies focussing on the long run impacts for previous pandemic. For an example, using daily data for 77 countries from 22 January to 17 April 2020, Ashraf (2020) finds an indirect positive impact on stock returns by reducing the growth rate of new confirmed cases. Bai et al. (2020) study the impact of the infectious disease pandemic on the stock market volatility in the United States, China, the United Kingdom and Japan between January 2005 and April 2020. They find that, with a lag of 24 months, infectious disease pandemics can positively affect permanent movements in international stock markets, even though the impact of global economic policy uncertainty and volatility leverage have been weakened. However, the long run data are not available for the current pandemic (COVID‐19, 2020) and this study only discusses the short run phenomena.
6. CONCLUSIONS
This article uses the Event Study method to assess the impacts of the declaration of COVID‐19 on eight selected industries in Australia. The findings show how investors' confidence changes since after the official announcement of the epidemic outbreak, but there is a great variation among the sectors. On the day of announcement, three sectors (food, pharmaceuticals and healthcare) show positive impressive return at a significant level. After that, more industry indices show sensitivity towards the declaration, especially the good performance of the indices for pharmaceuticals, healthcare and telecommunications, in comparison with the worse performance of the transportation and energy indices.
The findings are meaningful for equity investors, companies and governments. Investors and business managers will have a better idea about which sector is risky in case of a pandemic for taking precautions accordingly. The government should offer assistance and extend policy support, such as tax deductions or free‐interest loans to those sectors which are experiencing negative abnormal return. Furthermore, the government can conduct further quantitative research easing to reduce investors' fear in the short‐term, just as the US government has done (Zhang, Hu & Ji, 2020). The government can mitigate the risk of a cash squeeze from COVID‐19 through tax deferrals and bridge lending policies, and bridge loans are more cost‐effective in preventing a massive cash crunch in the 6 months after a crisis (Vito & Gómez, 2020).
This study is based on instant reflection of the market and short‐term fluctuations of the COVID‐19 outbreak announcement as it affects eight sector indices in Australia. It will help the government to implement quick policy actions for different sectoral reforms and incentive packages for vulnerable industries. It will be a guideline for taking initial policy action for such type of events in the future. Moreover, this study will lead researchers to check the long‐term impacts when the long‐run data will be available. Therefore, future research can be focused on the long‐term performance of specific sectors or new research may be conducted on other markets to identify the impacts of a pandemic of such a proportionality.
Alam MM, Wei H, Wahid ANM. COVID‐19 outbreak and sectoral performance of the Australian stock market: An event study analysis. Aust Econ Pap. 2021;60:482–495. 10.1111/1467-8454.12215
Contributor Information
Md. Mahmudul Alam, Email: rony000@gmail.com.
Abu N. M. Wahid, Email: wahid2569@gmail.com.
DATA AVAILABILITY STATEMENT
The data that support the findings of this study are available from the corresponding author upon reasonable request.
REFERENCES
- Al‐Awadhi, A. M. , Al‐Saifi, K. , Al‐Awadhi, A. , & Alhamadi, S. (2020). Death and contagious infectious diseases: Impact of the COVID‐19 virus on stock market returns. Journal of Behavioral and Experimental Finance, 27, 1–13. [DOI] [PMC free article] [PubMed] [Google Scholar]
- Anusakumar, S. V. , Ali, R. , & Hooy, C. . W. (2017). The effect of investor sentiment on stock returns: Insight from emerging Asian markets. Asian Academy of Management Journal of Accounting and Finance, 13(1), 159–178. [Google Scholar]
- Ashraf, B. N. (2020). Economic impact of government interventions during the COVID‐19 pandemic: International evidence from financial markets. Journal of Behavioral and Experimental Finance, 27, 1–9. [DOI] [PMC free article] [PubMed]
- Bai, L., Wei, Y., Wei, G. W., Li, X. F., & Zhang, S. Y. (2020). Infectious disease pandemic and permanent volatility of international stock markets: A long‐term perspective. Finance Research Letters. https://doi.org/101709.10.1016/j.frl.2020.101709 [Available online 30 July 2020] [DOI] [PMC free article] [PubMed]
- Barnard, B. (2002). Air carriers count down. Europe, 414(16), 16–18. [Google Scholar]
- Beutels, P., Jia, N., Zhou, Q. Y., Smith, R., Cao, W. C., & Vlas, S. J. D. (2009). The economic impact of SARS in Beijing, China. Tropical Medicine & International Health, 14(1): 85–91. [DOI] [PubMed] [Google Scholar]
- Borenstein, S. , & Zimmerman, M. B. (1988). Market incentives for safe commercial airline operation. American Economic Review, 78(5), 913–935. [Google Scholar]
- Broadstock, D. C. , Cao, H. , & Zhang, D. Y. (2012). Oil shocks and their impact on energy related stocks in China. Energy Economics, 34, 1888–1895. [Google Scholar]
- Brown, S. J. , & Warner, J. B. (1985). Using daily stock returns: The case of event studies. Journal of Financial Economics, 14(1), 3–31. [Google Scholar]
- Campbell, J. Y. , & Lo, A. W. (1997). The econometrics of financial markets. New Jersey, NJ: Princeton University Press. [Google Scholar]
- Carlaw, S. (2020). Impact on biometrics of Covid‐19. Biometric Technology Today, 2020(4), 8–9. [Google Scholar]
- Chen, D. C. , Chen, C. C. , Tang, W. W. , & Huang, B. Y. (2009). The positive and negative impacts of the SARS outbreak: A case of Taiwan industries. Journal of Developing Areas, 43(1), 1–13. [Google Scholar]
- Chopra, R. (2020). Battling the coronavirus crisis: A case of India's real estate sector. UGC Care Journal, 31(4), 1133–1147. [Google Scholar]
- Deak, Z. , & Karali, B. (2014). Stock market reactions to environmental news in the food industry. Journal of Agricultural and Applied Economics, 46(2), 209–225. [Google Scholar]
- Dyckman, T. , Philbrick, D. , & Stephan, J. (1984). A comparison of event study methodologies using daily stock returns: A simulation approach. Journal of Accounting Research, 22, 1–30. [Google Scholar]
- Fan, E. X. (2003). SARS: Economic impacts and implications. Economics and Research Department Policy Brief Series No. 15. Metro Manila: Asian Development Bank.
- Flouris, T. , & Walker, T. (2007). Financial comparisons across different business models in the Canadian airline industry. Journal of Air Transportation, 12(1), 25–52. [Google Scholar]
- Jingwen, Z (2005). The market reaction of information disclosure manners of SARS epidemic situation: The empirical evidence from China listed firms of pharmaceutical industry. Nankai Business Review, 5, 82–87. [Google Scholar]
- Harbison, P. (2003). SARS hits hard. Flight Safety Australia, 7, 28–29. [Google Scholar]
- Hinman, A. R. , Orenstein, W. A. , Santoli, J. M. , Rodewald, L. E. , & Cochi, S. L. (2006). Vaccine shortages: History, impact, and prospects for the future. Annual Review of Public Health, 27(1), 235–259. [DOI] [PubMed] [Google Scholar]
- Kim, H. , & Gu, Z. (2004). Impact of the 9/11 terrorist attacks on the return and risk of airline stocks. Tourism and Hospitality Research, 5(2), 150–163. [Google Scholar]
- Lee, J. W. , & McKibbin, W. J. (2004). Globalization and disease: The case of SARS. Asian Economic Papers, 3(1), 113–131. [Google Scholar]
- Liu, H. Y. , Manzoor, A. , Wang, C. Y. , Zhang, L. , & Manzoor, Z. (2020). The COVID‐19 outbreak and affected countries. Stock markets response. International Journal of Environmental Research and Public Health, 17(8), 1–19. [DOI] [PMC free article] [PubMed] [Google Scholar]
- Loh, E. (2006). The impact of SARS on the performance and risk profile of airline stocks. International Journal of Transport Economics, 33(3), 401–422. [Google Scholar]
- Maijama'a, R. , Musa, K. S. , Garba, A. , & Baba, U. M. (2020). Corona virus outbreak and the global energy demand: A case of People's Republic of China. American Journal of Environmental and Resource Economics, 5(1), 10–13. [Google Scholar]
- Nicola, M. , Alsafi, Z. , Sohrabi, C. , Kerwan, A. , Al‐Jabir, A. , Iosifidis, C. , … Agha, R. (2020). The socio‐economic implications of the coronavirus pandemic (COVID‐19): A review. International Journal of Surgery, 78, 185–193. [DOI] [PMC free article] [PubMed] [Google Scholar]
- Paital, B. (2020). Nurture to nature via COVID‐19, a self‐regenerating environmental strategy of environment in global context. Science of the Total Environment, 729(1–11), 139088. [DOI] [PMC free article] [PubMed] [Google Scholar]
- Perry, S. (2001). Risk factors in stock returns of Canadian oil and gas companies. Energy Economics, 23, 17–28. [Google Scholar]
- Prime Minister of Australia . (2020). Press conference ‐ Australian Parliament House. 27 Feb. Retrieved from https://www.pm.gov.au/media/press-conference-australian-parliament-house-4
- Ramelli, S. , & Wagner, A. F. (2020). Feverish stock price reactions to COVID‐19. Swiss Finance Institute Research Paper Series 20‐12.
- Reboredo, J. C. , & Rivera‐Castro, M. A. (2014). Wavelet‐based evidence of the impact of oil prices on stock returns. International Review of Economics and Finance, 29, 145–176. [Google Scholar]
- Sato, R. C. (2013). Risk assessment in airlines stocks market. Journal of Transport Literature, 7(2), 352–372. [Google Scholar]
- Smith, R. D. , Yago, M. , Millar, M. , & Coast, J. (2005). Assessing the macroeconomic impact of a healthcare problem: The application of computable general equilibrium analysis to antimicrobial disease resistance. Journal of Health Economics, 24(6), 1055–1075. [DOI] [PubMed] [Google Scholar]
- Sobieralski, J. B. (2020). COVID‐19 and airline employment: Insights from historical uncertainty shocks to the industry. Transportation Research Interdisciplinary Perspectives, 5(1–9), 100123. [DOI] [PMC free article] [PubMed] [Google Scholar]
- Sparaco, P. (2001). Economic pall cast on European carriers. Aviation Week & Space Technology, 155(18), 70. [Google Scholar]
- Stankeviciene, J. , & Akelaitis, S. (2014). Impact of public announcements on stock prices: Relation between values of stock prices and the price changes in Lithuanian stock market. Procedia ‐ Social and Behavioral Sciences, 156, 538–542. [Google Scholar]
- Vito, A. D. , & Gómez, J. P. (2020). Estimating the COVID‐19 cash crunch: Global evidence and policy. Journal of Accounting and Public Policy, 39(2), 1–14. [Google Scholar]
- Wang, C. Y. , Cheng, Z. , Yue, X. G. , & McAleer, M. (2020). Risk management of COVID‐19 by universities in China. Risk and Financial Management, 13(2), 1–6. [Google Scholar]
- Wang, Y. S. (2013). The impact of crisis events on the stock returns volatility of international airlines. The Service Industries Journal, 33(12), 1206–1217. [Google Scholar]
- Wong, G. (2008). Has SARS infected the property market? Evidence from Hong Kong. Journal of Urban Economics, 63, 74–95. [DOI] [PMC free article] [PubMed] [Google Scholar]
- Wyeth, G. (2020). How well has Australia managed COVID‐19?, The Diplomat, 17 April. Retrieved from https://thediplomat.com/2020/04/how-well-has-australia-managed-covid-19/
- Zhang, D. Y. , Hu, M. , & Ji, Q. (2020). Financial markets under the global pandemic of COVID‐19. Finance Research Letters. 36, 101528. 10.1016/j.frl.2020.101528. [DOI] [PMC free article] [PubMed] [Google Scholar]
Associated Data
This section collects any data citations, data availability statements, or supplementary materials included in this article.
Data Availability Statement
The data that support the findings of this study are available from the corresponding author upon reasonable request.