

Abstract
Abstract
GC1118 is a monoclonal antibody for epidermal growth factor receptor (EGFR) that is currently under clinical development to treat patients with solid tumors. In this study, the pharmacokinetics (PKs) of GC1118 were modeled in solid tumor patients who received a 2‐h intravenous infusion of GC1118 at 0.3, 1, 3, 5, or 4 mg/kg once‐weekly (Q1W) on days 1, 8, 15, and 22 or 8 mg/kg every other week on days 1 and 15. A target‐mediated drug disposition population PK model adequately described the concentration‐time profiles of GC1118. Monte‐Carlo simulation experiments of the PK profiles and EGFR occupancies (ROs) by GC1118 based on the final model showed that Q1W at 4 or 5 mg/kg will produce a better antitumor effect than Q2W at 8 mg/kg. Because GC1118 was safer at 4 mg/kg than 5 mg/kg in the phase I study, we suggest to test the 4 mg/kg Q1W regimen in further clinical trials with GC1118.
Study Highlights.
WHAT IS THE CURRENT KNOWLEDGE ON THE TOPIC?
GC1118, a fully human IgG1 monoclonal antibody (mAb) for epidermal growth factor receptor (EGFR), showed a nonlinear pharmacokinetic (PK) profile in monkeys and humans. The total clearance of GC1118 decreased as the dose was increased up to 3–4 mg/kg in humans, beyond which it remained stable. The recommended phase II dose for GC1118 was 4 mg/kg intravenously infused over 2 h once weekly.
WHAT QUESTION DID THIS STUDY ADDRESS?
We developed a target‐mediated drug disposition (TMDD) population PK model that described the nonlinear PK profile of GC1118 in patients with solid tumors. We also simulated the PK profiles and receptor occupancies for different dosage regimens.
WHAT DOES THIS STUDY ADD TO OUR KNOWLEDGE?
The TMDD population PK model adequately described the nonlinear and multiphasic PK profiles of GC1118 in humans. The simulation experiment showed that once‐weekly GC1118 at 4–5 mg/kg could be more efficacious than the biweekly regimen at 8 mg/kg.
HOW MIGHT THIS CHANGE CLINICAL PHARMACOLOGY OR TRANSLATIONAL SCIENCE?
The pharmacometrics analysis could support better informed drug development decisions for GC1118, particularly for determining an optimal dosage regimen.
INTRODUCTION
The epidermal growth factor receptor (EGFR) is activated in many cancers, 1 which contributes to high levels of autocrine signaling and uncontrolled growth of cancer cells. 2 , 3 Signals induced by activated EGFR can be blocked by anti‐EGFR monoclonal antibodies (mAbs), which compete with endogenous ligands for EGFR, resulting in less activation of EGFR tyrosine kinases. 4 Cetuximab and panitumumab are an example of anti‐EGFR mAbs approved to treat patients with advanced colorectal cancers. 5 However, both cetuximab and panitumumab failed to inhibit ligand‐induced EGFR downstream signaling molecules, such as Erk and Akt, which are responsible for the survival and growth of the cell. 6
GC1118, a fully human IgG1 mAb for EGFR, is currently under clinical development to treat patients with solid tumors. 6 , 7 , 8 , 9 In the preclinical tumor xenograft models, GC1118 potently inhibited the ligand‐induced EGFR downstream signaling molecules, including Erk and Akt. 6 Furthermore, unlike cetuximab, GC1118 tightly bound to EGFR even when an excessive amounts of endogenous ligands were present. 6 These results suggest that GC1118 has a potential to treat patients with cancer with hyperactivated EGFR.
We recently reported that GC1118 showed a nonlinear pharmacokinetic (PK) profile after i.v. infusions in patients with metastatic colorectal or gastric cancer. 7 When the dose of GC1118 was increased by ~ 15 times (i.e., from 0.3 to 5 mg/kg), the average peak concentration (Cmax) and the area under the serum concentration‐time curve (AUC) increased by 32‐ and 163‐fold, respectively. 7 In addition, the mean clearance of GC1118 rapidly decreased from 322 to 39.3 mL/h as the dose was increased from 0.3 to 3 mg/kg, beyond which it remained stable. These findings indicate that EGFR is fully saturated by GC1118 at ≥3 mg/kg, which could result in an antitumor response. To support this notion, 12.5% of patients who received GC1118 at greater than 3 mg/kg showed a partial response. 7
Previously, a target‐mediated drug disposition (TMDD) population PK model of GC1118 was developed in monkeys, which was used to predict the human PK parameters and EGFR occupancy profile. 8 TMDD models have been frequently used to describe the nonlinear PK profiles of drugs whose clearance or distribution are affected by their targets due to high affinity and limited capacity of binding, of which GC1118 is an example. 10
The objectives of this study were (a) to develop a population PK model that adequately describes the PK profile of GC1118 in patients with solid tumors, and (b) to investigate the PK profiles of GC1118 after different dosage regimens for further clinical studies using simulation. To this end, we characterized the PK of GC1118 in humans using a TMDD model. Additionally, EGFR occupancy by GC1118 after different dosage regimens was simulated.
METHODS
Clinical study and subjects
In a phase I clinical trial with GC1118, 24 patients with solid tumors received a 2‐h i.v. infusion of GC1118 at 0.3, 1, 3, 5 (cohorts 1 to 4, respectively), or 4 mg/kg (cohort 5) once‐weekly (Q1W) on days 1, 8, 15, and 22. 7 Furthermore, 8 additional patients repetitively received GC1118 at 8 mg/kg over 2‐h every other week to explore the feasibility of a biweekly (Q2W) regimen (cohort 6). In cohorts 1–5, serum PK samples were collected at 0 h (i.e., predose), 1 h after the start of infusion, immediately after the end of infusion, and 0.5, 1, 2, 4, 8, 12, 24, 72, and 120 h after the end of infusion on days 1 and 22. Additional samples were collected at predose on days 8 and 15, and at 168, 336, and 504 h after the end of infusion on day 22. In cohort 6, serum PK samples were collected at predose, immediately after the end of infusion, 1, 2, 4, 8, 24, 72, 120, 168, and 336 h after the end of infusions on days 1 and 43 and predose on days 15 and 29.
Bioanalytical assay
Blood was collected and allowed to clot by leaving the blood containing tubes undisturbed at room temperature for 30 min. 7 Next, the tube was centrifuged (2000 x g, 10 min) to obtain the serum, which was then stored at −70°C until analysis. Free serum GC1118 concentrations were determined using a validated enzyme‐linked immunosorbent assay (ELISA; Invitrogen, Carlsbad, CA) with a lower limit of quantitation of 0.025 µg/ml. Serum samples were incubated at 37°C for 90 min in 6‐well plates containing GC1118 targeted antigen. Subsequently, serum samples were washed to remove any unbound molecules and were incubated with a prepared amplification buffer (i.e., GC1118 antibody‐Biotin) at 37°C for 60 min to measure the resulting signal. The serum GC1118 concentration was quantitatively determined by measuring the absorbance at 450 nm using Softmax Pro GxP 5.4.4 (Molecular Devices, San Jose, CA). The interassay accuracy ranged 98.4–104.5% and 98.8–105.6% at all concentrations for cohorts 1–5 and cohort 6, respectively. In addition, the interassay precision was below 3.0% (cohorts 1–5) and 5.1% (cohort 6).
Population pharmacokinetic data set
Non‐missing serum concentrations of GC1118 were merged with the covariates, which included demographic information (body weight, height, gender, and age), laboratory test results (blood urea nitrogen, creatinine, total bilirubin, alkaline phosphatase, aspartate aminotransferase, alanine aminotransferase, and glomerulus filtration rate) and immunohistochemistry (IHC) staining data to create the population PK data set. IHC staining data contained EGFR histological score (H‐score). The H‐score is derived based on the relative intensity and percentage staining of EGFR, which represents the extent of nuclear immunoreactivity. 11
Base model development
A TMDD population PK model was selected as the base model. The PK profile of GC1118 was nonlinear and showed up at least three distinguished phases (i.e., a brief initial phase, an apparent linear phase, and a transition phase), which is a characteristic of TMDD, particularly for higher dose cohorts (i.e., ≥3 mg/kg) after multiple dose administration (Figure 1). 12 The model was parameterized by the clearances of the unbound GC1118 (CLA), EGFR (CLB), and GC1118‐EGFR complex (CLC), volume of distribution of GC1118 in the central (Vc) and peripheral compartments (VP), intercompartmental clearance of unbound GC1118 between the central and peripheral compartments (Q), dissociation constant between GC1118 and EGFR (KD), EGFR production rate (RB), and duration of i.v. infusion into the central compartment (D1). These parameters are written with regard to the unbound GC1118 amount in the central compartment (AC) and total GC1118 amount in the peripheral compartment (TAP) using the following differential equations for a two‐compartment model (Equations 1 and 2; Figure 2) by reasonably assuming that EGFR is confined in the peripheral compartment:
| (1) |
| (2) |
where AP is the unbound GC1118 amount in the peripheral compartment, and CPLXP refers to the GC1118‐EGFR complex amount in the peripheral compartment.
Figure 1.
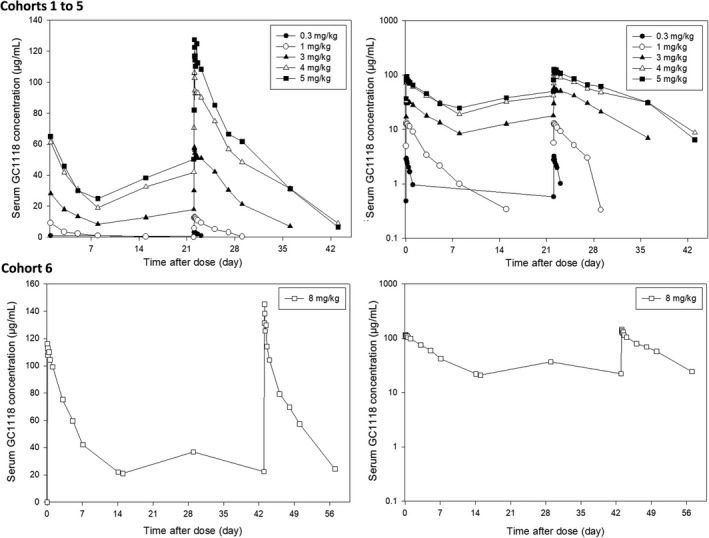
Mean serum GC1118 concentration‐time profiles after multiple i.v. infusions (left: linear scale, right: semilogarithmic scale). Observed serum GC1118 concentrations (µg/ml) after once weekly 0.3 mg/kg (●), 1 mg/kg (○), 3 mg/kg (▲), 5 m/kg (■), 4 mg/kg (△) i.v. infusion (cohorts 1 to 5, respectively) over 2 h and biweekly 8 mg/kg (□) i.v. infusion (cohort 6) over 2 h are shown
Figure 2.

Target‐mediated drug disposition model for GC1118. AC, unbound GC1118 amount in the central compartment; AP, unbound GC1118 amount in the peripheral compartment; CLA, clearance (CL) of the unbound GC1118; CLB, CL of the EGFR; CLC, CL of the GC1118‐EGFR complex; CPLXP, amount of GC1118‐EGFR complex in the peripheral compartment; EGFR, epidermal growth factor receptor; KD, dissociation constant between GC1118 and EGFR; Q, intercompartmental CL of unbound GC1118 between central and peripheral compartment; RB, EGFR production rate; VC, volume of distribution in the central compartment; VP, volume of distribution in the peripheral compartment
Assuming that the concentration of GC1118 is much higher than that of EGFR and there is a rapid binding between GC1118 and EGFR that retains the equilibrium at steady‐state, 13 , 14 TAP and CPLXP are given by the following equations:
| (3) |
| (4) |
where TRP that is the total (i.e., both free and bound), amount of EGFR in the peripheral compartment, which is given by Equation 5 assuming CLB and CLC are identical 8 :
| (5) |
All PK parameters were estimated, except for KD, which was fixed to 0.16 nM, a value obtained from an in vitro study with GC1118. 6
Interindividual variability (IIV) and interoccasion variability (IOV) for the aforementioned parameters were both described using an exponential error model, as shown in Equation 6:
| (6) |
where Pi is the PK parameter estimate for the ith individual, Ppop is the typical population value of the PK parameter, is the IIV for the PK parameter in the ith individual, and is the IOV for the PK parameter in the ith individual at occasion κ. IIV and IOV was assumed to be log‐normally distributed with mean 0 and a variance of ω2. Covariance between IIV and IOV terms was also estimated. Additive, proportional, and both combined residual error models with and without IIV were tested to describe residual unexplained variability.
In every process of model development, several model selection criteria were applied: biological plausibility, visual assessments of residual plots, goodness‐of‐fit (GOF) plots, decrease in the objective function value (OFV), and decrease in the IIV of the PK parameters.
Evaluation of covariate effects
The covariates were entered into the base model one at a time and retained in the model if OFV was decreased by ≥7.88 (p < 0.005, df = 1), resulting in the full model. The full model was then refined by removing the covariates from the model one at a time to see if OFV was increased by ≥7.88. The categorical covariates, such as sex and cancer type, were added into the model as a fractional change relative to a reference sub‐category (Equation 7). On the other hand, the continuous covariates were expressed as a power model with a nonlinear relationship between the covariate and a population parameter (Equation 8).
| (7) |
| (8) |
where Pi , cov is the ith individual PK parameter value that incorporates the covariate effect, Ppop , 0 is the population PK parameter value without the covariate, θcov is the term that relates the effect of covariate X to Ppop,0, Yi is a dummy variable with a value of either 0 or 1 assigned to the reference and nonreference subcategory of a categorical covariate, respectively, Xi is the ith individual’s value of the covariate X, M(X) is the median of the covariate X or generally accepted typical value (i.e., 70 kg for body weight).
Model refinement and final model development
After removing covariates that did not improve model fit from the full model, the last model was refined to see if there was any possibility for further model improvement by reintroducing or removing certain model components into and out of the existing model, such as covariance between PK parameters (i.e., OMEGA BLOCK). The refinement steps resulted in the final model.
Model qualification
The final PK model was considered stable if the final PK parameters estimates were similar to the median of the PK parameters obtained using the 100 bootstrap resampled datasets. Additionally, the visual predictive check (VPC) was performed to see if there was any model misspecification. To this end, we simulated the PK profiles of GC1118 1000 times using the final population PK model, and the lower 2.5th, median, and upper 97.5th values of the observed and predicted serum GC1118 concentrations were compared.
Simulation of GC1118 concentrations
A Monte‐Carlo simulation was performed 100 times using the final model to investigate the PK profiles and EGFR occupancies (RO) of GC1118 in 5 different dosage regimens (10 subjects for each dosage regimen): 3, 4, and 5 mg/kg Q1W, and 8 and 10 mg/kg Q2W. The RO was defined as follows:
| (9) |
The significant covariates in the final PK model were also simulated such that they were distributed comparably to those in the final PK dataset. The mean simulated serum GC1118 concentrations, and RO for each dosage regimen were estimated.
Software
The NONMEM software (version 7.4; Icon Development Solution, Hanover, MD) was used for population PK modeling. The Stochastic Approximation Expectation‐Maximization (SAEM) and Monte Carlo Importance Sampling assisted by Mode a posteriori estimation (IMPMAP) were the estimation methods. R 3.5.1 (R Foundation, Vienna, Austria) was used for graphical presentations. Xpose (version 4.6.1) 15 and the PsN toolkit (version 4.8.1) 16 were used for diagnostics plots, VPC, and bootstrapping.
RESULTS
Subjects
A total of 32 patients (20 men and 12 women) and their 793 concentrations of GC1118 were included in the population PK data set (Table 1). The age and body weight of subjects ranged from 34 to 71 years and 42.5 to 89.2 kg, respectively. The primary cancer of subjects was colorectal cancer (n = 18, 56.3%) and other types of cancer (n = 17, 53.2%), which included ampulla of Vater cancer, appendix cancer, breast cancer, cholangiocarcinoma, esophageal cancer, gallbladder cancer, gastric cancer, nasal cavity cancer, nasopharyngeal cancer, pancreas cancer, and tonsil cancer. All patients had normal renal and hepatic functions at baseline. In addition, none of the patients developed antidrug antibody to GC1118 before and after they received i.v. infusions of GC1118.
Table 1.
Baseline characteristics
| Characteristics | Weekly cohort (cohorts 1–5, n = 24) | Biweekly cohort (cohort 6, n = 8) | Total (n = 32) | Range |
|---|---|---|---|---|
| Male, n (%) | 15 (62.5) | 5 (62.5) | 20 (62.5) | NA |
| Age, years a | 57.2 ± 9.7 | 55.4 ± 7.4 | 56.7 ± 9.1 | 34.0–72.0 |
| Body weight, kg a | 63.5 ± 10.8 | 61.7 ± 9.5 | 63.1 ±10.4 | 42.5–89.2 |
| Aspartate aminotransferase, IU/L a | 30.8 ± 15.9 | 22.9 ± 5.1 | 28.8 ± 14.4 | 13.0–70.0 |
| Alanine aminotransferase, IU/L a | 21.6 ± 13.1 | 19.8 ± 13.4 | 21.2 ± 13.0 | 6.0–49.0 |
| Alkaline phosphatase, IU/L a | 123.5 ± 92.4 | 91.0 ± 33.6 | 115.4 ± 82.4 | 34.0–433.0 |
| Blood urea nitrogen, mg/dL a | 12.9 ± 4.3 | 12.9 ± 3.6 | 12.9 ± 4.1 | 7.0–20.0 |
| Serum creatinine, mg/dL a | 0.8 ± 0.2 | 0.8 ± 0.2 | 0.8 ± 0.2 | 0.44–1.27 |
| Total bilirubin, IU/L a | 0.6 ± 0.4 | 0.8 ± 0.5 | 0.7 ± 0.4 | 0.1–1.8 |
| EGFR H‐Score a | 48.8 ± 54.6 | 220 ± 56.1 | 91.6 ± 92.7 | 0–290.0 |
| Intensity of EGFR, n (%) | ||||
| 0 | 5 (20.8) | – | 5 (15.6) | – |
| 1+ | 6 (25.0) | – | 6 (18.8) | – |
| 2+ | 6 (25.0) | 3 (37.5) | 9 (28.1) | – |
| 3+ | 7 (29.2) | 5 (62.5) | 12 (37.5) | – |
| Cancer type specification, n (%) | ||||
| Colorectal cancer | 17 (70.8) | 1 (12.5) | 18 (56.2) | – |
| Others | 7 (29.2) b | 7 (87.5) c | 14 (43.8) | – |
Abbreviations: EGFR H‐score: epidermal growth factor receptor histological score, ranging from 0 to 300 based on the percentage of cells stained at different intensities, to measure EGFR expression in tumor tissues; NA, not applicable.
The data are presented as mean ± SD.
Others included ampulla of Vater cancer (1), appendix cancer (1), breast cancer (1), esophageal cancer (1), gallbladder cancer (1), gastric cancer (1), and tonsil cancer (1).
Others included ampulla of Vater cancer (1), cholangiocarcinoma (3), nasal cavity cancer (1), nasopharyngeal cancer (1), and pancreas cancer (1).
Population pharmacokinetic model
The final two‐compartment TMDD population PK model adequately described the concentration‐time profiles of GC1118 in patients with solid tumors. The proportional error model adequately described residual variability, and its IIV was also allowed. IIV was estimated on all of the parameters. We tested IOV on every parameter in the model one by one in NONMEM to see if any of the IOV terms could have improved the model fit. However, no IOV other than the one on Q improved the model fit or decreased the respective IIV. Most of the PK parameters were precisely estimated except for CLB and Q, those of which had a relatively large 95% confidence interval (29.8–104.5 mL/h, 216.5–2541.0 mL/h, respectively; Table 2). CLB, which was assumed to be identical to CLC in our analysis, was almost four times greater than CLA (63.4 mL/h vs. 16.2 mL/h; Table 2). The final TMDD population PK model of GC118 included IIV for all of the PK parameters and IOV on Q, and their covariance was estimated (Table 2). The IIV on CLB, Q, KD, and the IOV on Q was large, such that their coefficient of variation percentage (CV%) ranged from 181.4 to 261.5% (Table 2). The shrinkages for IIV were relatively low; most of them were less than 15% (Table 2).
Table 2.
Parameters of the final population PK model of GC1118
| Parameter | Typical value, median [95% CI] a | Variability (CV%), median [95% CI] a | Shrinkages for IIV | Previous TMDD model estimated parameter for GC11188 | ||
|---|---|---|---|---|---|---|
| IIV | IOV | Monkey b | Human c | |||
| CL A, ml/h | 16.2, 16.6 [13.8–20.0] | 36.2, 31.6 [15.3–89.1] | NE | 7.3% | 0.975 | 10.4 |
| CL B and CL C, ml/h | 63.4, 60.2 [29.8–104.5] | 188.1, 147.5 [73.1–221.1] | NE | 14.5% | 1.66 | 17.6 |
| V C, ml | 3660.0, 3703.9 [3207.8–4153.5] | 21.4, 21.5 [12.6–30.9] | NE | 2.2% | 141 | 3290 |
| V P, ml | 1180.0, 1262.8 [904.8–1580.7] | 58, 43.9 [27.4–59.1] | NE | 19.6% | 90.4 | 2109 |
| Q, ml/h | 627.0, 547.3 [216.5–2541.0] | 181.4, 161.6 [95.2–268.7] | 261.5, 320.2 [241.6–432.3] | 14.8% | 3.87 | 41.1 |
| K D, nM | 0.16, fixed | 227.8, 189.4 [122.2–270.4] | NE | 12.2% | 0.533 | 0.16, fixed |
| R B, pmol/h | 2390.0, 2341.9 [1942.7–2773.4] | 49.7, 41.9 [24.0–60.6] | NE | 9.2% | 287 | 4131 |
| Power term, effect of standardized body weight on CL A, no unit | 0.8, 0.6 [0.2–0.9] | NA | NA | NA | NE | NE |
| D1, h | 2.2, 2.2 [2.1–2.3] | 6.0, 6.2 [3.0–9.3] | NE | 2.8% | NE | NE |
| Proportional RUV, % | 0.10, 0.08 [0.06–0.11] | 31.4, 28.6 [16.1–39.8] | NE | 18.2% | NE | NE |
| Correlation coefficient between IIV terms, median | |||||||||
|---|---|---|---|---|---|---|---|---|---|
| IIV of | CL A | V C | Q | V P | D1 | R B | CL B | K D | RUV |
| CL A | 1.000 | ||||||||
| V C | 0.022 | 1.000 | |||||||
| Q | −0.116 | −0.281 | 1.000 | ||||||
| V P | −0.667 | 0.272 | −0.424 | 1.000 | |||||
| D1 | 0.737 | 0.218 | −0.249 | −0.267 | 1.000 | ||||
| R B | −0.662 | 0.649 | −0.017 | 0.729 | −0.268 | 1.000 | |||
| CL B | −0.311 | 0.579 | −0.085 | 0.642 | −0.131 | 0.805 | 1.000 | ||
| K D | −0.549 | 0.333 | 0.346 | 0.583 | −0.364 | 0.805 | 0.847 | 1.000 | |
| RUV | −0.052 | −0.317 | 0.790 | −0.148 | 0.027 | −0.033 | −0.016 | 0.414 | 1.000 |
Abbreviations: CLA, clearance of the unbound GC1118; CLB, clearance of the EGFR; CLC, clearance of GC1118‐EGFR complex; CI, confidence interval; CV%, coefficient of variation expressed as percent; D1, duration of intravenous infusion into the central compartment; IIV, interindividual variability; KD, dissociation constant between GC1118 and EGFR; NA, not applicable; NE, not estimated; Q, intercompartmental clearance of unbound GC1118 between the central and peripheral compartments; PK, pharmacokinetic; RB, EGFR production rate; RUV, residual unexplained variability; TMDD, target‐mediated drug disposition; VC, volume of distribution in the central compartment; VP, volume of distribution in the peripheral compartment.
Median value and 95% CIs were derived using 100 bootstrap runs.
Estimated PK parameter after GC1118 administration at 3, 6, 12, and 25 mg/kg in cynomolgus monkeys.
Predicted human parameters by allometric scaling from estimated parameters in monkeys.
Of all the covariates we tested one by one, only body weight was significant on CLA, which not only improved the model fit, but also decreased the IIV in VP, CLB, and KD by 8.3%, 8.9%, and 8.9%, respectively.
Model qualification
No discernible systematic bias was observed in any of the GOF plots (Figure 3). Additionally, the VPC plots on all 6 cohorts showed that most of the observed serum GC1118 concentrations were within the 95% prediction intervals, indicating little probability of model misspecification (Figure 4). Furthermore, the median of the parameters estimated from bootstrapped data sets was comparable to the estimated value in the final model (Table 2). Collectively, the VPC and bootstrapping results showed that the final model was qualified and stable.
Figure 3.
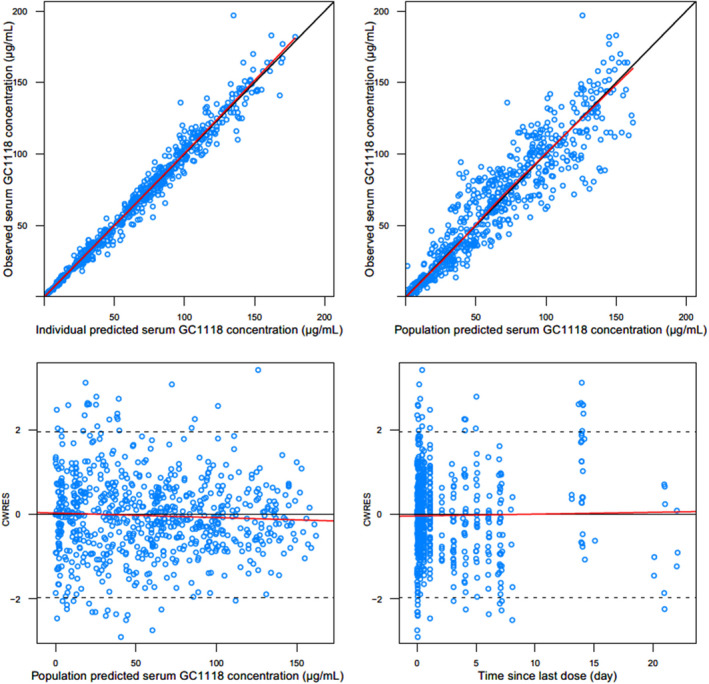
General goodness‐of‐fit plots for the final population pharmacokinetic model of GC1118: observed vs. individual predicted serum GC1118 concentrations (upper left); observed vs. population predicted serum GC1118 concentrations (upper right); conditional weighted residuals (CWRES) vs. population predicted serum GC1118 concentrations (lower left); CWRES vs. time since last dose (lower right)
Figure 4.
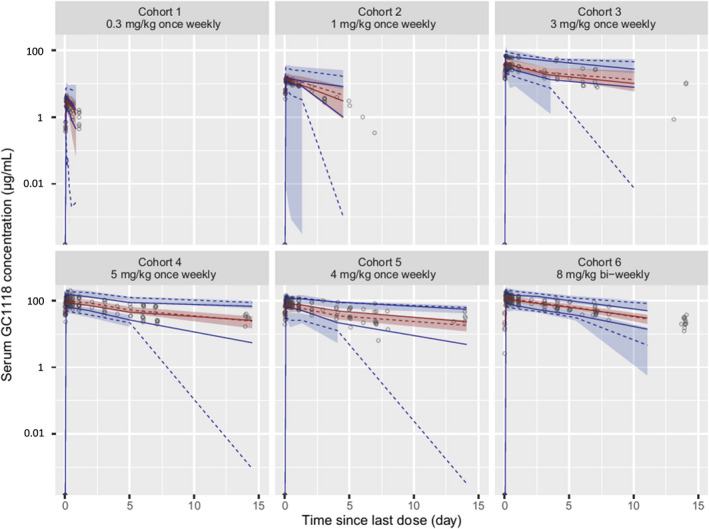
Visual predictive check (VPC) of the final population pharmacokinetic model of serum GC1118. The empty circles (○) represent the observed serum GC1118 concentrations, the solid (—) and dashed (‐ ‐ ‐) red lines denote the median values of the observed and predicted serum GC1118 concentrations, respectively, the solid (—) and dashed (‐ ‐ ‐) blue lines are the lower 2.5th and upper 97.5th values of the observed and predicted serum GC1118 concentrations, respectively, and the shaded areas indicate the 95% confidence intervals around the lower 2.5th, median, and upper 97.5th predicted concentrations, respectively. The y‐axis of the VPC plot is drawn on the semilogarithmic scale
Simulation of different dose regimens
The simulated PK profile of GC1118 at 8 mg/kg Q2W was similar to that of the observed concentrations at the same dosage regimen (Figure 5). Although the RO for all simulated dosage regimens reached greater than 90% within 24 h after the first administration of GC1118, only the dosage regimens of 4–5 mg/kg Q1W and 10 mg/kg Q2W maintained ROs above 95% over the entire dosing period after repeated administration. At the trough concentration of steady‐state, the RO was much more variable in the biweekly regimen; the predicted 5th and 95th percentiles of RO ranged from 16.1 to 99.9% and 41.1 to 99.9% for 8 and 10 mg/kg Q2W, respectively, than in the weekly regimen, whereas it was much narrower at 87.1–99.9% and 99.5–99. 9% for 4 and 5 mg/kg Q1W, respectively.
Figure 5.

Simulated pharmacokinetic (PK) profiles of GC1118 (plots a and b) and epidermal growth factor receptor (EGFR) occupancies (RO, plots c and d) at different dosage regimens after first intravenous infusion (plots a and c) and after reaching the steady‐state (plots b and d). Each solid line (━) in plots aand b represents mean concentration at a different dosage regimen in semi‐logarithmic scale; 3 mg/kg once weekly (Q1W) (black) 4 mg/kg Q1W (red), 5 mg/kg Q1W (green), 8 mg/kg biweekly (Q2W) (blue), and 10 mg/kg Q2W (dark red). Observed concentrations at 8 mg/kg Q2W from 8 patients (●) were overlaid to the same plot to evaluate the predictive performance of the simulation. Solid (—) and dashed line (‐ ‐ ‐) in plots C and D represents mean RO and 5th and 95th percentiles of RO, respectively, at a different dosage regimen in linear scale; 3 mg/kg Q1W (black) 4 mg/kg Q1W (red), 5 mg/kg Q1W (green), 8 mg/kg Q2W (blue), and 10 mg/kg Q2W (dark red)
DISCUSSION
We successfully developed a two‐compartment TMDD population PK model in patients with solid tumors. The TMDD model incorporated the main clearing mechanism of GC1118 (i.e., by tightly and specifically binding to EGFR), followed by fast internalization. 6 The TMDD population PK models adequately described the nonlinear and multiphasic PK profiles of GC1118 previously in monkeys, 8 and in humans, as we showed in this study.
Most of the observed serum concentrations of GC1118 at 8 mg/kg Q2 W were within the 95% confidence interval of the simulated PK profiles, which again confirmed the robustness of our model (Figure 4). The simulation experiment showed that EGFR was fully saturated at greater than 95% over the entire dosing period if GC1118 was administered at 4–5 mg/kg Q1W or 8–10 mg/kg Q2W, where GC1118 was likely to exert an anti‐tumor effect (Figure 5). 7 However, the simulated RO at steady‐state trough concentration was highly variable when 8 or 10 mg/kg Q2W were administered (the predicted 5th and 95th percentiles of RO ranged from 16.1 to 99.9% and 41.1 to 99.9% for 8 and 10 mg/kg Q2W, respectively). Therefore, the Q2W dosage regimen of GC1118 at 8 or 10 mg/kg may not fully inhibit EGFR expression, particularly toward trough, which could fail to produce an antitumor effect. To support this notion, the best response in the 8 mg/kg Q2W cohort from the phase I study of GC1118 was stable disease (n = 4, 50%), whereas partial response was seen in the 4 and 5 mg/kg Q1W cohorts (n = 2, 33.3%; and n = 3, 16.7%, respectively). 7 However, the efficacy results were exploratory at best because the type of cancers were different between the once‐weekly and biweekly cohorts. Therefore, the seemingly better efficacy in the once‐weekly cohorts should be tested and confirmed in further studies with a larger number of patients. Likewise, although the simulated exposure to GC1118 at steady‐state, as assessed by AUC and Cmax, in the 8 mg/kg Q2W cohort was similar to that in the 4 mg/kg Q1W, trough concentration was 26% lower in the 8 mg/kg Q2W cohort than in the 4 mg/kg Q1W cohort (35.67 µg/ml and 48.57 µg/ml, respectively). Collectively, these results suggest that an adequate dosage regimen for further clinical studies with GC1118 would be either 4 or 5 mg/kg Q1W. However, patients who received GC1118 at 5 mg/kg developed more frequent grade 2 or 3 adverse events than those at 4 mg/kg in the phase I clinical trial with GC1118. 7 Therefore, we suggest to test the 4 mg/kg Q1W regimen in further clinical trials with GC1118 for a better safety profile.
An optimal dosage regimen for cetuximab and panitumumab, another mAb to EGFR, which also exhibited TMDD PK profiles, was also determined based on in vitro and in vivo ROs, respectively. 17 , 18 In a phase I study with cetuximab, EGFR saturation was confirmed using IHC results when cetuximab was administered once weekly at 400/250 mg/m2. 17 This dosage regimen was further explored in the phase II and III clinical trials with cetuximab, which was finally approved as mono‐ and combination chemotherapy. 17 On the other hand, in a phase I study with panitumumab, all patients at 2.5 mg/kg Q1W experienced skin rash, a predictor of EGFR saturation. 18 Based on this result, the efficacy and safety profiles of panitumumab at 6 mg/kg Q2W were explored, which showed a similar tolerability and exposure profiles to those at 2.5 mg/kg Q1W. 19 Eventually, panitumumab at 6 mg/kg Q2W was approved to treat colorectal cancer. 19 Collectively, RO was an important biomarker for selecting an optimal dosage regimen for EGFR antagonists, particularly for those that exhibit TMDD PK profiles as GC1118.
The receptor‐mediated clearance of GC1118 (CLC) was ~ 4 times higher than the nonspecific clearance (CLA; 63.4 vs. 16.2 mL/h; Table 2), whereas these parameters in monkeys were only different by 1.5 times (1.66 vs. 0.975 mL/h; Table 2). 8 A much lower KD (i.e., higher affinity of GC1118 for EGFR in humans than in monkeys [0.16 vs. 0.533 nM]; Table 2) could partly explain the bigger difference between CLC and CLA in humans than in monkeys. Generally, the PK characteristics of biologics could differ between animals and humans due to different species or disease status. 20 , 21 Although monkeys and humans have 99.3% similar sequences for EGFR, 22 the binding epitopes and expression of EGFR are likely to differ across species. As a result, EGFR antagonists in humans and monkeys may result in different PK characteristics. Furthermore, the PK profiles of GC1118 in humans and monkeys were different partly because we studied patients with solid tumors, whereas healthy monkeys were enrolled in the preclinical experiment. 8 The EGFR is overexpressed in up to 77% of colorectal cancer cases. 23 Thus, the clearance of EGFR‐specific mAbs, such as GC1118, can be increased in patients having overexpressed EGFR due to increased GC1118‐EGFR complex and internalization. 24 For example, the fold differences of the predicted nonspecific elimination rate constant (kint) and complex turnover rate (kel) for MTRX‐1011A, a CD‐4 targeting mAb, was much larger in human patients (47‐fold difference, 0.109 vs. 5.17 day−1, respectively) than in healthy baboons (0.88‐fold difference, 0.116 vs. 0.103 day−1, respectively), whereas the fold changes for TRX‐1, another CD‐4 targeting mAbs, were the same in both healthy baboons (no difference, 2.04 vs. 2.04 day−1, respectively) and healthy volunteers (no difference, 4.25 vs. 4.25 day−1, respectively). 25 To sum up, we postulate that the PK characteristics of GC1118 in humans was different from that in monkeys probably because genetic factors and/or presence of diseases are different between the two species.
This study had three limitations. First, we fixed the dissociation constant between GC1118 and EGFR (KD) to the in vitro value because it was not independently identifiable. In order to estimate the KD, the amount of EGFR and GC1118 concentrations in the peripheral compartment should be identified, which was not supported by the data in the present study. Second, EGFR‐related information, such as the turnover rate, absolute amount of EGFR, or the impact of EGFR antagonists on the amount of EGFR has not been reported. Admittedly, this lack of information could have attributed to the relatively large IIV on CLB, Q, and KD. Third, we assumed the clearance of EGFR (CLB) was equal to the clearance of GC1118‐EGFR complex (CLC) even though no experimental data or published information was available to confirm this assumption. However, in patients who received GC1118, it is likely that the total amount of EGFR (TRP) remains constant because antibody‐drug complex do not synthesize its target or EGFR in our case. 26 , 27 In this case, the degradation rate of EGFR becomes equal to that of the GC1118‐EGFR complex. 26 Of course, this assumption may not hold completely true if the amount of EGFR is affected by GC1118. In addition, it is reasonable to assume that the volume of distribution for EGFR is equal to that of the GC1118‐EGFR at steady‐state because GC1118 specifically binds to EGFR. 6 These reasonings can collectively support our assumption that CLB was equal to CLC. Despite these limitations, however, most of the parameters were robust and reasonable. Furthermore, the final TMDD model adequately described the observed concentrations of GC1118.
CONCLUSION
A two‐compartment TMDD population PK model adequately described the PK profile of GC1118 in patients with solid tumors. Monte‐Carlo simulation experiments of the PK and RO profiles by GC1118 based on the final model showed that Q1W at 4 or 5 mg/kg will produce a better antitumor effect than Q2W at 8 mg/kg. Because GC1118 was safer at 4 mg/kg than 5 mg/kg in the phase I study, we suggest to test the 4 mg/kg Q1W regimen in further clinical trials with GC1118.
CONFLICT OF INTEREST
Ahmi Woo and Su Jin Lee are employees of GC Pharma, Yongin, Korea. All other authors declared no competing interests for this work.
AUTHOR CONTRIBUTIONS
T.K.C., H.A.L., S.I.P., D.Y.O., K.W.L., J.W.K., J.H.K., A.W., S.J.L., Y.J.B., and H.L. wrote the manuscript. T.K.C., H.A.L., and H.L. designed the research. D.Y.O., K.W.L., J.W.K., J.H.K., A.W., S.J.L., Y.J.B., S.I.P., and H. L. performed the research. T.K.C., H.A.L., and H.L. analyzed the data.
Supporting information
Supplementary Material
ACKNOWLEDGMENTS
The authors thank GC Pharma for providing the data and information, such as concentrations of GC1118 and the clinical information of patients enrolled in a phase I study, which enabled us for modeling the population pharmacokinetics of GC1118. This work was presented in part at 2019 American Association of Pharmaceutical Sciences PharmSci 360. 28
Chung and Lee authors contributed equally to the present work.
Funding information
The present work was supported by a research grant from GC Pharma, Korea.
REFERENCES
- 1. Sasaki T, Hiroki K, Yamashita Y. The role of epidermal growth factor receptor in cancer metastasis and microenvironment. Biomed Res Int. 2013;2013:546318. [DOI] [PMC free article] [PubMed] [Google Scholar]
- 2. Yewale C, Baradia D, Vhora I, Patil S, Misra A. Epidermal growth factor receptor targeting in cancer: a review of trends and strategies. Biomaterials. 2013;34(34):8690‐8707. [DOI] [PubMed] [Google Scholar]
- 3. Voldborg BR, Damstrup L, Spang‐Thomsen M, Poulsen HS. Epidermal growth factor receptor (EGFR) and EGFR mutations, function and possible role in clinical trials. Ann Oncol. 1997;8(12):1197‐1206. [DOI] [PubMed] [Google Scholar]
- 4. Dassonville O, Bozec A, Fischel JL, Milano G. EGFR targeting therapies: monoclonal antibodies versus tyrosine kinase inhibitors. Similarities and differences. Crit Rev Oncol Hematol. 2007;62(1):53‐61. [DOI] [PubMed] [Google Scholar]
- 5. Trivedi S, Srivastava RM, Concha‐Benavente F, et al. Anti‐EGFR targeted monoclonal antibody isotype influences antitumor cellular immunity in head and neck cancer patients. Clin Cancer Res. 2016;22(21):5229‐5237. [DOI] [PMC free article] [PubMed] [Google Scholar]
- 6. Lim Y, Yoo J, Kim MS, et al. GC1118, an Anti‐EGFR antibody with a distinct binding epitope and superior inhibitory activity against high‐affinity EGFR ligands. Mol Cancer Ther. 2016;15(2):251‐263. [DOI] [PubMed] [Google Scholar]
- 7. Oh DY, Lee KW, Han SW, et al. A first in human phase 1 study of GC1118, a novel anti‐EGFR antibody, in patients with advanced solid tumors. Oncologists. 2019;24(8):1037‐e636. [DOI] [PMC free article] [PubMed] [Google Scholar]
- 8. Park WS, Han S, Lee J, et al. Use of a target‐mediated drug disposition model to predict the human pharmacokinetics and target occupancy of GC1118, an anti‐epidermal growth factor receptor antibody. Basic Clin Pharmacol Toxicol. 2017;120(3):243‐249. [DOI] [PubMed] [Google Scholar]
- 9. Lee SN, Cho HJ, Lim YM, et al. GC1118, a new anti‐EGFR antibody overcomes acquired resistance to cetuximab in colorectal cancer xenograft model. In Proceedings of the Annual Meeting of the American Association for Cancer Research. 16‐20 (2016).
- 10. Cao Y, Jusko WJ. Incorporating target‐mediated drug disposition in a minimal physiologically‐based pharmacokinetic model for monoclonal antibodies. J Pharmacokinet Pharmacodyn. 2014;41(4):375‐387. [DOI] [PMC free article] [PubMed] [Google Scholar]
- 11. John T, Liu G, Tsao MS. Overview of molecular testing in non‐small‐cell lung cancer: mutational analysis, gene copy number, protein expression and other biomarkers of EGFR for the prediction of response to tyrosine kinase inhibitors. Oncogene. 2009;28(suppl 1):S14‐S23. [DOI] [PubMed] [Google Scholar]
- 12. Peletier LA, Gabrielsson J. Dynamics of target‐mediated drug disposition: characteristic profiles and parameter identification. J Pharmacokinet Pharmacodyn. 2012;39(5):429‐451. [DOI] [PMC free article] [PubMed] [Google Scholar]
- 13. Lowe PJ, Tannenbaum S, Wu K, Lloyd P, Sims J. On setting the first dose in man: quantitating biotherapeutic drug‐target binding through pharmacokinetic and pharmacodynamic models. Basic Clin Pharmacol Toxicol. 2010;106(3):195‐209. [DOI] [PubMed] [Google Scholar]
- 14. Mager DE. Target‐mediated drug disposition and dynamics. Biochem Pharmacol. 2006;72(1):1‐10. [DOI] [PubMed] [Google Scholar]
- 15. Keizer RJ, Karlsson MO, Hooker A. Modeling and simulation workbench for NONMEM: tutorial on Pirana, PsN, and Xpose. CPT Pharmacometrics Syst Pharmacol. 2013;2:e50. [DOI] [PMC free article] [PubMed] [Google Scholar]
- 16. Lindbom L, Pihlgren P, Jonsson N. PsN‐Toolkit–a collection of computer intensive statistical methods for non‐linear mixed effect modeling using NONMEM. Comput Methods Programs Biomed. 2005;79(3):241–257. [DOI] [PubMed] [Google Scholar]
- 17. Shin DM, Donato NJ, Perez‐Soler R, et al. Epidermal growth factor receptor‐targeted therapy with C225 and cisplatin in patients with head and neck cancer. Clin Cancer Res. 2001;7(5):1204‐1213. [PubMed] [Google Scholar]
- 18. Weiner LM, Belldegrun AS, Crawford J, et al. Dose and schedule study of panitumumab monotherapy in patients with advanced solid malignancies. Clin Cancer Res. 2008;14(2):502‐508. [DOI] [PubMed] [Google Scholar]
- 19. Douillard JY, Siena S, Cassidy J, et al. Randomized, phase III trial of panitumumab with infusional fluorouracil, leucovorin, and oxaliplatin (FOLFOX4) versus FOLFOX4 alone as first‐line treatment in patients with previously untreated metastatic colorectal cancer: the PRIME study. J Clin Oncol. 2010;28(31):4697‐4705. [DOI] [PubMed] [Google Scholar]
- 20. Lin JH. Species similarities and differences in pharmacokinetics. Drug Metab Dispos. 1995;23(10):1008‐1021. [PubMed] [Google Scholar]
- 21. Thomas VA, Balthasar JP. Understanding inter‐individual variability in monoclonal antibody disposition. Antibodies (Basel). 2019;8(4):56. [DOI] [PMC free article] [PubMed] [Google Scholar]
- 22. TU Consortium . UniProt: a worldwide hub of protein knowledge. Nucleic Acids Res. p. D506–D515 (2019). [DOI] [PMC free article] [PubMed]
- 23. Vallbohmer D, Lenz HJ. Epidermal growth factor receptor as a target for chemotherapy. Clin Colorectal Cancer. 2005;5(suppl 1):S19‐S27. [PubMed] [Google Scholar]
- 24. Castellano JM, Deane R, Gottesdiener AJ, et al. Low‐density lipoprotein receptor overexpression enhances the rate of brain‐to‐blood Abeta clearance in a mouse model of beta‐amyloidosis. Proc Natl Acad Sci USA. 2012;109(38):15502‐15507. [DOI] [PMC free article] [PubMed] [Google Scholar]
- 25. Singh AP, Krzyzanski W, Martin SW, et al. Quantitative prediction of human pharmacokinetics for mAbs exhibiting target‐mediated disposition. AAPS J. 2015;17(2):389‐399. [DOI] [PMC free article] [PubMed] [Google Scholar]
- 26. Peletier LA, Gabrielsson J. Dynamics of target‐mediated drug disposition. Eur J Pharm Sci. 2009;38(5):445‐464. [DOI] [PubMed] [Google Scholar]
- 27. An G. Concept of pharmacologic target‐mediated drug disposition in large‐molecule and small‐molecule compounds. J Clin Pharmacol. 2020;60(2):149‐163. [DOI] [PMC free article] [PubMed] [Google Scholar]
- 28. Chung TK, Lee HA, Park SI, et al. T1330–13‐88‐ A Target‐Mediated Drug Disposition Population Pharmacokinetic Model of GC1118, a Novel Anti‐epidermal Growth Factor Receptor Antibody, in Patients with Refractory Solid Tumors. 2019 AAPS PharmSci 360; San Antonio, Texas (2019).
Associated Data
This section collects any data citations, data availability statements, or supplementary materials included in this article.
Supplementary Materials
Supplementary Material