

Abstract
Purpose:
The aim of this study is to characterize and compare changes in gene expression patterns of paired axillary lymph node (ALN) metastases from estrogen receptor (ER) positive and triple negative (TNBC) primary breast cancer (PBC).
Methods:
Patients with stage 2-3 PBC with macrometastasis to an ALN were selected. Gene expression of 2,567 cancer-associated genes was analyzed with the HTG EdgeSeq system coupled with the Illumina Next Generation Sequencing (NGS) platform. Changes in gene expression between ER/PR positive, HER2 negative PBC and their paired ALN metastases were compared with TNBC and their paired ALN metastases.
Results:
Fourteen pairs of ER positive and paired ALN metastasis were analyzed. Compared with the PBC, ALN metastasis had 673 significant differentially expressed genes, including 348 upregulated genes and 325 downregulated genes. Seventeen pairs of TNBC and paired ALN metastasis were analyzed. ALN metastasis had 257 significant differentially expressed genes, including 123 upregulated genes and 134 downregulated genes. When gene expression of the ALN for ER positive PBC was compared to that of TNBC, 97 genes were upregulated in both, and 115 genes were similarly downregulated. Common upregulated genes were associated with cell death, necrosis, and homeostasis. Common downregulated genes were those of migration, degradation of extracellular matrix, and invasion.
Conclusion:
Although ER positive PBC and TNBC have a distinct gene expression profiles and distinct changes from PBC to ALN metastases, a significant number of genes are similarly up- or downregulated. Understanding the role of these common genomic changes may provide clues to understanding the metastatic process itself.
Keywords: Gene expression, estrogen receptor positive breast cancer, triple negative breast cancer, lymph node metastasis
Introduction
Axillary lymph node (ALN) metastases often guide breast cancer treatment and prognosis, but are early manifestations of cancer spread. Understanding the genomics of this early spread may provide clues to understanding the metastatic process itself. While estrogen receptor (ER) positive breast cancer comprises the majority of all breast cancer, triple-negative breast cancer (TNBC) is an important subtype that comprises 10-15% of all breast cancer. Similar rates of nodal metastasis occur between these two very different breast cancer subtypesi. Understanding lymph node metastasis could aid not only in understanding breast cancer biology, but also in developing new therapies ii, iii, iv, v, vi.
To date, there have been few studies comparing the genomics of primary breast cancer (PBC) of different subtypes with their axillary metastases. Prior research evaluating gene expression of primary breast cancer (PBC) with paired lymph node metastases had inconsistent outcomes and rarely evaluated patients with TNBC. For the studies that did include TNBC, pooled data was used, and biomarker profile was not controlled for.
The objective of this study was to characterize and compare changes in gene expression patterns of paired ALN metastases from ER positive and triple-negative PBC and to identify common genomic patterns that may provide clues to understanding the metastatic process
Methods
Patient Selection -
After Institutional Review Board (IRB) approval, a prospectively maintained database was searched from January 2007 to December 2016 to identify patients with stage 2-3 invasive ductal carcinoma (IDC) with lymph node macrometastasis. According to the American Society of Clinical Oncology (ASCO) and College of American Pathologists guidelines, tumors that were estrogen receptor positive, progesterone receptor positive, and HER2-neu negative were classified as “ER positive”. Tumors that were estrogen receptor negative, progesterone receptor negative, and HER2-neu negative were classified as “triple negative” and were further selected for inclusion in the studyvii. ER and PR expression was determined by immunohistochemistry with tumors expressing ER in ≥ 1% of tumor cells or PR in ≥ 1% of tumor cells, respectively.
As previously described in our methods from our institution on gene expressionviii, the sentinel lymph node was selected for the study if a sentinel node biopsy was performed and it harbored metastasis. When an axillary lymph node dissection was performed, the lymph node with the largest macrometastasis was selected for the study. Additional patient inclusion criteria included primary breast cancer tumor size <5cm and lymph node metastasis tumor size >5mm. Patients were excluded if they received neoadjuvant chemotherapy or hormonal therapy, had distant metastatic disease at diagnosis, or a personal history of a previous primary breast cancer.
Tissue Samples -
Formalin fixed paraffin embedded (FFPE) tissue blocks of the primary breast cancer (PBC) and paired (from the same patient) lymph node metastasis were selected. Unstained FFPE tissue sections of the PBC and lymph node metastasis were cut at 4μm thickness and mounted onto glass slides. Using visualization under the microscope, the tumor area was marked by a pathologist on a corresponding Hematoxylin & Eosin (H&E) stained section for both the PBC and the paired lymph node metastasis. The tissue was submitted to HTG for further processing, where the tissue was removed from the marked section and placed into the HTG lysis buffer (see methods below)viii.
HTG EdgeSeq combined with Next Generation Sequencing (NGS)
As previously reportedviii, HTG EdgeSeq system combines HTG’s proprietary quantitative nuclease protection assay (qNPA) chemistry with Illumina Next Generation Sequencing (NGS) platform to enable a semi-quantitative analysis of a panel of targeted genes in a single assay. This allows for mRNA quantization without nucleic acid extraction. Samples are added to the HTG lysis buffer. Functional DNA nuclease protection probes (NPPs) flanked by universal sequences were hybridized to target RNAs. Universal DNA wingmen probes were hybridized to the wings to prevent S1 nuclease digestion. Next, S1 nuclease was added to digest excess non-hybridized DNA probes and non-hybridized RNA. Heat denaturation was used to release the protection probes from the DNA:RNA duplexes. Target capture was performed with polymerase chain reaction (PCR) amplification and barcoding. Sequencing was performed using Illumina NextSeq platform. All samples passed HTG post-sequencing metricsix.
HTG EdgeSeq Oncology Biomarker Panel
An HTG EdgeSeq oncology biomarker panel which is an assay containing probes for 2,567 genes, including 15 housekeeper genes, four negative process controls, and four positive process controls was selected for use on each PBC and lymph node metastasis tumorx.
Data Analysis
As describedviii, data was returned from the sequencer as a demultiplexed FASTQ file, with four files per original assay well. The relative expression abundances of genes were calculated as Count-Per-Million (CPM) within each sample. This result allows for evaluation of gene expression as a proportion of total counts on a sample level. Fifteen genes with average abundance less than 5 CPM were filtered out. Read counts of remaining 2,544 genes were used to calculate scaling factors with trimmed mean of M-value (TMM) method for normalization. The differential expression (DE) analysis were performed by fitting a negative binomial generalized log-linear model for each gene using the edgeR package (v 3.24.3)x. For the comparison between ALN and PBC, the DE analysis was adjusted by patients. The p-values of multiple tests were adjusted using Benjamini-Hochberg’s methodxii and the significant level is designed as false discovery rate (FDR) <0.05.
Statistical Analysis
The upregulation and downregulation of genes were reviewed and the fold change (FC) was defined as the ratio of the normalized intensity of axillary lymph node metastasis to normalized intensity in the PBC. A FC >1 meant genes were upregulated in the ALN compared to the PBC. A FC between 0 and 1 meant genes were downregulated in the ALN compared to the PBC. Genes expression was considered significantly differentially expressed if they had an adjusted p-value, FDR <0.05. The functions of the differentially expressed genes were retrieved using National Center for Biotechnology Information (NCBI) genomic data source.
For Table 1 and 2, numerical variables were summarized by median and range, and compared across groups by the Wilcoxon rank sum test (exact version). Categorical variables were summarized by frequency and percentage and were compared across groups by the Fisher exact test. A two-sided 0.005 significance was used throughout. SAS version 9.4 (SAS Institute, Cary, North Carolina) was used for statistical calculations.
Table 1:
Clinical and Tumor Characteristics
| All patients (N = 31) |
ER positive (N = 14) |
TNBC (N = 17) |
P value | |
|---|---|---|---|---|
| Age (years), median, (range) | 62 (30-88) | 61 (35-79) | 62 (30-88) | 0.72 |
| Type of operation | 0.64 | |||
| Partial mastectomy | 26 (83.9) | 11 (78.6) | 15 (88.2) | |
| Mastectomy | 5 (16.1) | 3 (21.4) | 2 (11.8) | |
| Histology | ||||
| IDC | 31 (100.0) | 14 (100.0) | 17 (100.0) | - |
| Subtype | ||||
| ER positive | 14 (45.2) | 14 (100.0) | 0 (0.0) | - |
| TNBC | 17 (54.8) | 0 (0.0) | 17 (100.0) | - |
| Grade | 0.01 | |||
| Well differentiated | 1 (3.2) | 1 (7.1) | 0 (0.0) | |
| Moderately differentiated | 14 (45.2) | 10 (71.4) | 4 (23.5) | |
| Poorly differentiated | 16 (51.6) | 3 (21.4) | 13 (76.5) | |
| Tumor size (cm), median (range) | 2.4 (1.2-4.5) | 2.2 (1.2-4.5) | 2.5 (1.2-4.0) | 0.06 |
| Focality | 0.31 | |||
| Single focus | 17 (54.8) | 11 (78.6) | 16 (94.1) | |
| Multifocal | 4 (12.9) | 3 (21.4) | 1 (5.9) | |
| LVI | 19 (61.3) | 6 (42.9) | 13 (76.5) | 0.08 |
| DCIS | 28 (90.3) | 13 (92.9) | 15 (88.2) | 0.99 |
| Size DCIS (cm), median (range) | 1.4 (0.1-4.0) | 1.2 (0.3-3.0) | 2.5 (0.1-4.0) | 0.59 |
| Ki-67 (%), median (range) | 15 (1-86) | 15 (2-53) | 70 (1-86) | 0.007 |
| Low (<11%) | 8 (25.8) | 6 (42.9) | 2 (11.8) | 0.043 |
| Intermediate (11-20%) | 6 19.4) | 3 (21.4) | 3 (17.7) | |
| High (>20%) | 17 (54.8) | 5 (35.7) | 12 (70.6) | |
| Genetic Mutation | 0.23 | |||
| BRCA1 | 3 (9.7) | 0 (0.0) | 3 (17.6) | |
| BARD1 | 1 (3.2) | 0 (0.0) | 1 (5.9) | |
| Pathologic T Stage | 0.41 | |||
| 1 | 8 (25.8) | 5 (35.7) | 3 (17.6) | |
| 2 | 23 (74.2) | 9 (64.3) | 14 (82.4) | |
| Pathologic N Stage | 0.61 | |||
| 1 | 26 (83.9) | 13 (92.9) | 13 (76.5) | |
| 2 | 4 (12.9) | 1 (7.1) | 3 (17.7) | |
| 3 | 1 (3.2) | 0 (0.0) | 1 (5.9) | |
| Stage | 0.34 | |||
| 2 | 26 (83.9) | 13 (92.9) | 13 (76.5) | |
| 3 | 5 (16.2) | 1 (7.1) | 4 (23.5) |
Abbreviations: ER, Estrogen Receptor; SNB, Sentinel Lymph Node Biopsy; ALND, Axillary Lymph Node Dissection; IDC, Intraductal carcinoma; TNBC, Triple negative breast cancer; LVI, lymphovascular invasion; DCIS, Ductal carcinoma in situ; LN, lymph node
Table 2:
Lymph Node Characteristics
| All patients (N = 31) |
ER positive (N = 14) |
TNBC (N = 17) |
P value | |
|---|---|---|---|---|
| Axillary operation | 0.046 | |||
| SNB | 13 (41.9) | 7 (50.0) | 6 (35.3) | |
| ALND | 9 (29.0) | 1 (7.1) | 8 (47.1) | |
| SNB + ALND | 9 (29.0) | 6 (42.9) | 3 (17.6) | |
| Axillary Lymph Node metastasis | 31 (100.0) | 14 (100.0) | 17 (100.0) | - |
| Number LN sampled, average (range) | 7 (1-20) | 4 (1-17) | 13 (1-20) | 0.01 |
| Number positive LN, median (range) | 2 (1-7) | 2 (1-7) | 2 (1-4) | 0.07 |
| LN tumor size (cm), median (range) | 0.9 (0.5-2.5) | 0.8 (0.5-1.1) | 1.0 (0.6-2.5) | 0.11 |
| Extranodal extension | 17 (54.8) | 9 (64.3) | 8 (47.1) | 0.47 |
| Size extranodal extension (cm), median (range) | 0.2 (0.1-0.5) | 0.2 (0.1-0.5) | 0.4 (0.25-0.6) | 0.02 |
| SLN used | 16 (51.6) | 8 (57.1) | 8 (47.1) | 0.72 |
Abbreviations: SNB, Sentinel Lymph Node Biopsy; ALND, Axillary Lymph Node Dissection; IDC, Intraductal carcinoma; TNBC, Triple negative breast cancer; LVI, lymphovascular invasion; DCIS, Ductal carcinoma in situ; LN, lymph node
Comparison
Changes in gene expression between the 14 pairs of ER positive PBC and their paired ALN metastases were compared with the 17 pairs of TNBC and their paired ALN metastases. For common upregulated and downregulated genes, the fold change is reported for the TNBC compared to the ER positive PBC.
Reactome Analysis and Canonical Pathways
Reactome is a curated database of pathways and reactions in human biology, and defines a “reaction” as any event in biology that changes the state of a biological moleculexiii. Binding, activation, translocation, degradation and classical biochemical events involving a catalyst are all reactions. Reactome’s annotated data describe reactions possible if all annotated proteins and small molecules were present and active simultaneously in a cell. By overlying an experimental dataset on these annotations, a pathway analysis is performed. A binomial test is used to calculate the probability shown for each result, and the p-values are corrected for the multiple testing (Benjamani-Hochberg procedure) that arises from evaluating the submitted list of identifiers against every pathway. A reactome analysis for common genes of ER positive and TNBC was performed. For canonical pathways the “Common Genes” analysis predicts the downstream biological processes, which are increased or decreased based on input dataxiv. All analyses were carried out with differentially expressed genes with an FDR <0.05.
Results
Clinicopathologic Characteristics
When comparing women with ER positive to those with TNBC, there was no difference between the groups in age (61 years ER positive vs. 62 years TNBC, p=0.72) or median PBC tumor size (2.2 cm ER positive vs. 2.5 cm TNBC, p=0.06). The majority of patients had stage 2 disease (92.9% ER positive vs. 76.5% TNBC, p=0.34). Additional clinical and pathologic characteristics are shown in Table 1. Median lymph node tumor size was 0.9 cm (0.8 cm ER positive vs. 1.0cm TNBC, p=0.11). Sixteen (51.6%) patients had a SLN with metastasis examined, and 15 (48.4%) patients had a positive non-sentinel axillary node examined [Table 2].
ALN compared to PBC – ER Positive
14 pairs of primary estrogen receptor positive and paired ALN metastases were analyzed for 2,567 cancer-associated genes [Figure 1]. Compared with the PBC, ALN metastases had 673 statistically significant differentially expressed genes, including 348 upregulated genes and 325 downregulated genes [Figure 2]. There were 60 upregulated genes that had log2FC ≥2.00 FC gene expression and 29 downregulated genes that had log2FC ≤−2.00 FC in gene expression, which is shown in Table 3.
Figure 1.
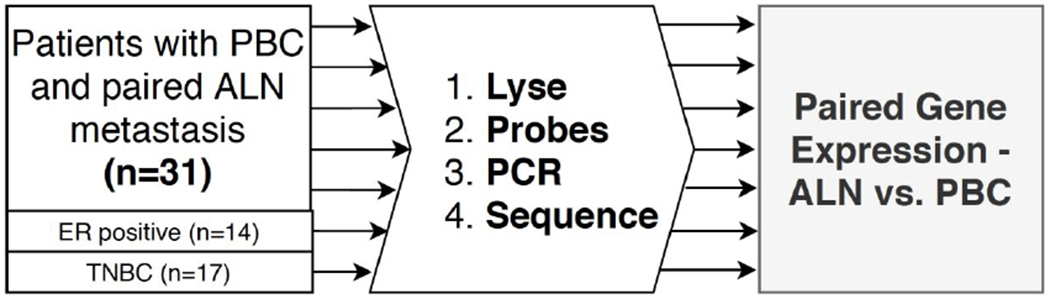
Methods for Paired Gene Expression Analysis
Abbreviations: PBC, Primary breast cancer; ALN, Axillary lymph node; ER, Estrogen receptor; TNBC, Triple negative breast cancer PCR, Polymerase chain reaction
Figure 2.

Venn Diagram of the 718 Differentially Expressed Genes Estrogen Receptor (ER) positive and Triple Negative Breast Cancer (TNBC)
A white color gradient (top) represents the upregulated genes, and a black color gradient (bottom) represents the downregulated genes. The circles of the diagram represent ER positive (left) and TNBC (right). There were 718 differentially expressed genes whose expression was statistically significant. From that group, 97 genes were upregulated in both tumor types (top middle), and 115 genes were similarly downregulated (bottom middle). In ER positive primary breast cancer, axillary lymph node (ALN) metastasis had 251 uniquely upregulated genes (top left), and 210 uniquely downregulated genes (bottom left). In TNBC, ALN metastasis had 26 genes uniquely upregulated genes (top right), and 19 uniquely downregulated genes (bottom right).
Table 3:
Five most common Upregulated and Downregulated Genes with at least a two log2 fold-change in gene expression in Lymph Node Metastasis Compared with PBC
| Estrogen Receptor Positive | Triple Negative Breast Cancer | ||||||
|---|---|---|---|---|---|---|---|
| Gene | Log2 Fold-Change | Fold-Change | FDR | Gene | Log2 Fold-Change | Fold-Change | FDR |
| CCL21 | 4.52 | 22.92 | <0.001 | CCL21 | 3.38 | 10.38 | <0.001 |
| CCL19 | 3.07 | 8.37 | <0.001 | CACNA2D3 | 3.03 | 8.16 | 0.003 |
| CD19 | 3.02 | 8.08 | <0.001 | CD19 | 2.34 | 5.07 | <0.001 |
| LTB | 2.78 | 6.85 | <0.001 | FCER2 | 2.26 | 4.78 | <0.001 |
| FCER2 | 2.77 | 6.82 | <0.001 | PGC | 2.24 | 4.72 | <0.001 |
| KRT17 | −3.22 | 0.11 | <0.001 | COL6A6 | −2.60 | 0.17 | <0.001 |
| FGF5 | −3.53 | 0.09 | <0.001 | SFRP2 | −2.70 | 0.16 | <0.001 |
| SFRP2 | −3.54 | 0.09 | <0.001 | COL17A1 | −3.29 | 0.10 | 0.004 |
| KRT14 | −3.62 | 0.08 | <0.001 | CHRNA1 | −3.94 | 0.07 | 0.023 |
| COL17A1 | −3.95 | 0.06 | <0.001 | FGF5 | −5.36 | 0.02 | <0.001 |
ALN compared to PBC – TNBC
Seventeen pairs of PBC and paired ALN metastases were analyzed for 2,567 cancer-associated genes [Figure 1]. As previously published, “Compared with the PBC, ALN metastases had 257 statistically significant differentially expressed genes, including 123 upregulated genes and 134 downregulated genes [Figure 2]. There were 5 upregulated genes that had log2FC ≥2.00 FC gene expression and 9 downregulated genes that had log2FC ≤−2.00 FC in gene expression, which is shown in Table 3.”viii
Common Upregulated Genes: ALN compared to PBC
When gene expression of the ALN for ER positive PBC was compared to that of TNBC, 97 genes were upregulated in both tumor types [Figure 2]. Common upregulated genes were associated with cell death, necrosis, and homeostasis [Figure 3b]. This included TNFSF11 (FC 3.00, FDR =0.008) and LTB (FC 2.68, FDR <0.001) which are important for tumor necrosis factor receptor binding. There were 3 common upregulated genes that had log2FC ≥2.00 in gene expression. These genes were CCL21 (FC 10.38, FDR <0.001), CD19 (FC 5.07, FDR <0.001), and FCER2 (FC 4.78, FDR <0.001). [Table 3]. Notably, there was a common upregulation of genes related to chemotaxis, which additionally included CCL19 (FC 3.19, FDR <0.001), TNFSF11 (FC 3.00, FDR=0.008). and CXCL13 (FC 2.97, FDR <0.001).
Figure 3.


Reactome Analysis and Canonical Pathways of breast cancer cells in the axillary lymph node (ALN) compared to the primary breast cancer (PBC) for common genes in ER positive compared with TNBC. 3a. Reactome analysis of common genes colored by gene coverage. 3b. Canonical pathways of common genes by biologic function. Activation z-scores represent the activation (positive values in orange) or inhibition (negative values in blue) of cellular functions.
Common Downregulated Genes: ALN compared to PBC
When gene expression of the ALN for ER positive PBC was compared to that of TNBC, 115 genes were downregulated in both tumor types [Figure 2]. Common downregulated genes were those of migration, degradation of extracellular matrix, and invasion [Figure 3b], which include downregulated genes: MMP2 (fold change (FC) −2.1, FDR<0.01), MMP3 (FC −2.1, p<0.01), COL17A1 (FC −3.2, FDR<0.01), COL6A6 (FC −2.5, FDR<0.01), and COL11A1 (FC − 2.0, FDR<0.01). Other common downregulated genes included FGF5 (FC −5.4, FDR<0.01) which is a fibroblast growth factor related to cell survival, SFRP2 (FC −2.7, FDR <0.01) which is has a role in regulating cell growth as modulators of Wnt signaling, and WNT2 (FC −2.3, FDR <0.01) which is a signaling protein related to oncogenesis. There were 8 common downregulated genes that had log2FC <−2.00 in gene expression which include FGF5 (FC 0.02, FDR <0.001), COL17A1 (FC 0.10, FDR=0.005), SFRP2 (FC 0.16, FDR <0.001), COL6A6 (FC 0.17, FDR <0.001), WNT2 (FC 0.20, FDR <0.001), MMP2 (FC 0.23, FDR <0.001), MMP3 (FC 0.24, FDR <0.001), and COL11A1 (FC 0.24, FDR <0.001). A notable feature of common downregulated genes was the regulation of cell microenvironment interaction, which included several additional Matrix Metallopeptidases (MMP 7, MMP 11, MMP14) and Collagens (COL1A1, COL1A2, COL3A1, COL5A1, COL5A2, COL6A6). Reactome analysis showing gene coverage for significant common genes shows involvement of several pathways including the immune system and signal transduction [Figure 3a].
Unique Upregulated and Downregulated Genes: ALN compared to ER positive PBC
Compared with the ER positive PBC, ALN metastasis had 251 uniquely upregulated genes [Figure 2]. There were 12 unique upregulated genes that had log2FC ≥2.00 in gene expression which include CD5 (FC 2.75, FDR <0.001), KLRB1 (FC 2.59, FDR<0.001), CXCL9 (FC 2.59, FDR <0.001), CD79A (FC 2.56, FDR <0.001), and LAT (FC 2.44, FDR <0.001). Compared with the ER positive PBC, ALN metastasis had 210 uniquely downregulated genes. There were 6 unique downregulated genes that had log2FC <−2.00 in gene expression which include KRT14 (FC −3.6, FDR <0.001), KRT5 (FC −3.06, FDR <0.001), SERPINE1 (FC −2.31, FDR <0.001), KLK4 (FC −2.07, FDR <0.001), MIA (FC −1.07, FDR,0.001, and EGR1 (FC −2.02, FDR<0.001).
Unique Upregulated and Downregulated Genes: ALN compared to TNBC
Compared with TNBC, ALN metastasis had 26 uniquely upregulated genes [Figure 2]. There were only 2 unique upregulated genes that had log2FC ≥2.00 in gene expression which include CACNA2D3 (FC 8.16, FDR=0.003) and PGC (FC 4.72, FDR<0.001). Compared with TNBC, ALN metastasis had 29 uniquely downregulated genes. CHRNA1 (FC 0.07, FDR=0.023) was the only uniquely downregulated gene that had log2FC <−2.00 in gene expression.
Changes in Gene Expression by Tumor Subtype
There were no genes that were upregulated in ER positive PBC that were downregulated in TNBC. Similarly, there were no genes that were downregulated in ER positive PBC that were upregulated in TNBC.
Discussion
Gene expression studies for breast cancer contribute to understanding breast cancer biology and the metastatic process. Additional contributions include drug development and the development of prognostic gene expression signaturesxv. Early studies on gene expression of primary breast cancer compared PBC to paired distant organ metastasis and often showed similar gene expression and identified potential markers for breast cancer metastasisxvi, xvii, xviii. More recently, several studies have analyzed gene expression of primary breast cancer compared with paired lymph node metastasis. While these studies had variable results on important genes for tissue modeling and cell cycle regulators, they did not evaluate the breast cancer subtype and receptor profiles used which may have meaningful differences in gene expressionxix, xx, xxi, xxii.
Smeets et al. analyzed 96 pairs of PBC and paired lymph node metastasis for patients with estrogen receptor positive invasive ductal carcinoma. In the 241 genes that they evaluated, they found that genes related to apoptosis, protein phosphorylation, and zinc chelation had changes in gene expression compared to patients without lymph node metastasis.xxiii. They demonstrated an upregulation of genes related to apoptosis in the lymph node positive group. Our study similarly showed an upregulation of common differentially expressed genes in both ER positive and TNBC related to cell death and necrosis. Genes related to chemotaxis were commonly upregulated in both ER positive and TNBC, similar to our previous findingsviii. When examining common downregulated genes in ER positive and TNBC, genes related to migration, survival, and cell microenvironment interaction showed underexpression.
Most genomic expression analysis studies on TNBC to metastatic disease has been of distant metastases, and rarely lymph node metastasesxxiv,xxv,xxvi. Our study not only compares common gene expression in ER positive and triple negative IDC that has metastasized to axillary lymph nodes, but also evaluates genes that are uniquely expressed in each PBC receptor subtype. Two genes, CACNA2D3 and PGC are uniquely upregulated in TNBC, and a single gene CHRNA1 is uniquely downregulated. These genes that are not differentially expressed in ER positive tumors, may help to differentiate the tumor subtypes using gene expression and be important prognostic indicators unique to TNBC. This finding highlights the importance of gene expression analysis by receptor subtype.
Another important finding of our study, is that no genes that were upregulated in ER positive PBC were downregulated in TNBC, and the converse is similarly true. This finding emphasizes that although there are unique patterns in gene expression for ER positive and TNBC, there are importantly a significant number of genes that are similarly up or down regulated.
Our study has several limitations. The sample size was small because it is challenging to locate patients at with TNBC who were not treated with neoadjuvant therapy. A micro-dissection method for tissue isolation limits contamination of lymphoid cells and include primarily tumor cells. A limitation of Next Generation Sequencing includes variable results due to differences in the number of genes evaluated and the heterogeneity of breast and metastatic tumor samples.
Conclusion
Although ER positive PBC and TNBC have a distinct gene expression profiles and distinct changes from PBC to ALN metastases, a significant number of genes are similarly up or down regulated. Understanding the role of these common genomic changes may provide clues to understanding the metastatic process itself.
Acknowledgements:
Armando E. Giuliano is supported by the Fashion Footwear Charitable Foundation of New York, Inc., the Margie and Robert E. Petersen Foundation, and Linda and Jim Lippman. Xiaojiang Cui is supported by National Institutes of Health (2R01CA151610) and Department of Defense (W81XWH-18-1-0067), Samuel Oschin Cancer Institute Discovery Fund Award, and Community Outreach and Engagement Developmental Fund Award. The funders had no role in study design, data collection and analysis, decision to publish, or preparation of the manuscript.
Footnotes
Meeting Presentation: Presented at the annual meeting of the Society of Surgical Oncology (SSO), virtual podium presentation, August 2020.
Conflict of Interest Statement: All authors have no conflicts of interest or other disclosures.
References:
- i.Howlader N, Altekruse SF, Li CI, Chen VW, Clarke CA, Ries LAG, Cronin KA. US incidence of breast cancer subtypes defined by joint hormone receptor and HER2 status. Journal of the National Cancer Institute. 2014. 106(5): 1–8. [DOI] [PMC free article] [PubMed] [Google Scholar]
- ii.Dings PJ, Elferink MA, Stobbe LJ, de Wilt JH. The prognostic value of lymph node ratio in node-positive breast cancer: a Dutch nationwide population-based study. Annals of Surgical Oncology. 2013. 20(8): 2607–14. [DOI] [PubMed] [Google Scholar]
- iii.Liao GS, Chou YC, Golshan M, Hsu HM, Hong ZJ, Yu JC, Zhu JH. Prognostic value of the lymph node ratio in breast cancer subtypes. American Journal of Surgery. 2015. 210(4):749–54. [DOI] [PubMed] [Google Scholar]
- iv.O’Brien KM, Cole SR, Tse CK, et al. Intrinsic breast tumor subtypes, race, and long-term survival in the Carolina breast cancer study. Clin Cancer Res. 2010. 16(24):6100–10. [DOI] [PMC free article] [PubMed] [Google Scholar]
- v.Jang N, Choi JE, Kang SH, Bae YK. Validation of the pathological prognostic staging sytem proposed in the revised eighth edition of the AJCC staging manual in different molecular subtypes of breast cancer. Virchows Arch. 2019. 474(2):193–200. [DOI] [PubMed] [Google Scholar]
- vi.Yates LR, Desmedt C. Translational genomics: practical applications of the genomic revolution in breast cancer. Clin Cancer Res. 2017. 23(11):2630–2639. [DOI] [PubMed] [Google Scholar]
- vii.Wolff AC, Hammond ME, Hicks DG, et al. Recommendations for human epidermal growth factor receptor 2 testing in breast cancer: American Society of Clinical Onocology/College of American Pahtologists clinical practice guideline update. J Clin Oncol. 2013. 31(31):3997–4013. [DOI] [PubMed] [Google Scholar]
- viii.Srour MK, Gao B, Dadmanesh F, et al. Gene expression comparison between primary triple-negative breast cancer and paired axillary and sentinel lymph node metastasis. Breast J 2020;26(5):904–910. [DOI] [PMC free article] [PubMed] [Google Scholar]
- ix.Schwartz M, Kremer J. Verio Laboratory Services: HTG EdgeSeq oncology biomarker panel. 2018. [Google Scholar]
- x.Robinson MD, McCarthy DJ and Smyth GK. edgeR: a Bioconductor package for differential expression analysis of digital gene expression data. Bioinformatics 2010; 26(1): 139–140. [DOI] [PMC free article] [PubMed] [Google Scholar]
- xii.Benjamini Y and Hochberg Y. Controlling the false discovery rate: a practical and powerful approach to multiple testing. Journal of the Royal Statistical Society Series B (Methodological) 1995; 57: 289–300. [Google Scholar]
- xiii.“Reactome: Pathway Analysis Report”. Version 68. https://reactome.org/PathwayBrowser/#/ANALYSIS=MjAxOTA0MzAxNTMwNDBfMTQz . Accessed April 30, 2019.
- xiv.Fabregat Antonio, Sidiropoulos Konstantinos, Garapati Phani, Gillespie Marc, Hausmann Kerstin, Haw Robin, Jassal Bijay, Jupe Steven, Korninger Florian, McKay Sheldon, Matthews Lisa, May Bruce, Milacic Marija, Rothfels Karen, Shamovsky Veronica, Webber Marissa, Weiser Joel, Williams Mark, Wu Guanming, Stein Lincoln, Hermjakob Henning, D’Eustachio Peter, The Reactome pathway Knowledgebase, Nucleic Acids Research, 44, Issue D1, 4 January 2016, Pages D481–D487. [DOI] [PMC free article] [PubMed] [Google Scholar]
- xv.Perou CM, Sorlie T, Eisen MB et al. Molecular portraits of human breast tumours. Nature. 2000. 406(6797):747–52. [DOI] [PubMed] [Google Scholar]
- xvi.Lee JY, Park K, Lee E, et al. Gene expression profiling of breast cancer brain metastasis. Sci Rep. 2016. 6:28623. [DOI] [PMC free article] [PubMed] [Google Scholar]
- xvii.Weigelt B, Glas AM, Wessels LFA, Witteveen AT, Peterse JL, van’t Veer LJ. Gene expression profiles of primary breast tumors maintained in distant metastases. PNAS. 2003. 100(26): 15901–15905. [DOI] [PMC free article] [PubMed] [Google Scholar]
- xviii.Bell R, Barraclough R, Vasieva O. Gene expression meta-analysis of potential metastatic breast cancer markers. Current Molecular Medicine. 2017. 17: 200–210. [DOI] [PMC free article] [PubMed] [Google Scholar]
- xix.Hao X, Sun B, Hu L, et al. Differential gene and protein expression in primary breast malignancies and their lymph node metastases as revealed by combined cDNA microarray and tissue microarray analysis. Cancer. 2004. 100(6):1110–22. [DOI] [PubMed] [Google Scholar]
- xx.Weigelt B, Wessels LF, Bosma AJ, et al. No common denominator for breast cancer lymph node metastasis. Br J Cancer. 2005. 93(8):924–32. [DOI] [PMC free article] [PubMed] [Google Scholar]
- xxi.Suzuki M, Tarin D. Gene expression profiling of human lymph node metastases and matched primary breast carcinomas: clinical implications. Molecular Oncology. 2007. 1(2):172–80. [DOI] [PMC free article] [PubMed] [Google Scholar]
- xxii.Feng Y, Sun B, Li X, et al. Differentially expressed genes between primary cancer and paired lymph node metastases predict clinical outcome of node-positive breast cancer patients. Breast Cancer Res Treat. 2007. 103(3):319–29. [DOI] [PubMed] [Google Scholar]
- xxiii.Smeets A, Daemen A, Bempt IV, et al. Prediction of lymph node involvement in breast cancer from primary tumor tissue using gene expression profiling and miRNAs. Breast Cancer Res Treat. 2011. 129(3):767–776. [DOI] [PubMed] [Google Scholar]
- xxiv.Ding L, Ellis M, Li S, et al. Genome remodeling in a basal-like breast cancer metastasis and xenograft. Nature. 2010. 464(7291):999–1005. [DOI] [PMC free article] [PubMed] [Google Scholar]
- xxv.Hoadley KA, Siegel MB, Kanchi KL, et al. Tumor evoluation in two patients with basal-like breast cancer: a retrospective genomics study of multiple metastases. PLOS Medicine. 2016. 13(2):1–20. [DOI] [PMC free article] [PubMed] [Google Scholar]
- xxvi.Zhou L, Gao HF, Liu DS, Feng JY, Gao DD, Xia W. Gene expression profiling of brain metastatic cell from triple negative breast cancer: Understanding the molecular events. Gene. 2018. 640:21–27. [DOI] [PubMed] [Google Scholar]