

Abstract
Rationale
The increased prevalence of obstructive sleep apnea (OSA) coincides with a severe shortage of sleep physicians. There is a need for widescale home-sleep-testing devices with accurate automated scoring to accelerate access to treatment.
Objectives
To examine the accuracy of an automated apnea–index (AHI) derived from spectral analysis of cardiopulmonary coupling (CPC) extracted from electrocardiograms, combined with oximetry signals, in relation to polysomnograms (PSGs).
Methods
Electrocardiograms and pulse-oximeter tracings on PSGs from APPLES (Apnea Positive Pressure Long-term Efficacy Study) were analyzed. Distinct CPC spectral bands were combined with the oxygen desaturation index to create a derived AHI (DAHI). Correlation statistics between the DAHI and the conventionally scored AHI, in which hypopneas required ≥50% airflow reduction alone or a lesser airflow reduction associated with ≥3% desaturation or arousal, using PSGs from APPLES were calculated.
Results
A total of 833 adult subjects were included. The DAHI has excellent and strong correlation with the conventionally scored AHI on PSGs, with Pearson coefficients of 0.972 and receiver operating characteristic curves demonstrating strong agreement in all OSA categories: 98.5% in mild OSA (95% confidence interval [CI], 97.6–99.3%), 96.4% in moderate OSA (95% CI, 95.3–97.5%), and 98.5% in severe OSA (95% CI, 97.8–99.2%).
Conclusions
An accurate automated AHI can be derived from oximetry and CPC.
Keywords: obstructive sleep apnea, pattern recognition, medical informatics applications, diagnostic equipment
The prevalence of obstructive sleep apnea (OSA) in the general population ranges from 9% to 38%, and in some elderly groups, the prevalence is as high as 90% in men and as high as 78% in women (1). In the United States, it is estimated that 29.4 million adults have OSA (2). Polysomnograms (PSGs) are considered the gold standard for diagnosing OSA (3); however, access to in-laboratory sleep studies does not meet the demand in a cost-effective way (3). This is unacceptable given the high burden of medical comorbidities associated with undiagnosed OSA (4, 5). The estimated cost burden of undiagnosed OSA among U.S. adults was $149.6 billion in 2015 (2). This cost is due to decreased productivity in addition to the increased incidence of medical comorbidities and car accidents (2). The advent of portable home sleep tests (HSTs) improved access and the cost of diagnosing OSA (6). Unfortunately, the false-negative rates (FNRs) of the currently used HSTs in clinical practice can be as high as 17% (7). The currently used HSTs have been shown to underestimate the severity of OSA in up to 40% of cases (8). Scoring guidelines for HSTs use only a desaturation association to score hypopneas, underdetecting disease in patients with a higher probability of nonhypoxic disease, such as women. This has significant clinical and even ethical implications because it may misguide treatment decisions. Another disadvantage of HSTs is that these are still labor intensive in terms of visual review by sleep physicians, limiting the time sleep physicians can invest in seeing patients with sleep disorders. This is of utmost importance given the current shortage in the number of sleep physicians, which is expected to worsen (9). Studies that assessed computerized scoring of the current clinically used HSTs showed that there is further underestimation of the OSA burden on top of an already underestimated burden when compared with visual scoring (10).
Automated analytics is expected to be the future of sleep medicine and will likely be added to the armamentarium of practicing sleep physicians (11) but has a black-box quality, especially regarding analysis by deep-learning methods. Nonlinear-computational-signal analysis could be considered a bridge between traditional scoring and machine learning. One such technique is a time-series analysis of a single-lead electrocardiogram (ECG) to mathematically extract heart-rate variability (HRV) and ECG-derived respiration, combining them to generate spectral analysis of cardiopulmonary coupling (CPC) (12). Certain distinct CPC patterns occur in OSA (13), which reflects the coupled respiration–heart-rate oscillations that occur when breathing shows repetitive discrete pathological fluctuations. We hypothesized that by examining such patterns of CPC and combining them with oxygen desaturations, we would get a derived apnea–hypopnea index (DAHI) that would correlate with a standard apnea–hypopnea index (AHI) obtained from PSGs scored in expert centers.
Methods
This study was conducted in accordance with the amended Declaration of Helsinki. The institutional review board of Beth Israel Deaconess Medical Center approved the study protocol (institutional review board protocol 2016P000058). Patients consent was waived, as data were deidentified.
Databases
APPLES (Apnea Positive Pressure Long-term Efficacy Study) randomized 1,098 subjects to continuous positive airway pressure (CPAP) or placebo CPAP (14). APPLES is registered at clinicaltrials.gov (NCT 00051363).
The standard montage included frontal, central, and occipital electroencephalography, electrooculography, chin electromyography, respiratory flow (thermistor and nasal pressure), effort, tibialis anterior electromyography, and finger-pulse oximetry. In APPLES, the 1999 American Academy of Sleep Medicine criteria (Chicago Criteria) were used for the definition of “AHI3%” (an AHI in which hypopneas required ≥50% airflow reduction alone or a lesser airflow reduction associated with ≥3% desaturation or arousal) (15), and a minimum AHI3% of 10 events/h was required for inclusion in the randomized study (14). For the purpose of our study, we also included subjects with mild OSA with an AHI < 10 events/h who were excluded from randomization in APPLES to make sure the correlation between the DAHI and the PSG AHI3% could be more generalized to clinical practice.
SleepImage
The SleepImage System (http://www.sleepimage.com/) is a Health Insurance Portability and Accountability Act–compatible cloud computing system currently hosted in the Amazon Cloud that uses small, single-sensor recording devices. The system is also approved by the U.S. Food and Drug Administration (FDA) as standalone software (software as a medical device) and can be run on any signal recordings that include an ECG signal or a similar information-content signal, including plethysmography, which encompasses full or limited PSGs.
CPC Analysis
CPC analysis of the ECG signal was performed as previously described (12, 13). Full details are included in the online supplement to this article. Briefly, the method uses a single-channel ECG to extract HRV and ECG-derived respiration (amplitude variations in the QRS complex due to shifts in the cardiac electrical axis relative to the electrodes during respiration and changes in thoracic impedance as the lungs fill and empty).
Two distinct patterns of CPC are observed: high-frequency coupling (HFC; 0.1–0.4 Hz) and low-frequency coupling (LFC; 0.01 to <0.1 Hz). HFC is associated with stable breathing during non–rapid eye movement (NREM) sleep. A preponderance of a subset of LFC, a subset named elevated LFC (e-LFC), detects apneas and hypopneas (13). Periods of e-LFC coincided with periods of scored apnea/hypopnea in the PhysioNet Sleep Apnea Database (16).
A third CPC pattern named the very low frequency (v-LFC) band (0 to <0.01 Hz) has two subsets: wake states and rapid eye movement (REM) sleep (13). REM sleep can be distinguished from the wake state by CPC analysis in conjunction with desaturations from oximetry as follows: 1) spectral analysis of the raw CPC output, 2) analysis of motion artifacts using signal quality as a surrogate measure of the motion artifacts, and 3) analysis of desaturation events.
Spectral dominance of v-LFC is expected during REM and wake states, and motion is expected to be minimal during REM. Because this data set did not contain actigraphy data, a measure of signal quality was used as a surrogate measure of motion artifacts. Signal quality is quantified on the basis of successfulness of feature detection of the ECG signal. During periods of motion artifacts, feature-detection performance will deteriorate as periods of signaling get rejected.
When classifying REM versus wake states, spectral dominance in the upper range of the v-LFC band in addition to a lack of motion artifacts is indicative of REM sleep. Therefore, spectral dominance in the lower range of the v-LFC band with a cooccurring drop in signal quality is indicative of the wake state.
Finally, the presence of desaturation events, especially in clusters, and the absence of artifacts in the trace of the oxygen saturation as measured by pulse oximetry (SpO2) is indicative of REM, assuming that v-LFC dominance is present as discussed above.
Total sleep time (TST) was then determined by 1) marking the sleep onset as the first occurrence of HFC or LFC; 2) marking the sleep conclusion as the last occurrence of HFC or LFC, or the last occurrence of REM; and 3) classifying windows of v-LFC dominance into either REM or wake states.
In the PhysioNet Sleep Apnea Database, periods of near-constant frequency spectral peaks in the e-LFC region were associated with the sinusoidal oscillations of HRV seen in Cheyne-Stokes respiration in patients with heart failure, which has a relatively constant cycle length (13). Because the period of central apnea can be as slow as 120 seconds or longer, we used the frequency band between 0.006 and 0.1 Hz to define narrow-spectral-band e-LFC (e-LFCNB; putative central sleep apnea, periodic breathing, or complex sleep apnea) (13). We require a minimum power in this band of 0.3 normalized units and require that the coupling frequencies of each pair of consecutive measurements remain within 0.0059 Hz of each other over five consecutive sampling windows (totaling 17 continuous min) (13). Periods of e-LFC not meeting these criteria are defined as broad-spectral-band e-LFC (e-LFCBB; putative pure OSA) (13). The amount of broad-spectral-band and narrow-spectral-band coupling in e-LFC bands is then expressed as the percentage of windows detected in relation to the total sleep period (13). This percentage of e-LFCBB and e-LFCNB in relation to TST was used to generate a broad-band index (BBI) and a narrow-band index (NBI). Thus, the e-LFCNB identified periods with oscillations that have a single dominant coupling frequency, suggesting central sleep apnea or periodic breathing (13). The e-LFCBB identified periods with oscillations that have variable coupling frequencies, suggesting an alternative mechanism, which we posited was dominance of the anatomic upper airway–obstructive processes (13).
Generation of a DAHI
We used the ECG and pulse-oximeter tracings on PSGs from the APPLES database (14). The e-LFC is a pattern on the CPC spectrogram that associates with sleep apnea (13). It occurs in two bands: e-LFCNB and e-LFCBB. The former associates with central sleep apnea or periodic breathing, and the latter associates with OSA. The number of oscillations per unit of time is readily calculated from the coupled oscillating frequency and the duration of such oscillations. Further details are included in the online supplement. We used the SleepImage computing system to calculate e-LFC events. The PSG pulse-oximeter trace was processed to calculate the oxygen desaturation index (ODI3%), defined as events lasting 10 seconds or longer of ≥3% desaturation within each CPC period. The DAHI was defined as the BBI + NBI + ODI value per hour of sleep as determined by CPC. During periods of narrow-band or broad-band events, ODI events were not counted to avoid double counting.
The Pearson coefficient was used to estimate the correlations between the DAHI from the SleepImage computing system and the AHI3% obtained from APPLES. OSA was further classified into mild (AHI3% of 5–14.9 events/h), moderate (AHI3% of 15–29.9 events/h), and severe (AHI3% ≥ 30 events/h). Bland-Altman analysis was used to quantify agreement between DAHI and AHI3%, ODI3% and AHI3%, and the TST generated by CPC and the TST on PSGs. Receiver operating characteristic (ROC) curves were used to demonstrate the diagnostic ability of the DAHI. Logistic regression was used to run the Akaike information criterion (AIC). In this latter type of statistical analysis, lower numbers reflect a better model quality. AIC numbers were calculated for the DAHI and ODI versus the AHI3%. Statistical analyses were conducted using Stata software version 15.1 (StataCorp). Statistical significance was set at a threshold of P < 0.05.
Results
Data Set
Nine hundred seventy-four adult PSGs were examined, from which 833 PSGs were included in the analysis. Studies were excluded from the analysis as a result of having ECG signal issues (e.g., arrhythmias, excessive noise, poor signal quality), SpO2 signal issues (dropout, noise), discrepancies between the data-file recording time and that reported on the PSG, and/or unsuccessful processing. Samples of analysis are shown in Figure 1.
Figure 1.
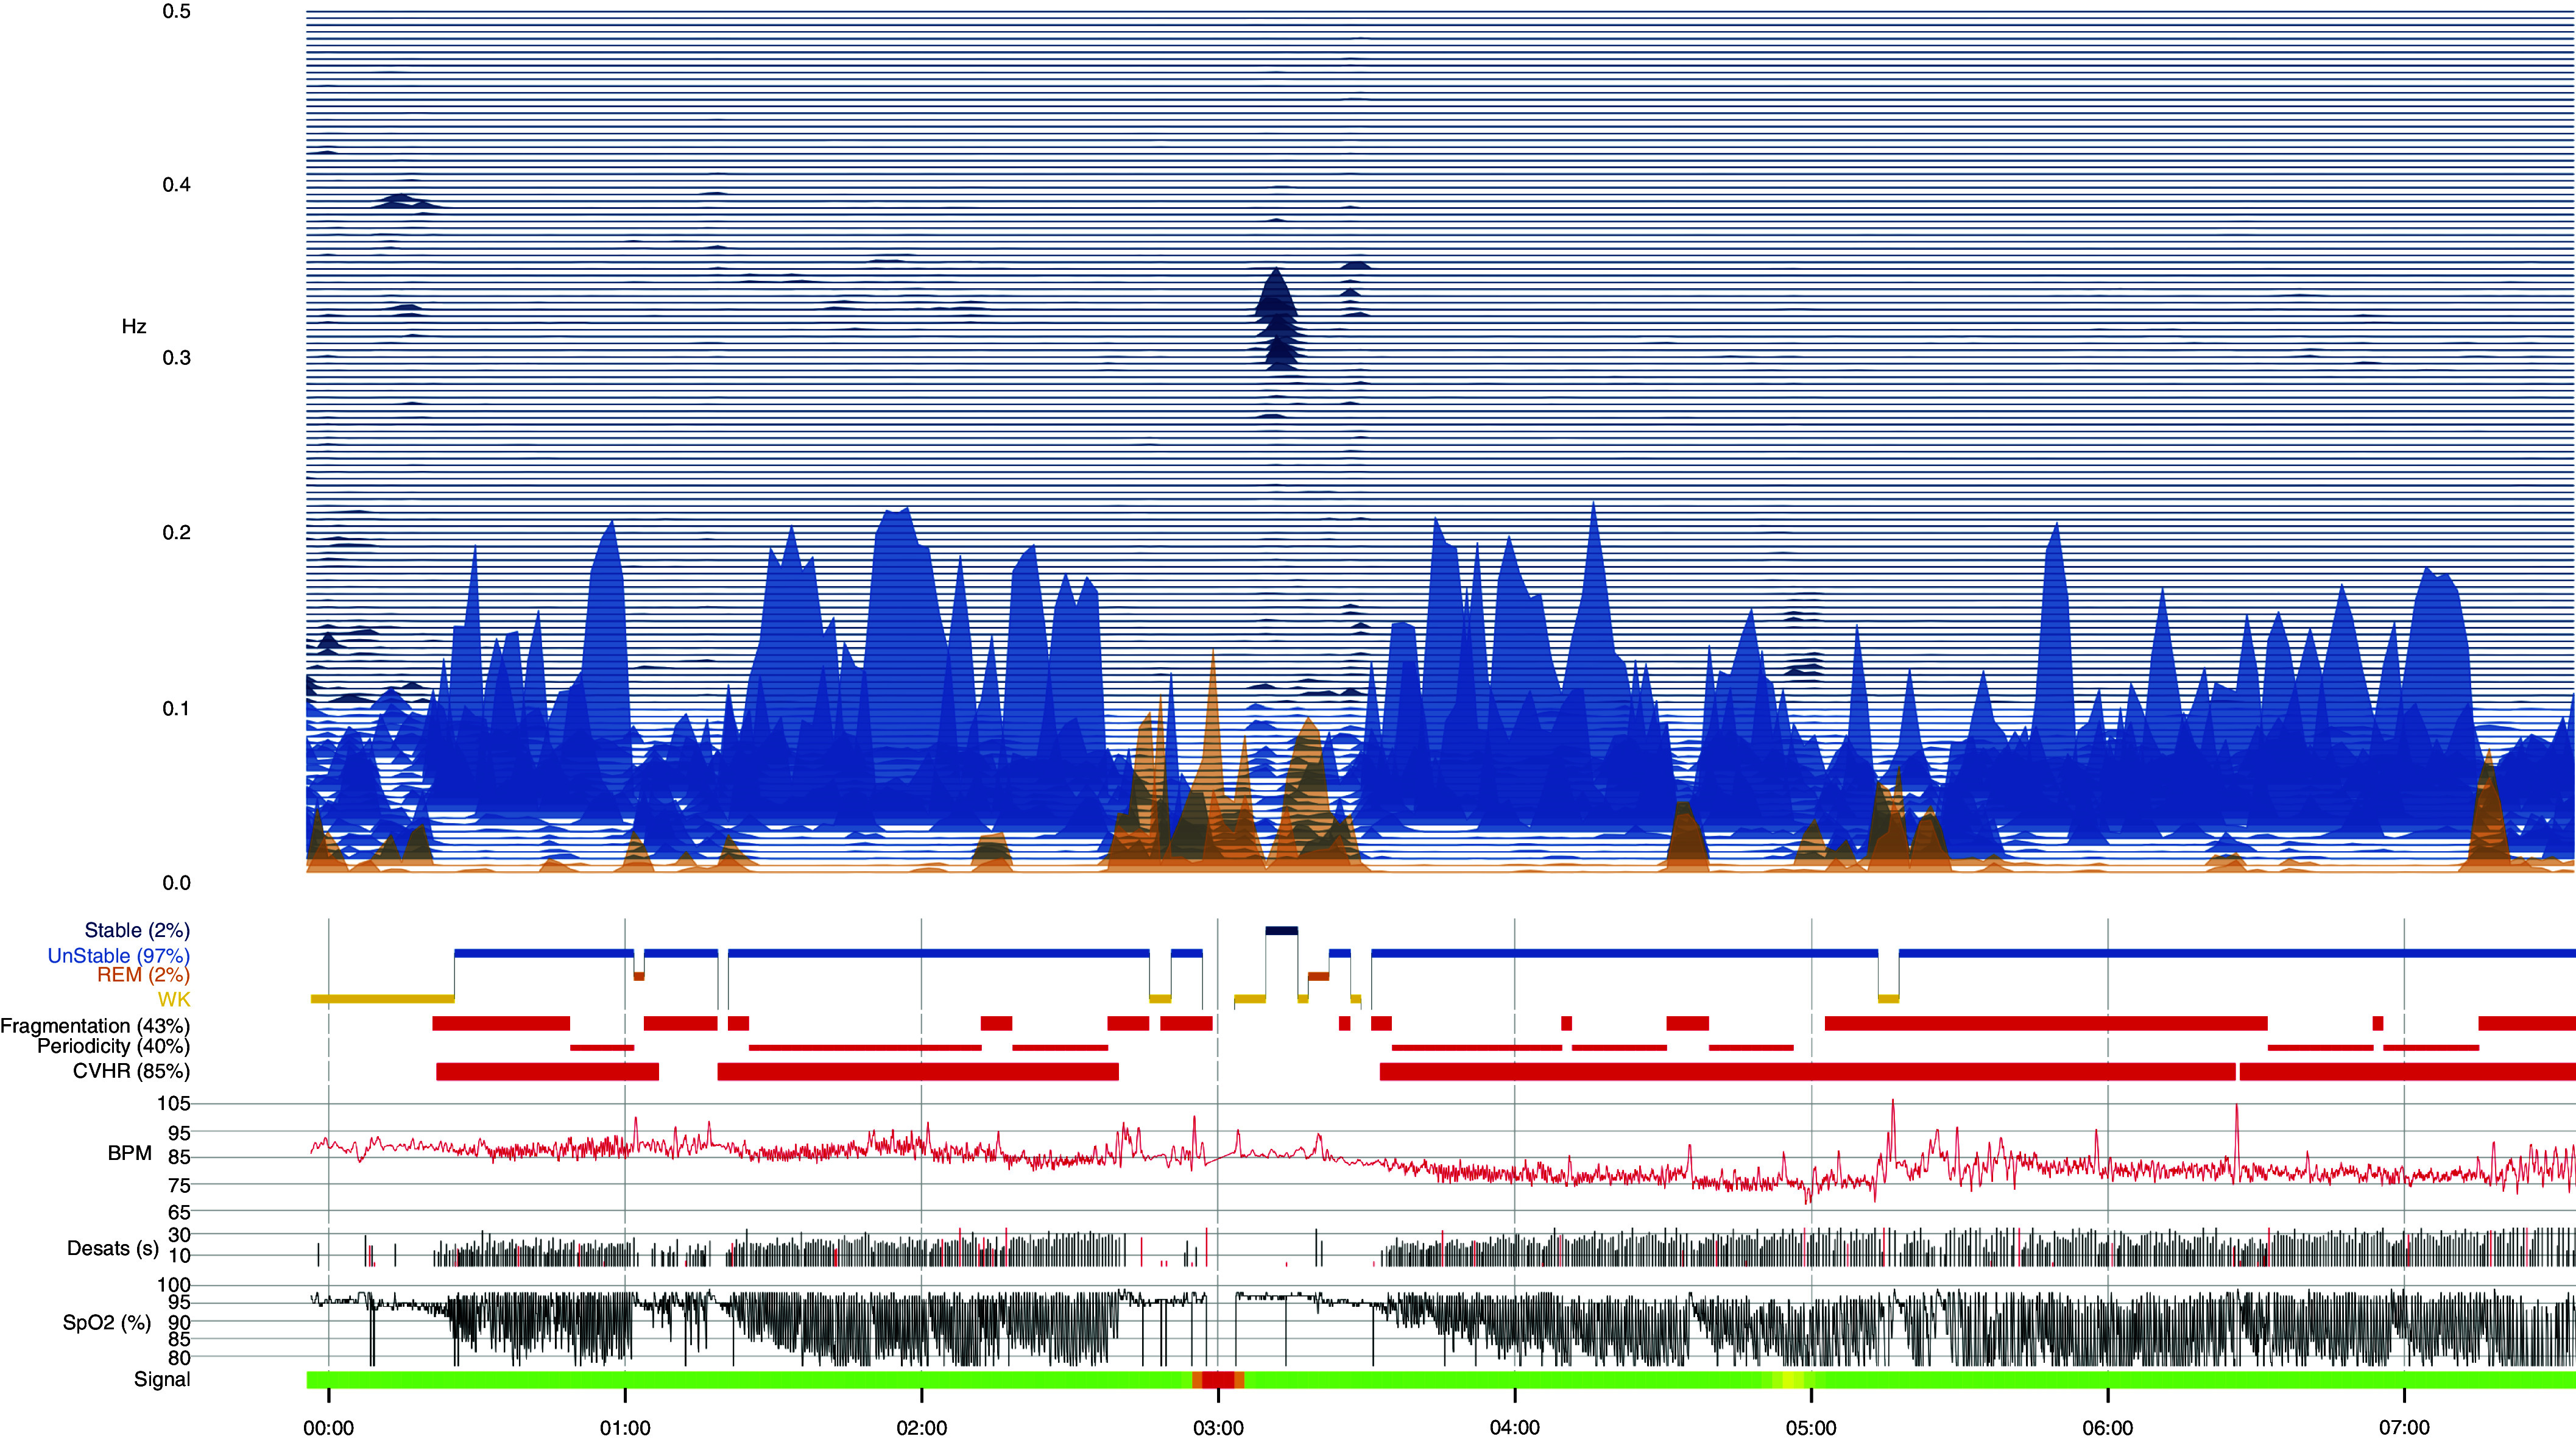
Sample of APPLES (Apnea Positive Pressure Long-term Efficacy Study) polysomnogram analysis using cardiopulmonary coupling and the oxygen desaturation index. BPM = beats per minute; CVHR = cyclic variation of heart rate; Desats = desaturations; REM = rapid eye movement; SpO2 = oxygen saturation as measured by pulse oximetry; WK = wake.
The baseline characteristics of the cohort are listed in Table 1.
Table 1.
Baseline characteristics of the adult cohort
| Variable | Participants (N = 833) |
|---|---|
| Age, yr, median ± SD (range) | 51 ± 13 (19–83) |
| Female, n (%) | 279 (33.4) |
| Ethnicity, n (%) | |
| White | 635 (76) |
| African American | 67 (8) |
| Asian | 54 (6.4) |
| Native American | 8 (1) |
| Other | 4 (<1) |
| AHI3%, events/h, median ± SD (range) | 31.4 ± 28.3 (0–130.7) |
| No OSA (AHI < 5 events/h), n (%)* | 32 (3.84) |
| Mild OSA (AHI of 5 to <15 events/h), n (%) | 136 (16.3) |
| Moderate OSA (AHI of 15 to <30 events/h), n (%) | 238 (28.57) |
| Severe OSA (AHI of ≥30 events/h), n (%) | 427 (51.2) |
Definition of abbreviations: AHI = apnea–hypopnea index; AHI3% = an AHI in which hypopneas required ≥50% airflow reduction alone or a lesser airflow reduction associated with ≥3% desaturation or arousal; APPLES = Apnea Positive Pressure Long-term Efficacy Study; OSA = obstructive sleep apnea; SD = standard deviation.
These are cases invited to participate in APPLES but did not have OSA so were not randomized.
DAHI versus PSG AHI
The Pearson coefficient for the adult DAHI obtained by SleepImage and the AHI3% in APPLES was 0.972, indicating an excellent and strong correlation. Pitman test results indicated homogeneity of variances of DAHI and AHI3% values (r = −0.017, P = 0.623).
Descriptive analysis of the BBI and NBI is included in Table 2. Figure 2 is a scatterplot diagram showing the excellent correlation between the DAHI obtained by SleepImage and the AHI3% in APPLES.
Table 2.
Descriptive analysis BBI and NBI
| Mean | Median | SD | Minimum | Maximum | |
|---|---|---|---|---|---|
| BBI, events/h | 13.3 | 9.46 | 12.15 | 0 | 74.59 |
| NBI, events/h | 4.44 | 0 | 9.79 | 0 | 88.74 |
Definition of abbreviations: BBI = broad-band index; NBI = narrow-band index; SD = standard deviation.
Figure 2.

Scatterplot diagram showing the correlation between the DAHI obtained by SleepImage and the AHI3% in APPLES (Apnea Positive Pressure Long-term Efficacy Study). AHI3% = apnea–hypopnea index in which hypopneas required ≥50% airflow reduction alone or a lesser airflow reduction associated with ≥3% desaturation or arousal; DAHI = derived apnea–hypopnea index.
The ROC curve for the DAHI is included in Figure 3 and reflects robust diagnostic accuracy in comparison with the gold-standard AHI3% on PSGs in all OSA categories: 98.5% in mild OSA (95% confidence interval [CI], 97.6–99.3%), 96.4% in moderate OSA (95% CI, 95.3–97.5%), and 98.5% in severe OSA (95% CI, 97.8–99.2%). Because the ODI is one of the components of the DAHI, a separate ROC curve for just the ODI is included in Figure 4, which also shows excellent diagnostic accuracy in all OSA categories: 92.3% in mild OSA (95% CI, 89.4–95.2%), 91.6% in moderate OSA (95% CI, 89.7–93.5%), and 93.5% in severe OSA (95% CI, 91.8–95.3%). Comparison of the area under the curve shows higher diagnostic accuracy for the DAHI in comparison with just using the ODI. In addition to the ROC-curve metrics, logistic regressions using the DAHI and ODI3% as classifiers against each OSA category defined by the AHI3% were run, and the AIC was calculated, with results indicating higher relative quality in models using the DAHI rather than just the ODI as a classifier: 98.63 versus 176.55, 306.13 versus 458.42, and 242.93 versus 510.07 for mild, moderate, and severe OSA, respectively.
Figure 3.

ROC curve of diagnostic accuracy of the DAHI obtained by SleepImage compared with the AHI3% in APPLES (Apnea Positive Pressure Long-term Efficacy Study). AHI = apnea–hypopnea index; AHI3% = an AHI in which hypopneas required ≥50% airflow reduction alone or a lesser airflow reduction associated with ≥3% desaturation or arousal; AUC = area under the curve; DAHI = derived AHI; ROC = receiver operating characteristic.
Figure 4.

ROC curve of diagnostic accuracy of the ODI3% compared with the AHI3% in APPLES (Apnea Positive Pressure Long-term Efficacy Study). AHI = apnea–hypopnea index; AHI3% = an apnea–hypopnea index in which hypopneas required ≥50% airflow reduction alone or a lesser airflow reduction associated with ≥3% desaturation or arousal; AUC = area under the curve; CPC = cardiopulmonary coupling; ODI3% = events lasting 10 seconds or longer of ≥3% desaturation within each CPC period; ROC = receiver operating characteristic.
To investigate the level of agreement, we conducted Bland-Altman analysis. The Bland-Altman plot shown in Figure 5 reflects a mean difference of −1.977 (95% CI, −2.431 to −1.522) between DAHI and AHI3% values, a lower limit of agreement of −15.072 (95% CI, −15.849 to −14.295), and an upper limit of agreement of 11.119 (95% CI, 10.342 to 11.895). In Figure 6, Bland-Altman analysis of the ODI3% versus the AHI3% shows a mean difference of −11.301 (95% CI, −12.115 to −10.488), a lower limit of agreement of −34.747 (95% CI, −36.138 to −33.356), and an upper limit of agreement of 12.145 (95% CI, 10.754 to 13.535). This highlights a better level of agreement between the DAHI and AHI3% than between the ODI and AHI3%. In Figure 7, Bland-Altman analysis of the TST generated by CPC versus the TST on PSGs shows a mean difference in minutes of 27.116 (95% CI, 23.812 to 30.42), a lower limit of agreement of −68.104 (95% CI, −73.753 to −62.456), and an upper limit of agreement of 122.335 (95% CI, 116.687 to 127.984).
Figure 5.

Bland-Altman plot for level of agreement between the DAHI and AHI3%. AHI3% = an apnea–hypopnea index in which hypopneas required ≥50% airflow reduction alone or a lesser airflow reduction associated with ≥3% desaturation or arousal; APPLES = Apnea Positive Pressure Long-term Efficacy Study; DAHI = derived apnea–hypopnea index.
Figure 6.

Bland-Altman plot for level of agreement between the ODI3% and AHI3%. AHI3% = an apnea–hypopnea index in which hypopneas required ≥50% airflow reduction alone or a lesser airflow reduction associated with ≥3% desaturation or arousal; APPLES = Apnea Positive Pressure Long-term Efficacy Study; CPC = cardiopulmonary coupling; ODI3% = events lasting 10 seconds or longer of ≥3% desaturation within each CPC period.
Figure 7.

Bland-Altman plot for level of agreement between TST generated by CPC and TST on PSGs. CPC = cardiopulmonary coupling; PSG = polysomnogram; TST = total sleep time; TSTCPC = total sleep time generated by CPC; TSTPSG = total sleep time on PSGs.
To investigate the influence of using the DAHI on OSA severity class while using the AHI3% from PSGs as the gold standard, we calculated the FNR and false-positive rate (FPR) for mild, moderate, and severe OSA. In mild OSA, the FNR was 1.1% and the FPR was 45.2%. In moderate OSA, the FNR was 7.7% and the FPR was 12.9%. In severe OSA, the FNR was 7.1% and the FPR was 2.2%.
Discordance Analysis
We further looked into subjects who had noticeably different (ND) DAHI and AHI3% values. We defined ND subjects as subjects 1) with differences in categories (using thresholds of 15 and 30 events/h) and/or 2) with 20-events/h absolute differences. Out of the total of 116 subjects categorized as ND, 37 differed in categories in which one or both of the measures (DAHI, AHI3%) was or were within 1 event/h of a cutoff.
A total of 9 ND subjects differed significantly in magnitude, wherein both measures were greater than 40 events/h. This makes the clinical impact relatively minimal, as both measures showed a high prevalence of events during the sleep period.
The following observations in the ND subjects reached statistical significance with a P value < 0.05:
-
•
The percentage of females in the ND category was 45.6%, whereas the percentage of females in the entire cohort was 33.4%.
-
•
Subjects who were ND had a significantly higher HFC percentage (40% vs. 30%); HFC is stable NREM sleep.
Age was examined as a covariate and found not to have a significant influence on the accuracy of the DAHI (details are included in the online supplement).
Discussion
The SleepImage DAHI reportedly has a strong correlation to the AHI obtained from PSGs in children (17). In our current study, we focused on adult patients and have shown a strong correlation between the SleepImage DAHI and the AHI3% scored in APPLES. A strength of our study is that the SleepImage DAHI was compared with the AHI3% scored on PSGs, which are considered the gold-standard method for diagnosing OSA (3). These PSGs belong to a well-designed randomized controlled trial in which scoring was centralized and meticulously revised (14).
Reduced-signal methods to estimate sleep apnea are important to enable large-scale implementation of sleep apnea diagnostics. The simplest approach is to measure the respiratory signals alone, and commonly used sleep apnea screening devices use respiratory effort, airflow, and oximetry. The HSTs currently used in clinical practice can underestimate the severity of OSA and carry a substantial FNR (7). Cyclical autonomic activation occurs with respiratory events, allowing characterization of sleep apnea events based on the interaction of autonomic and respiratory oscillations (e.g., CPC) (13). CPC analysis reveals that NREM sleep has distinct alternating and abruptly varying periods of high- and low-frequency CPC power (HFC and LFC, respectively) (13). Much of the HFC occurs during stage N2 and is associated with periods of stable breathing (12, 13). This state contributes to the DAHI only if desaturations occur, which are less common but may reflect flow limitation and non–arousal-based airway opening. This could explain some of the ND subjects, as HFC is a moving average and is insensitive to sporadic events spaced widely apart. Such sporadic events would be better captured by conventional PSG scoring. Another explanation of the ND subjects is that APPLES used only the AHI3% and/or arousals and not the respiratory disturbance index (RDI), which includes respiratory effort–related arousals. This explanation is supported by the percentage of females in the ND category being higher than the percentage of females in the whole cohort. It is well known that women with OSA have a lower arousal threshold than men with OSA (18), and, as such, some may have RDI-predominant OSA, causing the e-LFC to be captured not by APPLES’ AHI3% but rather by the DAHI. This may provide some explanation for the high FPR in the mild-OSA category seen when using the DAHI rather than the AHI3%. This assumption, however, needs another validation study to look at whether this high FPR in mild OSA is because the DAHI is capturing the RDI or whether it truly indicates that the DAHI is overdiagnosing mild OSA.
The CPC technique partially operates on the concept of HRV during sleep, which has been shown in multiple studies to carry distinct patterns during OSA (19–23). Integrating respiratory output with HRV in CPC improves signal/noise ratios, and further adding oximetry information seems to capture the bulk of the respiratory abnormality conventionally quantified. There are several methods to estimate HRV (24). Although non-CPC methods used to estimate HRV during sleep and subsequently predict OSA showed good performance, they can sometimes miss severe cases with an AHI > 30 events/h (23). In our cohort from APPLES, the correlation between the SleepImage DAHI and the APPLES AHI3% was robust, including study subjects with an AHI > 30 events/h. The non-CPC methods mainly rely on variabilities in ECGs, whereas the CPC technique operates on the concept of the known interaction between the heartbeat and breathing, in which the two rhythms demonstrate temporal coherence (25). In human subjects, coupling of HRV and respiration is well recognized in the resting state and during natural sleep, benzodiazepine sedation, and general anesthesia (25). It has been a well-characterized phenomenon since the 1960s (25). It has also been shown to capture treatment effects in sleep apnea (26–29).
An additional strength of our study is that the SleepImage DAHI can be calculated from only two streams of biological information, an ECG for CPC analysis and SpO2, which is less cumbersome for patients than the current HSTs that use multiple channels. This system of recording the ECG data and SpO2 to obtain a DAHI was approved by the FDA to be a PSG-equivalent AHI in adults and children in 2019 (approval K182618). It also allows the study to be repeated with ease. Moreover, the SleepImage DAHI is automated, which avoids the labor-intensive visual scoring needed in the case of the current HSTs. This is in contrast with the suboptimal automated scoring of the current HSTs (10, 11).
The study, however, has some limitations. We excluded cases with arrhythmias because our previous studies on CPC during OSA were limited to subjects without arrhythmias (13). Patients with arrhythmias show a wide range in the spectral power of HRV (30). Yet this is not entirely random (30). So, examining CPC in patients with arrhythmias may be possible, but focused studies on such patients to see whether successful correlations can be made are needed. Another limitation is the exclusion of cases with poor ECG signal quality on PSGs. We expect this to be less of an issue when using single-sensor devices such as wearable ECG recorders and pulse oximeters because of the availability of multiple nights of recordings with wearable devices. Our experience shows a signal quality of >0.95 in the ECGs generated by the single-sensor devices, as compared with a signal quality of around 0.8 on the ECGs obtained from PSGs. Another limitation is that we used TST as generated by CPC to calculate the DAHI, although the presence of signal motion artifacts is used as one of the criteria to distinguish REM from wake states. The SleepImage wearable device currently on the market uses actigraphy (31). Although the accuracy of actigraphy in estimating TST compared with PSGs is around 90% (32), this still represents a limitation.
A final limitation is that we tested cohorts enriched with subjects with OSA. However, e-LFC is not restricted to apnea and is increased in conditions associated with sleep fragmentation, such as depression (33) and fibromyalgia (34). Yet with the proper knowledge of such limitations, the SleepImage DAHI should be a useful tool in the armamentarium of sleep physicians for fast and accurate diagnosis of OSA when applied to the correct cohorts.
Conclusions
The automated SleepImage DAHI had excellent correlation with the AHI3% obtained from adult PSGs from APPLES The results formed the basis of FDA approval for use in clinical diagnosis of sleep apnea.
Acknowledgments
Acknowledgment
The APPLES Investigators gratefully recognize the vital input and support of Dr. Sylvan Green, who died before the results of this trial were analyzed but was instrumental in its design and conduct. The authors thank the APPLES administrative core, data coordinating center, clinical coordinating center, and clinical centers, including Stanford University, the University of Arizona, St. Mary Medical Center, St. Luke’s Hospital, and Brigham and Women’s Hospital and thank the Sleep Health Centers for the use of their clinical facilities to conduct this research.
APPLES Investigators: Administrative Core: Clete A. Kushida, Deborah A. Nichols, Eileen B. Leary, Pamela R. Hyde, Tyson H. Holmes, Daniel A. Bloch, and William C. Dement. Data Coordinating Center: Daniel A. Bloch; Tyson H. Holmes; Deborah A. Nichols; Rik Jadrnicek, Microflow; Ric Miller, Microflow; Usman Aijaz; Aamir Farooq; Darryl Thomander; Chia-Yu Cardell; Emily Kees; Michael E. Sorel; Oscar Carrillo; Tami Crabtree; Ray Balise; and Tracy Kuo. Clinical Coordinating Center: Clete A. Kushida, William C. Dement, Pamela R. Hyde, Rhonda M. Wong, Pete Silva, Max Hirshkowitz, Alan Gevins, Gary Kay, Linda K. McEvoy, Cynthia S. Chan, and Sylvan Green. Clinical Centers: Stanford University: Christian Guilleminault, Eileen B. Leary, David Claman, Stephen Brooks, Julianne Blythe, Jennifer Blair, Pam Simi, Ronelle Broussard, Emily Greenberg, Bethany Franklin, Amirah Khouzam, Sanjana Behari Black, Viola Arias, Romelyn Delos Santos, and Tara Tanaka. University of Arizona: Stuart F. Quan, James L. Goodwin, Wei Shen, Phillip Eichling, Rohit Budhiraja, Charles Wynstra, Cathy Ward, Colleen Dunn, Terry Smith, Dane Holderman, Michael Robinson, Osmara Molina, Aaron Ostrovsky, Jesus Wences, Sean Priefert, Julia Rogers, Megan Ruiter, and Leslie Crosby. St. Mary Medical Center: Richard D. Simon, Jr.; Kevin Hurlburt; Michael Bernstein; Timothy Davidson; Jeannine Orock-Takele; Shelly Rubin; Phillip Smith; Erica Roth; Julie Flaa; Jennifer Blair; Jennifer Schwartz; Anna Simon; and Amber Randall. St. Luke’s Hospital: James K. Walsh, Paula K. Schweitzer, Anup Katyal, Rhody Eisenstein, Stephen Feren, Nancy Cline, Dena Robertson, Sheri Compton, Susan Greene, Kara Griffin, and Janine Hall. Brigham and Women’s Hospital: Daniel J. Gottlieb, David P. White, Denise Clarke, Kevin Moore, Grace Brown, Paige Hardy, Kerry Eudy, Lawrence Epstein, and Sanjay Patel.
Footnotes
Supported by an American Sleep Medicine Foundation grant (R.J.T.). APPLES (Apnea Positive Pressure Long-term Efficacy Study) was funded by contract 5UO1-HL-068060 from the National Heart, Lung, and Blood Institute. The APPLES pilot studies were supported by grants from the American Academy of Sleep Medicine and the Sleep Medicine Education and Research Foundation to Stanford University and by the National Institute of Neurological Disorders and Stroke (N44-NS-002394) to SAM Technology.
A complete list of the APPLES Investigators may be found before the beginning of the References.
Author Contributions: H.S.A.A. contributed to the study design, literature search, data collection, statistical analysis, and manuscript preparation and revision. H.H. contributed to the study design, literature search, data collection, statistical analysis, and manuscript preparation and revision. Y.N. contributed to the study design, data collection, and manuscript revision. R.J.T. contributed to the study design, literature search, data collection, statistical analysis, and manuscript preparation and revision.
This article has an online supplement, which is accessible from this issue’s table of contents at www.atsjournals.org.
Author disclosures are available with the text of this article at www.atsjournals.org.
Contributor Information
Collaborators: Clete A. Kushida, Deborah A. Nichols, Eileen B. Leary, Pamela R. Hyde, Tyson H. Holmes, Daniel A. Bloch, William C. Dement, Rik Jadrnicek, Ric Miller, Usman Aijaz, Aamir Farooq, Darryl Thomander, Chia-Yu Cardell, Emily Kees, Michael E. Sorel, Oscar Carrillo, Tami Crabtree, Ray Balise, Tracy Kuo, Rhonda M. Wong, Pete Silva, Max Hirshkowitz, Alan Gevins, Gary Kay, Linda K. McEvoy, Cynthia S. Chan, Sylvan Green, Christian Guilleminault, David Claman, Stephen Brooks, Julianne Blythe, Jennifer Blair, Pam Simi, Ronelle Broussard, Emily Greenberg, Bethany Franklin, Amirah Khouzam, Sanjana Behari Black, Viola Arias, Romelyn Delos Santos, Tara Tanaka, Stuart F. Quan, James L. Goodwin, Wei Shen, Phillip Eichling, Rohit Budhiraja, Charles Wynstra, Cathy Ward, Colleen Dunn, Terry Smith, Dane Holderman, Michael Robinson, Osmara Molina, Aaron Ostrovsky, Jesus Wences, Sean Priefert, Julia Rogers, Megan Ruiter, Leslie Crosby, Richard D. Simon, Jr., Kevin Hurlburt, Michael Bernstein, Timothy Davidson, Jeannine Orock-Takele, Shelly Rubin, Phillip Smith, Erica Roth, Julie Flaa, Jennifer Schwartz, Anna Simon, Amber Randall, James K. Walsh, Paula K. Schweitzer, Anup Katyal, Rhody Eisenstein, Stephen Feren, Nancy Cline, Dena Robertson, Sheri Compton, Susan Greene, Kara Griffin, Janine Hall, Daniel J. Gottlieb, David P. White, Denise Clarke, Kevin Moore, Grace Brown, Paige Hardy, Kerry Eudy, Lawrence Epstein, and Sanjay Patel
References
- 1. Senaratna CV, Perret JL, Lodge CJ, Lowe AJ, Campbell BE, Matheson MC, et al. Prevalence of obstructive sleep apnea in the general population: a systematic review. Sleep Med Rev . 2017;34:70–81. doi: 10.1016/j.smrv.2016.07.002. [DOI] [PubMed] [Google Scholar]
- 2. Watson NF. Health care savings: the economic value of diagnostic and therapeutic care for obstructive sleep apnea. J Clin Sleep Med . 2016;12:1075–1077. doi: 10.5664/jcsm.6034. [DOI] [PMC free article] [PubMed] [Google Scholar]
- 3. Kapur VK, Auckley DH, Chowdhuri S, Kuhlmann DC, Mehra R, Ramar K, et al. Clinical practice guideline for diagnostic testing for adult obstructive sleep apnea: an American Academy of Sleep Medicine clinical practice guideline. J Clin Sleep Med . 2017;13:479–504. doi: 10.5664/jcsm.6506. [DOI] [PMC free article] [PubMed] [Google Scholar]
- 4.McNicholas WT, Bonsigore MRManagement Committee of EU COST ACTION B26 Sleep apnoea as an independent risk factor for cardiovascular disease: current evidence, basic mechanisms and research priorities Eur Respir J 200729156–178.[Published erratum appears in Eur Respir J 29:614.] [DOI] [PubMed] [Google Scholar]
- 5. Lévy P, Bonsignore MR, Eckel J. Sleep, sleep-disordered breathing and metabolic consequences. Eur Respir J . 2009;34:243–260. doi: 10.1183/09031936.00166808. [DOI] [PubMed] [Google Scholar]
- 6. Kundel V, Shah N. Impact of portable sleep testing. Sleep Med Clin . 2017;12:137–147. doi: 10.1016/j.jsmc.2016.10.006. [DOI] [PMC free article] [PubMed] [Google Scholar]
- 7. Collop NA, Anderson WM, Boehlecke B, Claman D, Goldberg R, Gottlieb DJ, et al. Portable Monitoring Task Force of the American Academy of Sleep Medicine. Clinical guidelines for the use of unattended portable monitors in the diagnosis of obstructive sleep apnea in adult patients. J Clin Sleep Med . 2007;3:737–747. [PMC free article] [PubMed] [Google Scholar]
- 8. Bianchi MT, Goparaju B. Potential underestimation of sleep apnea severity by at-home kits: rescoring in-laboratory polysomnography without sleep staging. J Clin Sleep Med . 2017;13:551–555. doi: 10.5664/jcsm.6540. [DOI] [PMC free article] [PubMed] [Google Scholar]
- 9. Watson NF, Rosen IM, Chervin RD. Board of Directors of the American Academy of Sleep Medicine. The past is prologue: the future of sleep medicine. J Clin Sleep Med . 2017;13:127–135. doi: 10.5664/jcsm.6406. [DOI] [PMC free article] [PubMed] [Google Scholar]
- 10. Aurora RN, Swartz R, Punjabi NM. Misclassification of OSA severity with automated scoring of home sleep recordings. Chest . 2015;147:719–727. doi: 10.1378/chest.14-0929. [DOI] [PMC free article] [PubMed] [Google Scholar]
- 11. Bragazzi NL, Guglielmi O, Garbarino S. SleepOMICS: how big data can revolutionize sleep science. Int J Environ Res Public Health . 2019;16:291. doi: 10.3390/ijerph16020291. [DOI] [PMC free article] [PubMed] [Google Scholar]
- 12. Thomas RJ, Mietus JE, Peng CK, Goldberger AL. An electrocardiogram-based technique to assess cardiopulmonary coupling during sleep. Sleep . 2005;28:1151–1161. doi: 10.1093/sleep/28.9.1151. [DOI] [PubMed] [Google Scholar]
- 13. Thomas RJ, Mietus JE, Peng CK, Gilmartin G, Daly RW, Goldberger AL, et al. Differentiating obstructive from central and complex sleep apnea using an automated electrocardiogram-based method. Sleep . 2007;30:1756–1769. doi: 10.1093/sleep/30.12.1756. [DOI] [PMC free article] [PubMed] [Google Scholar]
- 14. Kushida CA, Nichols DA, Holmes TH, Quan SF, Walsh JK, Gottlieb DJ, et al. Effects of continuous positive airway pressure on neurocognitive function in obstructive sleep apnea patients: the Apnea Positive Pressure Long-term Efficacy Study (APPLES) Sleep (Basel) . 2012;35:1593–1602. doi: 10.5665/sleep.2226. [DOI] [PMC free article] [PubMed] [Google Scholar]
- 15. Quan SF, Chan CS, Dement WC, Gevins A, Goodwin JL, Gottlieb DJ, et al. The association between obstructive sleep apnea and neurocognitive performance: the Apnea Positive Pressure Long-term Efficacy Study (APPLES) Sleep . 2011;34:303–314B. doi: 10.1093/sleep/34.3.303. [DOI] [PMC free article] [PubMed] [Google Scholar]
- 16. Goldberger AL, Amaral LA, Glass L, Hausdorff JM, Ivanov PC, Mark RG, et al. PhysioBank, PhysioToolkit, and PhysioNet: components of a new research resource for complex physiologic signals. Circulation . 2000;101:E215–E220. doi: 10.1161/01.cir.101.23.e215. [DOI] [PubMed] [Google Scholar]
- 17. Hilmisson H, Berman S, Magnusdottir S. Sleep apnea diagnosis in children using software-generated apnea-hypopnea index (AHI) derived from data recorded with a single photoplethysmogram sensor (PPG): results from the Childhood Adenotonsillectomy Study (CHAT) based on cardiopulmonary coupling analysis. Sleep Breath . 2020;24:1739–1749. doi: 10.1007/s11325-020-02049-6. [DOI] [PubMed] [Google Scholar]
- 18. Won CH, Reid M, Sofer T, Azarbarzin A, Purcell S, White D, et al. Sex differences in obstructive sleep apnea phenotypes, the multi-ethnic study of atherosclerosis. Sleep (Basel) . 2019;43:zsz274. doi: 10.1093/sleep/zsz274. [DOI] [PMC free article] [PubMed] [Google Scholar]
- 19. Narkiewicz K, Pesek CA, Kato M, Phillips BG, Davison DE, Somers VK. Baroreflex control of sympathetic nerve activity and heart rate in obstructive sleep apnea. Hypertension . 1998;32:1039–1043. doi: 10.1161/01.hyp.32.6.1039. [DOI] [PubMed] [Google Scholar]
- 20. Narkiewicz K, Montano N, Cogliati C, van de Borne PJ, Dyken ME, Somers VK. Altered cardiovascular variability in obstructive sleep apnea. Circulation . 1998;98:1071–1077. doi: 10.1161/01.cir.98.11.1071. [DOI] [PubMed] [Google Scholar]
- 21. Smietanowski M, Szelenberger W, Trzebski A. Nonlinear dynamics of the cardiovascular parameters in sleep and sleep apnea. In memory of Alberto Malliani (1935-2006): a brave heart and beautiful mind. J Physiol Pharmacol . 2006;57:55–68. [PubMed] [Google Scholar]
- 22. Shiomi T, Guilleminault C, Sasanabe R, Hirota I, Maekawa M, Kobayashi T. Augmented very low frequency component of heart rate variability during obstructive sleep apnea. Sleep . 1996;19:370–377. doi: 10.1093/sleep/19.5.370. [DOI] [PubMed] [Google Scholar]
- 23. Kesek M, Franklin KA, Sahlin C, Lindberg E. Heart rate variability during sleep and sleep apnoea in a population based study of 387 women. Clin Physiol Funct Imaging . 2009;29:309–315. doi: 10.1111/j.1475-097X.2009.00873.x. [DOI] [PubMed] [Google Scholar]
- 24. Shaffer F, Ginsberg JP. An overview of heart rate variability metrics and norms. Front Public Health . 2017;5:258. doi: 10.3389/fpubh.2017.00258. [DOI] [PMC free article] [PubMed] [Google Scholar]
- 25. Kenner T, Pessenhofer H, Schwaberger G. Method for the analysis of the entrainment between heart rate and ventilation rate. Pflugers Arch . 1976;363:263–265. doi: 10.1007/BF00594612. [DOI] [PubMed] [Google Scholar]
- 26. Choi JH, Thomas RJ, Suh SY, Park IH, Kim TH, Lee SH, et al. Sleep quality change after upper airway surgery in obstructive sleep apnea: electrocardiogram-based cardiopulmonary coupling analysis. Laryngoscope . 2015;125:1737–1742. doi: 10.1002/lary.25101. [DOI] [PubMed] [Google Scholar]
- 27. Guo D, Peng CK, Wu HL, Mietus JE, Liu Y, Sun RS, et al. ECG-derived cardiopulmonary analysis of pediatric sleep-disordered breathing. Sleep Med . 2011;12:384–389. doi: 10.1016/j.sleep.2010.09.011. [DOI] [PubMed] [Google Scholar]
- 28. Lee WH, Ahn JC, We J, Rhee CS, Lee CH, Yun PY, et al. Cardiopulmonary coupling analysis: changes before and after treatment with a mandibular advancement device. Sleep Breath . 2014;18:891–896. doi: 10.1007/s11325-014-0961-5. [DOI] [PubMed] [Google Scholar]
- 29. Lee WH, Hong SN, Kim HJ, Rhee CS, Lee CH, Yoon IY, et al. A comparison of different success definitions in non-continuous positive airway pressure treatment for obstructive sleep apnea using cardiopulmonary coupling. J Clin Sleep Med . 2016;12:35–41. doi: 10.5664/jcsm.5388. [DOI] [PMC free article] [PubMed] [Google Scholar]
- 30. Goldberger AL, Henriques T, Mariani S. Sublimation-like behavior of cardiac dynamics in heart failure: a malignant phase transition? Complexity . 2016;21:24–32. doi: 10.1002/cplx.21811. [DOI] [PMC free article] [PubMed] [Google Scholar]
- 31. Thomas RJ, Wood C, Bianchi MT. Cardiopulmonary coupling spectrogram as an ambulatory clinical biomarker of sleep stability and quality in health, sleep apnea, and insomnia. Sleep . 2018;41:zsx196. doi: 10.1093/sleep/zsx196. [DOI] [PMC free article] [PubMed] [Google Scholar]
- 32. Ancoli-Israel S, Martin JL, Blackwell T, Buenaver L, Liu L, Meltzer LJ, et al. The SBSM guide to actigraphy monitoring: clinical and research applications. Behav Sleep Med . 2015;13:S4–S38. doi: 10.1080/15402002.2015.1046356. [DOI] [PubMed] [Google Scholar]
- 33. Yang AC, Yang CH, Hong CJ, Tsai SJ, Kuo CH, Peng CK, et al. Sleep state instabilities in major depressive disorder: detection and quantification with electrocardiogram-based cardiopulmonary coupling analysis. Psychophysiology . 2011;48:285–291. doi: 10.1111/j.1469-8986.2010.01060.x. [DOI] [PMC free article] [PubMed] [Google Scholar]
- 34. Thomas RJ, Mietus JE, Peng CK, Goldberger AL, Crofford LJ, Chervin RD. Impaired sleep quality in fibromyalgia: detection and quantification with ECG-based cardiopulmonary coupling spectrograms. Sleep Med . 2010;11:497–498. doi: 10.1016/j.sleep.2009.09.003. [DOI] [PMC free article] [PubMed] [Google Scholar]