

Abstract
Although chitin, an N‐acetyl‐D‐glucosamine polysaccharide, can be converted to valuable products by means of homogeneous catalysis, most of the chitin generated by food processing is treated as industrial waste. Thus, a method for converting this abundant source of biomass to useful chemicals, such as lactic acid, would be beneficial. In this study, we determined the catalytic activities of various metal oxides for chitin conversion at 533 K and found that MgO showed the highest activity for lactic acid production. X‐ray diffraction analysis and thermogravimetry‐differential thermal analysis showed that the MgO was transformed to Mg(OH)2 during chitin conversion. The highest yield of lactic acid (10.8 %) was obtained when the reaction was carried out for 6 h with 0.5 g of the MgO catalyst. The catalyst could be recovered as a solid residue after the reaction and reused twice with no decrease in the lactic acid yield.
Keywords: biomass, chitin conversion, heterogeneous catalysis, lactic acid, magnesium oxide
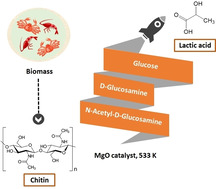
Biomass to useful chemicals: The conversion of chitin, which is treated as industrial waste, into lactic acid with catalysis by simple metal oxides was investigated. MgO showed the best performance and could be reused twice without loss of activity.
1. Introduction
Chitin, the second most abundant biopolymer after cellulose, is the main component of the shells of crustaceans, such as crabs and shrimp.[ 1 , 2 ] The conversion of cellulose, which is a polysaccharide of D‐glucose, into valuable products such as fuels,[ 3 , 4 , 5 , 6 , 7 ] has been extensively studied. In contrast, there have been not many reports of the conversion chitin, a polysaccharide of N‐acetyl‐D‐glucosamine, into useful chemicals. Recently the concept of “shell biorefinery” has been proposed in contrast with biorefinery. The biorefinery concept aims to convert lignocellulosic biomass into chemicals. In the shell biorefinery concept, chitin is a potential resource to produce value‐added compounds.[ 8 , 9 ] For example, several research groups have developed methods for the production of nitrogen‐containing chemicals from chitin.[ 10 , 11 , 12 ] In addition, valuable chemicals that do not contain nitrogen, including 5‐hydroxymethylfurfural (5‐HMF) and levulinic acid, have been produced both from cellulose and from chitin and chitin‐derived materials. Specifically, Omari et al. reported that chitosan can be converted to 5‐HMF and levulinic acid by microwaving it in aqueous solution. [13] Conversion of chitin‐derived materials to 5‐HMF is reported to be enhanced by iron chloride [14] and by an ionic liquid, [15] and conversion to levulinic acid is enhanced by zirconium oxychloride, [16] sulfuric acid, [17] and an ionic liquid.[ 18 , 19 ] All these processes require homogeneous catalysts; however, use of homogeneous catalysts is compromised by difficulties associated with product separation from the catalysts and the recyclability of the catalysts. Thus, the development of heterogeneous catalysts for chitin conversion would be desirable.
We speculated that chitin could be converted to lactic acid, which is widely used in the food, cosmetic, pharmaceutical, and chemical industries, particularly for polylactic acid production.[ 20 , 21 ] Moreover, lactic acid can be converted into a broad range of other chemicals, including propylene glycol and acrylic acid. [22] Commercially, lactic acid is produced by saccharification‐fermentation of biomass‐derived polysaccharides such as starch and cellulose.[ 20 , 21 , 23 ] We previously reported that ZrO2‐based solid catalysts show activity for lactic acid production from cellulose,[ 24 , 25 ] but conversion of chitin to lactic acid has never been reported. In this study, we investigated the conversion of chitin into lactic acid with catalysis by simple metal oxides and found that MgO showed the best performance; MgO afforded lactic acid in 10.8 % yield and could be reused twice without loss of activity.
Experimental Section
Materials
The chitin used for most of the experiments in this study was purchased from FUJIFILM Wako Pure Chemical Corporation (1st grade), but chitin was also purchased from Toronto Research Chemicals (practical grade) and MP Biomedicals (unbleached grade). Chitosan was purchased from Sigma‐Aldrich Co. Prior to use, chitin and chitosan were ball‐milled by means of a Nitto Ball Mill ANZ‐51S with alumina balls (diameter 10 mm, total 500 g); samples (10 g) were loaded into a ceramic bottle (inner diameter 200 mm), which was spun on the ball mill at 100 rpm for 48 h.
N‐Acetyl‐D‐glucosamine and D‐glucosamine hydrochloride were purchased from FUJIFILM Wako Pure Chemical Corporation. d‐Glucose was purchased from Kanto Chemical Co. Magnesium oxide (MgO) was obtained from Ube Industries via the Catalysis Society of Japan (CSJ) (JRC‐MGO‐3 1000 A, designated as MgO‐1) and from Ube Material Industries via the CSJ (JRC‐MGO‐4 500 A and JRC‐MGO‐4 2000 A, designated as MgO‐5 and MgO‐2, respectively). Aluminum oxide (Al2O3) was obtained from Sumitomo Chemical Co. (AKP−G015). Zirconium oxide (ZrO2) and cerium oxide (CeO2) were obtained from Daiichi Kigenso Kagaku Kogyo Co. via the CSJ (JRC‐ZRO‐7 and JRC‐CEO‐5, respectively). Titanium oxide (TiO2) was obtained from Ishihara Sangyo Kaisha via the CSJ (JRC‐TIO‐14). Silicon oxide (SiO2), zinc oxide (ZnO), calcium hydroxide (Ca(OH)2), and magnesium hydroxide (Mg(OH)2) were obtained from FUJIFILM Wako Pure Chemical Corporation.
Procedure for chitin conversion reaction
Chitin conversion reactions were carried out in a stainless‐steel batch reactor (OM Lab‐Tech, MMJ‐100, inner volume 100 cm3) equipped with a screw mixer. In a typical experiment, chitin (FUJIFILM Wako Pure Chemical Corporation, 0.5 g), water (50 g), and MgO‐1 (0.5 g) were loaded into the reactor, which was subsequently purged with nitrogen gas. The reactor was then heated to 533 K and maintained at that temperature for 6 h with stirring. Upon completion of the reaction, the mixture of liquid and solid was removed from the reactor, and the solid was filtered off and dried overnight at 333 K prior to reuse.
The amounts of lactic acid, acetic acid, levulinic acid, 5‐HMF, D‐glucosamine, and N‐acetyl‐D‐glucosamine in the liquid fraction were determined by high‐performance liquid chromatography (Shimadzu) equipped with a refractive index detector (Shimadzu, RID‐10 A), a UV‐vis detector (Shimadzu, SPD‐20AV), and an ICSep COREGEL‐107H column. Total organic carbon (TOC) in the liquid fraction was determined with a TOC analyzer (Shimadzu, TOC‐VCSN), and product yields were calculated by means of equation 1:
| (1) |
The TOC (%) in the liquid fraction was based on the number of moles of carbon in the initial reactant.
Characterization of catalysts and reactants
The amount of carbon in the chitin reactant was determined with an elemental analyzer (PerkinElmer 2400 II).
The X‐ray diffraction (XRD) patterns of the catalysts and the reactants were measured on a Rigaku SmartLab XRD system with Cu Kα radiation in the 2θ range of 5–90°.
Thermogravimetry‐differential thermal analysis (TG‐DTA) of the catalysts after the reaction was carried out on a Thermo plus EVO2 TG‐DTA8122 (Rigaku) instrument at a heating rate of 10 K min−1 in flowing dry air. During TG analysis, real‐time images of the samples were recorded with the optional direct monitoring system of the TG‐DTA instrument.
The concentration of magnesium species in the liquid fraction was determined by means of inductively coupled plasma atomic emission spectrometry (SPS4000, SII NanoTechnology).
2. Results and Discussion
2.1. Catalyst screening
We began by carrying out conversion of chitin (FUJIFILM Wako Pure Chemical Corporation) in water at 473 K for 16 h in the absence of a catalyst (Table 1). Under these conditions, the TOC in the liquid fraction accounted for only 10.4 % of the carbon in the initial chitin, indicating that in the absence of pretreatment by ball milling most of the chitin remained untransformed. In contrast, when milled chitin was heated at 473 K, the TOC yield in the liquid fraction increased to 37.0 %. The XRD pattern of the unmilled chitin exhibited strong peaks at 2θ values of 9.4, 19.4, and 23.3 degrees (Figure 1), which were ascribed to the crystalline structure of α‐chitin. [26] In contrast, the XRD pattern of chitin that had been milled for 48 h showed broad peaks, indicating that the crystallinity of the chitin had been reduced by the physical pulverization. Thus, the higher TOC yield obtained from the milled chitin was attributed to a decrease in the chitin crystallinity. This result is consistent with reports indicating that decreasing cellulose crystallinity by ball milling can enhance cellulose conversion in water.[ 27 , 28 ] The products obtained by heating the milled chitin at 473 K were acetic acid (8.7 %), lactic acid (1.3 %), and 5‐HMF (1.6 %); neither D‐glucosamine nor N‐acetyl‐D‐glucosamine was observed in the liquid fraction after heat treatment. When a strongly acidic catalyst such as sulfuric or hydrochloric acid is used for chitin conversion, chitin is hydrolyzed to N‐acetyl‐D‐glucosamine, which is then deacetylated to generate D‐glucosamine and acetic acid.[ 12 , 29 ] When we increased the reaction temperature to 533 K and decreased the reaction time to 6 h (Table 1), the TOC yield from unmilled chitin was 43.7 %, whereas that from milled chitin was 49.5 %. The TOC and acetic acid yield increased with increasing reaction temperature, whereas the yield of lactic acid was not markedly affected. This result indicates that production of lactic acid from chitin requires a catalyst.
Table 1.
Product yields and TOC in the liquid fraction after heating of chitin (0.5 g in 50 g of water) in the absence of a catalyst.
|
Reaction time/h |
Temperature/K |
Chitin pretreatment |
TOC/% |
Yield/% |
||
|---|---|---|---|---|---|---|
|
Acetic acid |
Lactic acid |
5‐HMF |
||||
|
16 |
473 |
None |
10.4 |
2.1 |
0.8 |
0.9 |
|
16 |
473 |
Ball milling |
37.0 |
8.7 |
1.3 |
1.6 |
|
6 |
533 |
None |
43.7 |
10.1 |
1.8 |
0.5 |
|
6 |
533 |
Ball milling |
49.5 |
14.6 |
1.5 |
0.0 |
Figure 1.

XRD patterns of chitin (a) before and (b) after ball milling for 48 h.
Next, we carried out chitin conversion reactions at 533 K for 6 h in the presence of various metal oxides as solid catalysts, as well as in the absence of catalyst as a control (Table 2). These experiments showed that although the yield of acetic acid was unaffected by the addition of a catalyst, the yields of lactic acid were higher in the presence of MgO, Al2O3, ZrO2, and ZnO than in the absence of a catalyst. To our knowledge, catalytic conversion of chitin to lactic acid has not previously been reported. Of the tested catalysts, MgO‐1 (specific surface area 13–19 m2/g) showed the highest yield of lactic acid (10.8 %), although the yields were almost the same with MgO‐5 (specific surface area 28–38 m2/g) and MgO‐2 (specific surface area 7–8 m2/g), indicating that the yield was not affected by the physical properties of MgO, such as specific surface area. MgO is a basic catalyst, whereas the other tested catalysts have acidic and basic sites. Thus, one possible reason for the activity of MgO may have been its basicity. To explore this possibility, we also tested Ca(OH)2, which is partially soluble in water and is strongly basic. When this catalyst was evaluated under the conditions used for the other catalysts (chitin 0.5 g, Ca(OH)2 0.5 g, water 50 g, 533 K, 6 h), the yields of lactic acid and acetic acid were 18.0 and 13.2 %, respectively, which clearly shows that the basicity of the catalyst was its most important property. Although Ca(OH)2 provided the highest yield of lactic acid, this catalyst was difficult to recover and recycle, so we focused on the use of MgO as the catalyst for subsequent chitin conversion experiments.
Table 2.
Product yields and TOC in the liquid fraction obtained after heating aqueous chitin (0.5 g in 50 g of water) in the presence of various metal oxide catalysts (0.5 g) at 533 K for 6 h.
|
Catalyst |
TOC/% |
Yield/% |
||
|---|---|---|---|---|
|
Acetic acid |
Lactic acid |
5‐HMF |
||
|
MgO‐1 |
57.4 |
13.5 |
10.8 |
0.0 |
|
Al2O3 |
51.9 |
14.5 |
6.2 |
0.0 |
|
ZrO2 |
53.1 |
14.3 |
3.9 |
0.0 |
|
ZnO |
50.5 |
13.9 |
3.4 |
0.0 |
|
CeO2 |
53.2 |
14.1 |
0.7 |
0.0 |
|
TiO2 |
46.4 |
13.1 |
0.4 |
0.4 |
|
SiO2 |
47.6 |
13.1 |
1.4 |
0.0 |
|
MgO‐5 |
56.0 |
12.8 |
9.3 |
0.0 |
|
MgO‐2 |
52.8 |
14.1 |
9.4 |
0.0 |
|
None [a] |
49.5 |
14.6 |
1.5 |
0.0 |
[a] This result is also shown in Table 1.
2.2. Characterization of MgO
We measured the XRD patterns of MgO‐1 before and after chitin conversion at 533 K for 6 h (Figure 2). Before the reaction, the catalyst exhibited strong peaks at 2θ values of 43.1 and 62.4 degrees, which were ascribed to the (002) and (022) crystal planes, respectively. [30] The XRD pattern of the solid that was recovered from the reaction and dried was consistent with Mg(OH)2, as indicated by comparison of the pattern with that of a reference Mg(OH)2 sample. Thus, XRD analysis clearly showed that MgO was converted to Mg(OH)2 during the chitin conversion reaction at 533 K.
Figure 2.

XRD patterns of (a) MgO‐1 before the chitin conversion reaction, (b) solid residue recovered after the chitin conversion reaction under the conditions shown in Table 2, and (c) Mg(OH)2 as a reference.
The solid residue obtained after the MgO‐1‐catalyzed reaction was also subjected to TG‐DTA in flowing dry air, and real‐time images of the samples were recorded simultaneously during the analysis (Figure 3). At ambient temperature, the solid was brown. When it was heated, a rapid reduction in sample weight was observed from 600 to 680 K, which corresponded to dehydration of Mg(OH)2 to form MgO.[ 30 , 31 ] This result, which confirms that MgO‐1 was transformed to Mg(OH)2 during chitin conversion, is consistent with the XRD results. The TG curve indicated that most of the sample had been converted to MgO by the time the temperature reached 680 K (Figure 3d); however, the sample was still brown. As the temperature was increased further, the sample became white, indicating that a carbonaceous substance such as coke on the catalyst surface could be removed by calcination at temperatures exceeding 680 K. On the basis of these results, we concluded that the solid residue recovered from the chitin conversion reaction was Mg(OH)2 coated with a carbonaceous substance.
Figure 3.

(Upper panel) TG‐DTA curves of the solid residue obtained after MgO‐1‐catalyzed chitin conversion reaction under the conditions shown in Table 2 and (lower panels) images of samples during TG analysis. The images in panels (a) to (f) were recorded at the points indicated on the TG curve.
Next, we checked the chitin conversion activity of Mg(OH)2 (chitin 0.5 g, Mg(OH)2 0.5 g, water 50 g, 533 K, 6 h) and found that this catalyst afforded lactic and acetic acid in yields of 8.2 and 13.8 %, respectively. Although the yield of lactic acid was a little lower than that obtained with MgO (Table 1), Mg(OH)2 nevertheless showed activity for the production of lactic acid. This result suggests that the basicity of Mg(OH)2, which was formed from MgO, was responsible for the high yield of lactic acid.
2.3. Optimization of conditions for MgO‐1‐catalyzed chitin conversion
The reaction time, reaction temperature, and amount of catalyst were varied to optimize the yield of lactic acid. When the MgO‐1‐catalyzed reaction at 533 K was carried out for 1–10 h (Figure 4), the lactic acid yield increased from 8.6 to 10.8 % when the reaction time was increased from 1 to 6 h; however, at longer reaction times, the yield dropped (to 8.4 % at 10 h), presumably because the prolonged reaction time led to decomposition of the lactic acid. Variation of the reaction temperature in the 473–553 K range showed 533 K to be optimal (Table 3), probably because of lactic acid decomposition at the higher reaction temperature. Varying the amount of MgO in the 0.25–1 g range showed 0.5 g of MgO to be optimal for lactic acid production (Table 3), although the effect of changing the catalyst amount was small.
Figure 4.

Reaction‐time dependence of yield of (circles) lactic acid and (triangles) acetic acid from conversion of chitin (0.5 g in 50 g of water) catalyzed by MgO‐1 (0.5 g) at 533 K.
Table 3.
Product yields and TOC in the liquid fraction obtained after heating aqueous chitin (0.5 g in 50 g water) for 6 h in the presence of MgO‐1.
|
Reaction temperature/K |
Weight of catalyst/g |
TOC/% |
Yield/% |
|
|---|---|---|---|---|
|
Acetic acid |
Lactic acid |
|||
|
473 |
0.5 |
24.5 |
5.9 |
2.7 |
|
513 |
0.5 |
53.1 |
11.4 |
10.4 |
|
533 [a] |
0.5 |
57.4 |
13.5 |
10.8 |
|
553 |
0.5 |
68.3 |
14.4 |
6.7 |
|
533 |
0.25 |
57.1 |
12.9 |
9.1 |
|
533 |
1.0 |
57.8 |
12.9 |
10.5 |
[a] This result is also shown in Table 2.
2.4. Mechanism of chitin conversion to lactic acid
We propose that chitin conversion to lactic acid proceeds by the mechanism outlined in Figure 5. First, chitin is hydrolyzed to N‐acetyl‐D‐glucosamine, which is subsequently deacetylated to D‐glucosamine. (Alternatively, chitin could first be deacetylated to chitosan, which could then be hydrolyzed to D‐glucosamine.) D‐Glucosamine undergoes deamination to afford D‐glucose (which can isomerize to fructose) and NH3. Note that we used gas detecting tubes to check for nitrogen species in the gas phase after the reaction, and we detected NH3 but not NOx (Figure 6). This result is consistent with the deamination step in the proposed reaction mechanism. Omari et al. reported that D‐glucosamine isomerizes to afford imine, [13] which can then undergo deamination; however, the formation of an imine intermediate may not feasible in our system, owing to thermodynamic considerations. When we separately subjected N‐acetyl‐D‐glucosamine, D‐glucosamine, and D‐glucose to the conditions used for chitin conversion (Table 4), we found that the yield of lactic acid obtained from the MgO‐catalyzed reaction of N‐acetyl‐D‐glucosamine was the same as that obtained from the chitin conversion reaction. In contrast, the yield of lactic acid obtained from the reaction of D‐glucosamine or D‐glucose in the presence of MgO was higher than that from the chitin conversion reaction, indicating that the steps needed to produce D‐glucosamine or D‐glucose from chitin decreased the yield.
Figure 5.

Proposed mechanism for chitin conversion into lactic acid.
Figure 6.

Photographs of tubes used to detect (a) NH3 and (b) NOx before (upper tube) and after (lower tube) injection of gas in the reactor. The NH3 detecting tube was pink before use and changed to yellow when NH3 was detected. The NOx detecting tube was white before use and would have changed to orange‐yellow if NOx had been detected.
Table 4.
Reactions of aqueous N‐acetyl‐D‐glucosamine, D‐glucosamine, and D‐glucose (0.5 g in 50 g of water) in the presence and absence of MgO‐1 (0.5 g) at 533 K for 6 h.
|
Reactant |
Catalyst |
Yield/% |
|
|---|---|---|---|
|
Acetic acid |
Lactic acid |
||
|
N‐Acetyl‐D‐glucosamine |
None |
14.6 |
0.5 |
|
N‐Acetyl‐D‐glucosamine |
MgO |
14.8 |
7.7 |
|
D‐Glucosamine |
None |
– |
2.0 |
|
D‐Glucosamine |
MgO |
– |
23.3 |
|
D‐Glucose |
No |
– |
7.0 |
|
D‐Glucose |
MgO |
– |
35.6 |
Isomerization of D‐glucose to fructose can be catalyzed by bases,[ 32 , 33 , 34 ] and Gu et al. reported that Mg(OH)2 enhances the isomerization. [35] MgO is strongly basic, and thus in our system, isomerization of D‐glucose to fructose may have been enhanced either by MgO or by Mg(OH)2 generated from MgO. Fructose is converted to glyceraldehyde and dihydroxyacetone by a retro‐aldol reaction, which involves C−C bond cleavage and is reported to be enhanced by base catalysts.[ 35 , 36 ] We previously reported that both dihydroxyacetone and glyceraldehyde can be converted to lactic acid in water in the absence of a catalyst even at 473 K. [24]
2.5. Reusability of the MgO‐1 catalyst
We also investigated the reusability of the MgO‐1 catalyst. After each chitin conversion reaction, the solid residue (catalyst) was separated from the liquid fraction by filtration, dried at 373 K overnight, and then used for another chitin conversion reaction without being washed (Table 5). The lactic acid yields for the first reaction and the second and third reactions did not differ substantially. Unfortunately, inductively coupled plasma analysis of the liquid phase after the first reaction indicated that 15 % of the Mg had leached from the MgO‐1 into water during the reaction. We checked the leaching of Mg from the MgO‐1 without chitin (MgO‐1 0.5 g and water 50 g at 533 K for 6 h). Only 4.8 % of the Mg leached from the MgO‐1 into water during the treatment of MgO in water without chitin, indicating that acid products such as acetic acid and lactic acid accelerated the leaching of Mg. Despite the leaching, the lactic acid yield did not decrease when the catalyst was reused, because, as mentioned above (Table 3), the amount of catalyst had little effect on the yield.
Table 5.
Reuse of the MgO‐1 catalyst (0.5 g) for conversion of aqueous chitin (0.5 g in 50 g of water) to lactic acid at 533 K for 6 h.
|
|
TOC/% |
Yield/% |
|
|---|---|---|---|
|
Acetic acid |
Lactic acid |
||
|
1st use [a] |
57.4 |
13.5 |
10.8 |
|
2nd use |
59.3 |
13.7 |
10.4 |
|
3rd use |
62.9 |
14.1 |
10.1 |
[a] This result is also shown in Table 2.
Finally, we tested several grades of chitin, which were obtained from different companies, as well as chitosan as a reference, at 533 K for 6 h (Table 6). The lactic acid yield from practical‐grade chitin from Toronto Research Chemicals was a little lower than the yields from the other grades of chitin, but the difference was not large.
Table 6.
Product yields and TOC in the liquid fraction obtained by heating various grades of chitin and chitosan (0.5 g in 50 g of water) with MgO‐1 (0.5 g) at 533 K for 6 h.
|
Reactant |
TOC/% |
Yield/% |
||
|---|---|---|---|---|
|
Acetic acid |
Lactic acid |
5‐HMF |
||
|
1st grade (FUJIFILM Wako Pure Chemical) [a] |
57.4 |
13.5 |
10.8 |
0.0 |
|
Practical grade (Toronto Research Chemicals) |
56.0 |
12.7 |
8.4 |
0.0 |
|
Unbleached grade (MP Biomedicals) |
56.1 |
13.2 |
10.5 |
0.0 |
|
Chitosan (Sigma‐Aldrich) |
51.1 |
5.5 |
9.5 |
0.0 |
[a] This result is also shown in Table 2.
3. Conclusions
We investigated chitin conversion to lactic acid with catalysis by metal oxides such as MgO, Al2O3, ZrO2, ZnO, CeO2, TiO2, and SiO2. MgO showed the highest activity (lactic acid yield 10.8 %) at 533 K for 6 h. This is the first report of catalytic conversion of chitin to lactic acid. XRD analysis and TG‐DTA showed that MgO was converted to Mg(OH)2 during the reaction at 533 K. The MgO catalyst could be recovered as a solid residue after the reaction, and it could be reused twice with no loss in yield.
Conflict of interest
The authors declare no conflict of interest.
Acknowledgements
This study was supported by a Japan Society for the Promotion of Science KAKENHI (no. JP17H00803), by a Science Achievement Scholarship of Thailand (SATA), and by the Center of Excellence on Petrochemical and Materials Technology (PETROMAT), Thailand.
K. Kun-asa, P. Reubroycharoen, K. Yamazaki, N. Mimura, O. Sato, A. Yamaguchi, ChemistryOpen 2021, 10, 308.
Contributor Information
Prof. Prasert Reubroycharoen, Email: Prasert.R@chula.ac.th.
Dr. Aritomo Yamaguchi, Email: a.yamaguchi@aist.go.jp.
References
- 1. Hamed I., Özogul F., Regenstein J. M. Trends Food Sci. Technol. 2016, 48, 40–50. [Google Scholar]
- 2. Knidri H. E., Belaabed R., Addaou A., Laajeb A., Lahsini A. Int. J. Biol. Macromol. 2018, 120, 1181–1189. [DOI] [PubMed] [Google Scholar]
- 3. Kobayashi H., Ohta H., Fukuoka A. Catal. Sci. Technol. 2012, 2, 869–883. [Google Scholar]
- 4. Agirrezabal-Telleria I., Gandarias I., Arias P. L. Catal. Today. 2014, 234, 42–58. [Google Scholar]
- 5. Yamaguchi A., Sato O., Mimura N., Hirosaki Y., Kobayashi H., Fukuoka A., Shirai M. Catal. Commun. 2014, 54, 22–26. [Google Scholar]
- 6. Yamaguchi A., Sato O., Mimura N., Shirai M. Catal. Commun. 2015, 67, 59–63. [Google Scholar]
- 7. Chen H., Fu X. Renewable Sustainable Energy Rev. 2016, 57, 468–478. [Google Scholar]
- 8. Yan N., Chen X. Nature. 2015, 524, 155–157. [DOI] [PubMed] [Google Scholar]
- 9. Chen X., Yang H., Yan N. Chem. A Euro. J. 2016, 22, 13402–13421. [DOI] [PubMed] [Google Scholar]
- 10. Kerton F. M., Liu Y., Omari K. W., Hawboldt K. Green Chem. 2013, 15, 860–871. [Google Scholar]
- 11. Chen X., Yan N. Catal. Surv. Asia. 2014, 18, 164–176. [Google Scholar]
- 12. Yabushita M., Kobayashi H., Kuroki K., Ito S., Fukuoka A. ChemSusChem. 2015, 8, 3760–3763. [DOI] [PubMed] [Google Scholar]
- 13. Omari K. W., Besaw J. E., Kerton F. M. Green Chem. 2012, 14, 1480–1487. [Google Scholar]
- 14. Yu S., Zang H., Chen S., Jiang Y., Yan B., Cheng B. Polym. Degrad. Stab. 2016, 134, 105–114. [Google Scholar]
- 15. Zang H., Yu S., Yu P., Ding H., Du Y., Yang Y., Zhang Y. Carbohydr. Res. 2017, 442, 1–8. [DOI] [PubMed] [Google Scholar]
- 16. Park M.-R., Kim S.-K., Jeong G.-T. J. Ind. Eng. Chem. 2018, 61, 119–123. [Google Scholar]
- 17. Jeong G.-T. Ind. Crops Prod. 2014, 62, 77–83. [Google Scholar]
- 18. Szabolcs Á., Molnár M., Dibó G., Mika L. T. Green Chem. 2013, 15, 439–445. [Google Scholar]
- 19. Hou W., Liu L., Shen H. Carbohydr. Polym. 2018, 195, 267–274. [DOI] [PubMed] [Google Scholar]
- 20. Datta R., Henry M. J. Chem. Technol. Biotechnol. 2006, 81, 1119–1129. [Google Scholar]
- 21. Mäki-Arvela P., Salmi T., Holmbom B., Willfor S., Murzin D. Y. Chem. Rev. 2011, 111, 5638–5666. [DOI] [PubMed] [Google Scholar]
- 22. Varadarajan S., Miller D. J. Biotechnol. Prog. 1999, 15, 845–854. [DOI] [PubMed] [Google Scholar]
- 23. Martinez F. A. C., Balciunas E. M., Salgado J. M., González J. M. D., Converti A., Oliveira R. P. D. S. Trends Food Sci. Technol. 2013, 30, 70–83. [Google Scholar]
- 24. Wattanapaphawong P., Reubroycharoen P., Yamaguchi A. RSC Adv. 2017, 7, 18561–18568. [Google Scholar]
- 25. Wattanapaphawong P., Sato O., Sato K., Mimura N., Reubroycharoen P., Yamaguchi A. Catalysts. 2017, 7, 221. [Google Scholar]
- 26. Jang M.-K., Kong B.-G., Jeong Y.-I., Lee C. H., Nah J.-W. J. Polym. Sci. A. Polym. Chem. 2004, 42, 3423–3432. [Google Scholar]
- 27. Zhao H., Kwak J. H., Wang Y., Franz J. A., White J. M., Holladay J. E. Energy Fuels. 2006, 20, 807–811. [Google Scholar]
- 28. Yamaguchi A., Hiyoshi N., Sato O., Bando K. K., Shirai M. ChemSusChem. 2010, 3, 737–741. [DOI] [PubMed] [Google Scholar]
- 29. Zhang J., Yan N. ChemCatChem. 2017, 9, 2790–2796. [Google Scholar]
- 30. Mironyuk I. F., Gun′ko V. M., Povazhnyak M. O., Zarko V. I., Chelyadin V. M., Leboda R., Skubiszewska-Zieba J., Janusz W. Appl. Surf. Sci. 2006, 252, 4071–4082. [Google Scholar]
- 31. Hanlon J. M., Diaz L. B., Balducci G., Stobbs B. A., Bielewski M., Chung P., MacLaren I., Gregory D. H. CrystEngComm. 2015, 17, 5672–5679. [Google Scholar]
- 32. Liu C., Carraher J. M., Swedberg J. L., Herndon C. R., Fleitman C. N., Tessonnier J.-P. ACS Catal. 2014, 4, 4295–4298. [Google Scholar]
- 33. Carraher J. M., Fleitman C. N., Tessonnier J.-P. ACS Catal. 2015, 5, 3162–3173. [Google Scholar]
- 34. Yang Q., Sherbahn M., Runge T. ACS Sustainable Chem. Eng. 2016, 4, 3526–3534. [Google Scholar]
- 35. Gu M., Shen Z., Zhang W., Xia M., Jiang J., Dong W., Zhou X., Zhang Y. ChemCatChem. 2020, 12, 3447–3452. [Google Scholar]
- 36. Yazdani P., Wang B., Gao F., Kawi S., Borgna A. ChemCatChem. 2018, 10, 3845–3853. [Google Scholar]