

Abstract
Neuronal activity-dependent gene expression is essential for brain development. While transcriptional and epigenetic effects of neuronal activity have been explored in the mouse, such an investigation is lacking in human. Because alterations in GABAergic neuronal circuits are implicated in neurological disorders, we conducted a comprehensive activity-dependent transcriptional and epigenetic profiling of human induced pluripotent stem cell (hiPSC)-derived GABAergic neurons similar to those of the early developing striatum. We identified genes whose expression is inducible following membrane depolarization, some of which have specifically evolved in primates, and/or are associated with neurological diseases, including schizophrenia and autism spectrum disorder (ASD). We define the genome-wide profile of human neuronal activity-dependent enhancers, promoters, and the transcription factors CREB and CRTC1. We found significant heritability enrichment for ASD in the inducible promoters. Our results suggest that sequence variation within activity-inducible promoters of developing human forebrain GABAergic neurons contributes to ASD risk.
INTRODUCTION
The human brain is complex, with expanded cellular diversity, increased neuronal connectivity, and protracted stages of development compared to other mammals1–4. These differences may contribute to human-specific characteristics such as refined digital dexterity, symbolic language, and abstract thought2. However, the manner in which changes in development during evolution give rise to human or even primate-specific characteristics remain largely uncharacterized.
The development and maturation of the brain is dependent on neuronal activity in a wide range of animal species5. While protein modification, receptor trafficking, and local translation have been implicated in mediating the effects of neuronal activity, a range of evidence points to a key role for activity-driven gene expression changes in the control of mammalian neural development. In this regard, synaptic activity-induced depolarization of the postsynaptic cell triggers expression of a largely stereotyped pattern of early-response gene (ERG) transcriptional factors (TFs), which in turn drive second-wave late-response gene (LRG) programs encoding synaptic effector molecules that diverge significantly between neuronal cell types.
Human brain development, which follows a particularly long timeline, provides ample opportunity for sensory input to shape circuit architecture. However, the limited availability of primary human brain tissue in which neuronal activity can be acutely manipulated has largely precluded molecular characterization of these responses in humans. We previously identified Osteocrin (OSTN), a gene that encodes a secreted peptide in the bones and muscles of mice, as selectively induced by neuronal activity in human and macaque, but not mouse or rat, cortical excitatory neurons6, and showed that the induction of OSTN in primates relies on a series of base pair changes within an otherwise conserved enhancer sequence.
Forebrain GABAergic neurons (GNs) are another important neuronal subclass that are thought to facilitate circuit computations and behavioral adaptations unique to humans. GNs regulate activity-dependent synapse formation during developmental critical periods, maintain excitatory-inhibitory circuit balance, and generate network oscillations, among other critical functions7. Nuclei of the basal ganglia are composed almost exclusively of GNs and are critical for behaviors such as motivation, motor coordination, planning, attention, memory, and learning8. Moreover, basal ganglia dysfunction has long been implicated in movement disorders, including Huntington’s disease and Parkinson’s disease. More recently, circuits involving the basal ganglia have been associated with behavioral disorders such as Tourette’s syndrome, obsessive compulsive disorder, and autism spectrum disorder (ASD)9.
Characterization of human GN activity-dependent chromatin dynamics and transcriptional responses may thus be particularly important to our understanding of key aspects of human brain function. To this end, we employed hiPSC-derived cultures highly enriched for developing forebrain GABAergic neurons (hGNs) to profile activity-induced changes in gene expression, histone modifications, and TF binding at various timepoints after membrane depolarization. In addition, to gain insights into neurological disorder etiology, we leveraged these datasets to model neurological disease heritability enrichment in subsets of hGN promoters and enhancers, uncovering a significant enrichment for ASD heritability specifically in activity-inducible promoters that are also enriched for CREB binding. These results suggest that disruptions to activity-dependent gene expression programs within hGNs, particularly within developing striatal cell types, may play a role in ASD, and studies of activity-dependent gene regulation could facilitate functional understanding of human disease-associated genetic variation.
RESULTS
hGNs model developing forebrain GABAergic neurons
We found that hGNs differentiated from the single hiPSC line 1434 (single-genotype (1G); Supplementary Table 1) are highly enriched for membrane depolarization-responsive GABAergic neurons. Immunostaining demonstrated that hGNs were highly enriched for neuronal as opposed to glial and neural progenitor cell types (92.9% +/− 7%, n=2, MAP2+ cells, Fig. 1a, b) (1.5% +/− 1.1%, n=3, NESTIN+ cells, 0% GFAP+ cells, n=1, >10,000 cells, Extended Data Fig. 1a). RNA sequencing (RNAseq) of hGN cultures confirmed strong expression of canonical GN marker genes (Fig. 1e), with a gene expression profile typical of neurons of the ventral telencephalon and only minimal expression of non-neuronal gene markers (Fig.1e and Extended Data Fig. 1c).
Figure 1. hGNs express RNA signatures of developing forebrain GABAergic neurons.

a. Live (DIV 7) and b. immunostained (DIV 15) hGN cultures exhibit neuronal morphology and express the neuronal proteins MAP2 and NF. Images are representative of >10 independent experiments. c. Fold induction of immediate-early genes’ FOS and NPAS4 mRNA at 1 hour after membrane depolarization of hGNs compared to unstimulated mRNA levels measured by qPCR (n=4; median and interquartile range). d. hGNs form functional synapses in culture and show spontaneous inhibitory post-synaptic currents (sIPSCs), which are blocked by gabazine. e. mRNA expression levels (from 1G total RNAseq) of hGNs is consistent with an enrichment of GABAergic neuronal identities as opposed to other brain cell types or induced pluripotent stem cells (n=6; box center = mean; box minima/maxima = mean +/− 1 SE; whiskers minima/maxima = mean +/− 1 SD). f. UMAP visualization of hGN scRNAseq displaying eight striatal-like GABAergic neuronal cell clusters, three clusters of MGE- or septal-like derived GABAergic neurons, and minority populations of glutamatergic neurons and mitotic progenitor cells. g. UMAP visualizations of hGN scRNAseq with cells colored purple if RNA transcripts were detected for developmental marker genes of neural progenitors (NES), post-mitotic neurons (MAP2), forebrain identity (FOXG1), GABAergic neurons (vGAT or SLC32A1), pallial glutamatergic neurons (TBR1), MGE-derived neurons (NKX2.1), and developing striatal neurons (EBF1 and SERTAD4).
hGNs could be grown reproducibly, were stably viable over more than ten different production lots for at least three weeks in culture, and upon exposure to 55 mM potassium chloride (KCl)-induced membrane depolarization, exhibited robust induction of activity-dependent gene expression as measured by quantitative real-time PCR (qPCR)(Fig. 1c). By whole-cell patch clamp electrophysiology, we confirmed that hGNs display polarized membranes, fired at least single action potentials in response to current injection, and formed GABAergic synapses (Fig. 1d; Extended Data Fig. 1b), consistent with prior reports10–12.
We used single-cell RNA sequencing (scRNAseq) to characterize the diversity of GN subtypes present in the hGN cultures and obtained data from 37,101 cells derived from three independent differentiation lots (Fig. 1f). This analysis confirmed broad expression of neuronal, ventrally-patterned telencephalic marker genes across almost all cell clusters (Fig. 1g and Extended Data Fig. 2a, g). Neuronal clusters 0–2, 4, 5, and 9–11 displayed gene expression patterns typical of the developing striatum, with a subset of those clusters also enriched for gene expression characteristic of more mature spiny projection neurons (SPNs) (Fig. 1f–g and Extended Data Fig. 2b, c, h, i)13,14. A minority of hGN cell clusters expressed genes indicative of pallial (clusters 6, 14), neural mitotic progenitor (clusters 8, 12), or medial ganglionic eminence derived neural subtypes (cluster 13; Fig. 1f–g and Extended Data Fig. 2d, e, j)14,15. Two neuronal clusters also exhibited co-enrichment of ZIC gene expression (clusters 3, 7) a characteristic of GNs of the septum regions of the developing forebrain16 (Fig. 1f and Extended Data Fig. 2f).
To confirm the reproducibility of this culture system across multiple human genotypes, we compared total RNAseq from hGN cultures derived from the original hiPSC line with analogous cultures prepared from hiPSC lines obtained from three independent human donors (four genotypes: 4G; Supplementary Table 1). hGN cultures from all four independent genotypes expressed markers of ventral telencephalon-derived GABAergic neurons (Extended Data Fig. 1c). Spearman correlation after quantile normalization of expressed genes showed high correlations across all pairwise comparisons of human genotypes (r_S = 0.9695 – 0.9853). Uniformity across genotypes was also confirmed by immunostaining, which showed that the majority of cells across the four genotypes were neuronal (MAP2+), with only a small fraction of the cells expressing the neuronal progenitor marker NESTIN (0 – 5.1%; Extended Data Fig. 1d).
Together, our analyses identify hGNs as a depolarization-responsive predominantly post-mitotic GABAergic neuronal culture composed of cells that are similar to the embryonic ganglionic eminence- and septum-derived cell types that ultimately populate the cortex and basal ganglia as interneurons and striatal SPNs. Consistent with conclusion, transcriptomic correlation analysis with 18 human brain regions across eight early developmental stages (www.brainspan.org) showed highest similarity to postconceptional week (p.c.w.) 16 striatum (1G s_r = 0.8366, 4G s_r = 0.8474; Supplementary Table 2). Thus, hGNs are a useful cell culture model for identifying activity-dependent genes in GABAergic neurons of the human developing subcortical forebrain.
The depolarization-responsive transcriptome of hGNs
We identified activity-regulated transcripts in hGN cultures using RNASeq, comparing samples from unstimulated cultures to those harvested 15 minutes, 1, 2, and 4 hours following exposure to elevated potassium chloride (55 mM KCl) (Fig. 2). Previous studies have shown that this stimulation paradigm leads to the induction of genes in cultured neurons that are also activated in the intact mouse brain in response to various physiological stimuli6,17,18.
Figure 2. Neuronal activity-dependent gene expression of hGNs by total RNAseq.

mRNA expression level changes measured by total RNAseq of 1G hGNs at a. 15 minutes (n=3), 1 hour (n=3), 2 hours (n=6), and 4 hours (n=3) after membrane depolarization compared to expression in unstimulated cultures (n=6) represented by MA-plot. Genes with a significantly different gene expression level and a minimum fold-change magnitude of 1.5 after depolarization are marked in red. Genes having inducible expression fall above y = 0 and example gene names are labeled. b. Time courses of gene expression levels measured by total RNAseq for genes not previously known to be stimulation inducible in the brain, LINC00473 and ZNF331 (positive controls), and GAD1 (negative control). Timepoints at which the transcript was significantly induced compared to unstimulated cultures are marked with an asterisk. (n=6 (0hr, 2hr) or 3 (15min, 1 hr, and 4hr) biologically independent samples; plots display mean +/− S.E.M.) c. Diagram of CACNB2 transcript variants and exons recognized by TaqMan probes used to query transcript-specific activity-dependent expression. d. Box and whisker plot displaying fold-changes in mRNA levels of different CACNB2 transcript variants after membrane depolarization of hGNs, as measured by TaqMan qPCR (n=3–4; one-sided t-test: *p = 0.0145, **p = 0.0071). CACNB2 induction is due to increased levels of ‘short transcript D’ (NM_201570.2) in response to membrane depolarization, and is dependent on the transcription factor CRTC1.
We performed differential gene expression analysis using multiple independent lots of hGNs from the single original hiPSC line as biological replicates (1G; Figure 2, Supplementary Data 1), as well as using hGNs derived from the four hiPSC lines from independent donors as biological replicates (4G; Extended Data Figure 3, Supplementary Data 2). Calculating gene expression changes at each stimulation time point compared to the unstimulated condition and using the criteria of a q-value consistent with a false discovery rate (FDR) of 0.05 and a fold-change threshold of 1.5, we identified a total of 1,077 unique inducible genes (1G = 655, 4G = 854, 432 genes in common, z-score = 84.59; Supplementary Data 3).
Depolarization-induced gene expression in hGNs was found to broadly recapitulate that observed in other types of neuronal culture. Well-characterized ERG TFs such as NPAS4, FOS, and NR4A1 were induced in both the 1G and 4G datasets within one hour of membrane depolarization (Fig. 2a; Extended Data Fig. 3a). We also observed rapid induction of the primate lineage-restricted genes LINC00473 and ZNF331, previously identified in human neuronal cultures (Fig. 2a and b; Extended Data Fig. 3a and b)6,19. A set of LRGs was observed 2–4 hours following membrane depolarization, that includes genes encoding known inducible effector proteins such as BDNF, RGS2, and SCG2 (Supplementary Data 1–3)20,21. Consistent with prior observations, the majority of ERGs encoded nuclear proteins, whereas a large portion of LRGs encoded membrane-bound or secreted factors (Extended Data Fig. 3d). The induction of subset of these transcripts was subsequently verified by qPCR (Extended Data Fig. 3c).
This analysis also identified membrane depolarization-regulated genes that appear to be selectively induced in developing primate or human GABAergic neurons. Examples include XIRP1, an F-actin-binding protein1, and MMP1, a member of the secreted matrix metallopeptidase family that degrades extracellular matrix components during development and tissue remodeling22 (Fig. 2b; Extended Data Fig. 3c; Supplementary Data 1, 3). Subsets of midbrain and hindbrain neurons have been reported to express Xirp1 in the mouse brain (http://mousebrain.org)23, but stimulus-responsive Xirp1 expression in neurons has not previously been reported. MMP1 is expressed across the human brain during development (http://hbatlas.org/)22,24, including in the subplate and intermediate zones of the midgestational developing human cortex (http://brainspan.org)25, but expression of the MMP1 mouse homologues Mmp-1a and Mmp-1b has not previously been observed in the brain (http://mouse.brain-map.org). MMP1 and XIRP1 could thus be important during the extended period of neuronal activity-dependent maturation that human neurons undergo during development; however, when and how during evolution these loci acquired this form of regulation still remains to be determined.
Particularly abundant among hGN activity-regulated genes were long intergenic non-coding (LINC) RNAs and genes encoding proteins containing a DNA-binding zinc finger domain (ZNF), and several loci within these two gene families were found to be specific to primate genomes (Supplementary Data 4 and 5). Comparative genomic studies show that both LINC RNA and ZNF gene families underwent an expansion during primate evolution, primarily through the action of lineage-specific transposable elements and tandem duplication events, respectively26,27. In principle, these genes could enable primate- or human-specific feedback mechanisms that contribute to the rapid modulation of transcription in response to neuronal activity.
scRNAseq reveals cell-type-specific membrane depolarization-inducible gene expression
To ask how activity-regulated gene expression varies across the different cell types within our cultures, we performed scRNAseq on hGN cultures after exposure to elevated levels of KCl for 0, 1, 2, and 4 hours (Supplementary Data 6). Across the four timepoints, the relative number of cells in each of the 15 clusters were similar within each replicate, indicating minimal batch effects (37,101 cells from 11 InDrops libraries, Extended Data Fig. 4a). Subsequent analysis showed that hGNs mirrored other cell types18 in that ERG TFs are consistently induced across nearly all cell types, with LRGs exhibiting more cell-type-specific induction (Mann-Whitney p≤ 0.0055; Fig. 3a). FOS was induced in all clusters, whereas BDNF, which is known to be inducible in excitatory glutamatergic neurons but not GNs in rodent models, was selectively induced in hGN pallial neuron cluster 6 (Extended Data Fig. 4b). In total, this analysis identified 1,810 genes whose expression is induced in a cluster-specific manner within hGN cultures (Supplementary Data 7).
Figure 3. Neuronal activity-dependent gene expression of hGNs by single-cell RNAseq.
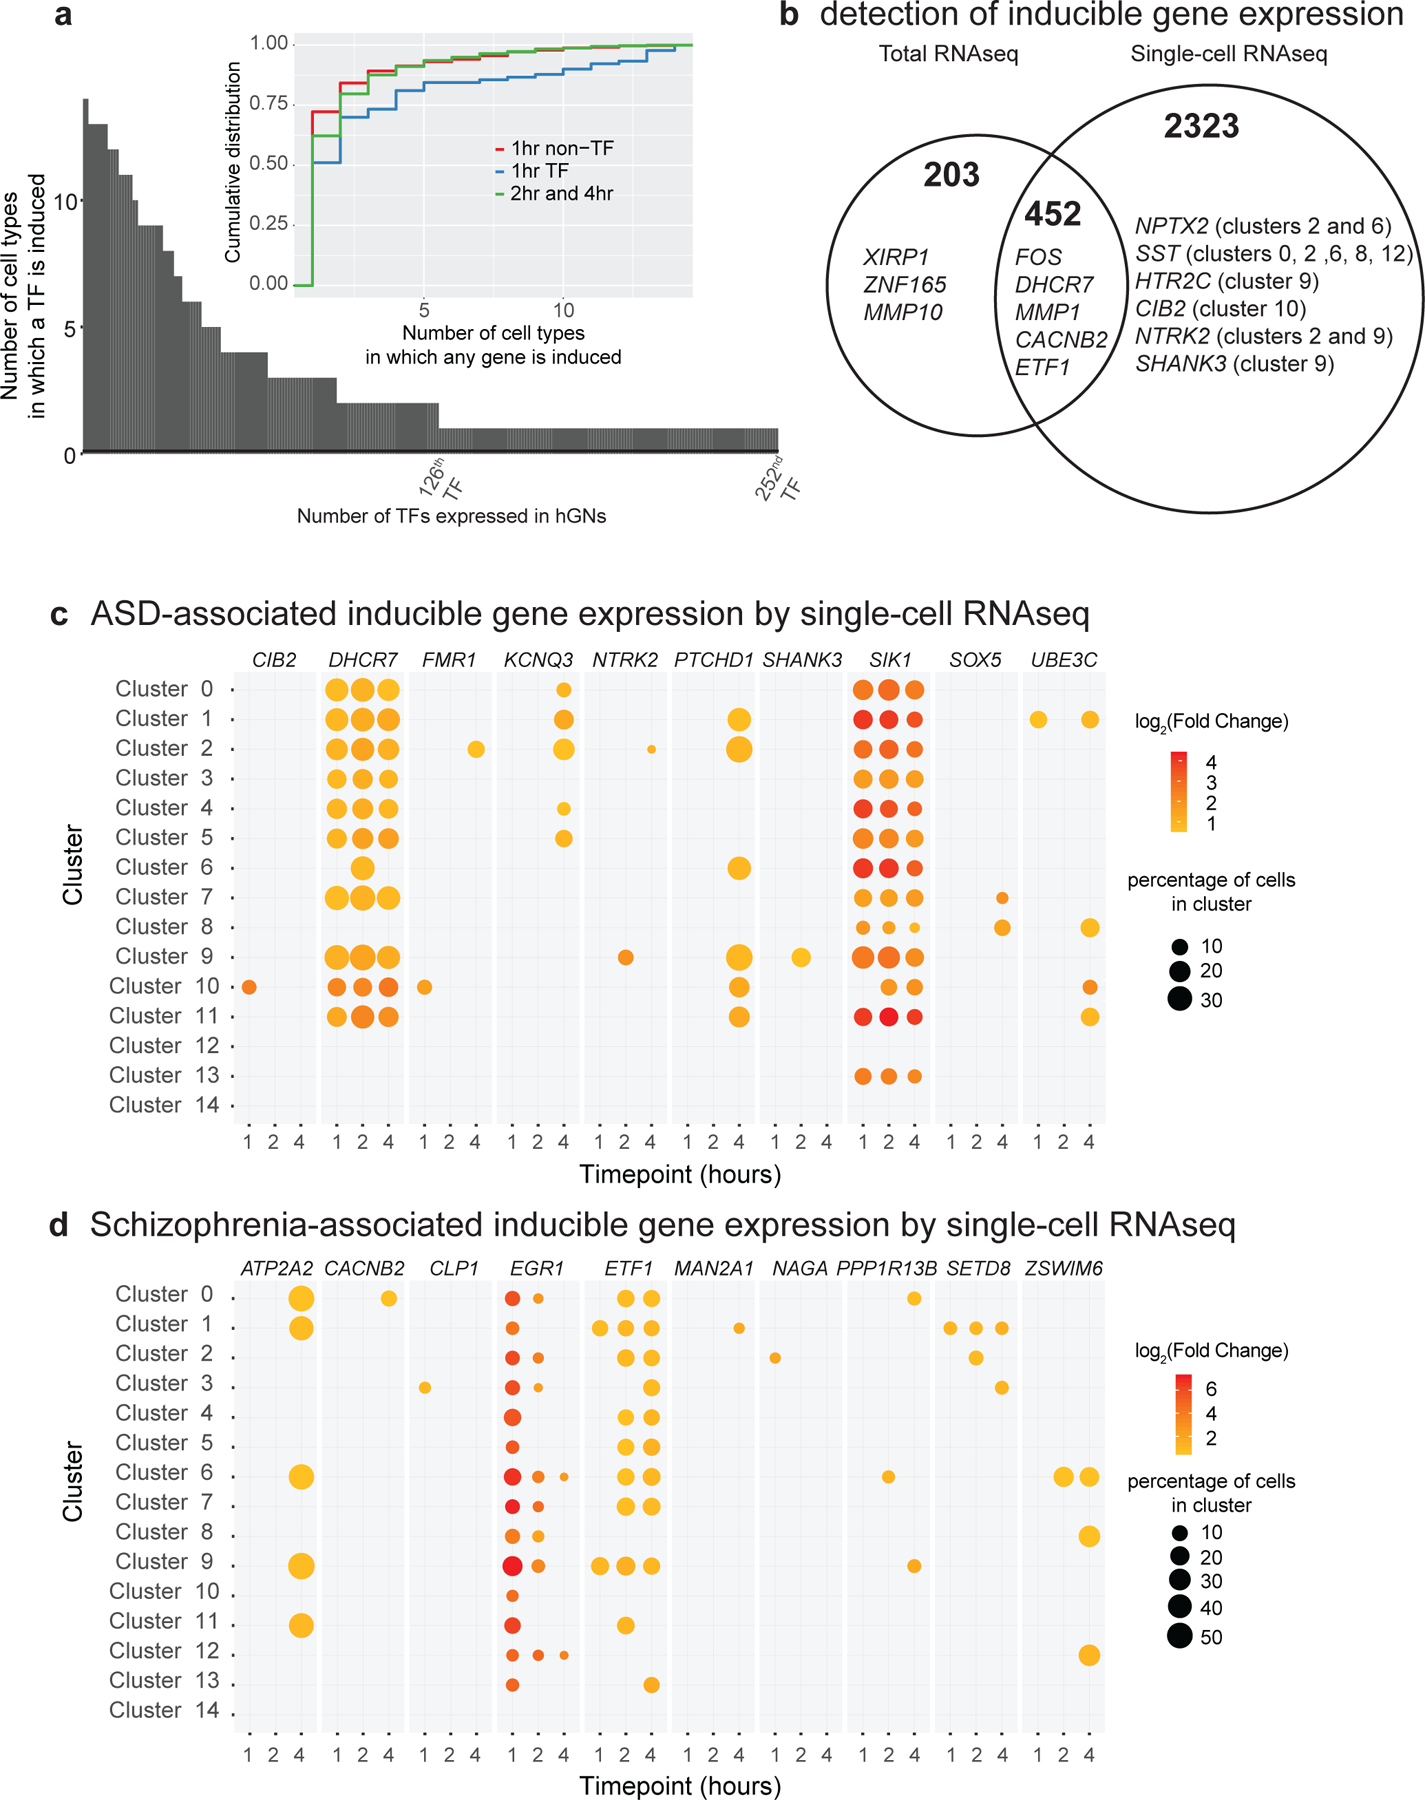
a. Single cell RNAseq of 1G hGNs reveals ubiquitous and cell-type specific transcription factor (TF) gene induction within hGN cultures. Early- inducible (1hr) TF genes are induced in more cell types than late-inducible (2 and 4 hours) TF genes. b. The genes detected to have inducible expression are partially overlapping between total and single-cell RNAseq methods. Total RNAseq can detect induction of lowly expressed genes (e.g. XIRP1), whereas single-cell RNAseq can detect induction of genes inducible in only a subset of hGN cell types (e.g. NPTX2). For total RNAseq, n=6 (0hr, 2hr) or 3 (15min, 1hr, and 4hr) biologically independent samples. c. Selected SFARI ASD-associated genes having inducible expression in hGNs, as measured by single-cell RNAseq, including genes with induction across many hGN cell clusters (e.g. DHCR7) and genes showing hGN cell-cluster restricted induction (e.g. SHANK3). d. Selected schizophrenia-associated genes having inducible expression in hGNs. The magnitude of fold-change of mRNA levels in each cell cluster at different timepoints after membrane depolarization compared to unstimulated mRNA levels is indicated by dot color. Only timepoints with significantly induced mRNA levels (compared to unstimulated) are shown. The percentage of cells in each cluster from which expression was detected is represented by the size of the dot. For scRNAseq, n= 37,101 cells examined over 3 independent experiments using independent differentiation lots of 1G neurons.
While for some mRNAs, scRNAseq detected the expression of the mRNA in too few cells to enable activity-dependent differential gene expression analysis, numerous genes were identified as activity-inducible expression by both total and scRNAseq, allowing for comparisons between the two sequencing modalities (Fig. 3b and Supplementary Data 8). For example, scRNAseq revealed that MMP1 induction is unique to striatal neuron cluster 9 of hGNs, whereas LINC00473 and ZNF331 are induced in most neuronal clusters but not mitotic progenitor clusters 8 and 12 (Extended Data Fig. 4b). In addition, scRNAseq analysis uncovered depolarization-responsive genes not detected as inducible by total RNAseq, including the previously reported inducible genes SST and NPTX2, whose expression was restricted to a subset of neuronal hGN clusters (Fig. 3b; Extended Data Fig. 4b; Supplementary Data 8).
Membrane depolarization-inducible expression of disease-associated genes
Previous studies indicate that mutations within genes that encode voltage-gated calcium channel subunits, calcium-dependent signaling molecules, and calcium-dependent transcription factors can lead to severe monogenic neurodevelopmental disorders28,29. Moreover, genome-wide association studies have suggested that sequence variation in these same gene loci may contribute to autism, schizophrenia, and bipolar disorder30–32. We asked if the set of hGN activity-inducible genes detected by scRNAseq is enriched for such disease-associated genes, compared to all hGN-expressed genes. We found that SFARI ASD-associated genes, but not SCZ-associated genes, are significantly enriched (p =1.627E-5) within the hGN scRNAseq inducible gene set (Supplementary Data 9). Nevertheless, many SCZ-associated genes were also found to be regulated by membrane depolarization in hGNs, a finding that may inform future investigations SCZ disease etiology (Supplementary Data 10).
To examine more closely how disease-associated genes are activity-regulated within hGN cultures, we looked at the induction patterns of these genes across the scRNAseq clusters. For example, salt inducible kinase 1 (SIK1), an ASD- and epilepsy-associated gene previously reported to be induced by neuronal activity, was found to be activity-inducible in nearly all post-mitotic clusters (Fig. 3c). However, several other ASD-associated genes displayed inducible expression in only a subset of hGN clusters. These include genes such as 7-dehydrocholesterol reductase (DHCR7) in striatal neuron-like clusters 5, 10 and 11, calcium and integrin binding family member 2 (CIB2) in striatal neuron-like cluster 10, and SH3 and multiple ankyrin repeat domains 3 (SHANK3) in striatal neuron-like cluster 9 (Fig. 3c). In addition to being associated with ASD, DHCR7 and CIB2 are mutated in Smith-Lemli-Opitz syndrome and Usher syndrome, respectively33,34. CIB2 is likely involved in intracellular calcium regulation and homeostasis, and its mutation causes loss of neuroblasts in zebrafish and photoreceptor cells in Drosophila34. DHCR7 reduces 7-dehydrocholesterol to cholesterol, and the accumulation of 7-dehydrocholesterol prevents formation of the Wnt receptor complex, resulting in precocious neural differentiation of hiPSCs33. SHANK3 mutations are a highly penetrant monogenic risk factor for ASD and causes Phelan-McDermid syndrome. SHANK3 is important for synaptic scaffolding, regulating spine morphology, and neurotransmission, and its disruption leads to ASD-like phenotypes in both mouse and monkey35. Future examination of the transcriptional dynamics of such genes in vivo and in disease models will be needed to determine whether their induction in developing striatal neurons affects the excitatory-inhibitory balance of circuits involved in ASD pathology36.
Several activity-regulated genes detected in hGN cultures also mapped to known SCZ-associated loci (Fig. 3d; Supplementary Data 10)30. Early growth response 1 (EGR1, or Zif268), a SCZ-associated gene known to display neuronal activity-dependent expression, was induced by membrane depolarization in nearly all hGN cell clusters (Fig. 3d). In contrast, the SCZ-associated gene Zinc finger SWIM domain-containing protein 6 (ZSWIM6) was specifically induced in pallial neuronal cluster 6 and mitotic progenitor clusters 8 and 12 (Fig. 3d). Yet another SCZ-associated gene encoding the calcium voltage-gated channel auxiliary subunit beta 2 (CACNB2) showed inducible expression specifically in striatal cluster 0 (Fig. 3d). CACNB2 encodes a cytoplasmic channel subunit that enhances Cav1 and Cav2 Ca2+ channel currents by changing the voltage dependence and kinetics of channel activation or inactivation37. Transcript-specific qPCR revealed that this induction is specific to the CACNB2 transcript variant β−2e 37 (NM_201570.2) and is dependent on the calcium-responsive coactivator CRTC1 (Fig. 2c, d). Further investigation of the cell-type-specific regulation of these disease-associated genes should provide insight into how different GN subtypes in the forebrain contribute to neuropsychiatric disease risk.
Neuronal depolarization-responsive enhancers and promoters
To understand how non-coding disease-associated genomic variation affects gene expression in human neurons, we identified the gene regulatory elements in hGN cultures that undergo dynamic activation in neurons in response to acute membrane depolarization. We performed ChIPseq to detect sites of enrichment of two histone modifications: acetylated lysine 27 of histone H3 (H3K27ac) and tri-methylated lysine 4 of histone H3 (H3K4me3). H3K4me3 is highly enriched at gene promoters, whereas H3K27ac marks active promoters as well as distal enhancer elements38 and has been shown to rapidly accumulate at stimulus-responsive regulatory elements in neurons following membrane depolarization39.
We performed H3K27ac ChIPseq on multiple differentiation lots of a single hGN genotype (1G, Fig. 4) as well as across the four hGN cultures derived from distinct hiPSC genotypes (4G, Extended Data Fig. 5). In each case, ChIPseq (n = 2 – 3) was conducted on unstimulated cultures as well as 15 minutes and two hours following KCl stimulation, when chromatin changes are underway that induce ERG and LRG expression, respectively. hGN H3K27ac enriched regulatory regions were categorized as unchanged (constitutive), inducible, or decreasing in H3K27ac enrichment at each of the post-stimulation time points (Fig. 4 a and e; Supplementary Data 11 - 12). We found a total of 72,724 H3K27ac-enriched, non-overlapping active promoter and enhancer regions in hGNs across all time points and datasets, with 48,049 and 80,638 from the 1G and 4G datasets, respectively. Of these, a subset of sequences significantly increased in H3K27ac enrichment within 15 minutes after membrane depolarization compared to the unstimulated cultures (1G = 1,677, 4G = 5,622), and an additional set (1G = 2,469, 4G = 2,401) showed increased in H3K27ac enrichment by two hours (1G: Fig. 4b; 4G: Extended Data Fig. 5b). In total, across both datasets, 9,195 regulatory regions were found to significantly increase in H3K27ac after membrane depolarization.
Figure 4. hGN activity-dependent promoters and enhancers.

a. 1G H3K27ac ChIPseq peak size changes in 15 minute or 2 hour membrane depolarized hGNs compared to unstimulated cultures represented by MA-plot. Peak regions with a significantly greater read count after membrane depolarization (inducible) are in red, and those with a significantly lower read count are in blue. b. Summary of 1G H3K27ac ChIPseq regions, their inducibility, and representation in the in vivo reference list. The majority of inducible H3K27ac ChIPseq peaks are either significantly increased at 15 minutes (early) or 2 hours (late) after membrane depolarization, but not both. c. Compared to all 1G H3K27ac ChIPseq regions, 1G early-inducible regions are enriched for those that overlap with a TSS (promoter regions) and 1G late-inducible regions are enriched for those that do not overlap a TSS (enhancer regions). d. The CREB binding sequence is the most enriched sequence motif within 15 min inducible H3K27ac regions and the AP-1 motif is the most enriched within 2 hour inducible H3K27ac regions. e. Aggregate plots of 1G H3K27ac ChIPseq reads within inducible H3K27ac ChIPseq regions before (unstim) and after 15 minutes or 2 hours of membrane depolarization.
To examine inter-donor variability in the data, we correlated fold-changes in H3K27ac enrichment between each of the three independent genotypes and the fourth, 1G genotype at both stimulation time points, yielding Pearson’s correlation coefficients of 0.74 – 0.81 (Extended Data Fig. 5f). Hierarchical clustering of fold-changes in H3K27ac enrichment at these genomic regions revealed subsets with variability in induction levels across cells lines (Extended Data Fig. 5g). This variability may result from a combination of several factors, including genetic variation between individuals, technical variability between different hiPSC reprogramming methods, and mutations that may have been enriched during primary donor cell outgrowth and reprogramming (see Supplementary Table 1). Variability in H3K27ac enrichment across samples was greater at the two-hour timepoint than at the 15-minute timepoint, consistent with late-wave inducible transcriptional programs being more cell-type-specific than early-wave programs (Fig. 3a)18. However, despite these sources of variation, the majority of peaks of H3K27ac enrichment showed similar trends among all four donors.
We confirmed the ability of a subset of the identified activity-responsive gene regulatory elements to drive inducible reporter gene expression in response to membrane depolarization in mouse cortical cultures (Extended Data Fig. 5e). Notably, we found that H3K27ac promoter regions were significantly more likely to be associated with inducible gene loci than constitutively active promoters (1G and 4G p-value < 2.2e-16). To investigate the in vivo relevance of hGN H3K27ac regulatory elements, we compiled a merged list of H3K27ac-enriched genomic sites previously reported in three studies using human developing and adult brain tissues to create an in vivo reference list (IVRL) of human brain H3K27ac regions (see Methods). The majority of active hGN H3K27ac regions (81% of 1G, 76% of 4G) were found to overlap with previously reported H3K27ac-enriched sites in vivo (Fig. 4b; Extended Data Fig. 5b), strongly suggesting that these elements represent functional regulatory regions in the human brain. However, late-response elements had a lower (1G = 72%, 4G = 75%) representation in the IVRL, compared to early-response elements (1G = 98%, 4G = 99%), likely reflecting the difficulty of detecting cell-type-restricted enhancers in the context of highly heterogeneous brain tissue.
Most inducible regulatory elements in our datasets showed an increase in H3K27ac enrichment at either 15 minutes or at two hours after stimulation, but not both (Fig. 4b; Extended Data Fig. 5b). When comparing early- and late-inducible H3K27ac regions, we noted that early-inducible (15 minutes) regions were enriched for promoter elements (1G and 4G = p< 2.2e-16; Fig. 4c; Extended Data Fig. 5c), whereas late-inducible regions were enriched for enhancer elements (1G = p < 2.2e-16; Fig. 4c). To investigate the molecular mechanisms underlying these regulatory differences, we performed ATACseq at these same timepoints following stimulation to narrow down the regions within the regulatory elements that are likely to bind TFs (1G: 81,240 ATACseq peaks, 4G: 115,081 ATACseq peaks) and then carried out TF-binding motif enrichment analysis on the 500 bp regions centered on the ATACseq peak summits. This analysis identified the full (TGACGTCA) and half (TGACG) canonical cAMP/Ca2+-responsive element (CRE) motifs, recognized by the transcription factor CREB and its CRE-modulator protein family members, as the top enriched motifs within early-inducible elements (Fig. 4d; Extended Data Fig. 5d). By contrast, the AP-1 motif (TGASTCA), recognized by heterodimers of the FOS and JUN transcription factor family proteins, was the top enriched motif within two-hour inducible H3K27ac elements (Fig. 4d; Extended Data Fig. 5d). In addition to these motif analyses, our parallel epigenomic datasets allowed us to employ a recently reported activity-by-contact (ABC) model to predict novel enhancer-gene interactions40. Using ATACseq and H3K27ac ChIPseq data across the three timepoints, the ABC model returned over 32,000 predicted constitutive and depolarization-induced regulatory interactions that provide an expanded view of hGN enhancer-gene regulation (Extended Data Fig. 8, Supplementary Data 13).
Genome-wide binding profile of the activated CREB complex in hGNs
Given CREB’s important roles in calcium-dependent gene regulation, neuronal survival, and brain development and plasticity41–43, it is a good candidate to be a central mediator of early-response promoter remodeling in response to membrane depolarization. To begin to characterize CREB activation patterns in hGNs, we immunostained hGN cultures using anti-CREB antibodies as well as antisera specific for the activated form of CREB phosphorylated at serine133 (pCREB)44. In addition, we also used immunostaining to examine the subcellular localization of CRTC1/TORC1, an important evolutionarily conserved cofactor for CREB-dependent transcription that has been reported to undergo regulated translocation into the nucleus in response to neuronal activity45. Together, these studies confirmed CREB’s expected nuclear localization in hGN cultures and demonstrated increased CREB phosphorylation and CRTC1 nuclear translocation within 15 minutes of depolarization (Fig. 5a, Extended Data Fig. 6).
Figure 5. Genome-wide binding of the activity-dependent CREB Complex.

a. Immunostaining of 1G hGN cultures for pCREB (red), CRTC1 (purple), and MAP2 (green) before and 15 minutes after membrane depolarization. After depolarization, nuclear pCREB and CRTC1 increase. Images are representative of 3 independent experiments. b. Genome browser tracks of all 1G total RNAseq, ChIPseq, and ATACseq data generated at the ASD-associated inducible gene locus DHCR7 (pooled and normalized reads from 2–3 biological replicates of ChIPseq and ATACseq, or 3–6 biological replicates of total RNAseq, for each condition). DHCR7 is encoded on the negative strand of chromosome 11, therefore transcript reads accumulate downward. CREB complex is also bound at the DHCR7 promoter in mid-gestational primary human fetal cortex. The ‘half CRE’ track indicates locations of the minimal CREB binding motif in this region. The ‘vert.cons.’ track represents sequence conservation across 100 vertebrate species, and sites predicted to be conserved are assigned positive scores (blue), while sites predicted to be fast-evolving are assigned negative scores (red). c. Overlap of CREB, pCREB, and CRTC1 ChIPseq peaks used to define the CREB complex-bound regions. Diagram circles and overlap are proportional to the number of peaks for each TF ChIPseq. d. Genomic distribution plot of CREB complex ChIPseq peaks reveals that 85% of CREB complex peak summits are proximal (<1.7kb; green) to a gene’s TSS. e. Aggregate plots of CREB, pCREB, and CRTC1 ChIPseq reads within 15 min inducible H3K27ac regions and 2hr inducible H3K27ac regions with and without stimulation. Both pCREB and CRTC1 enrichment increase after hGN membrane depolarization and greater enrichment of CREB complex is seen in early inducible H3K27ac regions than in late inducible H3K27ac regions.
We performed ChIPseq for CREB, pCREB, and CRTC1 using 1G hGNs prior to and fifteen minutes following membrane depolarization (n = 2–3), as well as from mid-gestational human fetal cortex to serve as an in vivo comparison (Fig. 5b). CREB was typically observed pre-bound prior to stimulation, with increased phosphorylation of CREB Ser133 and the association of CRTC1 observed upon membrane depolarization. This analysis identified 5,484 high-confidence CREB complex binding sites, defined as sites associated with CREB, pCREB, and CRTC1 following membrane depolarization, in hGNs (Fig. 5c). Virtually all (99%) of these CREB complex sites overlap with active H3K27ac-enriched regulatory elements, with 95% associated with a full or half canonical CRE motif sequence. Moreover, in agreement with the traditional view of CREB as a promoter-bound transcription factor41, the majority (85%) of CREB complex sites were located proximal to (< 1.7 kb) a gene TSS (Fig. 5d).
Consistent with our prior TF-binding motif enrichment analysis, activated CREB complex was present at the majority (86.5%) of early-induced H3K27ac regions and only a minority (22.3%) of late-inducible H3K27ac regions (Fig. 5e). Notably, 88% of early-inducible H3K27ac regions with a CRE were also associated with CREB complex as opposed to 11% at late-inducible CRE-containing regions, indicating that this binding enrichment (p-value < 2.2e-16) does not simply reflect enrichment of CRE sequence motifs in early-inducible regulatory elements. Indeed, the presence of a CRE-binding motif within an active regulatory element (36,559 H3K27ac regions with a full or half CRE) was far from predictive of CREB protein association since only 15% of these regions (5,331) were bound by the activated CREB complex, and only 20% (7,244) by CREB/pCREB. These studies thus suggest that additional, as yet uncharacterized genomic factors bias CREB binding to promoter regions and underscore the need for chromatin occupancy studies to identify bona fide CREB-binding sites in a given cell type.
Neurological disease heritability enrichment in hGN activity-inducible regulatory regions
Genome-wide association studies (GWAS) have uncovered hundreds of loci associated with neuropsychiatric diseases. However, identifying causal variation within non-coding regions requires a better understanding of tissue-specific regulatory structure. Having defined active and stimulus-responsive promoters and enhancers and CREB complex binding sites in hGNs, we asked if these regions were enriched for sequence variation associated with neuropsychiatric disease by applying stratified linkage disequilibrium score regression (LDSC) (see Methods), a statistical model that is widely used to identify categories of genomic regions that have significantly more trait heritability than expected by chance. This model estimates disease heritability enrichment in genomic regions of interest based on the linkage disequilibrium score between SNPs, whose heritability effect sizes were inferred from previously reported GWAS. LDSC also controls for variation in genetic features such as sequence conservation, as well as variation in epigenetic features shared across human tissues, such as DNA methylation and histone modification enrichment. In addition, we included previously annotated regions of H3K27ac enrichment from human brain, annotated brain regulatory elements from ENCODE, and brain regulatory elements as annotated by ChromHMM from the Roadmap Epigenomics Mapping Consortium as control categories to further account for the brain-like chromatin states that might be expected to be overrepresented in any human neuronal culture system (see Methods).
Subsets of hGN promoters and enhancers from both 1G and 4G datasets were tested for heritability enrichment across a panel of neurological (schizophrenia, SCZ; bipolar disorder, BP; major depressive disorder, MDD; autism spectrum disorder, ASD; attention deficit hyperactivity disorder, ADHD) and non-neurological conditions (type 2 diabetes, T2D; cardiac disease, hypothyroidism, asthma, eczema, irritable bowel disease, IBD; rheumatoid arthritis, RA) for which large GWAS have been performed (Fig. 6a; Supplementary Table 3; Extended Data Fig. 7). First, we analyzed the disease heritability enrichment of hGN H3K27ac-defined promoter regions and enhancer regions (Fig. 6b and Extended Data Fig. 7a and b; Supplementary Data 14). We found that hGN enhancer regions from both 1G and 4G H3K27ac ChIPseq experiments were enriched for disease heritability across neurological, but not non-neurological, disorders, consistent with enhancers representing the primary drivers of cell-type-specific gene expression46. By contrast promoter regions were collectively enriched for heritability for some non-neurological disorders and were enriched in heritability for all tested neurological disorders, likely reflecting overlap between genes that are essential for healthy brain function and the health of other organs.
Figure 6. Disease heritability enrichment in hGN promoter and enhancer regions.

a. Diagram summarizing the relationship between hGN H3K27ac ChIPseq peak regions and the sub-regions investigated for disease heritability enrichment. b. Heritability enrichment of 4G hGN H3K27ac promoter regions and enhancer regions across neurological and non-neurological diseases. c. Heritability enrichment of the 4G inducible and constitutive 500bp enhancers across neurological diseases, showing only constitutive enhancers having significant heritability enrichment. Pairwise two-sided t-test *p < 0.05 d. Heritability enrichment of the 4G inducible and constitutive 500bp promoters across neurological diseases, showing significant enrichment of ASD and BP heritability in inducible promoters, but not constitutive promoters. SCZ heritability is similarly enriched in inducible and constitutive promoters. Pairwise two-sided t-test *p < 0.05 e. Known sequence motifs enriched within inducible 500bp promoters compared to constitutive 500bp promoters from both 1G and 4 G data sets. Each heritability enrichment value is provided in bar plot (+/− std. error). n.s. = not significantly different. Heritability enrichments with multi-test corrected p-values ≥ 0.05 are cross-hatched. Exact p-values are provided in Supplementary Table 14.
Using LSDC, we identified heritability enrichments of constitutive H3K27ac enhancer regions for all five neurological disorders (SCZ, BP, MDD, ADHD, ASD), whereas the enrichment in inducible H3K27ac enhancer regions was not statistically significant (Extended Data Fig. 7c). Significant enrichments were also found for the central 500 bp of the ATACseq regions, presumed sites of TF binding, within the constitutive H3K27ac enhancer regions (constitutive enhancers) from both 1G and 4G experiments but not those of the inducible enhancers (Fig. 6c and Extended Data Fig. 7d). These analyses indicate that the neurological disorder heritability enrichment of hGN enhancers is limited to constitutive enhancers.
Further examining disease heritability enrichment within hGN promoter regions, we found that H3K27ac hGN promoter regions were significantly enriched for heritability across neurological disorders and had a significantly greater magnitude of heritability enrichment than enhancer regions for SCZ (1G p = 1.1E-8, 4G p = 2.1e-8), BP (1G p = 2.9E-7, 4G p = 1.2E-4), and ASD (1G p = 0.046, 4G p = 0.017), (Fig. 6b and Extended Data Fig. 7a; Supplementary Data 14). To more carefully exclude adjacent non-promoter sequences within H3K27ac-enriched regions, we designated the 500 bp sequence upstream of every annotated TSS in the human genome as a promoter and tested the heritability enrichment of just the promoter within inducible and constitutive H3K27ac regions. Inducible promoters showed significant enrichment for ASD heritability in both 1G and 4G (1G p = 0.046, 4G: p = 0.017) and for BP and SCZ in 4G (P = 6.0E-3 and P = 2.0E-3, respectively) (Fig. 6d; Extended Data Fig. 7f, g). Notably, we also observed an increase in ASD heritability enrichment magnitude from 13.75 (1G) and 18.26 (4G) to 66.00 (1G) and 37.87 (4G) (Fig. 6d, Extended Data Fig. 7e, f) despite having dramatically reduced the size of the genomic test regions. By contrast, constitutive promoters carried significant enrichment only for SCZ heritability, but not ASD or BP (Fig. 6d; Extended Data Fig. 7e). Together, these results suggest that activity-inducible promoters in developing forebrain GNs are important components of ASD and BP genetic architecture and may also contribute to the genetic architecture of SCZ.
To identify TFs that might regulate hGN inducible promoters enriched for ASD and BP GWAS heritability, we examined sequence motifs enriched within inducible promoters as compared to all constitutive promoters. Similar to our previous analysis, the CREB-binding CRE motif was identified as the most enriched motif within all inducible 500 bp promoters (Fig. 6e), and CREB complex ChIPseq data confirmed that CREB binding was significantly enriched at 1G inducible promoters compared to constitutive promoters (p < 2.2E-16). In addition, the binding motif for NRF-1, a TF reported to contribute to calcium-dependent gene expression in muscle cells47, was also significantly enriched in 1G inducible promoter elements. Together, these findings suggest that CREB, along with additional transcription factors such as NRF-1, may co-regulate an important set of calcium-responsive genes in developing human GNs, and that disruption of this regulatory network may contribute to ASD and/or BP risk.
Finally, having established that depolarization-inducible hGN promoters are enriched for ASD risk, we returned to our transcriptional data to better understand the relationship between hGN inducible genes and ASD. We asked if inducible genes specific to any individual scRNAseq cell clusters were enriched for SFARI ASD-associated genes. Progenitor cluster 8 and striatal pre-SPN cluster 10 inducible genes were significantly enriched for SFARI ASD-associated genes compared to all expressed genes within those clusters (8: p = 9.27E-4, 10: p = 4.11E-4). In addition, by scRNAseq pre-SPN cluster 10 exhibited the highest proportion of its inducible genes to also have inducible promoters, compared to other clusters (Extended Data Fig. 7g). These findings suggest that ASD-associated sequence variation within inducible promoters and their cognate genes may affect ventral forebrain neuronal progenitor and developing SPN function.
DISCUSSION
Activity-dependent gene programs regulate nervous system development and function. However, deep characterization of these gene expression programs in human brain has proven difficult because the brain is a heterogenous tissue, and the activity-dependent gene programs diverge significantly between neuronal subtypes. Here, we comprehensively profile depolarization-responsive changes in gene expression and gene regulatory element activity in a hiPSC-derived culture model of human forebrain GABAergic neurons, identifying numerous loci not previously known to be regulated by neuronal activity.
We have employed this resource to gain a deeper understanding of neuropsychiatric disease etiology. Using scRNAseq, we show that the ASD-associated genes DHCR7 and SHANK3, as well as the SCZ-associated genes CACNB2 and ZSWIM6, undergo inducible gene regulation in hGNs, suggesting that these disease genes may be subject to previously unappreciated activity-dependent regulation in human GABAergic neurons. More broadly, we find that hGN neural progenitor cells and pre-SPN neurons induce a disproportionately large number of ASD-associated genes, suggesting that cells of the developing striatum may be vulnerable to the effects of ASD-associated genetic variation. Our results thus corroborate previous indications that immature GABAergic neurons of the forebrain are a relevant cellular context for ASD-associated variations in gene expression48,49, and specifically implicate activity-dependent gene regulation in this process.
Extending this analysis to activity-responsive gene regulatory elements, we find that inducible promoters, but not inducible enhancers, in hGN cultures carry a significant enrichment for BP heritability as well as a strikingly large ASD heritability enrichment. In contrast, no such distinction could be made between inducible and constitutive promotors for SCZ or other neurological disorders. These findings suggest that the subset of gene promoters in hGNs that undergo significant increases in H3K27ac in response to neuronal depolarization contribute to ASD risk. Our results thus not only add to converging evidence that promoters are critical regions driving ASD risk50, but also suggest that activity-induced promoters within hGNs may contribute significantly to this risk.
Additionally, binding motifs for CREB, NRF1, NFY, and RFX1 family TFs were found to be enriched within activity-inducible promoters harboring elevated ASD-heritability. While to date we have only confirmed direct binding of the activated CREB complex at these promoters using ChIPseq, interactions between CREB and NRF1 proteins have previously been reported at stimulus-responsive loci47. Our findings raise the possibility that CREB and NRF1 binding at activity-dependent promoters might be disrupted in ASD, and that functional investigation of sequence variation affecting these and other critical transducers of neuronal calcium signaling should be prioritized.
Our finding that depolarization-induced genes of pre-SPN-like cells are enriched for ASD-associated genes, taken together with the neurological disease heritability enrichment observed in these activity-responsive gene regulatory elements, suggests a possible role for dysregulated calcium-dependent gene expression within developing striatal neurons in ASD etiology. Moreover, our assembled data will enable improved fine mapping of neurological disease-associated sequence variants within neuronal activity-dependent regulatory elements and lay the foundation for future comparisons between the activity-dependent regulatory landscapes of different human neuronal subtypes so as to uncover new aspects of human gene regulation during brain development and disease.
METHODS
Statistical Analyses
Boxplots depict median (center), +/− 1 quartile (box), and +/− 2 quartiles (whiskers), unless otherwise noted. t-tests are unpaired and without correction for multiple comparisons, unless otherwise noted. The p-values of motif enrichments were obtained using HOMER (Hypergeometric Optimization of Motif EnRichment) findMotifsGenome.pl with default settings. No statistical methods were used to pre-determine sample sizes but our sample sizes are similar to those reported in previous publications18, 39. For ChIPseq experiments, a minimum of 2 biological replicates (independent production lots of neuronal cultures) were used for each condition. For all other experiments, a minimum of two biological replicates were used, but typically 3–4 whenever possible, except for GFAP immunostaining for which one experiment was obtained, and results were corroborated by single cell RNAsequencing and total RNA sequencing. This was deemed sufficient due to the high reproducibility of the cultures as measured by RNAseq and immunostaining. Data collection and analysis were not performed blind to the conditions of the experiments.
hGN cultures
1G hiPSC-derived GABAergic neurons were obtained commercially (Cellular Dynamics International iCell Neurons, NRC-100-010-001— now sold as iCell GABANeurons, R1013). Other hGN genotypes (1501, 1505, CW20049) were purchased as iCell GABANeurons derived from independent hiPSC lines: see Supplemental Table 1. Samples were received on dry ice and stored in liquid nitrogen until usage. Cell culture plates were precoated overnight with a solution of 20 µg/mL Poly-L-ornithine (Sigma) and 20 µg/mL laminin (Invitrogen) in sterile water. Before plating, the cell culture plates were washed twice with sterile water and washed once with iCell Neurons Complete Maintenance Medium (CMM). iCell Neurons were thawed, plated, and maintained according to the iCell Neurons User’s Guide (Version 1.4). Briefly, they were thawed in a 37˚C water bath for 3 minutes, transferred to a 50 mL centrifuge tube, diluted in warm CMM, and plated at 150–200K cells/cm2. A complete media change was done 24 hours after plating. Every 3–4 days thereafter, cells were fed by removing 50–70% of media and replacing with fresh 37˚C media. Neurons were grown until the fourteenth to seventeenth day in vitro (DIV 14–17).
Independent production lots of 1G iCell GABANeurons are obtained from independent differentiation instances by Cellular Dynamics International. Therefore different production lots were treated as “biological replicates” within one genotype (1434) for statistical purposes. When assessing genomic patterns across genotypes, one production lot of each genotype (1434, CW20049, 1501, 1505) was obtained, grown, and assayed in parallel, and each genotype was instead treated as a biological replicate. Technical replicates were obtained for statistical purposes when cells from the same production lot were grown, harvested, and assayed more than once and on separate experimental days.
Human tissue specimens
Research performed on samples of human origin was conducted according to protocols approved by the institutional review boards of Beth Israel Deaconess Medical Center, Boston Children’s Hospital and Harvard University Faculty of Medicine. Fetal brain tissue was received after release from clinical pathology, with a maximum post-mortem interval of 4 h. Tissue was transported in HBSS medium (Life Technologies) on ice to the laboratory for research processing and stored at −80°C. Cases with known anomalies were excluded. Two human fetal cortical samples were used for CREB and CRTC1 ChIPseq experiments: FB08 (19 gestational weeks) and FB25 (23 gestational weeks). Gestational ages were determined using fetal foot length.
KCl depolarization of cultured neurons
DIV 14–17 hGNs or DIV 7 E16.5 mouse cortical cultures (for luciferase assays) were silenced overnight with 1uM TTX and 100 uM APV for 12–16 hours. Then the next day neurons were left in the silenced condition (unstimulated) or depolarized for various times with KCl depolarization buffer (170 mM KCl, 2mM CaCl2, 1mM MgCl2, 10mM HEPES, solution pH 7.4) to a final concentration of 31% in the neuronal culture medium, achieving a final KCl concentration of 53mM.
siRNA treatment of hGN cultures
Accell siRNA SMARTpool 50nM (human CRTC1 23373 or non-targeting (NT) pool GE Healthcare Dharmacon) were first resuspended in 1x siRNA buffer (Fisher Scientific # B2000UB100) to a final concentration of 100uM. siRNA was then added to neuronal cultures at a 1:100 dilution for a final concentration of 1uM in media every 72 hours starting at DIV 7 until the cultures were harvested. During each siRNA addition neuronal media was replaced with 50% hGN conditioned media and 50% new media. CRTC1 siRNA treatment for 6 days resulted in an average knockdown of 61.8% (standard deviation = 18.7%), 9 days resulted in 64.1% knockdown (SD= 4%).
Immunocytochemistry, imaging, and quantification
DIV 14–17 hGN cultures, grown on sterile poly-L-ornithine and laminin coated no.1 glass coverslips (Fisher 501215159), were fixed with a solution of 4% paraformaldehyde and 4% sucrose in 1× PBS pH 7.4 for 8 min at room temperature, blocked for 1 hr at 4°C with 0.1% (w/v) gelatin and 0.3% (v/v) Triton X-100 in 1× PBS pH 7.4 (GDB), and incubated overnight at 4°C with the following primary antibodies diluted in GDB: anti-NESTIN (mouse, 1:500, R&D # MAB1259), anti GFAP (rabbit, 1:500, Dako # Z033429-2), anti-MAP2 (chicken, 1:1,000, Lifespan Biosciences, LS-C61805), anti-neurofilament [SMI-312] (1:1000, Abcam, ab24574), anti-CREB (1:500, EMD Millipore #06-863), anti-CRTC1 (1:500, Bethyl Laboratories 300-769), anti-Ser133 pCREB (1:500, Cell Signaling 87G3 #9198S). All secondary antibodies were AlexaFluor-conjugated (Life Technologies/Invitrogen) and incubated at 1:1000 dilution in GDB 1 hr at 4 °C. Coverslips were mounted with DAPI Fluoromount G (SouthernBiotech). Immunostained samples were imaged on imaged on either an AxioVision Imager Z1 (Zeiss) or a Leica SP8X confocal microscope (Neurobiology Imaging Facility). Live cultures were imaged on a Nikon Eclipse TS100. Immunostained culture images from 1–2 separate coverslips (experimental replicates) of 1–3 production lots of hGNs (biological replicates) were manually counted to quantify the number of cells expressing a given protein. Proportions were calculated by dividing by the total number of DAPI+ nuclei in the same images, obtained by custom Fiji macros (available upon request).
Quantitative PCR
Isolated total RNA was extracted using Trizol (Invitrogen) followed by RNeasy Micro Kit (Qiagen) including on-column DNaseI digestion. cDNA libraries were synthesized using a High Capacity cDNA Reverse Transcription Kit (Applied Biosystems) or the SuperScript IV VILO Master Mix with ezDNase Kit (Invitrogen). The cDNA was the source of input for quantitative real time PCR with SYBR Green reagents (Applied Biosystems) or TaqMan reagents (see below), using a Step One Plus Real-Time PCR Instrument and for FOS and NPAS4 transcript detection or a Quant Studio 3 System (Thermo Fisher) for all other transcripts. Using Microsoft Excel for Mac version 16, the NPAS4 and FOS relative expression plot was constructed using concentration values that were normalized to corresponding GAPDH concentrations, while qPCR relative expression plots in Extended Data Figure 3c were constructed using concentration values normalized to PGK1. The following primer sets were used for DHCR7 F-5’-TCCACAGCCATGTGACCAATGC-3’, R-5’-CGAAGTGGTCATGGCAGATGTC-3’. DHCR24 F-5’-CAGGAGAACCACTTCGTGGAAG-3’, R-5’- CCACATGCTTAAAGAACCACGGC-3’. FOS F-5’-AGGTCCGTGCAGAAGTCCT-3’, R-5’-AGGTCCGTGCAGAAGTCCT-3’. GPR3 F-5’-CCTTCACTGTCTACTGCCTGCT-3’, R-5’- TCTGCACATCCTGGTTGCGGAA-3’. GAPDH F-5′-GTCTCCTCTGACTTCAACAGCG-3′, R-5′-ACCACCCTGTTGCTGTAGCCAA-3′. KCNQ3 F-5’-CGTCTGATTGCCGCCACCTTTT-3’, R-5’- TTCTGACGGTGTTGCTCCTGCA-3’. MMP1 F-5’- ATGAAGCAGCCCAGATGTGGAG-3’, R-5’- TGGTCCACATCTGCTCTTGGCA-3’. NPAS4 F-5′-TGGGTTTACTGATGAGTTGCAT-3′, R-5′-TCCCCTCCACTTCCATCTT-3′. PGK1 F-5’-CCGCTTTCATGTGGAGGAAGAAG-3’, R-5’-CTCTGTGAGCAGTGCCAAAAGC-3’. PTCHD1 F-5’-CGGATTGGTGACCATAAGCCTG-3’, R-5’- CGGATTGGTGACCATAAGCCTG-3’. SHANK3 F-5’-AGGATCACACCCGCCGAGATTA-3’, R-5’-CTACAGACTTGGTCCGTGGAATC-3’. XIRP1 F-5’-AACTCCAGGCAGCAGTGGGAAT-3’, R-5’-AGAGAGTAGGCAGTCAGTGCGA-3’.
TaqMan reagents (Thermo Fisher) were used for CACNB2 transcript measurements. For TaqMan qPCR of CACNB2 transcripts, 9-day treatment NT or CRTC1 siRNA cultures were used that were unstimulated or KCl depolarized for 2 hours. The following Taqman probes were used: (A) custom probe for long transcripts NM_201597.2, NM_201593.2, NM_201596.2; (B) custom probe for long transcripts NM_201572.3, NM_201571.3, and NM_001167945.1; (C) Hs_01100744_m1 probe for pan-CACNB2 transcripts; and (D) Hs01110867_m1 probe for short transcript NM_201570.2.
Electrophysiology
Two biological replicates of hGNs were cultured separately, as described above, on sterile poly-L-ornithine and laminin coated no.1 glass coverslips (Fisher 501215159) until DIV 14 – 15. Coverslips were transferred to a recording chamber mounted on an upright microscope (Olympus BX51WI) and imaged using infrared-differential interference contrast with a 40x water-immersion Olympus objective. Cells were maintained with perfusion of 34° C artificial cerebral spinal fluid (aCSF) containing (in mM): 125 NaCl, 2.5 KCl, 1.25 NaH2PO4, 25 NaHCO3, 11 glucose, 2 CaCl2, 1 MgCl2. The aCSF was continuously equilibrated by bubbling with 95% O2/5% CO2. Whole cell voltage-clamp and current clamp recordings were obtained by forming intracellular seals with target neurons with patch pipettes pulled from borosilicate glass (BF150-86-7.5, Sutter). Pipettes (2–4 MOhm pipette resistance) were pulled with a P-97 flaming micropipette puller (Sutter). Pipettes were filled with either a Cs+-based internal recording solution containing (in mM): 135 CsMeSO3 10 HEPES, 1 EGTA, 4 Mg-ATP, 0.3 Na-GTP, 8 Na2-Phosphocreatine, 3.3 QX-314 (Cl- salt), pH adjusted to 7.3 with CsOH and diluted to 290–295 mOsm/kg for voltage clamp recordings or a K+-based internal recording solution containing (in mM): 120 KMeSO3, 10 HEPES, 0.2 EGTA, 8 NaCL, 10 KCL, 4 Mg-ATP, 0.3 Na-GTP, pH adjusted to 7.3 with CsOH and diluted to 290–295 mOsm/kg for current clamp recordings. Putative GABA-mediated IPSCs were isolated by voltage clamping at 0 mV, the reversal potential for inhibitory currents, and confirmed with 10 µM Gabazine (SR-95531, Tocris).
Voltage and current clamp recordings were amplified and filtered at 3 kHz using a Multiclamp 200B (Axon Instruments) and digitized at 10 kHz with a National Instruments acquisition boards. Data was saved with a custom version of ScanImage written in Matlab (Mathworks; https://github.com/bernardosabatinilab/SabalabSoftware_Nov2009). All data was analyzed on Matlab and spontaneous EPSCs and IPSCs were analyzed using a modified Peaker Analysis Toolbox (Andrew Penn (2020). Peaker Analysis Toolbox (https://www.github.com/acp29/Peaker), GitHub. Retrieved March 27, 2020).
Western Blot
hGN lysates were collected and boiled for 3 minutes in SDS sample buffer, resolved by SDS PAGE using 8–10% polyacrylamide gels and Precision Plus protein ladder (Biorad). Samples were then transferred to nitrocellulose and immunoblotted using primary antibodies (see antibodies above) at 1:1000 dilution, and then secondary 800nm DyLight-conjugated antibodies (Rockland Immunochemical 75934-472) at 1:50,000 dilution, prior to visualization and quantification with a Licor Odessy system. Original blot images provided as Supplementary Information.
High-throughput DNA sequencing
All cDNA libraries for total RNAseq, single cell RNAseq, ChIPseq and ATACseq were sequenced on a Nextseq 500 Illumina sequencer.
Total RNAseq library preparation
1G Total RNA was isolated from hGN cultures by using Trizol (unstimulated n=6, 15 minutes n=3, 1 hour n=3, 2 hour n=6, 4 hour n=3). RNA was then purified using RNeasy Micro Kit (Qiagen) including an on-column DNaseI digestion, and strand-specific and single-end cDNA libraries were generated using the SE RNA-seq library kit (Illumina) or the NEBNext Ultra Directional RNA Library Prep Kit for Illumina. Ribosomal RNA depletion was performed using the RiboMinus Eukaryote Kit for RNA-seq (ThermoFisher) and verified using a Bioanalyzer RNANano kit (Agilent) prior to library preparation and high-throughput sequencing. Initially, three different lots of hGNs were assayed for unstimulated, 15 minutes and 2 hours depolarization, and for logistical reasons associated with sample processing additional replicates were assayed unstimulated, one hour, two hours, and four hours after depolarization. Given that all Spearman correlation coefficients across pairwise comparisons of six replicates at any timepoint remained >0.9522, we opted to include data from the additional replicates.
4G Total RNA was isolated from a single culture and production lot of hGN cultures derived from four independent hiPSC lines by using Trizol (unstimulated n=4, 15 minutes n=4, 1 hour n=3, 2 hour n=4, 4 hour n=4). RNA was then purified using RNeasy Micro Kit (Qiagen cat. no. 74004), including an on-column DNaseI digestion, and strand-specific and single-end cDNA libraries were generated using 500ng total RNA with the NEBNext rRNA Depletion Kit (E6310) and NEBNext UltraDirectional RNA Library Prep Kit from Illumina (E7420) following the manufacturer’s protocol, with the omission of ActinomycinD during First Strand Synthesis. This resulted in up to 20% of reads mapping to the opposite strand from the original template, but it does not affect our downstream analysis as we are only quantifying sense reads mapping to non-overlapping gene annotations.
Total RNAseq data processing and differential gene expression analysis
Raw high-throughput sequencing reads in FASTQ format were processed using our in-house software MAPtoFeatures to quantify normalized gene exonic expression levels, as previously described6, using hg38 (GRCh38.p2) for total RNAseq gene expression analysis in Figures 1 and 2, or hg19.3 (GRCh37.p5) for total RNAseq gene expression analysis to be compared with ChIPseq data annotations. Differential gene expression analysis using EdgeR was performed to identify gene transcripts whose levels significantly changed after KCl depolarization. EdgeR was used to compare the transcript levels at each KCl depolarization timepoint (15 minutes, 1 hour, 2 hours, or 4 hours) to the unstimulated condition, following quantile normalization of all replicates for the two timepoints. A gene’s expression was considered activity-regulated if the following thresholds were met: (1) at least a 1.5-fold change (either increasing or decreasing); (2) a Benjamin-Hochberg-corrected q-value consistent with FDR=0.05; and (3) a minimal expression level requiring at least 5 reads in all reps at both times as well as RPKM ≥ 0.05 for at least one of the two time points compared.
Gene set enrichments
Gene set enrichments were tested using Pearson’s Chi-squared test with Yates’ continuity correction in R.
Determining evolutionary conservation of gene sequences
Evolutionary lineage analyses of the expressed LINC-RNAs and ZNFs were performed using multiple resources including, ENSEMBL’s Comparative Genomics Tool (https://www.ensembl.org/info/genome/compara/index.html), GenTree (http://gentree.ioz.ac.cn/index.php), Homologene( https://www.ncbi.nlm.nih.gov/homologene). A gene was considered “conserved” if it is conserved in multiple lineages outside the primate lineage.
Single Cell RNAseq (InDrops) sample and library preparation
Two sets of biological replicates each of approximately 5,000 cells were obtained from unstimulated, 1, 2, and 4 hour KCl depolarized cultures, and a third set of biological replicates each of approximately 5,000 cells was obtained from unstimulated, 1, and 2 hour KCl depolarized cultures. Cultures were dissociated to single-cell suspension and prepared for InDrops encapsulation at staggered times to allow for minimal differences in wait-time prior to reverse transcription. Dissociation was performed similarly to methods described in Hrvatin, et al. 2018. hGN cultures at each timepoint were washed once with CMF-PBS and incubated for 20min at 37 °C with papain and DNAse (Worthington) in the presence of a 5-inhibitor cocktail to preserve the transcriptional state of the neurons: 1mM tetrodotoxin citrate, 100mM D-AP5, 5mg/mL Actinomycin D, 20 mM Triptolide, and 10 mg/mL Anisomycin (Sigma). Minimal trituration was performed to resuspend dissociated cells, and single-cell suspensions contained very little cellular debris after being passed through 0.02µm cell strainer and resuspended in dissociation solution containing 0.04% BSA and 15% Optiprep (Sigma) and placed on ice. Cellular suspensions were not gradient centrifuged. Single cells were encapsulated with 1CellBio v2 barcoded hydrogel beads using the InDrops platform followed by reverse transcriptase reaction at the Single Cell Core, Department of Systems Biology, Harvard Medical School. Libraries were subsequently generated according to the 1CellBio v2 manufacturer’s protocol. After parallel library preparation, all libraries generated from each replicate were pooled and sequenced together.
Single Cell RNAseq Data Processing
Raw reads in FASTQ format were converted into counts tables of transcripts per gene for every cell using a previously published pipeline51. We built a reference transcriptome index from the ENSEMBL annotation of the Homo sapiens genome GRCh37.75 (soft-masked) using Bowtie 1.2.252. Note: The ENSEMBL annotation does not include all gene names existing in the annotation used for total RNAseq analysis, and therefore certain transcripts (e.g. LINC00602) were not quantified by this analysis. All quality control steps and mapping to the transcriptome were performed using default parameters unless explicitly specified.
Single Cell RNAseq Seurat-based analysis
Counts tables were loaded into R (version 3.4.1) and analyzed using the Seurat package (Version 2.3.4 and 3.0.0)53,54. In total, we sequenced 244,155 cells. Cells were filtered by excluding cells with UMI counts less than 500, UMI counts greater than 10000, mitochondrial gene expression greater than 30%, or ribosomal gene expression greater than 15% using Seurat’s FilterCells function. The data were then log normalized to 10000 transcripts per cell and scaled using a negative binomial model as well as by UMI, mitochondrial gene expression, and ribosomal gene expression using NormalizeData and ScaleData. Variable genes within each sample were found using the FindVariableGenes function with parameters x.low.cutoff = 0.1, x.high.cutoff = 3, and y.cutoff = 1. Data from all biological replicates and time points were merged with RunMultiCCA using the top 1000 scaled variable genes from each sample to calculate 30 canonical vectors, and AlignSubspace, using 15 dimensions. Clustering analysis was performed with FindClusters, using 15 dimensions and a resolution of 0.6. Dimensionality reduction was performed with RunTSNE, using 15 dimensions. We discovered that one cluster had considerably lower nUMI counts, so we excluded this cluster from analysis. We reran our filtering, normalization, and scaling steps for each sample excluding the apoptotic cluster cells.
Our final analysis used Seurat Version 3.0.0, in which RunMultiCCA had been deprecated. For each of our filtered, normalized, and scaled samples, we ran the functions UpdateSeuratObject, NormalizeData, and FindVariableFeatures (selection.method = “vst”, nfeatures = 2000). We merged our samples with the functions FindIntegrationAnchors and IntegrateData, using 30 dimensions, and ran ScaleData on the combined Seurat object. We then performed principal component analysis (RunPCA) to compute 30 components and dimensionality reduction with UMAP (RunUMAP) for 30 dimensions. A shared nearest neighbors graph was constructed with FindNeighbors using 20 dimensions and cells were clustered with FindClusters at 0.5 resolution. Our final Seurat object contains 37,101 cells and 15 clusters.
Single Cell RNAseq Differential gene expression analysis
Single-cell sequencing differential gene analysis was performed with Monocle55 (Version 2.6.4) for each cluster, comparing gene expression at 1 hour, 2 hours, and 4 hours after KCl depolarization against gene expression in unstimulated cells. For a gene to be called “inducible,” we set the thresholds that the gene had to be (1) expressed in at least 1% of all cells in the comparison being performed (e.g. cluster 1 4-hour depolarized cells and cluster 1 unstimulated cells), and (2) have a fold-change greater than 1.5 with a q-value smaller than 0.05.
Cumulative Distribution Plot
A list of human transcription factors was downloaded from http://humantfs.ccbr.utoronto.ca/download/v_1.01/TF_names_v_1.01.txt and intersected with our single-cell early-response and late-response genes. The number of clusters each TF was expressed in was calculated to generate the cumulative distribution plot.
Human Brainspan Data representation
Expression levels (RNA-Seq_Gencode_v10_summarized_to_genes) from the publicly available BrainSpan atlas (http://www.brainspan.org/static/download.html) are derived from RNA-seq for 19,364 genes consistent with RefSeq and 524 human samples, including 42 individuals, 31 different ages ranging from embryonic to adulthood, and 26 specific brain regions. The data shown in Extended Data Fig. 2 g–j cover six separate brain regions we define as neocortex (by combining data labeled as AIC, DFC, IPC, ITC, M1C, M1C-S1C, MFC, Ocx, OFC, PCx, S1C, STC, TCx, V1C, and VFC), striatum (data labeled as STR), hippocampus (data labeled as HIP), amygdala (data labeled as AMY), thalamus (by combining data labeled as DTH and MD), and cerebellum (by combining data labeled as CB and CBC). For each gene, data for all samples at all available time points in each brain region were fit via a local polynomial regression (the Loess function in R version 3.3.0) and shown as mean Loess curves interpolated across the whole age range. The width of the one-standard-error side bands were similarly calculated via a Loess fit to the standard errors deduced at whatever ages data were available in each region for each gene. Spearman correlation coefficients were determined for all pairwise comparisons between normalized average expression data from available time points among the 8 developmental time points across the 19 brain regions separately (as represented in Supplementary Table 2) and normalized average expression data from the unstimulated conditions of our 1G and 4G total RNAseq data sets. For comparison, total RNAseq data from five primary human fetal brain cultures (Ataman et al, 2016) were re-analyzed using exactly the same parameters and thresholds as the hGN total RNAseq in this study for subsequent equivalent correlation analysis.
Chromatin immunoprecipitation followed by high-throughput DNA sequencing (ChIPseq)
Typically, 2–6 million nuclei were used for a single ChIP experiment.1G hGNs from independent production lots (independent neuronal differentiations) served as biological replicates. For 4G hGN H4K27ac, for each of four genotypes, two independent cultures derived from the same neuronal differentiation lot (technical replicates) of cells were stimulated, harvested, and ChIP-seq libraries were prepared on two different experimental days from 500,000 – 900,000 nuclei for each library. Data from each of the four genotypes were considered biological replicates.
Frozen (−80°C) primary human tissue was weighed in a 15mL tube and placed on ice for 15 minutes. Tissue was homogenized using a Polytron Homogenizer in 5x (at least 5mL) ice cold crosslinking solution (see below) for 5 seconds or just until tissue is homogenized. Homogenized samples were incubated for 10 minutes at room temperature while rocking prior to quenching with 125 mM glycine for 5 minutes at room temperature. Homogenized tissue was then pelleted at 830 x g for 5 min at 4C. The supernatant was aspirated and the pellet was resuspended in 10 mL ice-cold sterile CMF-PBS. The pellet was then washed a second time with CMF-PBS before resuspending in 10mL Buffer I (see below) and transfer to pre-chilled 15mL dounce homogenizer. Samples were dounced on ice 10x with a tight pestle and then transferred back to a clean 15 mL tube. Nuclei were pelleted for 10 min at 4°C at 845 RCF and then rinsed in Buffer II (see below) and the remaining protocol was followed as described below.
1G hGN cultures were KCl depolarized for different amounts of time just before crosslinking. For CREB, pCREB, and CRTC1 ChIPseq experiments used to define CREB Complex peaks, cultures were treated with non-targeting (NT) control siRNA (GE Healthcare Dharmacon) for 9 days and then were unstimulated or 15 minute KCl depolarized prior to crosslinking. To cross-link protein-DNA complexes, we removed media from cell cultures and incubated with crosslinking solution (1% formaldehyde, 100mM NaCl, 1mM EDTA pH 8.0, 0.5 mM EGTA pH 8.0, 50 mM HEPES pH 7.9) for 10 minutes at room temperature. Cross-linking was quenched with 125 mM glycine for 5 minutes at room temperature. Cells were rinsed twice with ice cold PBS and scraped in PBS containing complete protease inhibitor cocktail tablets (Roche). Cells were then pelleted and lysed in 2mL of Buffer I (50 mM Hepes KOH, pH 7.5, 140 mM NaCl, 1mM EDTA pH 8.0, 10% glycerol, 0.5% NP-40, 0.25% Triton X-100, 10 mM B-Glycerophosphate, 10mM Sodium Fluoride, 1x protease inhibitor cocktail, 100 nM okadaic acid) and incubated 10 minutes on a rotating platform at 4°C. Nuclei were then pelleted for 10 min at 4°C at 845 RCF. The isolated nuclei were then rinsed in 2 mL of Buffer II (200mM NaCl, 1mM EDTA pH 8.0, 0.5 mM EGTA pH 8.0, 10mM Tris pH 8.0, 10mM B-Glycerophosphate, 10mM Sodium Fluoride, 1x protease inhibitor cocktail, 100 nM okadaic acid). They were again incubated 10 minutes on a rotating platform at 4°C and pelleted for 10 min at 4°C at 845 RCF. Finally, 1.5 mL of Buffer III was added to nuclei (10 mM Tris-HCl pH 8.0, 100 mM NaCl, 1mM EDTA, 0.5 mM EGTA, 0.1% Na-Deoxycholate, 0.5% N-laurylsarcosine, 10mM NaF, 1x protease inhibitor cocktail, 100 nM Okadaic Acid). 4G ChIPseq experiments were harvested in exactly the same way, but without NaF or Okadaic Acid in the buffers.
1G Nuclear extracts were then placed in 15 mL Polyallomer tubes (Fisher #NC9530407) and sonication was carried out using a Bioruptor sonicator on high power with a 30 sec “on” interval and 45 sec “off” interval per cycle, for a total of 32 cycles at 4°C. 4G Nuclear extracts were biorupted on a new Biorupter sonicator that achieved a similar level of chromatin fragmentation using instead 10 cycles, as determined by agarose gel electrophoresis. After sonication, tubes were centrifuged at 376 RCF briefly and material was moved to 2 mL DNA Lo-bind Eppendorf tubes and spun down at 16,000 RCF for 10 min to remove insoluble materials. Supernatant was transferred to a new tube and Triton-X 100 was added to make 10% of the total solution. Inputs between different samples were normalized by obtaining an 80 µL aliquot from each sample and incubating with 120 µL TE/1% SDS for 15–30 minutes at 95°C. These samples were then purified with Qiagen PCR purification kit and eluted into 60 µL buffer EB. Concentrations of samples were then determined via nanodrop. Using these concentrations, antibody-bead coupling reactions were performed so that the antibody:sample ratio would remain consistent across all samples.
Samples were then pre-cleared by adding 15 µL pre-rinsed Protein A Dynabeads. Beads were washed in 200 µL TBSTPb (0.01% BSA and 0.2mM PMSF in 1x TBST ) for every 15 µL of beads. They were washed 3 times for 5 minutes each and then lysate was pre-cleared for 2–4 hours at 4°C while rotating. Simultaneously, beads were incubated with antibody for the same period of time by aliquoting 15 µL beads per IP after washes and incubating with the relevant antibody H3K27Ac (Abcam ab4729), H3K4me3 (Millipore 07-473), CREB EMD (Millipore #06-863), CRTC1 (Bethyl Laboratories 300–769), Ser133 pCREB (Cell Signaling 87G3 #9198S). Note: 87G3 Rabbit monoclonal antibody also detects the phosphorylated form of the CREB-related protein ATF-1, which is similarly phosphorylated in response to stimulation and can dimerize with CREB56. For H3K27Ac we diluted the antibody 1:100 and then used 15 µL of diluted antibody for 40ug of chromatin. For CREB we used 4.5 µL of 1mg/mL antibody per ChIP and for CRTC1 we used 22.5 µL of 0.2 mg/mL antibody. For pCREB we used 26 µL of antibody per ChIP. Thus, for transcription factor ChIP we kept a constant 4.5 µg of antibody per ChIP.
After coupling antibody to beads the beads were then washed again in TBSTBp 3x5 minutes at room temperature and pre-cleared lysates were incubated with antibody-coupled beads overnight at 4°C with rotation. Before incubating with antibody, 1/20th of the volume of pre-cleared lysates was saved for use as input material.
The next day the beads bound to immune-complexes were placed on a magnet to remove supernatant, which was saved as flow-through. They were then washed twice with each of the following buffers, with which they were incubated for 5 minutes at 4°C with rotation. The buffers used were the following: low salt buffer (0.1% SDS, 1% Triton X-100, 2mM EDTA, 20mM Tris-HCl, pH 8.1, 150mM NaCl), high salt buffer (0.1% SDS, 1% Triton X-100, 2mM EDTA, 20mM Tris-HCl, pH 8.1, 500mM NaCl) and LiCl buffer (0.25M LiCl, 1% IGEPAL CA630, 1% deoxycholic acid (sodium salt), 2mM EDTA, 20mM Tris, pH 8.1). The washed beads were then rinsed once with 1x TE (10 mM Tris-HCl, pH 8.0, 1 mM EDTA). The immunoprecipitated materials were eluted from the beads twice by adding 100 ul of elution buffer (10 mM Tris-HCl, pH 8.0, 1 mM EDTA, pH 8.0, 1 % SDS) to each ChIP reaction and incubating the sample at 65°C for 30 min with brief 68 vortexing every 10 min. Elution buffer was also added to the input material (for a total of 200 µL) and these samples were processed with the ChIP samples for the remainder of the experiment. All eluates were reverse-crosslinked at 65°C overnight for 12–16 hours.
To each eluate we then added 10ug of RNase A per sample and incubated for 1 hour at 37°C on beads. Then 7 ul of Proteinase K was added per tube (20mg/mL stock) and samples were incubated for 2–3 hours at 55°C with shaking. DNA was then isolated via phenol-chloroform extraction where an equal volume of phenol-chloroform (pH 7.9) was added to each tube and tubes were vortexed 2x30 seconds. Samples were then spun down at 17,115 RCF for 3 minutes and the top aqueous phase was transferred to a new tube. Samples were purified via QIAquick PCR purification kit (Qiagen) with 5M Sodium Acetate (pH 5.5) and DNA fragments were eluted in 60 ul of EB buffer.
1G Libraries for ChIP-seq were prepared using Nugen Ovation Ultralow Library System V1 using 2ng of starting DNA and performing 18 cycles of amplification. 4G ChIPseq libraries were prepared using Nugen Ovation Ultralow Library System V2 with amplification cycles adjusted for each library as measured by parallel SYBRgreen qPCR reaction. Library DNA sizes were then confirmed to be majority 300–1000 bp in length using 2100 Agilent Bioanalyzer for high sensitivity DNA. Single-end 75bp reads were obtained from all ChIPseq libraries using a NextSeq 500 (Illumina).
ChIPseq Data processing
1G ChIPseq library sequencing data was obtained as fastq files from four separate lanes for each sample. FastQ files were concatenated for each sample and then reads were truncated to 70 bp lengths and aligned to the hg19 assembly of the human genome using the Burrows-Wheeler Aligner57 with default settings. The SAM files produced by the aligner were converted to BAM files and duplicates were removed using the samtools package. BAM files were then converted to BED files and used for peak-calling using Model-based Analysis of ChIP-Seq (MACS) using an input control. For transcription factor ChIP we used the default settings and for H3K27Ac ChIP-seq we used the following parameters: --nomodel -- shiftsize = 150.
To visualize data on the UCSC genome browser, genome-aligned bed files from all biological replicates were concatenated (pooled), reads were extended to 200 bp fragments, and then normalized to 10M reads. The resulting bedgraph files were converted to bigwig format. Data was visualized along with UCSC genome browser provided “vert.cons.” track displaying sequence conservation across 100 vertebrate species using PhyloP with default settings. ‘half CRE’ track was generated by locating all hg19 coordinates for a the sequence motif CGTCA58.
For each ChIP-seq experiment, peaks were called separately for biological replicates and then intersected. 1G H3K27ac reproducible peak coordinates were those from one biological replicate that intersected with peaks in at least a second biological replicate. The global 1G H3K27ac peak lists were obtained by merging all reproducible peaks present in unstimulated and stimulated conditions. 4G H3K27ac reproducible peaks from two technical replicates of each of the four genotypes were merged across genotypes and timepoints to create a global peak list. In order to define the activated CREB complex peaks we called peaks for each replicate of CREB, pCREB and CRTC1 ChIP, and then defined reproducible peaks as those present in two or more biological replicates of each ChIP. We intersected these reproducible peaks for each mark to obtain the high confidence set of 5,484 CREB complex peaks. Note: this method will not include many of the lower confidence peaks, or regions of CREB/pCREB binding without CRTC1, which could still be biologically relevant in certain neuronal subpopulations.
To determine differentially 1G H3K27acetylated ChIPseq peaks, we used merged reproducible peak coordinates from the all replicates across all timepoints to generate a 1G global peak list. The number of raw reads under this set of peaks in each biological replicate was determined using Homer annotatePeaks function (default parameters). These read counts were used for edgeR differential expression analysis software59 to determine differentially acetylated peaks using tagwise dispersion and an FDR cutoff of 0.05.
To generate aggregate plots, tag directories of ChIPseq BED files were created using the HOMER (version 4.9) command MakeTagDirectory. These tag directories were then used as input into the HOMER command annotatePeaks.pl with parameters -size 5000 -hist 10.
For 4G H3K27Ac ChIP-seq analysis, FastQ files for each sample were concatenated and then trimmed using CutAdapt V2.5. The adapter sequences (Nugen) “AGATCGGAAGAGCACACGTCTGAACTCCAGTCA” and “AGATCGGAAGAGCGTCGTGTAGGGAAAGAGTGT” were removed. Reads were mapped to the hg19 genome using Bowtie V1.2.2 and the following parameters: bowtie -p 1 -S -n 2 -e 70 -m 1 -k 1 -l 70 --best --chunkmbs 200. We called peaks using MACS2 V2.1.1 with the following parameters: --nomodel -- shiftsize = 150. The corresponding input sample for each ChIP sample was used as the control sample for peak calling. Peaks were called for each of two technical replicates at each time point, and then only peaks that were found in both technical replicates for a given donor cell line were kept. Peaks from all four donors were concatenated and merged and used for differential peak calling (80,638). In order to call inducible H3K27Ac peaks, we used DESEq2. We used each genotype as a biological replicate in this analysis and compared 4 replicates (4 donors) at 15m KCl or 2hr KCl stimulated cultures to those from unstimulated cultures. To call inducible peaks for each donor separately, we used both (2) technical replicates from each donor stimulation time point compared to those from the unstimulated condition. Peaks that were called as differential with an adjusted p-value <0.05 were considered significantly induced or decreased with KCl stimulation.
The in vivo reference list (IVRL) of H3K27ac-enriched genomic sites previously reported in human developing and adult brain tissues was created by merging all reported regions across all developmental stages from Reilly, et al., 2015, Vermunt, et al., 2014, and Vermunt, et al. 2017.60–62
1G ATACseq
Three different production lots (biological replicates) of 1G hGNs were grown in culture until DIV17. For each biological replicate, cells were with left silenced (unstimulated), KCl depolarized for 15 minutes, or KCl depolarized for two hours. To assess regions of open chromatin, ATACseq library preparation was performed as previously described63, and libraries were selected for fragments ranging 200–800 bp by gel electrophoresis prior to high throughput sequencing. FastQ files were concatenated for each sample and then reads were reads were trimmed by quality using Trimmomatic64 (version 0.33) with the option SLIDINGWINDOW:5:30. Reads were mapped to hg19 with Bowtie v1.1.2 using the following options: -p 8 -S -n 2 -e 70 -m 1 -k 1 -l 70 --best hg19 --chunkmbs 200. ATACseq peaks were called using MACS2 v2.1.1, without input control, and using the options --nomodel --extsize 200. Replicates were analyzed with the IDR pipeline, using a threshold of 0.05 for true replicate analysis and a threshold of 0.01 for pooled-consistency analysis. From our three biological replicates at each stimulation condition, the final set of 81,240 ATACseq peaks merged across all conditions are those that pass threshold in all three pairwise comparisons, and that also intersect with peaks appearing in the MACS2 peak call. For motif enrichment and heritability enrichment analysis, we used the 500 bp regions centered on MACS2 peak summits within IDR confirmed ATACseq peaks.
4G ATACseq
For each of the 4 donor hGN cell lines, hGNs were grown in culture until DIV17. Cells were either left silenced (unstimulated), KCl depolarized for 15 minutes, or KCl depolarized for two hours. To assess regions of open chromatin, ATACseq library preparation was performed as previously described63, and libraries were selected for fragments ranging 200–800 bp by gel electrophoresis prior to high throughput sequencing. For each of the 4 donor lines, two technical replicate libraries were prepared for one biological replicate. FastQ files were concatenated for each sample and trimmed using CutAdapt V2.5. The adapter sequences (Nextera) “CTGTCTCTTATACACATCTCCGAGCCCACGAGA” and “CTGTCTCTTATACACATCTGACGCTGCCGACGA” were trimmed. Reads were then mapped using Bowtie v1.1.2 using the following options: -p 8 -S -n 2 -e 70 -m 1 -k 1 -l 70 --best hg19 --chunkmbs 200. Peaks were called for each technical replicate using MACS2 v2.1.1, without input control, and using the options --nomodel --extsize 200. For each genotype, only peaks called in both technical replicates were kept, and then the peaks from each genotype were concatenated and merged to produce the global 4G ATAC-seq peak list.
Motif enrichment and genomic distribution analysis
Motif enrichment analyses were done with HOMER65 (Version 4.9) using the findMotifsGenome.pl command using human genome hg19 or hg38 when the genomic regions was translated to hg38 coordinates using LiftOver (https://genome.ucsc.edu/cgi-bin/hgLiftOver) The search sequence was restricted to the central 500bp of the ATACseq peaks within the region sets being compared (see ATACseq data processing), or the 500bp upstream of every TSS. The results included redundant motifs, of which only the motif with the smallest p-value is reported. For each motif enrichment test, a set of H3K27Ac peaks unchanged with KCl stimulation or 500bp regions upstream of TSSs within H3K27Ac peaks unchanged with KCl stimulation was used as background.
Distance of ChIP-seq peaks from TSS was determined by annotating peaks to nearest genes using HOMER annotatePeaks.pl. ChIPseq peaks were defined as “promoter regions” if determined to intersect a TSS (Refseq hg19) using Bedtools intersect, and “enhancer regions” if they did not intersect a TSS.
Activity-by-Contact (ABC) enhancer-gene interaction modeling
We used the Activity-by-Contact (ABC) model (https://github.com/broadinstitute/ABC-Enhancer-Gene-Prediction) to predict enhancer-gene connections in hGNs in each of three stimulation conditions: unstimulated, 15 minutes depolarization, and two hours depolarization. These predictions were made based on measurements of 1G chromatin accessibility (ATACseq) and histone modifications (H3K27ac ChIPseq), as previously described by Fulco, Nasser, et al., Nat. Genet. 201940. In each condition, the ABC model reports an “ABC score” for each element-gene pair, where the element is within 5 Mb of the TSS of the gene. Briefly, for each condition, we (1) Called peaks on the chromatin accessibility dataset using MACS2 with a lenient p-value cutoff of 0.1. (2) Counted chromatin accessibility reads in each peak and retained the top 150,000 peaks with the most read counts. We then resized each of these peaks to be 500bp centered on the peak summit. To this list we added 500bp regions centered on all gene TSS’s and removed any peaks overlapping blacklisted regions. Any resulting overlapping peaks were merged. (3) Calculated element Activity as the geometric mean of quantile normalized chromatin accessibility and H3K27ac ChIPseq counts in each candidate element region. Chromatin accessibility and H3K27ac ChIPseq signals in each candidate element were quantile normalized. (4) Calculated element-promoter Contact using the average Hi-C signal across 10 human Hi-C datasets as described previously. (5) Computed the ABC Score for each element-gene pair as the product of Activity and Contact, normalized by the product of Activity and Contact for all other elements within 5 Mb of that gene.
Luciferase Assay
The use of animals was approved by the Animal Care and Use Committee of Harvard Medical School. Luciferase assays were performed as previously described6. Pregnant E15 C57BL/6 female mice (Charles River) were used to derive primary mouse embryonic cortical cultures employed in luciferase assay experiments. Mice were used on arrival and not housed. Primary mouse embryonic cortical cultures were derived from over 10 mice for these studies. C57BL/6 mice were used to derive the primary embryonic cortical cultures employed.
Cloning of plasmids.
Genomic DNA (gDNA) was extracted from iCell Neurons (cat. no. NRC-100-010-001, lot no. 1366825) using DNeasy Blood & Tissue Kit (Qiagen) according to their protocol starting from step 1d for cultured cells. We varied from the protocol at step 1d by thawing the vial of iCell Neurons, diluting in 10mL CMF-PBS (Gibco 10010-023), and spinning down at 8000 g to remove freezing medium. At step 8, we eluted with Buffer TE. Stock gDNA was stored at −20˚C and working gDNA was kept at 4˚C.
Sequences of interest were cloned from iCell Neurons gDNA using custom primers and Q5 Hot Start Hi-Fidelity MasterMix (2X) (New England Biolabs) and run on Bio-Rad T100 Thermal Cycler with the following program: 98˚C 30s, 98˚C 10s, variable from 50˚C - 70˚C 30s, 72˚C 65s, 72˚C 120s, 4˚C hold. PCR products were run on a 1% agarose gel and bands of interest were cut out. DNA was then purified using GeneJET Gel Extraction Kit (Thermo Scientific).
Promoter sequences were cloned into pGL4.11[luc2P] (backbone created through SacI and XhoI double digest) and enhancer sequences were cloned into pGL4.11[luc2P] containing a NUED2 promoter sequence (Addgene ID 59744) (backbone created through SbfI and AscI double digest) using Gibson Assembly Master Mix (New England Biolabs). Competent cells (XL10-Gold Ultracompetent Cells, Agilent #200315) were then transformed with the ligation product and plated on agarose plates with carbenicillin (Sigma Aldrich). Individual plasmid clones were grown and then purified using GeneJET Plasmid Miniprep Kit (Thermo Scientific) followed by sanger sequencing for verification. Plasmids and sequences available upon request.
Disease-associated genes
SFARI ASD-associated genes (11-21-2018 release) were downloaded on 12-18-2018 from the now archived SFARI site (https://gene-archive.sfari.org/) and only genes that were labeled as “syndromic” or had a gene score of 1, 2, or 3 were used for analysis (389 gene names). All statistical tests for enrichment of/within ASD-associated genes yielded similar conclusions when performed using the updated SFARI gene scoring system (03-4-2020 release) with 472 gene names that meet the criteria of gene score = 1, 2, or syndromic. Schizophrenia-associated genes (349 gene names) were extracted from Supplementary Table 3 of the publication by the Schizophrenia Working Group of the Psychiatric Genomics Consortium (Nature 2014)30 at https://www.med.unc.edu/pgc/.
Partitioning heritability with stratified linkage disequilibrium score regression (LDSC)
To perform heritability enrichment analysis, we used stratified LD score regression as previously described in Finucane et al, 201566; given a functional partition of the genome, the analysis determines whether an annotation carries more genetic heritability than expected based on GWAS summary statistics. We obtained a baseline model of 54 annotations from Finucane et al, 201566 and augmented the model with the annotations defined from our ChIPseq and ATACseq processing as described above. Specifically, we augmented the model with the following pairs of annotations: H3K27ac regions overlapping RefSeq TSSs (H3K27ac promoter regions) and H3K27ac regions not overlapping RefSeq TSSs (H3K27ac enhancer regions); H3K27ac enhancer regions which are unchanged (constitutive) and H3K27ac enhancer regions which are inducible; 500 bp ATACseq regions within H3K27ac enhancer regions (enhancers) which are constitutive and inducible; and 500 bp regions upstream of a TSS (promoters) which are constitutive and inducible by H3K27ac. We additionally included three brain-associated control category in each model obtained from Rizzardi et al. 201967: 1) a set of regions marked by H3K27ac in human brain; 2) a union of regulatory regions active in brain; and 3) a union of regulatory regions found by ChromHMM using Roadmap Epigenomics data. For each model, we excluded regions in the three control categories that overlapped our annotations included in the model. Following the recommendations of Finucane et al., we excluded the MHC region from analysis and restricted to HapMap3 SNPs (International HapMap3 Consortium 2010 Nature) when fitting the model. When comparing enrichment of an annotation across traits, we corrected for multiple hypothesis tests using the Holm step-down procedure.
LDSC provides a statistical test with associated p-value that any category in the model caries non-zero enrichment for heritability. Given the natural pairing of our additional categories in the model, we extended the LDSC model to test whether one category is significantly more enriched than another category. Let and be two categories in the model. LDSC estimates the heritability explained by these categories as and which are normally distributed as and , respectively, under the assumptions of the model (Finucane 2015). Additionally, these two estimates are correlated since individual SNPs may belong to multiple categories. LDSC estimates the parameters of the normal distributions using ordinary least-squares regression and estimates the covariance, , using a jackknife procedure. Suppose we wish to test whether is significantly more enriched for heritability than . That is equivalent to testing whether , where denotes the number of SNPs in category i. The left- and right-hand terms are both normally distributed since the numerators are normal random variables and the denominators are constant scalars. Thus . We thus explicitly test whether this quantity is significantly different than zero using the parameter estimates provided by LDSC to determine whether category i is more enriched than category j.
The studies from which summary statistics were obtained for each tested trait are provided in Supplementary Table 3.
Extended Data
Extended Data Figure 1.

The gene expression profile of hGNs is similar to that of developing human telencephalic GABAergic neurons.
Extended Data Figure 2.

Single cell RNA sequencing of hGNs reveals developing ventral forebrain cell types.
Extended Data Figure 3.

Activity-dependent gene expression patterns detected by total RNAseq
Extended Data Figure 4.

Activity-dependent gene expression patterns detected by single-cell RNAseq
Extended Data Figure 5:

hGN activity-dependent enhancers and promoters
Extended Data Figure 6.

Detection of CREB, pCREB, and CRTC1
Extended Data Figure 7.

Disease heritability enrichment in hGN promoter and enhancer regions
Extended Data Figure 8.

ABC model predictions of inducible enhancer-gene associations
Supplementary Material
ACKNOWLEDGEMENTS
We thank Maria Chahrour, Jonathan L. Hecht, Jennifer Partlow, and Christopher A. Walsh for assistance with human tissue collection, Corey C. Harwell, Christian Mayer, and Miguel Turrero Garcia for guidance on single cell sequencing and cell type identification, Kasper D. Hansen and Andrew P. Feinberg for providing additional LDSC brain-associated control category annotations, Amelia N. Chang, Erin E. Duffy, Gord Fishell, Dheeraj Malhotra, and David Reich for helpful discussions. We acknowledge the large body of previous work that informed this study and regret omission of relevant citations due to space constraints. This work was supported by the NIH: P50MH106933 and R01NS028829 (M.E.G.), 5F32NS086270 (G.L.B.), and T32GM007753 (E.D.), the ROADS Program funded by F. Hoffmann-La Roche Ltd. (M.E.G), and the Paul G. Allen Frontiers Group (M.E.G). The content is solely the responsibility of the authors and does not necessarily represent the official views of the National Institute of General Medical Sciences or the National Institutes of Health.
Footnotes
COMPETING INTERESTS STATEMENT
The authors declare no competing interests.
DATA AVAILABILITY
The sequencing data that support the findings of this study are available on GEO accession # GSE136656. Publicly available data sets: ENSEMBL’s Comparative Genomics Tool (https://www.ensembl.org/info/genome/compara/index.html), GenTree (http://gentree.ioz.ac.cn/index.php), Homologene( https://www.ncbi.nlm.nih.gov/homologene), BrainSpan atlas (http://www.brainspan.org/static/download.html), UCSC genome browser (https://genome.ucsc.edu/), SFARI ASD-associated genes 11-21-2018 release (https://gene-archive.sfari.org/), Schizophrenia Working Group of the Psychiatric Genomics Consortium (https://www.med.unc.edu/pgc/).
MAIN TEXT REFERENCES
- 1.Geschwind DH & Rakic P Cortical Evolution: Judge the Brain by Its Cover. Neuron 80, 633–647 (2013). [DOI] [PMC free article] [PubMed] [Google Scholar]
- 2.Sousa AMMM, Meyer KA, Santpere G, Gulden FO & Sestan N Evolution of the Human Nervous System Function, Structure, and Development. Cell 170, 226–247 (2017). [DOI] [PMC free article] [PubMed] [Google Scholar]
- 3.Lui JH, Hansen DV & Kriegstein AR Development and Evolution of the Human Neocortex. Cell 146, 18–36 (2011). [DOI] [PMC free article] [PubMed] [Google Scholar]
- 4.Petanjek Z et al. Extraordinary neoteny of synaptic spines in the human prefrontal cortex. Proceedings of the National Academy of Sciences 108, 13281–13286 (2011). [DOI] [PMC free article] [PubMed] [Google Scholar]
- 5.Hensch TK Critical period regulation. Annual review of neuroscience 27, 549–79 (2004). [DOI] [PubMed] [Google Scholar]
- 6.Ataman B et al. Evolution of Osteocrin as an activity-regulated factor in the primate brain. Nature 539, 242 (2016). [DOI] [PMC free article] [PubMed] [Google Scholar]
- 7.Lim L, Mi D, Llorca A & Marín O Development and Functional Diversification of Cortical Interneurons. Neuron 100, 294–313 (2018). [DOI] [PMC free article] [PubMed] [Google Scholar]
- 8.Medina L, Abellán A, Vicario A & Desfilis E Evolutionary and developmental contributions for understanding the organization of the basal ganglia. Brain, behavior and evolution 83, 112–25 (2014). [DOI] [PubMed] [Google Scholar]
- 9.Shepherd GM Corticostriatal connectivity and its role in disease. Nature Reviews Neuroscience 14, 278 (2013). [DOI] [PMC free article] [PubMed] [Google Scholar]
- 10.Haythornthwaite A et al. Characterizing Human Ion Channels in Induced Pluripotent Stem Cell–Derived Neurons. Journal of Biomolecular Screening 17, 1264–1272 (2012). [DOI] [PubMed] [Google Scholar]
- 11.Berry BJ et al. Morphological and functional characterization of human induced pluripotent stem cell-derived neurons (iCell Neurons) in defined culture systems. Biotechnology progress (2015) doi: 10.1002/btpr.2160. [DOI] [PMC free article] [PubMed] [Google Scholar]
- 12.Hochbaum DR et al. All-optical electrophysiology in mammalian neurons using engineered microbial rhodopsins. Nature methods 11, 825–33 (2014). [DOI] [PMC free article] [PubMed] [Google Scholar]
- 13.Onorati M et al. Molecular and functional definition of the developing human striatum. Nature neuroscience 17, 1804–15 (2014). [DOI] [PubMed] [Google Scholar]
- 14.Mayer C et al. Developmental diversification of cortical inhibitory interneurons. Nature 555, 457–462 (2018). [DOI] [PMC free article] [PubMed] [Google Scholar]
- 15.Allaway KC & Machold R Developmental specification of forebrain cholinergic neurons. Developmental Biology 421, 1–7 (2017). [DOI] [PubMed] [Google Scholar]
- 16.Wei B et al. The onion skin-like organization of the septum arises from multiple embryonic origins to form multiple adult neuronal fates. Neuroscience 222, 110–23 (2012). [DOI] [PubMed] [Google Scholar]
- 17.Spiegel I et al. Npas4 Regulates Excitatory-Inhibitory Balance within Neural Circuits through Cell-Type-Specific Gene Programs. Cell 157, 1216–1229 (2014). [DOI] [PMC free article] [PubMed] [Google Scholar]
- 18.Hrvatin S et al. Single-cell analysis of experience-dependent transcriptomic states in the mouse visual cortex. Nature neuroscience 21, 120–129 (2018). [DOI] [PMC free article] [PubMed] [Google Scholar]
- 19.Pruunsild P, Bengtson PC & Bading H Networks of Cultured iPSC-Derived Neurons Reveal the Human Synaptic Activity-Regulated Adaptive Gene Program. Cell Reports 18, 122–135 (2017). [DOI] [PMC free article] [PubMed] [Google Scholar]
- 20.Ingi T et al. Dynamic regulation of RGS2 suggests a novel mechanism in G-protein signaling and neuronal plasticity. The Journal of neuroscience : the official journal of the Society for Neuroscience 18, 7178–88 (1998). [DOI] [PMC free article] [PubMed] [Google Scholar]
- 21.Han J et al. RGS2 determines short-term synaptic plasticity in hippocampal neurons by regulating Gi/o-mediated inhibition of presynaptic Ca2+ channels. Neuron 51, 575–86 (2006). [DOI] [PubMed] [Google Scholar]
- 22.Fujioka H, Dairyo Y, Yasunaga K-I & Emoto K Neural functions of matrix metalloproteinases: plasticity, neurogenesis, and disease. Biochemistry research international 2012, 789083 (2012). [DOI] [PMC free article] [PubMed] [Google Scholar]
- 23.Zeisel A et al. Molecular Architecture of the Mouse Nervous System. Cell 174, 999–1014.e22 (2018). [DOI] [PMC free article] [PubMed] [Google Scholar]
- 24.Kang H et al. Spatio-temporal transcriptome of the human brain. Nature 478, 483 (2011). [DOI] [PMC free article] [PubMed] [Google Scholar]
- 25.Miller JA et al. Transcriptional landscape of the prenatal human brain. Nature 508, 199–206 (2014). [DOI] [PMC free article] [PubMed] [Google Scholar]
- 26.Kapusta A et al. Transposable elements are major contributors to the origin, diversification, and regulation of vertebrate long noncoding RNAs. PLoS genetics 9, e1003470 (2013). [DOI] [PMC free article] [PubMed] [Google Scholar]
- 27.Tadepally HD, Burger G & Aubry M Evolution of C2H2-zinc finger genes and subfamilies in mammals: species-specific duplication and loss of clusters, genes and effector domains. BMC evolutionary biology 8, 176 (2008). [DOI] [PMC free article] [PubMed] [Google Scholar]
- 28.Ebert DH & Greenberg ME Activity-dependent neuronal signalling and autism spectrum disorder. Nature 493, 327–337 (2013). [DOI] [PMC free article] [PubMed] [Google Scholar]
- 29.Meur LN et al. MEF2C haploinsufficiency caused by either microdeletion of the 5q14.3 region or mutation is responsible for severe mental retardation with stereotypic movements, epilepsy and/or cerebral malformations. Journal of Medical Genetics 47, 22 (2010). [DOI] [PMC free article] [PubMed] [Google Scholar]
- 30.Consortium, S. of the et al. Biological insights from 108 schizophrenia-associated genetic loci. Nature 511, 421 (2014). [DOI] [PMC free article] [PubMed] [Google Scholar]
- 31.douglas.ruderfer@vanderbilt.edu, B. D. and S. W. G. of the P. G. Consortium. E. address: & Consortium, B. D. and S. W. G. of the P. G. Genomic Dissection of Bipolar Disorder and Schizophrenia, Including 28 Subphenotypes. Cell 173, 1705–1715.e16 (2018). [DOI] [PMC free article] [PubMed] [Google Scholar]
- 32.Grove J et al. Identification of common genetic risk variants for autism spectrum disorder. Nature genetics 51, 431–444 (2019). [DOI] [PMC free article] [PubMed] [Google Scholar]
- 33.Francis KR et al. Modeling Smith-Lemli-Opitz syndrome with induced pluripotent stem cells reveals a causal role for Wnt/β-catenin defects in neuronal cholesterol synthesis phenotypes. Nature medicine 22, 388–96 (2016). [DOI] [PMC free article] [PubMed] [Google Scholar]
- 34.Riazuddin S et al. Alterations of the CIB2 calcium- and integrin-binding protein cause Usher syndrome type 1J and nonsyndromic deafness DFNB48. Nature genetics 44, 1265–71 (2012). [DOI] [PMC free article] [PubMed] [Google Scholar]
- 35.Zhou Y et al. Atypical behaviour and connectivity in SHANK3-mutant macaques. Nature 570, 326–331 (2019). [DOI] [PubMed] [Google Scholar]
- 36.Robertson CE & Baron-Cohen S Sensory perception in autism. Nature reviews. Neuroscience 18, 671–684 (2017). [DOI] [PubMed] [Google Scholar]
- 37.Buraei Z & Yang J The β Subunit of Voltage-Gated Ca2+ Channels. Physiological Reviews 90, 1461–1506 (2010). [DOI] [PMC free article] [PubMed] [Google Scholar]
- 38.Rada-Iglesias A et al. A unique chromatin signature uncovers early developmental enhancers in humans. Nature 470, 279 (2011). [DOI] [PMC free article] [PubMed] [Google Scholar]
- 39.Malik AN et al. Genome-wide identification and characterization of functional neuronal activity–dependent enhancers. Nature Neuroscience 17, nn.3808 (2014). [DOI] [PMC free article] [PubMed] [Google Scholar]
- 40.Fulco CP et al. Activity-by-contact model of enhancer–promoter regulation from thousands of CRISPR perturbations. Nat Genet 51, 1664–1669 (2019). [DOI] [PMC free article] [PubMed] [Google Scholar]
- 41.Lonze BE & Ginty DD Function and Regulation of CREB Family Transcription Factors in the Nervous System. Neuron 35, 605–623 (2002). [DOI] [PubMed] [Google Scholar]
- 42.Impey S et al. Defining the CREB regulon: a genome-wide analysis of transcription factor regulatory regions. Cell 119, 1041–54 (2004). [DOI] [PubMed] [Google Scholar]
- 43.Lalonde J, Lachance P & Chaudhuri A Developmental and activity‐dependent genomic occupancy profiles of CREB in monkey area V1. Genes, Brain and Behavior 8, 149–160 (2009). [DOI] [PubMed] [Google Scholar]
- 44.Kornhauser JM et al. CREB transcriptional activity in neurons is regulated by multiple, calcium-specific phosphorylation events. Neuron 34, 221–33 (2002). [DOI] [PubMed] [Google Scholar]
- 45.Ch’ng TH et al. Activity-dependent transport of the transcriptional coactivator CRTC1 from synapse to nucleus. Cell 150, 207–21 (2012). [DOI] [PMC free article] [PubMed] [Google Scholar]
- 46.Bulger M & Groudine M Functional and mechanistic diversity of distal transcription enhancers. Cell 144, 327–39 (2011). [DOI] [PMC free article] [PubMed] [Google Scholar]
- 47.Vercauteren K, Pasko RA, Gleyzer N, Marino VM & Scarpulla RC PGC-1-related coactivator: immediate early expression and characterization of a CREB/NRF-1 binding domain associated with cytochrome c promoter occupancy and respiratory growth. Molecular and cellular biology 26, 7409–19 (2006). [DOI] [PMC free article] [PubMed] [Google Scholar]
- 48.Li M et al. Integrative functional genomic analysis of human brain development and neuropsychiatric risks. Science (New York, N.Y.) 362, (2018). [DOI] [PMC free article] [PubMed] [Google Scholar]
- 49.Satterstrom FK et al. Large-Scale Exome Sequencing Study Implicates Both Developmental and Functional Changes in the Neurobiology of Autism. Cell 180, 568–584.e23 (2020). [DOI] [PMC free article] [PubMed] [Google Scholar]
- 50.An J-YY et al. Genome-wide de novo risk score implicates promoter variation in autism spectrum disorder. Science (New York, N.Y.) 362, (2018). [DOI] [PMC free article] [PubMed] [Google Scholar]
METHODS ONLY REFERENCES
- 51.Klein AM et al. Droplet barcoding for single-cell transcriptomics applied to embryonic stem cells. Cell 161, 1187–201 (2015). [DOI] [PMC free article] [PubMed] [Google Scholar]
- 52.Langmead B, Trapnell C, Pop M & Salzberg SL Ultrafast and memory-efficient alignment of short DNA sequences to the human genome. Genome biology 10, R25 (2009). [DOI] [PMC free article] [PubMed] [Google Scholar]
- 53.Butler A, Hoffman P, Smibert P, Papalexi E & Satija R Integrating single-cell transcriptomic data across different conditions, technologies, and species. Nature biotechnology 36, 411–420 (2018). [DOI] [PMC free article] [PubMed] [Google Scholar]
- 54.Satija R, Farrell JA, Gennert D, Schier AF & Regev A Spatial reconstruction of single-cell gene expression data. Nature biotechnology 33, 495–502 (2015). [DOI] [PMC free article] [PubMed] [Google Scholar]
- 55.Qiu X et al. Single-cell mRNA quantification and differential analysis with Census. Nature methods 14, 309–315 (2017). [DOI] [PMC free article] [PubMed] [Google Scholar]
- 56.Liu F, Thompson M, Wagner S, Greenberg M & Green M Activating transcription factor-1 can mediate Ca(2+)- and cAMP-inducible transcriptional activation. The Journal of biological chemistry 268, 6714–20 (1993). [PubMed] [Google Scholar]
- 57.Li H & Durbin R Fast and accurate short read alignment with Burrows-Wheeler transform. Bioinformatics (Oxford, England) 25, 1754–60 (2009). [DOI] [PMC free article] [PubMed] [Google Scholar]
- 58.Zhang X et al. Genome-wide analysis of cAMP-response element binding protein occupancy, phosphorylation, and target gene activation in human tissues. Proceedings of the National Academy of Sciences of the United States of America 102, 4459–64 (2005). [DOI] [PMC free article] [PubMed] [Google Scholar]
- 59.Robinson MD, McCarthy DJ & Smyth GK edgeR: a Bioconductor package for differential expression analysis of digital gene expression data. Bioinformatics (Oxford, England) 26, 139–40 (2010). [DOI] [PMC free article] [PubMed] [Google Scholar]
- 60.Reilly SK et al. Evolutionary changes in promoter and enhancer activity during human corticogenesis. Science 347, 1155–1159 (2015). [DOI] [PMC free article] [PubMed] [Google Scholar]
- 61.Vermunt MW et al. Large-Scale Identification of Coregulated Enhancer Networks in the Adult Human Brain. Cell Reports 9, 767–79 (2014). [DOI] [PubMed] [Google Scholar]
- 62.Vermunt MW et al. Epigenomic annotation of gene regulatory alterations during evolution of the primate brain. Nature Neuroscience 19, 494–503 (2016). [DOI] [PubMed] [Google Scholar]
- 63.Sharma N et al. ARNT2 Tunes Activity-Dependent Gene Expression through NCoR2-Mediated Repression and NPAS4-Mediated Activation. Neuron 102, 390–406.e9 (2019). [DOI] [PMC free article] [PubMed] [Google Scholar]
- 64.Bolger AM, Lohse M & Usadel B Trimmomatic: a flexible trimmer for Illumina sequence data. Bioinformatics (Oxford, England) 30, 2114–20 (2014). [DOI] [PMC free article] [PubMed] [Google Scholar]
- 65.Heinz S et al. Simple combinations of lineage-determining transcription factors prime cis-regulatory elements required for macrophage and B cell identities. Molecular cell 38, 576–89 (2010). [DOI] [PMC free article] [PubMed] [Google Scholar]
- 66.Finucane HK et al. Partitioning heritability by functional annotation using genome-wide association summary statistics. Nature Genetics 47, 1228–1235 (2015). [DOI] [PMC free article] [PubMed] [Google Scholar]
- 67.Rizzardi LF et al. Neuronal brain-region-specific DNA methylation and chromatin accessibility are associated with neuropsychiatric trait heritability. Nature neuroscience 22, 307–316 (2019). [DOI] [PMC free article] [PubMed] [Google Scholar]
Associated Data
This section collects any data citations, data availability statements, or supplementary materials included in this article.
Supplementary Materials
Data Availability Statement
The sequencing data that support the findings of this study are available on GEO accession # GSE136656. Publicly available data sets: ENSEMBL’s Comparative Genomics Tool (https://www.ensembl.org/info/genome/compara/index.html), GenTree (http://gentree.ioz.ac.cn/index.php), Homologene( https://www.ncbi.nlm.nih.gov/homologene), BrainSpan atlas (http://www.brainspan.org/static/download.html), UCSC genome browser (https://genome.ucsc.edu/), SFARI ASD-associated genes 11-21-2018 release (https://gene-archive.sfari.org/), Schizophrenia Working Group of the Psychiatric Genomics Consortium (https://www.med.unc.edu/pgc/).