

Abstract
As boreal forests face significant threats from climate change, understanding evolutionary trajectories of coniferous species has become fundamental to adapting management and conservation to a drying climate. We examined the genomic architecture underlying adaptive variation related to drought tolerance in 43 populations of a widespread boreal conifer, white spruce (Picea glauca [Moench] Voss), by combining genotype–environment associations, genotype–phenotype associations, and transcriptomics. Adaptive genetic variation was identified by correlating allele frequencies for 6,153 single nucleotide polymorphisms from 2,606 candidate genes with temperature, precipitation and aridity gradients, and testing for significant associations between genotypes and 11 dendrometric and drought‐related traits (i.e., anatomical, growth response and climate‐sensitivity traits) using a polygenic model. We identified a set of 285 genes significantly associated with a climatic factor or a phenotypic trait, including 110 that were differentially expressed in response to drought under greenhouse‐controlled conditions. The interlinked phenotype–genotype–environment network revealed eight high‐confidence genes involved in white spruce adaptation to drought, of which four were drought‐responsive in the expression analysis. Our findings represent a significant step toward the characterization of the genomic basis of drought tolerance and adaptation to climate in conifers, which is essential to enable the establishment of resilient forests in view of new climate conditions.
Keywords: association studies, climate adaptation, dendroecology, gene expression, tree‐ring phenotypes, white spruce
Short abstract
see also the Perspective by Lars Opgenoorth and Christian Rellstab
1. INTRODUCTION
Forest trees face significant threats from climate change, and their long generation time reduces their potential to adapt to rapid changes (Aitken et al., 2008; Shaw & Etterson, 2012). Droughts are predicted to continue increasing in frequency, duration and severity in the boreal forest, and reduced soil water availability is becoming one of the most critical factors responsible for the rising vulnerability of forest trees globally (Choat et al., 2012; Girardin et al., 2016). Understanding the fate and adaptability of forest trees in drier climates has become an urgent question given the increase in observed dieback following droughts (Allen et al., 2010). The adaptive capacity of trees (standing genetic variation, new mutations, and phenotypic plasticity), as well as their dispersal capacity, allow them to cope with local environmental changes, or to escape to more suitable habitats via migration (Aubin et al., 2016). However, it is unclear if and how local forest tree populations will be able to keep up with the fast pace of climate change (Kremer et al., 2012). In this context, improving our understanding of how long‐lived species have evolved in response to water limitation is primordial to predict the potential impacts of climate change on forest ecosystems and their functioning (Anderegg et al., 2013; Choat et al., 2012), as well as to inform forest management practices, breeding programmes and strategies for conservation of genetic resources.
The nature of important traits for drought tolerance and the genes controlling them remain largely undeciphered (Allen et al., 2010; Moran et al., 2017). Studies of the genetic variation for drought tolerance in conifers have mainly focused on 13C, a proxy for water use efficiency (reviewed in ref. Moran et al., 2017; Plomion et al., 2016). The evaluation of other traits reflecting tree responses to climate constraints might contribute to the identification of relevant genes underlying adaptation to drought. Recent association studies that used tree‐ring phenotypes incorporating the response to climate were effective in identifying genes putatively involved in abiotic stress tolerance (Heer et al., 2018; Housset et al., 2018; Trujillo‐Moya et al., 2018).
Genetic studies of tree‐rings are facilitated by the abundance of provenance field trials, usually made up of seedlings from different provenances planted in common gardens (de Villemereuil et al., 2016). Wood increment core analyses enable phenotypic evaluation over several years or decades of growth, allowing researchers to retrospectively investigate the effects of climate variation on adaptive traits (Girardin et al., 2021; Sáenz‐Romero et al., 2019). This experimental design is useful for detecting the existence of genetic clines in local adaptation by comparing among‐ and within‐provenance phenotypic variation (Depardieu et al., 2020; Housset et al., 2018). Two main approaches can be combined to understand the genetic control of complex traits in such trials and identify genes involved in local adaptation, namely genetic association studies and gene expression studies (Moran et al., 2017). Genetic association analyses such as genotype–environment (GEA) and genotype–phenotype (GPA) associations aim to identify loci involved in adaptation to environmental factors or in the control of heritable phenotypic traits. The findings from association studies can come with false‐positives, which may be mitigated by use of various methods of detection (e.g. Bush & Moore, 2012; Kathiresan et al., 2004) or, alternatively, by use of complementary experimental approaches to confirm the biological relevance of a significant genetic association. For example, transcriptomics can be used to further strengthen the involvement of genes identified in association studies at the functional level, or as a complementary approach to characterize gene networks linked to complex physiological mechanisms underlying stress responses (Lamara et al., 2016; Moran et al., 2017). Although both association and gene expression studies come with their strengths and weaknesses, combining these two approaches could permit the determination of whether differences in sensitivity to climate between genotypes can be attributed to variation in gene sequences, gene expression or both. Until now, studies integrating genetic association and transcriptomics have rarely been reported in trees (but see Muchero et al., 2018).
Genomic resources available in white spruce (Picea glauca) are well developed and facilitate investigations of the genetic and molecular bases of local adaptation. They include a large catalogue of annotated expressed genes (Rigault et al., 2011), genotyping data from gene single nucleotide polymorphism (SNP) arrays (Pavy, Deschênes, et al., 2013; Pavy et al., 2008) and high‐density gene‐based linkage maps (Pavy et al., 2017; Pavy, Pelgas, et al., 2012), among others. Due to its economic and ecological importance in North America, P. glauca has also been the focus of several studies on the genetic variation in traits of economic importance (Beaulieu et al., 2011; Lamara et al., 2016; Lenz et al., 2013). Moreover, it has been studied using genome scans with the goal of identifying quantitative trait loci (QTL) for adaptive traits (Pelgas et al., 2011) and candidate genes for local adaptation to climate (Hornoy et al., 2015; Namroud et al., 2008).
Using a retrospective dendroecological approach, a signal of local adaptation to drought was previously detected among 43 white spruce populations gathered in a common garden (Depardieu et al., 2020). In this study, we investigate the genetic basis of local adaptation to drought for these populations located in the eastern part of the natural white spruce range in Canada (Figure 1). First, we studied the relationships between allele frequencies and environmental variables of provenance origins (GEA) or between genotypes and phenotypic traits (GPA) measured in a common garden trial to identify genetic variants and their genes underlying adaptation to drought (Figure 2, “Step 2”). Second, using transcriptomic data, we assessed the expression profiles of candidate genes identified with association approaches to further support their involvement in drought response (Figure 2, “Step 3”). Starting from a set of 2,606 candidate genes (6,153 SNPs), we identified a total of 285 genes involved in adaptation to climate, including 110 genes that were differentially expressed in response to drought in an independent transcriptomic experiment. The intersection between GPA and GEA also revealed eight major genes involved in local adaptation to climate in white spruce, of which four were drought‐responsive in the expression analysis. Our results provide a basis for future population‐based expression studies and genomic prediction for drought tolerance.
FIGURE 1.
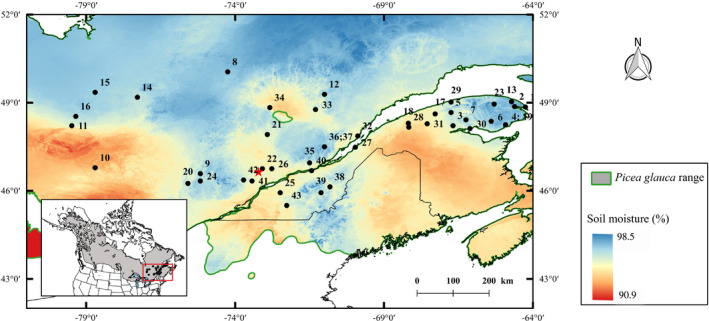
Geographical location of the 43 Picea glauca populations and the common garden trial (red star). Mean soil water availability in summer (SMI) for the period 1950–1980 is overlaid on the range‐wide distribution of P. glauca. The sampled populations represent provenances whose seeds were used to establish the common garden trial and are indicated by black circles. Population numbering corresponds to that found in Table S1
FIGURE 2.

Flowchart of the analyses and classification of the phenotypic traits in this study. Step 1: narrow‐sense heritability estimates were obtained for 12 phenotypic traits. Step 2: genetic association tests were carried out between gene variants (SNPs) and (i) traits with significant heritability (i.e., all traits except growth resistance [Rs]) in GPA analyses and (ii) climate in a GEA approach. Step 3: drought‐responsive genes (DEGs) were identified by RNA‐sequencing using a likelihood ratio test (LRT) with an FDR of 0.05. The overlap between association approaches revealed eight high‐confidence genes for drought adaptation, four of them being differentially expressed under drought (number in bold and underlined in integrated insights box)
2. MATERIALS AND METHODS
2.1. Study site, plant material and experimental design
Data were collected from a white spruce provenance‐progeny trial containing 197 half‐sib families from 43 populations (i.e., provenances) distributed along a large geographical gradient of soil moisture in Québec (Figure 1; Table S1). The trial was a single common garden site established in 1979 at the Mastigouche Arboretum in Quebec, Canada (46°38′N, 73°13′W, elevation 230 m). The experimental design was a randomized complete block design with six blocks and five trees per half‐sib family planted in row plots (see Beaulieu et al., 2014). Phenotypes and genotypes of 1,473 randomly selected trees, but representing all families, provenances and blocks in the common garden, were analysed in this study. Details of numbers of trees per family and provenance and climatic conditions at the experimental site and provenance origins are reported in Table S1.
2.2. Phenotypic data
Twelve phenotypic traits were assessed and classified into sets of dendrometric and tree‐ring traits for use in this study (see Figure 2). The dendrometric traits were tree height (H38, in mm) and stem diameter at breast height (DBH38, in cm) (Figure 2) measured at 38 years of age during summer 2017. Tree‐ring traits were classified into anatomical, growth response and climate sensitivity traits. The anatomical and growth response traits were those reported in the main findings of the dendroecological study of Depardieu et al. (2020). Detailed information about plant material, treatment of wood samples, and data processing can be found therein (for convenience, methods are also summarized in Methods S1). The tree‐ring traits were obtained from the sampling of 12‐mm wood increment cores extracted at breast height on the same side of each tree in 2005 and 2008. Tree‐ring measurements were acquired by combining image analysis with X‐ray densitometry from the Silviscan system. The anatomical subset of tree‐ring traits included cell wall thickness (CWT, in µm), radial lumen diameter (LDr, in µm) and wood density (WD, in kg m−3) (Figure 2, “Anatomical traits”). For anatomical traits, the area‐weighted average of individuals calculated for the 1995–2005 period was used for association studies. The growth response subset of tree‐ring traits included growth resistance (Rs), growth recovery (Rc), growth resilience (Rl) and relative growth resilience (Rr) indices (Figure 2, “Growth response traits”; Lloret et al., 2011). These indices were calculated relative to a drought event that occurred in 2002, as previously described in Depardieu et al. (2020), and were derived from basal area increment values (BAI, in mm2). Briefly, pre‐ and post‐drought periods were defined as the two years preceding and following the drought event, respectively. Resistance (Rs) defines the tree's capacity to maintain growth under drought, and was obtained by calculating the ratio of the mean BAI during the 2002 drought event to the mean BAI during the pre‐drought period. Recovery (Rc) was calculated as the ratio of the mean BAI during the drought event to the mean BAI during the post‐drought period, while Resilience (Rl) was obtained by dividing post‐drought growth by pre‐drought growth. Relative resilience (Rr, the resilience weighted by severity of the drought event) was determined by subtracting Rs from Rl. The climate sensitivity category of tree‐ring traits captures the overall effect of drought on annual fluctuations in tree wood density (CS‐WD), cell wall thickness (CS‐CWT) and lumen diameter (CS‐LDr) across the lifespan of the tree (Figure 2, “Climate sensitivity traits”), and can be considered as a proxy of tree vulnerability to drought. They are represented by the correlation coefficients computed between tree‐level indices of annual anatomical trait values and soil moisture index (SMI, in mm of water) in July at the common garden site from 1989 to 2007 (see Methods S1 for details). A climate sensitivity trait value close to 1.0 is indicative of a strong positive relationship between annual tree growth and soil water availability; a value close to zero indicates that tree growth is not limited by water availability, while negative values indicate that trees perform better under drought conditions.
2.3. Heritability and correlations between traits
The heritability of the 12 phenotypic traits was estimated to determine the traits to be used in GPA analyses (Figure 2, blue box “Step 1”). We fitted the following individual‐tree mixed models (the so‐called “animal model”) using the asreml‐r version 4.0 R package (Butler et al., 2017):
| (1) |
where is the overall mean, is the fixed block effect, is the random plot effect, that is the interaction of the block and family effects, with , is the random additive genetic effect, with , and is the error term, with . The matrix is the realized genomic relationship matrix, which was computed from the marker data using the “A.mat” function of the R package rrBLUP with default options (Endelman & Jannink, 2012). The matrices and are incidence matrices of their corresponding effects, and is an identity matrix of its proper dimension. To test the hypothesis of greater than zero additive genetic variance ( : = 0; : > 0), we performed a likelihood ratio test with one degree of freedom between the full model (Equation 1) and a reduced model without the additive genetic effect (. Individual narrow‐sense heritability was estimated as:
| (2) |
Standard errors of the heritability estimates were obtained using the delta method (vpredict function from the asreml‐r package version 4.0; Wolak, 2012). Given its small heritability estimate (mean ± SD of 0.029 ± 0.037) and nonsignificant additive genetic variance (p =.21), Rs was not used in the association analyses and is not presented in the Results. Genetic and phenotypic correlations were further estimated for the heritable traits (Figure 2, blue box “Step 1”), using a bivariate model (Methods S2). While genetic correlations between traits depend only on the correlation of additive genetic effects, phenotypic relationships rely on both additive genetic and environmental effects (Methods S2).
2.4. Genotypic data
The original genotypic data consisted of 6,386 validated genic SNPs (Pavy, Deschênes, et al., 2013), for which the verification of known pedigrees and the reconstruction of all half‐sibling families were performed using the colony software (Jones & Wang, 2010; Wang & Santure, 2009). After quality screening of genotyping data (minor allele frequency [MAF] >0.01, SNP call rate >80% per individual with average call rate of 99%), 6,153 SNPs representing 2,606 candidate genes were retained in the final data set for subsequent analyses. Within genes, SNPs were interspaced by a minimum of 200 bp (Pavy, Deschênes, et al., 2013), which corresponds to about three times the distance for a half‐decay in linkage disequilibrium in white spruce genes from natural populations (Pavy, Namroud, et al., 2012). Prior to GPA analyses, imputation of missing data was conducted using linkimpute version 1.1.4 (Money et al., 2015), and an imputation accuracy of 0.77 was estimated by randomly masking 10,000 genotypes.
2.5. Genotype–phenotype associations (GPA)
Genotype–phenotype associations (GPA) were estimated using the Bayesian sparse linear mixed model (BSLMM) implemented in the gemma software package version 0.97 (Zhou et al., 2013; Zhou & Stephens, 2012). BSLMM is a polygenic model that takes into account the contribution of single SNPs with larger effects, as well as the simultaneous contribution of multiple SNPs with small effects, to phenotypic variation. To do so, BLSMM includes the main effects of individual SNPs as predictors of the phenotype, and a polygenic effect resulting from the combination of multiple small‐effect SNPs (Zhou et al., 2013). The polygenic effect is fitted as a random term using the centred kinship matrix (K) among individuals estimated from the marker data in gemma. The model estimates the posterior probability that an SNP has a main effect (posterior inclusion probability, PIP), and the proportion of phenotypic variance (PVE) explained by the genetic data (i.e., the combination of the main and polygenic effects).
Before GPA analyses, the initial distributions of phenotypic traits were inspected and, when needed, we applied Box–Cox transformations to improve normality (Shapiro–Wilk tests: p >.05). Because the BSLMM does not allow fitting covariates, each trait was first corrected for the block effect by taking the residuals of the following model, fitted using the asreml‐r version 4.0 software:
| (3) |
where is the overall mean, is the fixed block effect, and is the error term as defined in Equation 1. By explicitly modelling the realized pairwise relatedness between all individuals using the kinship matrix (K), the polygenic effect in BSLMM captures both population structure and within‐population family structure (Hoffman, 2013; Kang et al., 2010). Thus, in the absence of substantial population differentiation (Figure S1), there is no need to correct for population structure using additional covariates in GPA analyses (Price et al., 2010).
We ran three independent gemma chains, each consisting of 5,000,000 iterations, a burn‐in of 1,000,000, and a thinning interval of 100. We assessed the convergence across runs for the parameters of interest using Gelman–Rubin diagnostic plots in the coda R package (Plummer et al., 2006). To identify significant genotype–phenotype associations for each trait, the harmonic mean of PIP was calculated across the three independent chains and a strict cut‐off of PIP >0.1 was used (Chaves et al., 2016; Pfeifer et al., 2018). To summarize the hyper parameters generated in gemma, we calculated the mean, median, and the upper and lower bounds of the 97.5% credible interval for each trait from the averaged posterior distributions (Table S2).
2.6. Genotype–environment associations (GEA)
Genotype–environment association (GEA) analyses investigating the relationships between population allele frequencies and various climate variables were conducted to detect loci showing signatures of local adaptation. Population allele frequencies were estimated using a two‐step procedure. First, family‐based allele frequencies were calculated using the hierfstat R package (Goudet, 2005), in order to take into account variation in the number of trees sampled across families within populations. Then, population‐based allele frequencies were obtained by averaging the family‐based allele frequencies. For each provenance, climatic series were obtained for the 1950–1980 period, assuming that these series are representative of the environmental conditions prevailing at the time of mother tree establishment and early growth. Climate variables considered for GEA were relevant of how plants experience droughts during summer, and included the mean temperature (Tmean), the mean soil moisture index (SMI), the standardized precipitation–evapotranspiration index (SPEI), total precipitation (Prec) and the mean vapour pressure deficit (VPD). SMI was preselected because it was a significant and strong climate predictor of white spruce growth response and climate sensitivity traits (Methods S3; Depardieu et al., 2020). In this study, SPEI was used as a second drought index. SPEI was calculated based on the formula of Hargreaves and Samani (1985), which estimates reference crop evapotranspiration based on temperature and extraterrestrial radiation.
Genotype–environment association (GEA) analyses investigating the relationships between population allele frequencies and various climate variables were conducted to detect loci showing signatures of local adaptation. Population allele frequencies were estimated using a two‐step procedure. First, family‐based allele frequencies were calculated using the hierfstat R package (Goudet, 2005), in order to take into account variation in the number of trees sampled across families within populations. Then, population‐based allele frequencies were obtained by averaging the family‐based allele frequencies. For each provenance, climatic series were obtained for the 1950–1980 period, assuming that these series are representative of the environmental conditions prevailing at the time of mother tree establishment and early growth. Climate variables considered for GEA were relevant of how plants experience droughts during summer, and included the mean temperature (Tmean), the mean soil moisture index (SMI), the standardized precipitation–evapotranspiration index (SPEI), total precipitation (Prec) and the mean vapour pressure deficit (VPD). SMI was preselected because it was a significant and strong climate predictor of white spruce growth response and climate sensitivity traits (Methods S3; Depardieu et al., 2020). In this study, the SPEI was used as a second drought index. SPEI was calculated based on the formula of Hargreaves and Samani (1985), which estimates reference crop evapotranspiration based on temperature and extraterrestrial radiation.
Prior to GEA tests, population structure was assessed by using principal component analyses (PCAs) and the sparse non‐negative factorization (sNMF) method implemented in the LEA R package (Frichot & Francois, 2015). The results indicated an absence of population structure in the data set (Figure S1). Data were further analysed using both a univariate regression method (latent factor mixed models, LFMM; LEA R package; Frichot & Francois, 2015) and a multivariate redundancy analysis (RDA; Lasky et al., 2012) in order to test for significant genotype–environment associations. RDA was shown to perform better than univariate methods to detect weak multilocus selection (Forester 2018), which is usually the prevalent scenario in white spruce (Hornoy et al., 2015). The LFMM approach uses a hierarchical Bayesian mixed model, which corrects for potential confounding effects including population structure and isolation‐by‐distance patterns via K latent factors. We tested two different numbers of latent factors (K), namely K = 1 and K = 2. The genomic inflation factor (λ), defined as the median of squared z‐scores divided by the median of the chi‐squared distribution (as described in appendix S2, from François et al., 2016), was calculated after modelling. We observed more uniformly distributed histograms of adjusted p‐values and λ values closest to 1 with K = 1, in comparison with K = 2. Consequently, LFMM analyses were performed by setting K = 1 latent factors. For each SNP–climate variable correlation, |Z| scores were computed using 10,000 sweeps, after a burn‐in of 5,000 sweeps. Five independent runs per LFMM test were used to obtain median |Z| scores and associated p‐values, which represented the strength of the association between a climatic variable and each SNP. |Z| scores from multiple runs were combined according to the Fisher–Stouffer method. p‐values were adjusted for multiple testing using the Benjamini–Hochberg algorithm, with a false discovery rate (FDR) of 0.1 (François et al., 2016).
The second multivariate GEA approach (i.e., RDA) was conducted using the vegan package in R (Oksanen et al., 2007), as previously described in Capblancq et al. (2018). Briefly, climate variables were scaled to a mean of 0 and a variance of 1. We ran RDAs without correcting for population structure. This approach has been shown to be more powerful than RDA approaches that correct for population structure under various demographic scenarios similar to those generally found in conifers, including isolation by distance, while resulting in only a slight increase in false positives (Forester et al., 2018). The statistical significance of the model and of each axis was tested using a permutation‐based analysis of variance (999 permutations). Following the constrained ordination step, outlier SNPs were detected using the pcadapt methodology (Capblancq et al., 2018; Luu et al., 2017). After visual inspection of the amount of information retained on the different axes of RDA, only z‐scores of the two most significant ordination axes were retained for subsequent analysis. For each locus, a robust Mahalanobis distance was computed to identify outlier vectors of z‐scores (Capblancq et al., 2018). An FDR approach was used to control for false positives, with markers having q‐values less than 0.1 considered as significantly associated with climatic gradients. Each SNP was assigned to the climatic predictor for which the correlation was the highest (Forester et al., 2018, see https://popgen.nescent.org/2018‐03‐27_RDA_GEA.html for details).
2.7. Gene expression data
Transcriptomic (RNA‐seq) data were used to investigate if genes identified in GEA or GPA analyses showed differential expression patterns related to drought response in white spruce (Figure 2, blue box “Step 3”). Data were obtained from foliage samples of three genetically unrelated 2‐year‐old clonally propagated white spruce genotypes sampled at 0, 7, 14, 18 and 22 days from the onset of drought treatments in the greenhouse, as previously described by Stival Sena et al. (2018). The protocols for RNA extraction, library synthesis, sequencing methods, and transcript counts and filtering are further detailed in Methods S4. deseq2 version 1.20.0 was used to identify differentially expressed genes (DEGs) between drought‐treated and control foliage samples, by applying the likelihood ratio test (LRT) approach with an FDR of 0.05 to 33,824 genes (Love et al., 2014; R Core Team 2018). Genes with a significant interaction effect between condition and sampling day (referred to as “Drought” herein) were considered differentially expressed under drought conditions. The complete list of identified DEGs is presented in Table S3. We classified the DEGs into upregulated genes (positive values of log fold change, LFC) and downregulated genes (negative values of LFC). Note that pairwise comparisons on each sampling day were used instead of a time course differential expression analysis, as the former outperformed or were equally good at identifying DEGs in short time series (fewer than eight time points, Spies et al., 2019). The drought‐responsive genes whose expression differed between the three genotypes tested (referred to as “Genotype” herein) were also identified.
2.8. Functional and structural annotation of significant SNPs
Functional annotations of genes carrying significant markers identified by association or transcriptomic approaches were examined based on sequence similarity searches by using blastx (cut‐off E‐value of ≤10−10) against the RefSeq database using blast2go version 5.1.13 (Gotz et al., 2008). The protein domain descriptions and Gene Ontology (GO) annotations were also obtained using the blast2go pro suite. To detect protein signatures, homologous protein domains from translated sequences were identified by searching against the Interpro database. GO molecular function and biological process terms were obtained for each individual transcript and GO plant slims were assigned by mapping the set of GO annotations to the terms in the GO slim. Enrichment analyses for GO terms and protein domains were performed using the blast2go pro suite by comparing the different gene lists with the complete set of 2606 candidate genes. Fisher's exact tests were used and p‐values <.05 were considered significant. Structural annotation of SNPs relied on the GCAT3.3 white spruce gene catalogue (Rigault et al., 2011). SNPs located in coding regions were classified into synonymous (S) and nonsynonymous (NS) substitutions, while those located in noncoding regions were annotated as intron or untranslated regions (i.e., 3′UTR or 5′UTR). Venn diagrams were generated using an online tool (http://bioinformatics.psb.ugent.be/webtools/Venn/) to compare the lists of significant SNPs.
3. RESULTS
3.1. Heritabilities and genetic correlations between traits
Narrow‐sense heritability estimates (h 2) were first calculated for 12 phenotypic traits (Figure 2). Except Rs, for which the heritability estimate was close to 0, all the phenotypic traits were low to moderately heritable (h 2 ranging from 0.11 to 0.32; Table 1) and associated additive genetic variances were statistically significant (see stars in the grey shaded cells, Table 1). The climate‐sensitivity traits CS‐CWT, CS‐WD and CS‐LDr, as well as DBH38, were the least heritable with h 2 varying from 0.11 to 0.18. H38, LDr and the three growth response traits (Rc, Rl, and Rr) were moderately heritable with h 2 ranging from 0.23 to 0.25. Cell wall thickness (CWT) and wood density (WD) were the most heritable traits with h 2 = 0.30 and h 2 = 0.32, respectively. Positive and moderate to high genetic correlations were found between the growth response traits to drought (Rc, Rl, and Rr) and the dendrometric traits (H38 and DBH38), suggesting that drought resilience and productivity are controlled by similar sets of genes. Rc, Rl and Rr were negatively correlated to CS‐WD and CS‐CWT, indicating that trees that were able to substantially modulate their wood anatomy across their lifespan were less resilient to the 2002 extreme drought event.
TABLE 1.
Phenotypic (above diagonal) and genetic (below diagonal) correlations between traits. Narrow‐sense heritability estimates are reported on the diagonal (grey background).
| Trait | H38 | DBH38 | WD | CWT | LDr | Rc | Rl | Rr | CS‐CWT | CS‐WD | CS‐LDr |
|---|---|---|---|---|---|---|---|---|---|---|---|
| H38 | 0.24 (0.05)*** | 0.85 (0.01)*** | −0.31 (0.03)*** | 0.10 (0.03)** | 0.60 (0.02)*** | 0.02 (0.03) | −0.03 (0.03) | 0.02 (0.03) | −0.03 (0.03) | −0.13 (0.03)*** | 0.13 (0.03)*** |
| DBH38 | 0.92 (0.04)*** | 0.14 (0.04)*** | −0.42 (0.02)*** | 0.00 (0.03) | 0.63 (0.02)*** | 0.04 (0.03) | 0.02 (0.03) | 0.04 (0.03) | 0.00 (0.03) | −0.14 (0.03)*** | 0.16 (0.03)*** |
| WD | −0.16 (0.13) | −0.29 (0.14)* | 0.30 (0.05)*** | 0.76 (0.01)*** | −0.42 (0.02)*** | −0.05 (0.03) | −0.07 (0.03)* | −0.06 (0.03) | 0.08 (0.03)* | 0.19 (0.03)*** | −0.22 (0.03)*** |
| CWT | 0.11 (0.13) | 0.02 (0.16) | 0.85 (0.04)*** | 0.32 (0.05)*** | 0.20 (0.03)*** | −0.12 (0.03)*** | −0.18 (0.03)*** | −0.14 (0.03)*** | 0.06 (0.03) | 0.15 (0.03)*** | −0.22 (0.03)*** |
| LDr | 0.43 (0.11)** | 0.55 (0.12)*** | −0.33 (0.11)** | 0.15 (0.12) | 0.24 (0.04)*** | −0.06 (0.03)* | −0.11 (0.03)*** | −0.08 (0.03)*** | −0.03 (0.03) | −0.09 (0.03)** | 0.10 (0.03)*** |
| Rc | 0.60 (0.17)*** | 0.74 (0.22)*** | −0.27 (0.13)* | −0.18 (0.13) | 0.15 (0.15) | 0.25 (0.05)*** | 0.75 (0.01)*** | 0.97 (0.00)*** | −0.25 (0.03)*** | −0.26 (0.03)*** | 0.12 (0.03)*** |
| Rl | 0.61 (0.18)*** | 0.73 (0.23)*** | −0.32 (0.14)* | −0.23 (0.13) | 0.17 (0.16) | 0.96 (0.04)*** | 0.22 (0.05)*** | 0.81 (0.01)*** | −0.26 (0.03)*** | −0.23 (0.03)*** | 0.08 (0.03)** |
| Rr | 0.61 (0.17)*** | 0.77 (0.23)*** | −0.28 (0.13)* | −0.21 (0.13) | 0.16 (0.15) | 0.99 (0.00)*** | 0.99 (0.03)*** | 0.23 (0.04)*** | −0.25 (0.03)*** | −0.25 (0.03)*** | 0.14 (0.03)*** |
| CS‐CWT | −0.36 (0.22) | −0.51 (0.28)* | 0.39 (0.19)* | 0.25 (0.18) | −0.21 (0.19) | −0.72 (0.18)*** | −0.83 (0.21)*** | −0.74 (0.19)*** | 0.11 (0.04)*** | 0.75 (0.01)*** | −0.17 (0.03)*** |
| CS‐WD | −0.60 (0.17)*** | −0.76 (0.22)*** | 0.34 (0.14)* | 0.19 (0.14) | −0.25 (0.16) | −0.63 (0.15)*** | −0.66 (0.16)*** | −0.65 (0.15)*** | 0.90 (0.07)*** | 0.18 (0.04)*** | −0.47 (0.02)*** |
| CS‐LDr | 0.64 (0.20)*** | 0.78 (0.24)*** | −0.47 (0.16)** | −0.35 (0.15)* | 0.58 (0.22)** | 0.41 (0.19)* | 0.55 (0.20)** | 0.48 (0.19)** | −0.52 (0.23)* | −0.63 (0.15)* | 0.12 (0.04)*** |
For heritability estimates, the significance of the additive genetic variance is reported. Abbreviations for the phenotypic traits are as follows: H38: height at 38 years; DBH38: stem diameter at breast height at 38 years; WD: wood density; CWT: cell wall thickness; LDr: radial lumen diameter; Rc: growth recovery; Rl: growth resilience; Rr: relative growth resilience; CS‐CWT: climate sensitivity of cell wall thickness to drought; CS‐WD: climate sensitivity of wood density to drought; CS‐LDr: climate sensitivity of radial lumen diameter to drought.
Narrow‐sense heritability estimates were obtained using the G‐matrix of pairwise realized genomic relationships using SNP markers are reported on the diagonal (grey background). Standard errors of estimates are given in parentheses. Significant correlations are reported as follows:
p < .05,
p < .01,
p < .001.
3.2. Genotype–phenotype associations (GPA)
The main and polygenic effects of SNPs included in the BSLMM explained from 11.0% (CS‐CWT) to 33.6% (CWT) of the phenotypic variance (PVE; Figure 3; Table S2), which closely reflected the narrow‐sense heritability estimates. No significant SNP associations were detected for Rl and H38 (Table 2a). Between one and 18 significant SNPs were identified for the other traits tested, resulting in a merged “GPA list” of 57 unique SNPs representing 53 unique genes. The 57 SNPs discovered included 50 that were located in exons (20 synonymous, 12 nonsynonymous and 18 located in UTRs) and five located in introns, while the annotation of two SNPs was undetermined (Table S4). Only two SNPs showed significant associations with the dendrometric traits H38 and DBH38, while 14 and 18 significant associations were found for the climate‐sensitivity and the growth response traits, respectively. A larger number of significant markers (24 SNPs) were detected for the anatomical traits (Table 2a). Pairwise comparisons between traits revealed that eight SNPs were shared between CWT and WD, while seven SNPs were common to Rc and Rr (Notes S1). These overlaps are in agreement with the high pairwise genetic correlations observed between these traits (i.e., r = .85 between CWT and WD and r = .99 between Rc and Rr; Table 1).
FIGURE 3.

Results of genotype–phenotype association (GPA) analyses. Violin plots summarize the kernel densities of the posterior distributions taken from BSLMM analyses for the proportion of genetic variance explained by allelic variants (PVE). The median (black circle) and the standard deviation of the observations (thin line) are presented. Abbreviations for the phenotypic are as follows: H38: height at 38 years; DBH38: stem diameter at breast height at 38 years; WD: wood density; CWT: cell wall thickness; LDr: radial lumen diameter; Rc: growth recovery; Rl: growth resilience; Rr: relative growth resilience; CS‐CWT: climate sensitivity of cell wall thickness to drought; CS‐WD: climate sensitivity of wood density to drought; CS‐LDr: climate sensitivity of radial lumen diameter to drought
TABLE 2.
Number of significant single nucleotide polymorphisms (SNPs) detected and number of corresponding genes after genotype–phenotype associations (GPA) (a) and genotype–environment associations (GEA) (b).
| (a) | ||
|---|---|---|
| Trait subset or name | gemma a | |
| No. of SNPs | No. of genes | |
| Dendrometric | 2 | 2 |
| Height (H38) | 0 | 0 |
| Diameter at breast height (DBH38) | 2 | 2 |
| Anatomy | 24 | 21 |
| Wood density (WD) | 11 | 10 |
| Cell wall thickness (CWT) | 18 | 15 |
| Radial lumen diameter (LDr) | 3 | 3 |
| Growth response | 18 | 17 |
| Growth recovery (Rc) | 18 | 17 |
| Growth resilience (Rl) | 0 | 0 |
| Growth relative resilience (Rr) | 7 | 7 |
| Climate‐sensitivity | 14 | 14 |
| CS‐WD | 14 | 14 |
| CS‐CWT | 2 | 2 |
| CS‐LDr | 1 | 1 |
| All traits tested | 57 | 53 |
| (b) | ||||
|---|---|---|---|---|
| Predictors | RDAb | LFMMb | ||
| No. of SNPs | No. of genes | No. of SNPs | No. of genes | |
| Precipitation (Prec) | 10 | 9 | 3 | 3 |
| Standardized precipitation evapotranspiration index (SPEI) | 9 | 9 | 153 | 128 |
| Soil moisture index (SMI) | 51 | 42 | 109 | 84 |
| Temperature (Tmean) | 31 | 27 | 72 | 58 |
| Vapor pressure deficit (VPD) | 29 | 21 | 48 | 37 |
| All climatic variables tested | 130 | 101 | 290 | 229 |
gemma: genome‐wide efficient mixed‐model association.
RDA: redundancy discriminant analysis; LFMM: latent factor mixed models.
Different colors to identify the trait subsets.
The GPA list of significant SNPs contained genes involved in hydrolase activity, ion binding and heterocyclic compound binding (Figure S2; Table S5). The major gene families identified coded for glycoside hydrolases (six genes), zinc fingers (four genes) and putative transporters (four genes; Table 3a). Two putative pectinesterases were also identified.
TABLE 3.
Summary of the most well‐represented or enriched putative protein families identified in genotype–phenotype associations (a) or genotype–environment associations (b).
| (a) | |||
|---|---|---|---|
| Protein family (GPA analyses) | Enriched protein domaina | No. of genes | No. of DEGs |
| Glycoside hydrolase | No | 6 | 1 |
| Heat shock protein | Yes | 1 | 0 |
| Kinase | Yes | 2 | 1 |
| Methyltransferase | Yes | 1 | 1 |
| MYB | Yes | 1 | 1 |
| Pectinesterase | Yes | 2 | 1 |
| Peptidase | Yes | 2 | 0 |
| Transporter | Yes | 4 | 2 |
| Zinc finger | Yes | 4 | 3 |
| Total number of genes | — | 23 | 10 |
| (b) | ||||||||
|---|---|---|---|---|---|---|---|---|
| Protein family (GEA analyses) | Enriched protein domaina | No. of genes | No. of DEGs | Prec | SPEI | SMI | T mean | VPD |
| Chlorophyll binding protein | Yes | 4 | 3 | * | * | |||
| Glycosyltransferase | Yes | 3 | 2 | * | * | * | ||
| Glycoside hydrolase | No | 5 | 2 | * | * | * | ||
| Heat shock | Yes | 3 | 0 | * | ||||
| Kinase | Yes | 24 | 9 | * | * | * | * | |
| Leucine rich repeat | No | 8 | 3 | * | * | * | ||
| Methyltransferase | No | 6 | 2 | * | * | * | * | |
| MYB | No | 4 | 1 | * | * | |||
| Pectinesterase | No | 3 | 1 | * | * | |||
| Peptidase | No | 6 | 3 | * | * | * | * | |
| Transporter | Yes | 4 | 3 | * | * | * | * | |
| Zinc finger | Yes | 14 | 5 | * | * | * | * | * |
| Total number of genes | — | 34 | — | — | — | — | — | |
Significant SNP–climate associations are indicated by stars in (b). Results of protein domain enrichment analyses are presented in the “Enriched protein domain” column, including unenriched protein domains (No) and enriched protein domains in the GEA or DEG lists (Yes). The complete list of enriched protein domains can be found in Table S10.
Abbreviations: Prec, total precipitation in summer; SMI, mean soil moisture index in summer; SPEI, standardized precipitation–evapotranspiration index in summer; T mean, mean temperature in summer; VPD, vapour pressure deficit in summer.
3.3. Genotype–environment associations (GEA)
To identify genes along environmental gradients that are indicative of local adaptation, allele frequencies were tested against climate variables using both univariate (LFMM) and multivariate (RDA) approaches. Using an FDR of 0.1, a total of 290 unique SNPs were detected using LFMM. A large number of markers were significantly associated with SPEI (153) and SMI (109), followed by Tmean (72), VPD (48) and Prec (three) (Table 2b; Table S6). Using RDA, 130 SNPs were significantly associated with the five climatic variables tested, with a large proportion of SNPs being more specifically attributed to SMI (51 SNPs), Tmean (31) and VPD (29), while only 10 and nine SNPs were attributed to Prec and SPEI, respectively (Table 2b). When both LFMM and RDA methods were combined (union), 307 SNPs representing 240 genes were identified (Figure 4). A majority of markers were located in exons (97 synonymous, 66 nonsynonymous and 115 located in UTRs), 25 SNPs were located in introns, while the annotations for four SNPs remained undetermined (Table S8).
FIGURE 4.

Results of genotype–environment association (GEA) analyses. Venn diagram showing the numbers of significant SNPs and genes (reported in parentheses and italics), and the intersection between sets detected with the latent factor mixed models (LFMM) and the redundancy analysis (RDA)
Considering the statistical limitations of each GEA method used (see Section 4.1 for further details), genes detected by at least one GEA approach were considered in subsequent steps to minimize the rejection of true positives. This set included 240 genes and will be referred to as the “GEA list” hereafter. The GO classification revealed that those genes represented a broad range of molecular functions with the highest proportion being associated with catalytic activity (transferase activity) and heterocyclic compound binding (Table S9, Figure S2b). GO analysis also showed a significant enrichment for heterocyclic compound binding, protein metabolic process and transferase activity categories (Figure S2d). The kinase, zinc finger and leucine‐rich repeat genes were the most represented families, with 24, 14 and eight genes significantly associated with the five climate variables (Table 3b; Table S9). Among the 12 protein families presented, six protein domains were overrepresented in the candidate gene lists (i.e., GEA, GEA_DEGs or GEA_genotype lists; Table 2b; Table S10). While putative zinc finger proteins were associated with all the climate variables tested, kinases and transporters were associated with SPEI, SMI, Tmean and VPD but not precipitation. The three glycosyltransferases identified were related to SPEI, SMI and VPD. Four putative chlorophyll binding proteins showed associations with drought gradients (SPEI and SMI) while three members of the enriched heat shock protein family were specifically associated with soil moisture (Table 2b; Table S10).
3.4. Overlap with gene expression and functional annotation of high‐confidence genes
Among the 285 genes carrying significant SNPs according to GEA and GPA analyses, eight were found in common and were therefore considered high‐confidence candidates (Figure 5). Next, we investigated the expression profiles of these 285 genes to assess the overlap between association and transcriptomic approaches.
FIGURE 5.
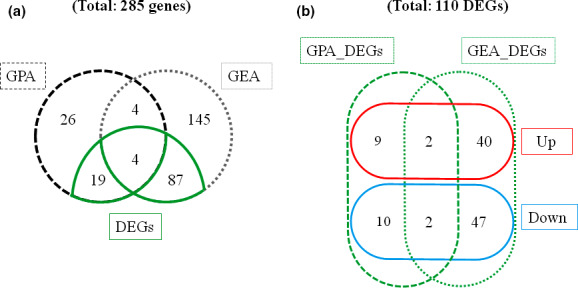
Distribution of genes carrying significant SNPs classified into different sets. (a) Venn diagrams showing unique and common sets of genes identified using genotype–environment (GEA) and genotype–phenotype (GPA) associations, and transcriptomic methods. (b) Venn diagram illustrating unique and common sets of drought‐responsive genes (DEGs) identified in GEA (GEA_DEGs) and GPA (GPA_DEGs). DEGs were classified into upregulated genes (Up, with log fold change LFC >0) and downregulated genes (Down, with LFC <0)
Gene expression data revealed that 10,788 genes out of the 22,532 genes initially surveyed were DEGs in response to drought, and were referred to as “drought‐responsive genes” (Table S3). Transcriptomic data identified 110 drought‐responsive genes among the 285 genes identified in GPA or GEA (Figure 5; Figure S3). Drought‐responsive GPA genes included 23 DEGs mostly involved in heterocyclic compound binding as well as transferase and hydrolase activities (Figure S2a). These genes were particularly overrepresented in the GO category response to stress, followed by the positive regulation of response to stimulus and the regulation of response to water deprivation (Figure S2c). The 91 drought‐responsive GEA genes were mostly involved in heterocyclic compound binding and transferase activity at GO level 3 and were overrepresented in anion binding, the generation of precursor metabolites and energy, and photosynthesis (Figure S2b,d).
The intersection of GPA and GEA lists revealed a set of eight high‐confidence genes (Table 4, Figure 5). These genes included a pyrophosphokinase (GQ04005_G11), one glutaredoxin (GQ0182_F04), a putative zinc‐finger transcription factor (GQ03707_G19), a phenylalanine ammonia lyase (GQ04102_C19), a glycoside hydrolase (GQ03203_B22), a pectinesterase (GQ03617_M21) and a polyadenylate binding protein (GQ03612_M08). Four of them were drought‐responsive (referred to as key genes, see Figure 2). The glutaredoxin and the zinc‐finger transcription factor were upregulated while the expression of the pectin esterase and the putative folate receptor were reduced under drought (Table 4). A significant genotypic effect was detected for two drought‐responsive genes coding for the putative pectinesterase (GQ03617_M21) and glutaredoxin (GQ0182_F04) (Table 4).
TABLE 4.
Details of the eight high‐confidence genes identified by intersecting the GEA and GPA lists.
| Gene | SNP | ST | GEA | Trait | Sequence description | InterPro classification | Drought | Regulation |
|---|---|---|---|---|---|---|---|---|
| GQ03612_M08 | PGAS1_09737 (GEA); PGAS1_09733 (GPA) | S (GEA); Intron (GPA) | SPEI (LFMM) | Rc | Polyadenylate_binding protein_interacting protein 9_like | Nucleotide_binding alpha_beta plait domain superfamily | ||
| GQ04005_G11 | PGAS1_12240 | 3′UTR | VPD (RDA); SMI (LFMM); VPD (LFMM); Tmean (LFMM) | Rc | Ribose_phosphate pyrophosphokinase 1 isoform X1 | Ribose_phosphate pyrophosphokinase | ||
| GQ03617_M21 | PGAS1_09857 (GEA); PGAS1_09858 (GPA) | S (GEA); S (GPA) | Tmean (LFMM) | Rc and Rr | 21 kDa protein_like | Pectine esterase inhibitor domain | −1.08 | Down |
| GQ0182_F04 | PGAS1_02551 | 5′UTR | SMI (RDA); SMI (LFMM) | CS‐WD | PREDICTED: glutaredoxin_C4 | Glutaredoxin subgroup | 0.80 | Up |
| GQ03707_G19 | PGAS1_00515 | NS | SMI (LFMM) | CS‐WD | Zinc finger CCCH domain containing protein | Zinc finger, CCCH_type | 2.98 | Up |
| GQ04102_C19 | PGAS1_12738 | NS | SPEI (LFMM) | CS‐WD | Phenylalanine ammonia_lyase_like | Aromatic amino acid lyase | ||
| GQ03203_B22 | PGAS1_00690 | NS | SMI (LFMM) | CWT and WD | Endoglucanase 3 | Glycoside hydrolase family 9 | ||
| GQ03207_I11 | PGAS1_07020 (GEA1); PGAS1_07021 (GEA2); PGAS1_07019 (GEA3); PGAS1_07022 (GPA) | 3′UTR (GEA1); NS (GEA2); 3′UTR (GEA3); 5′UTR (GPA) | SPEI (LFMM) | CWT | PREDICTED: uncharacterized protein LOC104598923 | Folate receptor_like | −0.74 | Down |
Columns are as follows: Gene: Gene ID from GCAT Picea glauca gene catalogue (Rigault et al., 2011); SNP: SNP identified in GEA or GPA analyses, and associated with the corresponding Gene ID; ST: substitution type, with synonymous (S) and nonsynonymous (NS) SNPs, or markers located in untranslated regions (3′UTR, 5′UTR); GEA: climatic factors for which a significant association was found are indicated and the method used for SNP detection is reported. The climatic variables include mean soil moisture index in summer (SMI), mean standardized precipitation evapotranspiration index in summer (SPEI), mean temperature in summer (Tmean) and mean vapour pressure deficit in summer (VPD). Both a redundancy discriminant analysis (RDA) and latent factor mixed models (LFMM) were used for GEA analyses; Trait: phenotypic trait for which a significant association was detected; Sequence description: annotation obtained using blast2go; InterPro classification: functional annotation that classifies the putative proteins based on their protein signatures. The most informative InterPro name is reported; Drought: if significantly regulated under drought conditions, the transcript level (log2 fold change) is reported; Regulation: drought‐responsive genes (DEGs) that were classified into upregulated genes (Up, with LFC >0), and downregulated genes (Down, with LFC <0).
4. DISCUSSION
We examined the underlying genomic architecture of adaptive divergence related to drought in 43 white spruce provenances growing in a common garden by linking variation in genotype, phenotype and environmental conditions. We report on a set of 285 genes associated with climate variables and/or adaptive traits, including 110 high‐confidence drought‐responsive genes. We propose that the four genes at the intersection between all association approaches and transcriptomics are of highest relevance for drought tolerance in white spruce and labelled them as key genes.
4.1. Signatures of polygenic adaptation to drought
The polygenic nature of traits involved in local adaptation to climate is well documented in coniferous and other plant species (Csillery et al., 2018; Sork, 2018; Sork et al., 2013). Adaptation usually builds up from a number of covarying small‐effect alleles rather than a few major‐effect alleles, resulting in the detection of multiple loci showing weak selection signals (Hornoy et al., 2015; Le Corre & Kremer, 2012). In this context, previous studies highlighted the value of using a combination of univariate and multivariate analyses when testing for signatures of adaptation in landscape genomic studies (Harrisson et al., 2017; Rellstab et al., 2015). In the present study, the overlap of significant SNPs identified by both LFMM and RDA was moderate (36.81%; Table 2a), in accordance with previous observations (Capblancq et al., 2018; Forester et al., 2018). However, the majority of SNPs detected by RDA (90%) were also detected by LFMM. A comparison of multivariate approaches (i.e., RDA) and univariate approaches (LFMM) recently concluded they had similar power to identify genetic markers significantly associated with climate variables (Capblancq et al., 2018). However, RDA was reported as more powerful than LFMM at identifying markers undergoing weak selection, and more robust to deviations in demographic histories, sample sizes and population structure (Ahrens et al., 2018; Forester et al., 2018). Their potentially divergent insights support the utility of combining LFMM and RDA methods to identify adaptive SNPs in white spruce.
In this study, the five environmental variables used for GEA analyses were complementary to each other and thus provide a comprehensive set of environmental drivers of local adaptation to drought. A high proportion of SNPs detected by LFMM (37.6%) and RDA (39.2%) were associated with SMI (Table 2b), indicating that soil moisture is a very informative index for the detection of drought adaptation in the populations investigated. Previous work showed that SMI was a strong predictor of growth resilience in the same 43 white spruce populations (Depardieu et al., 2020). Because SPEI integrates the effects of anomalous temperatures on drought and precipitation, it is likely to better capture the frequency of drought events than Tmean and Prec. The largest number of significant SNPs was obtained for SPEI in the LFMM analyses (153 SNPs or 52.8%; Table 2b), while only 6.9% of significant SNPs were associated with this variable using the RDA method (Table 2b). The univariate LFMM allows an SNP to be associated with more than one climatic variable, whereas each significant marker was assigned to the climatic predictor for which the correlation was the highest in RDAs. Indeed, in our study we found that 27 SNPs were associated with VPD and SPEI using LFMM (Figure S4a), with 20 of them formally associated with VPD using RDA (Figure S4b). Our results show that SPEI, SMI and VPD are prevalent climatic variables capturing allele frequency changes along environmental gradients. Of the 240 significant genes identified in GEA (Figure 4), 43 genes were previously reported as involved in adaptation to climate or pertaining to gene families with high levels of amino acid changes in white spruce (Table S11; Hornoy et al., 2015; Namroud et al., 2008; Pavy, Gagnon, et al., 2013). This supports their relevance in capturing signals of local adaptation in this species.
For GPA analyses, several studies reported that multilocus approaches generally outperformed single locus approaches (Ehret et al., 2012; Moser et al., 2015). This is particularly true when causal variants have small size effects on phenotypes (Jiang & Zeng, 1995; Konigorski et al., 2017), as is the case in conifers where individual loci generally explain <5% of trait variance (e.g. Beaulieu et al., 2011; González‐Martínez et al., 2007; Lu et al., 2017; Prunier et al., 2013). In the present study, the main and polygenic effects of SNPs included in the Bayesian sparse linear mixed model explained 11.0%–33.6% of the phenotypic variance of the traits tested (Figure 4; Table 2b). These estimates are in line with those reported in Pinus albicaulis (Lind et al., 2017), where the genetic variance of SNPs included in the polygenic model explained 14.4%–37.6% of the variance of phenology‐related traits and dendrometric traits such as height.
4.2. The phenotype–genotype–environment interplay, the cornerstone of local adaptation
We have identified a set of eight high‐confidence genes by intersecting GEA and GPA lists of significant SNPs, and believe that four of these may be key genes based on their drought‐responsiveness expression (Table 4). The 13 significant SNPs carried by the eight high‐confidence genes included four nonsynonymous, three synonymous and six SNPs located in noncoding regions (Table 4). Although nonsynonymous SNPs are usually thought to be the main target of selection because they induce a change in protein sequence, silent SNPs (i.e., synonymous and noncoding SNPs) can also affect transcription, RNA splicing, transport and translation (Barrett et al., 2012; Komar, 2007). Furthermore, given the rapid decay of linkage disequilibrium in white spruce natural populations (Pavy, Namroud, et al., 2012), it is possible that some of these SNPs are linked to a causal DNA polymorphism located nearby in the same gene. Therefore, these significant markers represent useful information for the identification of candidate genes involved in drought adaptation.
The number of genes identified by combining both GEA and GPA analyses was small (eight genes out of 2,606 tested or 0.31%) compared to previous results relying on both GEA and GPA approaches in coastal Douglas‐fir (six significant genes out of 117 candidates involved in cold hardiness, or 5.13% of genes; Vangestel et al., 2018), but in the same range as that found previously in white spruce using GEA only (e.g., 0.4%; see Hornoy et al., 2015; Namroud et al., 2008; Table S11). The proportion of markers displaying signals of local adaptation and identified using GEA‐only studies varied from 0.09% to 4.42% in other conifer species, such as Picea sitchensis (Holliday et al., 2010), Pinus lambertiana (Eckert et al., 2015) or Pinus taeda (Talbot et al., 2017). Such large variation is expected when different experimental designs, methods and statistical thresholds are used.
The small overlap observed between the GEA and GPA lists of genes carrying significant SNPs was somehow expected, given that GEA identified genes carrying variants beneficial in the environmental conditions prevailing at provenance locations, whereas GPA revealed genes for which genetic variation is involved directly in tree fitness in the conditions prevailing at the common garden site, and which would implicate a larger set of physiological processes. Conifers are perennial plants that originated over 300 million years ago (Farjon, 2018; Gernandt et al., 2011) and have evolved a diversity of genetic adaptations and capacities for physiological plasticity in response to ever changing local environmental conditions. Significant GEAs detected in our study indicate that white spruce populations occurring in heterogeneous environments are probably under divergent selection. Given the typically multigenic control of adaptive traits and high within‐population genetic diversity in white spruce (Depardieu et al., 2020), it is likely that high selection pressures resulting from extreme climatic conditions or climatic shifts translated into small to moderate allele frequency shifts at many genes. It is commonly assumed that, at the evolutionary timescale, genetic adaptation to drought is the result of constant climatic constraints in addition to punctual extreme climatic events (Combes, 2008). One should note that, because adaptation to drought is generally the result of additive effects of various adaptive traits (de Micco & Aronne, 2012), the small overlap observed between our GEA and GPA lists might be partially explained by the limited number of phenotypic traits examined in this study. Current research efforts in white spruce are focusing on precision phenotyping to identify novel traits that could help find mechanisms underlying drought adaptation (e.g., D’Odorico et al., 2020).
While the GEA analyses conducted herein probably identified gene variants providing a selective advantage under dry climatic conditions or frequent drought events, GPA analyses also uncovered gene variants leading to improved drought resilience following the severe 2002 drought event. The genes discovered in GPA are potentially relevant to overcome extreme drought events. We used the same set of provenances in previous work and showed that white spruce populations from drier geographical origins had higher growth resilience to extreme drought events (Depardieu et al., 2020). Thus, the genes derived from the overlap of GEA and GPA lists of significant SNPs (Table 4) probably carry variants providing a selective advantage to trees evolving in dry conditions. They are especially relevant if we assume that most significant natural selection episodes occur during extreme climatic events, which set up strong selective pressures on individuals and populations (see Grant et al., 2017).
4.3. Putative functions of significantly associated genes and relationships with drought‐responsive gene expression
The significant proportion of genes involved in white spruce climate adaptation exhibiting transferase and hydrolase activities (Figure S2) was consistent with previous observations in both white spruce (Hornoy et al., 2015) and Norway spruce (Azaiez et al., 2018). The most well‐represented protein families among significant genes detected with association methods were the kinase and zinc finger proteins (ZFP) (with 36 and 18 genes identified in GEA and GPA, respectively) including 10 kinases and eight ZFPs that had drought‐responsive expressions (Table 3a,b). MYB transcription factors were also found differentially expressed under drought conditions (Table 3; Tables S5 and S9). Many members of these gene families are involved in plant development, hormone and stress response pathways in plants (Golldack et al., 2014; Joshi et al., 2016; Sharma & Pandey, 2016). In trees, the overexpression of ZFP and MYB transcription factors resulted in enhanced photosynthesis, production of antioxidant enzymes and enhanced growth under water stress (for a review, see Polle et al., 2019). Other functional proteins, such as glycosyltransferases, glycoside hydrolases, pectinesterases, one dehydrin (GQ03914_N06) and one dehydratase (GQ03213_K13), were also differentially expressed in response to drought (Tables S5 and S9). Drought‐responsive members of these gene families have been previously reported in several conifer species (Behringer et al., 2015; Perdiguero et al., 2012; Stival Sena et al., 2018).
The overlap of GEA and GPA lists highlighted eight genes of highest relevance for drought adaptation and coding for putative proteins serving regulatory, enzymatic and structural functions (Table 4). We found no empirical evidence for a direct involvement of these genes in drought tolerance in Arabidopsis thaliana. In particular, the expression of the putative pectinesterase and folate receptor was reduced in response to drought, while the putative glutaredoxin and zinc finger protein were up‐regulated under drought conditions (Table 4). Pectins have been shown to play a key role in modulating cell wall structure in response to drought stress (Le Gall et al., 2015). Functional studies have shown the role of glutaredoxin genes in enhancing drought tolerance in herbaceous plant species (Wu et al., 2017). The A. thaliana homologue of the putative zinc finger protein (GQ03707_G19) has been shown to improve plant tolerance to oxidative stress (Huang et al., 2011). Similarly, the homologous folate receptor gene was reduced under both oxidative and salt stresses in this model plant (Luhua et al., 2013). Considering the signalling crosstalk in response to different abiotic stresses, this transcription factor is likely to be involved in drought tolerance in white spruce.
Transcriptomic data were used to identify two sets of drought‐responsive genes among those underlying local adaptation as a complementary approach to the GEA and GPA studies. Of the 285 genes identified by GEA or GPA analyses, 110 genes were regulated under drought conditions (Figures 2 and 5), including 59 upregulated and 51 downregulated genes (Figure 5b). Variation in gene expression can occur through cis‐ and trans‐ regulations, which can promote adaptation and divergence within and among natural populations (Signor & Nuzhdin, 2018). Cis‐acting polymorphisms induce variation in expression in the gene carrying them or in a gene linked to it, while trans‐acting effects refer to polymorphisms in other loci affecting gene expression. About 39% of the genes identified in genetic associations were DEGs, indicating that those genes are likely to carry cis‐acting elements, as previously observed in black spruce from an overlap of 17% between significant GEA gene SNPs and differential gene expression among genotypic classes (Prunier et al., 2015). Because the SNPs analysed here were mainly located in exons, it would be relevant to further investigate whether these 110 genes carry additional variants in their cis‐regulatory regions that would be in linkage with the significant SNPs identified herein. Nonetheless, our results suggest that a large proportion of DEGs carrying high‐confidence SNPs identified by GPA or GEA analyses could underpin trans‐acting effects, in accordance with previous observations at the intraspecific level (Signor & Nuzhdin, 2018).
Previous work in A. thaliana suggested that both cis‐regulatory evolution and genetic variation in stress responsive gene expression may be important mechanisms of local adaptation (Lasky et al., 2014). To our knowledge, only a few studies in plants have clearly illustrated how RNA‐sequencing (RNA‐seq) or quantitative polymerase chain rection data could be used to identify locally adapted genes in response to climate (Gugger et al., 2016; Lasky et al., 2014; Prunier et al., 2015). Among the genes exhibiting a strong response to stress (referred to as “eSR genes”, for stress expression response), Lasky et al. (2014) identified a restricted set of genes that differ across genotypes in their gene expression response (referred to as “eGEI genes”, for the gene‐by‐environment interaction expression). For instance, genes with genetically variable responses to drought or cold (eGEI genes) had stronger associations with climate than eSR genes (Lasky et al., 2014). This suggests that eGEI genes should play a role in plasticity across different environments, thus reflecting local adaptation.
Other studies conducted in bacteria and some plants showed that a large proportion of genes responsive to a specific stress are not adaptive for this stress, suggesting that regulated genes might reflect neutral evolutionary drift or dynamic changes in gene regulatory networks (for a review see Joshi et al., 2016; López‐Maury et al., 2008; Swindell et al., 2007). In this study, combining association genetics and transcriptomics helped to untangle the genes involved in adaptive divergence from those involved in short‐term responses to stress. However, one limitation of our study was that the genotypes (and families) evaluated by RNA‐seq were different from those used to perform GEA and GPA analyses. A second limitation was that seedling response to drought (used in our transcriptomic approach) may not be indicative of tree response throughout its lifespan. Thus, we should be cautious when interpreting the results of the combination of the GEA/GPA and DEG gene lists. Nevertheless, the intersection of the two approaches does indicate drought‐responsive genes with a potential adaptive value. To date, understanding how short‐term gene expression responses to drought are linked to drought adaptation remains challenging, and studies that aim to estimate selection on gene expression are scarce in long‐lived plants such as conifers. Future studies incorporating phenotypic, genotypic and environmental data measured on the same individuals are likely to provide strong inferences of selection targets in natural white spruce populations.
4.4. Building resilience under a drier climate: opportunities and practical implications
Forest managers and tree breeders are faced with rapid climate change and need to update their strategies to foster the drought resilience of forest ecosystems, while maintaining wood quality and productivity. In this context, it is crucial to examine potential trade‐offs between traits reflecting fitness and traits related to vulnerability to climate. The range of narrow‐sense heritability estimates that we observed using the conservative G‐matrix approach (0.11 ≤ h 2 ≤ 0.32, Table 1) and estimates from previous work in spruces (e.g. Depardieu et al., 2020; Lenz et al., 2010; Li et al., 1993; Zeltins et al., 2018) indicates that the traits studied here will respond to breeding selection. In particular, the higher genetic control observed for the growth response traits (Rc, Rl and Rr) compared to the other traits tested in this study (Table 1) suggests that this suite of traits could be used to improve the resilience of plantations under dryer climate in the future. In Douglas‐fir (Pseudotsuga menziesii var. menziesii) and oak (Quercus series Virentes), height gains can be achieved by selecting parental trees with higher growth rates, but this may come at the expense of tolerance to abiotic stresses (Darychuck et al., 2012; Koehler et al., 2012). In contrast, no consistent trade‐offs between height gain and tolerance to climate were observed in interior spruce (De la Torre et al., 2014; MacLachlan et al., 2017). In the absence of a trade‐off between height growth improvement and drought tolerance in white spruce (Table 1) it seems possible to select drought‐resilient germplasm, while maintaining high productivity. These observations are in accordance with previous observations we made at the population level (Depardieu et al., 2020). However, the absence of observed trade‐offs may only hold in the growing conditions prevailing at the common garden site specific to our study. Even if low genotype‐by‐environment (GxE) interactions have been noted in eastern white spruce for productivity and phenology traits (Li et al. 1993), potential GxE interactions for drought tolerance traits could exist and should be assessed in other common gardens to support the generalization of these conclusions.
The present genomics study is one of the few that has combined association and transcriptomic approaches to examine adaptation to climate such as drought episodes in a widely distributed conifer. We showed an absence of trade‐offs between growth resilience and various dendrometric traits (i.e., height and radial growth), indicating that drought resistance and productivity are positively correlated in white spruce. The combination of these approaches uncovered a set of key genes probably involved in genetic adaptation to climate and more specifically involved in the regulation of physiological response to drought. The present set of 110 high‐confidence candidate genes should prove valuable for future fundamental studies of physiological processes including the functional characterization of drought tolerance in conifers.
From an applied standpoint, once repeatability is validated in independent tree sets, the markers identified in this study may prove useful in marker‐assisted selection schemes and also to monitor adaptive genetic resources. One possible way to move forward with monitoring would be to screen established breeding populations for the presence of beneficial alleles and their prevalence, compared to that in natural populations. Because drought‐adaptive traits are probably controlled by many small‐effect genes, new genetic diversity could be infused in established breeding populations by testing candidate trees for the simultaneous presence of a number of potentially beneficial alleles. Other applications could be considered such as integrating the most significant markers in genomic selection models that would aim to improve drought tolerance, so as to improve the prediction accuracy of these models especially in breeding populations with large effective population size (e.g., Beaulieu et al. 2014). Together, our findings provide a background for predicting population response to rapid climate change and lay the foundation for genomic‐based breeding efforts for drought resistance in conifer species.
5. DATA AND CODE AVAILABILITY
The original phenotypic data are part of the network of the Natural Resources Canada white spruce genecological tests, and have been stored in our institution's database (https://treesource.rncan.gc.ca). Full access can be shared upon request to the corresponding author according to the intellectual property policies (IPP) of participating governmental institutions. Genotyping data are accessible through the Dryad Digital Repository (https://doi.org/10.5061/dryad.6rd6f). The data and R scripts used in the present study are available on the Github website (https://github.com/ClaireDepardieu/Genetic_basis_drought). The raw transcriptomic data were deposited in the European Nucleotide Archive (ENA) as part of the study SRP134160, bioproject PRJNA437248 (SRA accession nos. SRR6816977 to SRR6816983).
AUTHOR CONTRIBUTIONS
J.B., N.I., P.L. and J.M. designed the study and methodology. C.D., S.N., S.G., M.L. and G.J.P. performed the analyses and discussed the results. C.D., S.G. and S.N. wrote the manuscript draft with inputs from N.I., J.B., P.L., G.P., M.G.P. and J.M.
Supporting information
Supplementary Material
Table S3
Table S10
ACKNOWLEDGEMENTS
The authors thank Jean Beaulieu (Canada Research Chair in Forest Genomics, Université Laval) for his expert coordination and constructive discussions. We acknowledge all the people who were involved in seed collection, curation, plantation establishment during the 1970s as well as colleagues involved in maintenance of sites and data collection at Natural Resources Canada. We also acknowledge the Silviscan platform at FPInnovations in Vancouver for wood sample processing and data generation. The authors also thank Marie‐Claude Gros‐Louis, Eric Dussault, Daniel Plourde, Philippe Labrie, Jean‐Francois Légaré and Vincent Seigner (Natural Resources Canada) for sampling and phenotypic assessments of trees. We gratefully acknowledge Sylvie Blais and France Gagnon (Canada Research Chair in Forest Genomics, Université Laval), as well as Patricia Lavigne and Sébastien Clément (Natural Resources Canada), for validation of the genotypic data. We thank Gervais Pelletier (Natural Resources Canada) for his help with enrichment analyses. We thank Juliana Stival Sena (Natural Resources Canada), Aida Azaiez (Canada Research Chair in Forest Genomics, Université Laval) and Julie Godbout (Natural Resources Canada and Ministère des Forêts, de la Faune et des Parcs du Québec) for constructive discussions. We are also grateful to Carole Coursolle (Natural Resources Canada) for her comments on an earlier version of the manuscript. This research was part of the Spruce‐Up genomic project (http://spruce‐up.ca) led by J. Bohlmann and J. Bousquet and funded by Genome Canada, Genome Quebec and Genome British Columbia. Funding was also provided by a discovery grant from the National Sciences and Engineering Council of Canada to J.B., a grant from the Programme de soutien à la recherche (volet Soutien à des initiatives internationales de recherche et d’innovation, Ministère Développement Économique, Innovation et Exportation du Québec) to J.B. and J.M., and a grant from the Genomics Research and Development Initiative of Natural Resources Canada to N.I. The authors thank two anonymous reviewers as well as Dr Christian Rellstab and Dr Mitchell Cruzan for their insightful comments and suggestions that helped improve the manuscript.
Sébastien Gérardi and Simon Nadeau contributed equally to this work.
Jean Bousquet and Nathalie Isabel contributed equally to this work.
Contributor Information
Claire Depardieu, Email: claire-paulette.depardieu.1@ulaval.ca.
Jean Bousquet, Email: jean.bousquet@sbf.ulaval.ca.
REFERENCES
- Ahrens, C. W., Rymer, P. D., Stow, A., Bragg, J., Dillon, S., Umbers, K. D. L., & Dudaniec, R. Y. (2018). The search for loci under selection: trends, biases and progress. Molecular Ecology, 27, 1342–1356. 10.1111/mec.14549. [DOI] [PubMed] [Google Scholar]
- Aitken, S. N., Yeaman, S., Holliday, J. A., Wang, T. L., & Curtis‐McLane, S. (2008). Adaptation, migration or extirpation: climate change out‐comes for tree populations. Evolutionary Applications, 1, 95–111. 10.1111/j.1752-4571.2007.00013.x. [DOI] [PMC free article] [PubMed] [Google Scholar]
- Allen, C. D., Macalady, A. K., Chenchouni, H., Bachelet, D., McDowell, N., Vennetier, M., Kitzberger, T., Rigling, A., Breshears, D. D., Hogg, E. H. (. T., Gonzalez, P., Fensham, R., Zhang, Z., Castro, J., Demidova, N., Lim, J.‐H., Allard, G., Running, S. W., Semerci, A., & Cobb, N. (2010). A global overview of drought and heat‐induced tree mortality reveals emerging climate change risks for forests. Forest Ecology and Management, 259, 660–684. 10.1016/j.foreco.2009.09.001. [DOI] [Google Scholar]
- Anderegg, W. R. L., Kane, J. M., & Anderegg, L. D. L. (2013). Consequences of widespread tree mortality triggered by drought and temperature stress. Nature Climate Change, 3, 30–36. 10.1038/nclimate1635. [DOI] [Google Scholar]
- Aubin, I., Munson, A. D., Cardou, F., Burton, J. P., Isabel, N., Pedlar, J. H., Paquette, A., Taylor, A. R., Delagrange, S., Kebli, H., Messier, C., Shipley, B., Valladares, F., Kattge, J., Boisvert‐Marsh, L., & McKenney, D. (2016). Traits to stay, traits to move: a review of functional traits to assess sensitivity and adaptive capacity of temperate and boreal trees to climate change. Environmental Reviews, 24(2), 164–186. 10.1139/er-2015-0072. [DOI] [Google Scholar]
- Azaiez, A., Pavy, N., Gérardi, S., Laroche, J., Boyle, B., Gagnon, F., Mottet, M.‐J., Beaulieu, J., & Bousquet, J. (2018). A catalog of annotated high‐confidence SNPs from exome capture and sequencing reveals highly polymorphic genes in Norway spruce (Picea abies). BMC Genomics, 19, 942. 10.1186/s12864-018-5247-z. [DOI] [PMC free article] [PubMed] [Google Scholar]
- Barrett, L. W., Fletcher, S., & Wilton, S. D. (2012). Regulation of eukaryotic gene expression bu the untranslated gene regions and other non‐coding elements. Cellular and Molecular Life Science, 69, 3613–3634. [DOI] [PMC free article] [PubMed] [Google Scholar]
- Beaulieu, J., Doerksen, T., Boyle, B., Clément, S., Deslauriers, M., Beauseigle, S., Blais, S., Poulin, P.‐L., Lenz, P., Caron, S., Rigault, P., Bicho, P., Bousquet, J., & MacKay, J. (2011). Association genetics of wood physical traits in the conifer white spruce and relationships with gene expression. Genetics, 188, 197–214. 10.1534/genetics.110.125781 [DOI] [PMC free article] [PubMed] [Google Scholar]
- Beaulieu, J., Doerksen, T., Clément, S., MacKay, J., & Bousquet, J. (2014). Accuracy of genomic selection models in a large population of open‐pollinated families in white spruce. Heredity, 113, 343–352. 10.1038/hdy.2014.36. [DOI] [PMC free article] [PubMed] [Google Scholar]
- Behringer, D., Zimmermann, H., Ziegenhagen, B., & Liepelt, S. (2015). Differential gene expression reveals candidate genes for drought stress response in Abies alba (Pinaceae). PLoS One, 10, e0124564. 10.1371/journal.pone.0124564. [DOI] [PMC free article] [PubMed] [Google Scholar]
- Bush, W. S., & Moore, J. H. (2012). Chapter 11: Genome‐wide association studies. PLoS Computational Biology, 8(12), e1002822. 10.1371/journal.pcbi.1002822 [DOI] [PMC free article] [PubMed] [Google Scholar]
- Butler, D. G., Cullis, B. R., Gilmour, A. R., Gogel, B. G., & Thompson, R. (2017). ASReml‐R Reference Manual Version 4. : VSN International Ltd. [Google Scholar]
- Capblancq, T., Luu, K., Blum, M. G. B., & Bazin, E. (2018). Evaluation of redundancy analysis to identify signatures of local adaptation. Molecular Ecology, 18, 1223–1233. 10.1111/1755-0998.12906. [DOI] [PubMed] [Google Scholar]
- Chaves, J. A., Cooper, E. A., Hendry, A. P., Podos, J., De León, L. F., Raeymaekers, J. A. M., MacMillan, W. O., & Uy, J. A. C. (2016). Genomic variation at the tips of the adaptive radiation of Darwin’s finches. Molecular Ecology, 2521, 5282–5295. 10.1111/mec.13743. [DOI] [PubMed] [Google Scholar]
- Choat, B., Jansen, S., Brodribb, T. J., Cochard, H., Delzon, S., Bhaskar, R., Bucci, S. J., Feild, T. S., Gleason, S. M., Hacke, U. G., Jacobsen, A. L., Lens, F., Maherali, H., Martínez‐Vilalta, J., Mayr, S., Mencuccini, M., Mitchell, P. J., Nardini, A., Pittermann, J., … Zanne, A. E. (2012). Global convergence in the vulnerability of forests to drought. Nature, 491, 752–755. 10.1038/nature11688. [DOI] [PubMed] [Google Scholar]
- Combes, S. (2008). The role of extreme events in evolution. Comptes Rendus Géoscience, Elsevier Masson, 340, 591–594. [Google Scholar]
- Csillery, K., Rodriguez‐Verdugo, A., Rellstab, C., & Guillaume, F. (2018). Detecting the genomic signal of polygenic adaptation and the role of epistasis in evolution. Molecular Ecology, 27, 606–612. 10.1111/mec.14499. [DOI] [PubMed] [Google Scholar]
- D’Odorico, P., Besik, A., Wong, C. Y. S., Isabel, N., & Ensminger, I. (2020). High throughput drone‐basedremote sensing reliably tracks phenology in thousands of conifer seedlings. New Phytologist, 226, 1667–1681. 10.1111/nph.16488. [DOI] [PubMed] [Google Scholar]
- Darychuck, N., Hawkins, B. J., & Stoehr, M. (2012). Trade‐offs between growth and cold and drought hardiness in submaritime Douglas‐fir. Canadian Journal of Forest Research, 42, 1530–1541. 10.1139/x2012-092. [DOI] [Google Scholar]
- De La Torre, A., Jaquish, B., & Aitken, S. N. (2014). Adaptation and exogenous selection in a Picea glauca × Picea engelmannii hybrid zone: Implications for forest management under climate change. New Phytologist, 201, 687–699. 10.1111/nph.12540. [DOI] [PMC free article] [PubMed] [Google Scholar]
- de Micco, V. D., & Aronne, G. (2012). Morpho‐anatomical traits for plant adaptation to drought. In Aroca R. (Ed.), Plant responses to drought stress (pp. 37–61). Springer. [Google Scholar]
- de Villemereuil, P., Gaggiotti, O. E., Mouterde, M., & Till‐Bottraud, I. (2016). Common garden experiments in the genomic era: new perspectives and opportunities. Heredity, 116, 249–254. [DOI] [PMC free article] [PubMed] [Google Scholar]
- Depardieu, C., Girardin, M. P., Nadeau, S., Lenz, P., Bousquet, J., & Isabel, N. (2020). Adaptive genetic variation to drought in a widely distributed conifer suggests a potential for increasing forest resilience in a drying climate. New Phytologist, 227(2), 427–439. 10.1111/nph.16551. [DOI] [PMC free article] [PubMed] [Google Scholar]
- Eckert, A. J., Maloney, D. R., Vogler, D. R., Jensen, C. E., Delfino Mix, A., & Neale, D. B. (2015). Local adaptation at fine spatial scales: an example from sugar pine (Pinus lambertiana, Pinaceae). Tree Genetics and Genomes, 11, 42. 10.1007/s11295-015-0863-0. [DOI] [Google Scholar]
- Ehret, G. B., Lamparter, D., Hoggart, C. J., Whittaker, J. C., Beckmann, J. S., & Kutalik, Z. (2012). A multi‐SNP locus‐association method reveals a substantial fraction of the missing heritability. American Journal of Human Genetics, 91, 863–871. 10.1016/j.ajhg.2012.09.013. [DOI] [PMC free article] [PubMed] [Google Scholar]
- Endelman, J. B., & Jannink, J. L. (2012). Shrinkage estimation of the realized relationship matrix. Genes, Genomes, Genetics, 2, 1405–1413. 10.1534/g3.112.004259. [DOI] [PMC free article] [PubMed] [Google Scholar]
- Farjon, A. (2018). The kew review: conifers of the world. Kew Bulletin, 73, 8. [Google Scholar]
- Forester, B. R., Lasky, J. R., Wagner, H. H., & Urban, D. L. (2018). Comparing methods for detecting multilocus adaptation with multivariate genotype‐environment associations. Molecular Ecology, 27, 2215–2233. 10.1111/mec.14584. [DOI] [PubMed] [Google Scholar]
- François, O., Martins, H., Caye, K., & Schoville, S. D. (2016). Controlling false discoveries in genome scans for selection. Molecular Ecology, 25, 454–469. 10.1111/mec.13513. [DOI] [PubMed] [Google Scholar]
- Frichot, E., & Francois, O. (2015). LEA: an R package for landscape and ecological association studies. Methods in Ecology and Evolution, 6, 925–929. 10.1111/2041-210X.12382. [DOI] [Google Scholar]
- Gernandt, D. S., Willyard, A., Syring, J. V., & Liston, A. (2011). The Conifers (Pinophyta). In Plomion C., Bousquet J., & Kole C. (Eds.), Genetics, genomics and breeding of conifers (pp. 1–39). CRC Press and Science Publishers. [Google Scholar]
- Girardin, M. P., Hogg, E. H., Bernier, P. Y., Kurz, W. A., Guo, X. J., & Cyr, G. (2016). Negative impacts of high temperatures on growth of black spruce forests intensify with the anticipated climate warming. Global Change Biology, 22, 627–643. 10.1111/gcb.13072. [DOI] [PubMed] [Google Scholar]
- Girardin, M. P., Isabel, N., Guo, X. J., Lamothe, M., Duchesne, I., & Lenz, P. (2021). Annual aboveground carbon uptake enhancements from assisted gene flow in boreal black spruce forests are not long‐lasting. Nature Communications, 12(1), 1169. 10.1038/s41467-021-21222-3 [DOI] [PMC free article] [PubMed] [Google Scholar]
- Golldack, D., Li, C., Mohan, H., & Probst, N. (2014). Tolerance to drought and salt stress in plants: unraveling the signaling networks. Frontiers in Plant Science, 5, 151. 10.3389/fpls.2014.00151. [DOI] [PMC free article] [PubMed] [Google Scholar]
- González‐Martínez, S. C., Wheeler, N. C., Ersoz, E., Nelson, C. D., & Neale, D. B. (2007). Association genetics in Pinus taeda L. I. Wood property traits. Genetics, 175, 399–409. 10.1534/genetics.106.061127. [DOI] [PMC free article] [PubMed] [Google Scholar]
- Gotz, S., Garcia‐Gomez, J. M., Terol, J., Williams, T. D., Nagaraj, S. H., Nueda, M. J., Robles, M., Talon, M., Dopazo, J., & Conesa, A. (2008). High‐throughput functional annotation and data mining with the BLAST2GO suite. Nucleic Acids Research, 36, 3420–3435. 10.1093/nar/gkn176. [DOI] [PMC free article] [PubMed] [Google Scholar]
- Goudet, J. (2005). HIERFSTAT, a package for R to compute and test hierarchical F‐statistics. Molecular Ecology Notes, 5, 184–218. 10.1111/j.1471-8286.2004.00828.x. [DOI] [Google Scholar]
- Grant, P. R., Grant, B. R., Huey, R. B., Johnson, M. T. J., Knoll, A. H., & Schmitt, J. (2017). Evolution caused by extreme events. Philosophical Transactions of the Royal Society B, 372(1723), 20160146. 10.1098/rstb.2016.0146. [DOI] [PMC free article] [PubMed] [Google Scholar]
- Gugger, P. F., Peñaloza‐Ramírez, J. M., Wright, J. W., & Sork, V. (2016). Whole‐transcriptome response to water stress in a California endemic oak. Quercus Lobata. Tree Physiology, 37(5), 632–644. 10.1093/treephys/tpw122. [DOI] [PubMed] [Google Scholar]
- Hargreaves, G. H., & Samani, Z. A. (1985). Reference crop evapotranspiration from temperature. Applied Engineering in Agriculture, 1(2), 96–99. 10.13031/2013.26773 [DOI] [Google Scholar]
- Harrisson, K. A., Amish, S. J., Pavlova, A., Narum, S. R., Telonis‐Scott, M., Rourke, M. L., Lyon, J., Tonkin, Z., Gilligan, D. M., Ingram, B. A., Lintermans, M., Gan, H. M., Austin, C. M., Luikart, G., & Sunnucks, P. (2017). Signatures of polygenic adaptation associated with climate across the range of a threatened fish species with high genetic connectivity. Molecular Ecology, 26, 6253–6269. 10.1111/mec.14368. [DOI] [PubMed] [Google Scholar]
- Heer, K., Behringer, D., Piermattei, A., Bässler, C., Brandl, R., Fady, B., & Opgenoorth, L. (2018). Linking dendroecology and association genetics in natural populations: Stress responses archived in tree rings associate with SNP genotypes in silver fir (Abies alba Mill.). Molecular Ecology, 27, 1428–1438. 10.1111/mec.14538. [DOI] [PubMed] [Google Scholar]
- Hoffman, G. E. (2013). Correcting for population structure and kinship using the linear mixed model: theory and extensions. PLoS One, 8, e75707. 10.1371/journal.pone.0075707. [DOI] [PMC free article] [PubMed] [Google Scholar]
- Holliday, J. A., Ritland, K., & Aitken, S. (2010). Widespread, ecologically relevant genetic markers developed from association mapping of climate‐related traits in Sitka spruce. New Phytologist, 188, 501–514. 10.1111/j.1469-8137.2010.03380.x. [DOI] [PubMed] [Google Scholar]
- Hornoy, B., Pavy, N., Gérardi, S., Beaulieu, J., & Bousquet, J. (2015). Genetic adaptation to climate in white spruce involves small to moderate allele frequency shifts in functionally diverse genes. Genome Biology and Evolution, 7, 3269–3285. 10.1093/gbe/ew218. [DOI] [PMC free article] [PubMed] [Google Scholar]
- Housset, J. M., Nadeau, S., Isabel, N., Depardieu, C., Duchesne, I., Lenz, P., & Girardin, M. P. (2018). Tree‐rings provide a new class of phenotypes for genetic associations that foster insights into adaptation of conifers to climate change. New Phytologist, 218, 630–645. 10.1111/nph.14968. [DOI] [PMC free article] [PubMed] [Google Scholar]
- Huang, P., Chung, M. S., Ju, H. W., Na, H. S., Lee, D. J., Cheong, H. S., & Kim, C. S. (2011). Physiological characterization of the Arabidopsis thaliana oxidation‐related zinc Finger 1, a plasma membrane protein involved in oxidative stress. Journal of Plant Research, 124, 699–705. 10.1007/s10265-010-0397-3. [DOI] [PubMed] [Google Scholar]
- Jiang, C., & Zeng, Z. B. (1995). Multiple trait analysis of genetic mapping for quantitative trait loci. Genetics, 140, 1111–1127. [DOI] [PMC free article] [PubMed] [Google Scholar]
- Jones, O. R., & Wang, J. (2010). COLONY: a program for parentage and sibship inference from multilocus genotype data. Molecular Ecology Resources, 10, 551–555. 10.1111/j.1755-0998.2009.02787.x. [DOI] [PubMed] [Google Scholar]
- Joshi, R., Wani, S. H., Singh, B., Bohra, A., Dar, Z. A., Lone, A. A., Pareek, A., & Singla‐Pareek, S. L. (2016). Transcription factors and plants response to drought stress: current understanding and future directions. Frontiers in Plant Science, 7, 1029. 10.3389/fpls.2016.01029. [DOI] [PMC free article] [PubMed] [Google Scholar]
- Kang, H. M., Sul, J. H., Service, S. K., Zaitlen, N. A., Kong, S.‐Y., Freimer, N. B., Sabatti, C., & Eskin, E. (2010). Variance component model to account for sample structure in genome‐wide association studies. Nature Genetics, 42, 348–354. [DOI] [PMC free article] [PubMed] [Google Scholar]
- Kathiresan, S., Newton‐Cheh, C., & Gerszten, R. E. (2004). On the interpretation of genetic association studies. European Heart Journal, 25, 1378–1381. [DOI] [PubMed] [Google Scholar]
- Koehler, K., Center, A., & Cavender‐Bares, J. (2012). Evidence for a freezing‐growth rate trade‐off in the live oaks (Quercus series Virentes) across the tropical‐temperate divide. New Phytologist, 193, 730–744. 10.1111/j.1469-8137.2011.03992.x. [DOI] [PubMed] [Google Scholar]
- Komar, A. A. (2007). Genetics. SNPs, silent but not invisible. Science, 315, 466–467. 10.1126/science.1138239. [DOI] [PubMed] [Google Scholar]
- Konigorski, S., Yilmaz, Y. E., & Pischon, T. (2017). Comparison of single‐marker and multi‐marker tests in rare variant association studies of quantitative traits. PLoS One, 12, e0178504. 10.1371/journal.pone.0178504. [DOI] [PMC free article] [PubMed] [Google Scholar]
- Kremer, A., Ronce, O., Robledo‐Arnuncio, J. J., Guillaume, F., Bohrer, G., Nathan, R., Bridle, J. R., Gomulkiewicz, R., Klein, E. K., Ritland, K., Kuparinen, A., Gerber, S., & Schueler, S. (2012). Long‐distance gene flow and adaptation of forest trees to rapid climate change. Ecology Letters, 15, 378–392. 10.1111/j.1461-0248.2012.01746.x. [DOI] [PMC free article] [PubMed] [Google Scholar]
- Lamara, M., Raherison, E., Lenz, P., Beaulieu, J., Bousquet, J., & Mackay, J. (2016). Genetic architecture of wood properties based on association analysis and co‐expression networks in white spruce. New Phytologist, 210, 240–255. 10.1111/nph.13762 [DOI] [PMC free article] [PubMed] [Google Scholar]
- Lasky, J. R., Des Marais, D. L., Lowry, D. B., Povolotskaya, I., McKay, J., Richards, J., Keitt, T. H., & Juenger, T. E. (2014). Natural variation in abiotic stress responsive gene expression and local adaptation to climate in Arabidopsis thaliana . Molecular Biology and Ecology, 31, 2283–2296. 10.1093/molbev/msu170. [DOI] [PMC free article] [PubMed] [Google Scholar]
- Lasky, J. R., Des Marais, D. L., McKay, J. K., Richards, J. H., Juenger, T. E., & Keitt, T. H. (2012). Characterizing genomic variation of Arabidopsis thaliana: The roles of geography and climate. Molecular Ecology, 21, 5512–5529. 10.1111/j.1365-294X.2012.05709.x. [DOI] [PubMed] [Google Scholar]
- Le Corre, V., & Kremer, A. (2012). The genetic differentiation at quantitative trait loci under local adaptation. Molecular Ecology, 21, 1548–1566. 10.1111/j.1365-294X.2012.05479.x. [DOI] [PubMed] [Google Scholar]
- Le Gall, H., Philippe, F., Domon, J. M., Gillet, F., Pelloux, J., & Rayon, C. (2015). Cell wall metabolism in response to abiotic stress. Plants, 4, 112–166. 10.3390/plants4010112. [DOI] [PMC free article] [PubMed] [Google Scholar]
- Lenz, P., Auty, D., Achim, A., Beaulieu, J., & Mackay, J. (2013). Genetic improvement of white spruce mechanical wood traits – early screening by means of acoustic velocity. Forests, 4, 575–594. 10.3390/f4030575. [DOI] [Google Scholar]
- Lenz, P., Cloutier, A., Mackay, J., & Beaulieu, J. (2010). Genetic control of wood properties in Picea glauca – an analysis of trends with cambial age. Canadian Journal of Forest Research, 40, 703–715. 10.1139/X10-014. [DOI] [Google Scholar]
- Li, P., Beaulieu, J., Corriveau, A., & Bousquet, J. (1993). Genetic variation in juvenile growth and phenology in a white spruce provenance‐progeny test. Silvae Genetica, 42, 52–60. [Google Scholar]
- Lind, B. M., Friedline, C. J., Wegrzyn, J., Maloney, P. E., Vogler, D. R., Neale, D. B., & Eckert, A. J. (2017). Water availability drives signatures of local adaptation in white bark pine (Pinus albicaulis Engelm.) across finespatial scales of the Lake Tahoe Basin, USA. Molecular Ecology, 26, 3168–3185. 10.1111/mec.14106. [DOI] [PubMed] [Google Scholar]
- Lloret, F., Keeling, E. G., & Sala, A. (2011). Components of tree resilience: Effects of successive low‐growth episodes in old ponderosa pine forests. Oikos, 120, 1909–1920. 10.1111/j.1600-0706.2011.19372.x. [DOI] [Google Scholar]
- López‐Maury, L., Marguerat, S., & Bähler, J. (2008). Tuning gene expression to changing environments: from rapid responses to evolutionary adaptation. Nature Review Genetics, 9, 583–593. 10.1038/nrg2398. [DOI] [PubMed] [Google Scholar]
- Love, M. I., Huber, W., & Anders, S. (2014). Moderated estimation of fold change and dispersion for RNA‐seq data with DEseq2. Genome Biology, 15, 550. 10.1186/s13059-014-0550-8. [DOI] [PMC free article] [PubMed] [Google Scholar]
- Lu, M., Krutovsky, K. V., Nelson, C. D., West, J. B., Reily, N. A., & Loopstra, C. A. (2017). Association genetics of growth and adaptive traits in loblolly pine (Pinus teada L.) using whole‐exome‐discovered polymorphisms. Tree Genetics and Genomes, 13, 57. 10.1007/s11295-017-1140-1. [DOI] [Google Scholar]
- Luhua, S., Hegie, A., Suzuki, N., Shulaev, E., Luo, X., Cenariu, D., Ma, V., Kao, S., Lim, J., Gunay, M. B., Oosumi, T., Lee, S. C., Harper, J., Cushman, J., Gollery, M., Girke, T., Bailey‐Serres, J., Stevenson, R. A., Zhu, J.‐K., & Mittler, R. (2013). Linking genes of unknown function with abiotic stress responses by high‐throughput phenotype screening. Physiologia Plantarum, 148, 322–333. 10.1111/ppl.12013. [DOI] [PubMed] [Google Scholar]
- Luu, K., Bazin, E., & Blum, M. G. (2017). Pcadapt: an R package to perform genome scans for selection based on principal component analysis. Molecular Ecology Resources, 17, 67–77. 10.1111/1755-0998.12592. [DOI] [PubMed] [Google Scholar]
- MacLachlan, I. R., Yeaman, S., & Aitken, S. N. (2017). Growth gains from selective breeding in a spruce hybrid zone do not compromise local adaptation to climate. Evolutionary Applications, 11, 166–181. 10.1111/eva.12525. [DOI] [PMC free article] [PubMed] [Google Scholar]
- Money, D., Gardner, K. M., Migicovsky, Z., Schwaninger, H., Zhong, G. Y., & Myles, S. (2015). LinkImpute – fast and accurate genotype imputation for non‐model organisms. G3: Genes|genomes|genetics, 5, 2383. 10.1534/g3.115.021667. [DOI] [PMC free article] [PubMed] [Google Scholar]
- Moran, E., Lauder, J., Musser, C., Stathos, A., & Shu, M. (2017). The genetics of drought tolerance in conifers. New Phytologist, 216, 1034–1048. 10.1111/nph.14774. [DOI] [PubMed] [Google Scholar]
- Moser, G., Lee, S. H., Hayes, B. J., Goddard, M. E., Wray, N. R., & Visscher, P. M. (2015). Simultaneous discovery, estimation and prediction analysis of complex traits using a bayesian mixture model. PLoS Genetics, 11, e1004969. 10.1371/journal.pgen.1004969. [DOI] [PMC free article] [PubMed] [Google Scholar]
- Muchero, W., Sondreli, K. L., Chen, J.‐G., Urbanowicz, B. R., Zhang, J., Singan, V., Yang, Y., Brueggeman, R. S., Franco‐Coronado, J., Abraham, N., Yang, J.‐Y., Moremen, K. W., Weisberg, A. J., Chang, J. H., Lindquist, E., Barry, K., Ranjan, P., Jawdy, S., Schmutz, J., … LeBoldus, J. M. (2018). Association mapping, transcriptomics, and transient expression identify candidate genes mediating plant–pathogen interactions in a tree. Proceedings of the National Academy of Sciences, 115(45), 11573–11578. 10.1073/pnas.1804428115 [DOI] [PMC free article] [PubMed] [Google Scholar]
- Namroud, M.‐C., Beaulieu, J., Juge, N., Laroche, J., & Bousquet, J. (2008). Scanning the genome for gene single nucleotide polymorphisms involved in adaptive population differentiation in white spruce. Molecular Ecology, 17, 3599–3613. 10.1111/j.1365-294X.2008.03840.x. [DOI] [PMC free article] [PubMed] [Google Scholar]
- Oksanen, J., Kindt, R., Legendre, P., O'Hara, B., Henry, M., & Stevens, H. (2007). The Vegan Package. https://cran.r‐project.org/web/packages/vegan/index.html
- Pavy, N., Deschênes, A., Blais, S., Lavigne, P., Beaulieu, J., Isabel, N., & Bousquet, J. (2013). The landscape of nucleotide polymorphisms among 13,500 genes of the conifer Picea glauca, relationships with functions, and comparison with Medicago truncatula . Genome Biology and Evolution, 5, 1910–1925. 10.1093/gbe/evt143. [DOI] [PMC free article] [PubMed] [Google Scholar]
- Pavy, N., Gagnon, F., Rigault, P., Blais, S., Deschênes, A., Boyle, B., & Bousquet, J. (2013). Development of high‐density SNP genotyping arrays for white spruce (Picea glauca) and transferability to subtropical and nordic congeners. Molecular Ecology Resources, 13, 324–336. 10.1111/1755-0998.12062. [DOI] [PubMed] [Google Scholar]
- Pavy, N., Lamothe, M., Pelgas, B., Gagnon, F., Birol, I., Bohlmann, J., & Bousquet, J. (2017). A high resolution reference genetic map positioning 8.8 K genes for the conifer white spruce: structural genomics implications and correspondence with physical distance. The Plant Journal, 90, 189–203. 10.1111/tpj.13478. [DOI] [PubMed] [Google Scholar]
- Pavy, N., Namroud, M.‐C., Gagnon, F., Isabel, I., & Bousquet, J. (2012). The heterogenous levels of linkage disequilibrium in white spruce genes and comparative analysis with other conifers. Heredity, 108, 273–284. 10.1038/hdy.2011.72. [DOI] [PMC free article] [PubMed] [Google Scholar]
- Pavy, N., Pelgas, B., Beauseigle, S., Blais, S., Gagnon, F., Gosselin, I., Lamothe, M., Isabel, N., & Bousquet, J. (2008). Enhancing genetic mapping of complex genomes through the design of highly‐multiplexed SNP arrays: application to the large and unsequenced genomes of white spruce and black spruce. BMC Genomics, 9, 21. [DOI] [PMC free article] [PubMed] [Google Scholar]
- Pavy, N., Pelgas, B., Laroche, J., Rigault, P., Isabel, N., & Bousquet, J. (2012). A spruce gene map infers ancient plant genome reshuffling and subsequent slow evolution in the gymnosperm lineage leading to extant conifers. BMC Biology, 10, 1–19. [DOI] [PMC free article] [PubMed] [Google Scholar]
- Pelgas, B., Bousquet, J., Meirmans, P. G., Ritland, K., & Isabel, N. (2011). QTL mapping in white spruce: gene maps and genomic regions underlying adaptive traits across pedigrees, years and environments. BMC Genomics, 12, 145. 10.1186/1471-2164-12-145. [DOI] [PMC free article] [PubMed] [Google Scholar]
- Perdiguero, P., Collada, C., Barbero Mdel, C., García Casado, G., Cervera, M. T., & Soto, A. (2012). Identification of water stress genes in Pinus pinaster Ait. by controlled progressive stress and suppression subtractive hybridization. Plant Physiology and Biochemistry, 50, 44–53. 10.1016/j.plaphy.2011.09.022. [DOI] [PubMed] [Google Scholar]
- Pfeifer, S. P., Laurent, S., Sousa, V. C., Linnen, C. R., Foll, M., Excoffier, L., Hoekstra, H. E., & Jensen, J. D. (2018). The evolutionary history of Nebraska deer mice: local adaptation in the face of strong gene flow. Molecular Biology and Evolution, 35, 792–806. 10.1093/molbev/msy004. [DOI] [PMC free article] [PubMed] [Google Scholar]
- Plomion, C., Bartholomé, J., Bouffier, L., Brendel, O., Cochard, H., De Miguel, M., Delzon, S., Gion, J.‐M., Gonzalez‐Martinez, S. C., Guehl, J.‐M., Lagraulet, H., Le Provost, G., Marguerit, E., & Porté, A. (2016). Understanding the genetic bases of adaptation to soil water deficit in trees through the examination of water use efficiency and cavitation resistance: maritime pine as a case study. Journal of Plant Hydraulics, 3, e008. 10.20870/jph.2016.e008. [DOI] [Google Scholar]
- Plummer, M., Best, N., Cowles, K., & Vines, K. (2006). CODA: Convergence diagnosis and output analysis for MCMC. R News, 6, 7–11. [Google Scholar]
- Polle, A., Chen, S. L., Eckert, C., & Harfouche, A. (2019). Engineering drought resistance in forest trees. Frontiers in Plant Science, 9, 1875. 10.3389/fpls.2018.01875. [DOI] [PMC free article] [PubMed] [Google Scholar]
- Price, A. L., Zaitlen, N. A., Reich, D., & Patterson, N. (2010). New approaches to population stratification in genome‐wide association studies. Nature Reviews Genetics, 11, 459–463. 10.1038/nrg2813. [DOI] [PMC free article] [PubMed] [Google Scholar]
- Prunier, J., Pelgas, B., Gagnon, F., Desponts, M., Isabel, N., Beaulieu, J., & Bousquet, J. (2013). The genomic architecture and association genetics of adaptive characters using a candidate SNP approach in black spruce. BMC Genomics, 14, 368. [DOI] [PMC free article] [PubMed] [Google Scholar]
- Prunier, J., Tessier, G., Bousquet, J., & Mackay, J. (2015). From genotypes to phenotypes: expression levels of genes encompassing adaptive SNPs in black spruce. Plant Cell Reports, 34, 2111–2125. 10.1007/s00299-015-1855-0. [DOI] [PubMed] [Google Scholar]
- R Core Team . (2018). R: A Language and Environment for Statistical Computing. R Foundation for Statistical Computing, Vienna. https://www.R‐project.org.
- Rellstab, C., Gugerli, F., Eckert, A. J., Hancock, A. M., & Holderegger, R. (2015). A practical guide to environmental association analysis in landscape genomics. Molecular Ecology, 24, 4348–4370. 10.1111/mec.13322. [DOI] [PubMed] [Google Scholar]
- Rigault, P., Boyle, B., Lepage, P., Cooke, J. E., Bousquet, J., & Mackay, J. (2011). A white spruce gene catalog for conifer genome analyses. Plant Physiology, 157, 14–28. 10.1104/pp.111.179663. [DOI] [PMC free article] [PubMed] [Google Scholar]
- Sáenz‐Romero, C., Kremer, A., Nagy, L., Újvári‐Jármay, É., Ducousso, A., Kóczán‐Horváth, A., & Mátyás, C. (2019). Common garden comparisons confirm inherited differences in sensitivity to climate change between tree species. Peer Journal, 7, e6213. 10.7717/peerj.6213. [DOI] [PMC free article] [PubMed] [Google Scholar]
- Sharma, M., & Pandey, G. (2016). Expansion and function of repeat domain proteins during stress and development in plants. Frontiers in Plant Science, 11, 1218. 10.3389/fpls.2015.01218. [DOI] [PMC free article] [PubMed] [Google Scholar]
- Shaw, R. G., & Etterson, J. R. (2012). Rapid climate change and the rate of adaptation: insight from experimental quantitative genetics. New Phytologist, 195, 752–765. 10.1111/j.1469-8137.2012.04230.x. [DOI] [PubMed] [Google Scholar]
- Signor, S. A., & Nuzhdin, S. V. (2018). The evolution of gene expression in cis and trans . Trends Genetics, 34, 532–544. 10.1016/j.tig.2018.03.007. [DOI] [PMC free article] [PubMed] [Google Scholar]
- Sork, V. L. (2018). Genomic studies of local adaptation in natural populations. Journal of Heredity, 109, 3–15. 10.1093/jhered/esx091. [DOI] [PubMed] [Google Scholar]
- Sork, V. L., Aitken, S. N., Dyer, R. J., Eckert, A. J., Legendre, P., & Neale, D. B. (2013). Putting the landscape into the genomics of trees: approaches for understanding local adaptation and population responses to changing climate. Tree Genetics and Genomes, 9, 901–911. 10.1007/s11295-013-0596-x. [DOI] [Google Scholar]
- Spies, D., Renz, P. F., Beyer, T. A., & Ciaudo, C. (2019). Comparative analysis of differential gene expression tools for RNA sequencing time course data. Briefings in Bioinformatics, 20, 288–298. 10.1093/bib/bbx115. [DOI] [PMC free article] [PubMed] [Google Scholar]
- Stival Sena, J., Giguère, I., Rigault, P., Bousquet, J., & Mackay, J. (2018). Expansion of the dehydrin family in the Pinaceae is associated with considerable structural diversity and drought‐responsive expression. Tree Physiology, 38, 442–456. 10.1093/treephys/tpx125. [DOI] [PubMed] [Google Scholar]
- Swindell, W. R., Huebner, M., & Weber, A. (2007). Plastic and adaptive gene expression patterns associated with temperature stress in Arabidopsis thaliana . Heredity, 99, 143–150. 10.1038/sj.hdy.6800975. [DOI] [PubMed] [Google Scholar]
- Talbot, B., Chen, T.‐W., Zimmerman, S., Joost, S., Eckert, A. J., Crow, T. M., Semizer‐Cuming, D., Seshadri, C., & Manel, S. (2017). Combining genotype, phenotype, and environment to infer potential candidate genes. Journal of Heredity, 108, 207–216. 10.1093/jhered/esw077. [DOI] [PubMed] [Google Scholar]
- Trujillo‐Moya, C., George, J.‐P., Fluch, S., Geburek, T., Grabner, M., Karanitsch‐Ackerl, S., Konrad, H., Mayer, K., Sehr, E. M., Wischnitzki, E., & Schueler, S. (2018). Drought sensitivity of Norway spruce at the species, warmest fringe: quantitative and molecular analysis reveals high genetic variation among and within provenances. Genes, Genomes, Genetics, 8, 1225–1245. 10.1534/g3.117.300524. [DOI] [PMC free article] [PubMed] [Google Scholar]
- Vangestel, C., Eckert, A. J., Wegrzyn, J. L., St Clair, J. B., & Neale, D. B. (2018). Linking phenotype, genotype and environment to unravel genetic components underlying cold hardiness in coastal Douglas‐fir (Pseudotsuga menziesii var. menziesii). Tree Genetics and Genomes, 14, 1828–1842. 10.1007/s11295-017-1225-x. [DOI] [Google Scholar]
- Wang, J., & Santure, A. W. (2009). Parentage and sibship inference from multilocus genotype data under polygamy. Genetics, 181, 1579–1594. 10.1534/genetics.108.100214. [DOI] [PMC free article] [PubMed] [Google Scholar]
- Wolak, M. E. (2012). Nadiv: an R package to create relatedness matrices for estimating non‐additive genetic variances in animal models. Methods in Ecology and Evolution, 3, 792–796. [Google Scholar]
- Wu, Q., Hu, Y., Sprague, S. A., Kakeshpour, T., Park, J., Nakata, P. A., Cheng, N., Hirschi, K. D., White, F. F., & Park, S. (2017). Expression of a monothiol glutaredoxin, AtGRXS17, in tomato (Solanum lycopersicum) enhances drought tolerance. Biochemical and Biophysical Research Communications, 491, 1034–1039. 10.1016/j.bbrc.2017.08.006. [DOI] [PubMed] [Google Scholar]
- Zeltins, P., Katrevics, J., Gailis, A., Maaten, T., Baders, E., & Jansons, A. (2018). Effect of stem diameter, genetics, and wood properties on stem cracking in Norway Spruce. Forests, 9, 546. 10.3390/f9090546. [DOI] [Google Scholar]
- Zhou, X., Carbonetto, P., & Stephens, M. (2013). Polygenic modeling with Bayesian sparse linear mixed models. PLoS Genetics, 9, e1003264. 10.1371/journal.pgen.1003264. [DOI] [PMC free article] [PubMed] [Google Scholar]
- Zhou, X., & Stephens, M. (2012). Genome‐wide efficient mixed‐model analysis for association studies. Nature Genetics, 44, 821–824. 10.1038/ng.2310. [DOI] [PMC free article] [PubMed] [Google Scholar]
Associated Data
This section collects any data citations, data availability statements, or supplementary materials included in this article.
Supplementary Materials
Supplementary Material
Table S3
Table S10
Data Availability Statement
The original phenotypic data are part of the network of the Natural Resources Canada white spruce genecological tests, and have been stored in our institution's database (https://treesource.rncan.gc.ca). Full access can be shared upon request to the corresponding author according to the intellectual property policies (IPP) of participating governmental institutions. Genotyping data are accessible through the Dryad Digital Repository (https://doi.org/10.5061/dryad.6rd6f). The data and R scripts used in the present study are available on the Github website (https://github.com/ClaireDepardieu/Genetic_basis_drought). The raw transcriptomic data were deposited in the European Nucleotide Archive (ENA) as part of the study SRP134160, bioproject PRJNA437248 (SRA accession nos. SRR6816977 to SRR6816983).