

Abstract
Introduction
Chronic kidney disease (CKD) is a significant global health issue. As the prevalence of renal replacement therapy (RRT) in Thailand is increasing, early detection and management of CKD is the most important step to prevent CKD progression and the need for RRT. Current diagnostic tests for CKD are non‐specific and expensive. We aimed to develop and validate antibody‐based‐albumin point‐of‐care testing (POCT) to detect patients with impaired kidney function at early stage.
Methods
The prototype strip test was developed under the concept of competitive lateral flow immunochromatography assay, or strip test. Monoclonal antibodies (MAbs) to human serum albumin (HSA) were harvested from the hybridomas of spleen cells from immunized mice and mouse myeloma cells. Presence of MAbs was detected by enzyme‐linked immunosorbent assay (ELISA). Spot urine was obtained from patients with kidney disease, type I, or type II Diabetes Mellitus upon their visit at King Chulalongkorn Memorial Hospital during 2018–2019. All samples were analyzed for urine albumin with our POCT (CU microalbumin) and the other two commercial POCTs (Microalbu PHAN and MICRAL). The results were validated against standard method for urine microalbumin measurement. A urine microalbumin concentration of less than 20 ug/ml was defined as normal. The sensitivity, specificity, and predictive values were calculated in comparison with the standard laboratory method.
Result
A total of 100 adult patients were included. CU microalbumin had a sensitivity of 86%, a specificity of 94%, and a positive predictive value of 96%. Our POCT showed good correlation with the laboratory results.
Conclusion
CU microalbumin correlated well with the standard method for quantitative measurement of urine albumin. Therefore, it has the potential for early screening of CKD, especially in primary health care facilities in resource limited settings.
Keywords: chronic kidney disease, microalbuminuria, monoclonal antibody to albumin, point‐of‐care testing, urine strip test
1. INTRODUCTION
The prevalence of chronic kidney disease (CKD) is increasing worldwide. 1 , 2 Accordingly, the number of patients with end‐stage renal disease (ESRD) who need renal replacement therapy (RRT) has risen. In the United States, chronic kidney disease is one of the 10 leading causes of premature mortality. 2
According to the population‐based Thai Screening and Early Evaluation of Kidney Disease (Thai‐SEEK) study, 3 the prevalence of CKD at any stage was about 17.5%. This number was much higher than the prevalence mentioned in other previous publications. However, less than 2% of the Thai general population in this study were aware that they had CKD. 3 The unawareness and limited accessibility to laboratory services, especially in remote areas, might cause underestimation of the prevalence. In addition, progressive increase in prevalence of patients on RRT was noted. 4 Impaired kidney function adversely affects not only health outcomes or quality of life but is also a burden on public health expenditure. The cost of RRT is 10 times more expensive than the cost of CKD care or other metabolic diseases. Allocation of health budget in Thailand has to be diverted to the treatment of ESRD patients rather than to prevent kidney failure and its complications. 5 Therefore, early detection of impaired kidney function is a prerequisite and urgently need for prevention of CKD progression in resource limited countries, especially in Thailand.
Microalbuminuria is an earlier biomarker for kidney damage and also a prognostic factor for CKD outcome. 6 Current technologies such as fluorescence immunoassays, high‐performance liquid chromatography, immunonephelometry and radioimmunoassay have been developed. 7 However, most of these technologies require well‐equipped labs with sophisticated equipment, well‐trained personnel to operate the machine and is time consuming. Thus, there is an urgent need for point‐of‐care test (POCT) platforms that can quantitatively/semi‐quantitatively detect microalbuminuria in relevant settings.
Currently, only few low‐cost POCTs are available in Thailand. The commercial tools such as Microalbu PHAN® and Micral‐Test® strips, have not been widely used and the cost is too expensive for developing countries to implement to the primary health care setting. Moreover, measuring principle of these tests is based on a chromogenic color indicator which can be easily misinterpreted.
In this study, we developed and validated point‐of‐care testing (POCT) for urine albumin based on immunoassay method (antibody‐based‐albumin POCT).
2. MATERIALS AND METHODS
2.1. Development of the antibody‐albumin POCT
2.1.1. Ethics statement
The protocol of this study was approved by The Institutional Review Board committee, Faculty of Medicine, Chulalongkorn University, Bangkok Thailand (COA No. 971/2017 and IRB No. 543/60). Written informed consent was obtained from each participant prior to enrollment.
2.1.2. Preparation of monoclonal antibody
Female BALB/c mice were immunized thrice at 2‐week interval with 50 µg human serum albumin (HSA) mixed with Freund's incomplete adjuvant (FIA) in proportion of 1:1 (v/v). One week after the last immunization, spleen cells were obtained and fused with SP2/0‐Ag14 myeloma cells from The Institute of Biotechnology and Genetic Engineering Chulalongkorn University, following conventional methods for the generation of monoclonal antibodies (MAbs). 8 , 9 The levels of antibodies were measured by the enzyme‐linked immunosorbent assay (ELISA; Table 1).
TABLE 1.
Concentration of monoclonal antibody solutions (10 clones)
| Number | Clone number | Code | Concentration of monoclonal antibody solutions (ug/ml) |
|---|---|---|---|
| 1 | 1 | 4/B11/G3/B7/G12 | 54 |
| 2 | 2 | 4/B11/G3/F3/H2 | 52 |
| 3 | 4 a | 11/E12/D10/A3/G3 | 56 |
| 4 | 5 | 11/E12/D10/G6/C12 | 70 |
| 5 | 6 | 6/D1/D1/E3/G10 | 12 |
| 6 | 7 | 6/D1/G1/E7/G5 | 34 |
| 7 | 8 | 6/D2/D6/C11/A2 | 48 |
| 8 | 9 | 6/D2/D6/G11/A8 | 56 |
| 9 | 10 | 4/B11/G3/H11/D11 | 20 |
| 10 | 11 | 4/B11/G3/E12/E5 | 10 |
No clone number 3.
2.1.3. Specific indirect elisa assay
To detect Mabs, a 96‐well plate was coated with 1 ng/well of human albumin and incubated at 4°C overnight. The wells were washed three times with washing buffer (phosphate buffer solution containing 0.1% Tween‐20, PBST [Thermo Fisher scientific, USA]). Then, PBST 100 µl and MAb supernatants (1:500) 100 µl were added into each well and incubated at 37°C for 1 h. The wells were again washed three times with the washing buffer before adding secondary antibody (Sigma‐Aldrich, Missouri, USA) (1:3000). The plate was then incubated at 37°C for 1 h and washed three times with the washing buffer. The substrate o‐phenylenediamine in the presence of peroxide, OPD‐H2O2 (Sigma‐Aldrich, Missouri, USA) of 100 µl/well was added. The plate was further incubated at room temperature for 20 min in the dark. To stop the enzyme‐substrate reaction, 50 µl of 2 M sulfuric acid was added. The MultiskanTM GO micro plate reader (Thermo Fisher Scientific, Massachusetts, USA) was used to measure the absorbance at 492 nm.
2.1.4. Isotyping of Mab
Mouse monoclonal antibody isotyping test kit (Bio‐RAD, USA) was applied for determining the class and subclass of MAb. Each development tube was filled with 150 µl of 1 µg/ml Mab, incubated at room temperature for 30 s, and briefly vortexed. One isotyping strip, with the solid red end at the bottom, was placed into each development tube. A presence of blue bands in the two sections of the strip within 10 min would be corresponding to the isotype of MAb and its light chain.
2.1.5. Affinity and kinetic measurement
The affinity and kinetic of Mab binding to HSA was determined by BiacoreTM T200 (GE Healthcare life sciences, Illinois, USA), a Surface Plasmon Resonance instrument. HBS‐EP+ (GE Healthcare life sciences, Illinois, USA) was used as a system running buffer. Goat anti‐mouse IgG1 (Sigma‐Aldrich, Missouri, USA) was immobilized on the surface of the Protein G sensor chip (GE Healthcare life sciences, Illinois, USA). All ten clones of MAbs (ligand) were diluted to the concentration of 3 µg/ml with running buffer. A concentration of 20 nM and 320 nM of HSA (analyte) was injected with a flow rate of 30 µl/min for 30 s. The protein G sensor chip surface was regenerated with 10 mM Glycine HCl pH 1.5 (GE Healthcare life sciences, USA). The results were analyzed with BIAcore T200 evaluation software version 3.1 (GE Healthcare life sciences, USA).
2.1.6. Protein purification
Purification of albumin in the urine was performed by affinity chromatography on Hi TrapTM Blue HP column (GE Healthcare life sciences, Illinois, USA). 50 mM KH2PO4, pH 7.0, was used as a system binding buffer. All samples were applied at a flow rate of 1 ml/min. After washing the samples with PBST, the system was eluted manually with 50 mM KH2PO4, 1.5 M KCl, pH 7.0 at a flow rate of 1 ml/min. The urine samples were analyzed for proteins by using a UV spectrophotometer (measurement of the absorbance 280 and 214 nm).
2.1.7. Preparation of antibody‐conjugated gold nanoparticles
To detect microalbumin in urine, colloidal gold 40 nm was conjugated with Mab. The mixture was used as the detecting agent. First, a colloidal gold solution at pH 8.0 was stabilized with 200 mM potassium carbonate. Then, MAb (3 µg/ml) was added to the colloidal gold solution (pH 8.0). After gently stirring the mixture for 10 min at room temperature, 1% (w/v) Casein was added and the mixture was incubated at 2–8°C overnight. The conjugated mixture was centrifuged at 12,000 rpm for 30 min. The pellet was resuspended in a conjugate storage buffer. The gold particles were then mixed with a 10% (w/v) sucrose solution and 5% trehalose. The mixture was subsequently sprayed on the conjugated pad at the distribution of 10 µl/cm.
2.1.8. Strip test interpretation
The prototype strip test was developed under the concept of competitive binding of albumin at the test line (T‐line) and albumin in the urine to the anti‐albumin Mab—gold conjugate. The specimen at the control line (C‐line) was goat anti‐mouse antibodies. If there was albumin in the sample, the gold—anti‐albumin Mab conjugate would bind to the albumin in the sample instead of albumin at the T‐line. As a result, this antibody‐based POCT would be interpreted positive when the signal (red band) shown only at the C‐line. A negative result for microalbumin would be when 2 red bands were shown at T‐line and C‐line. The red band must always appear on the C‐line for reliable interpretation.
2.2. Validation of the antibody‐based‐albumin POCT
2.2.1. Urine samples collection
Twenty milliliters (20 ml) of the morning midstream or spot urine were collected from 100 samples such as 54 samples of CKD who were diagnosed as kidney injury following Kidney Disease: Improving Global Outcomes (KDIGO) guideline 2012 6 aged in range from 21–88 years, 8 samples of AKI patients age ranged from 29–83 years, 10 samples of type I or II Diabetes Mellitus (DM) for at least 5 years age ranged from 22–78 years, and 28 healthy for control group age ranged from 24–86 years, upon their visit at King Chulalongkorn Memorial Hospital during September 2018 to November 2019. All patients were adults who were at least 18 years of age. After mixing each urine sample by inversion, 100 µl of the sample was pipetted to the sample pad of the Microalbumin Test Kits. The results were read 15 min thereafter.
CU microalbumin, the other two commercial POCTs (MicroalbuPHAN® and Micral‐Test®), and the standard method for urine albumin measurement were concurrently measured.
Turbidimetric immunoassay is the gold standard for the detection of microalbuminuria. This technique is a type of immunoassay based on the measurement of antigen‐antibody formation, which is directly related to the concentration of antigen in the mixture. All strip tests were repeated thrice for more reliability. The standard urine microalbumin assay was regarded as a gold standard. A urine microalbumin of more than 20 ug/ml indicated an abnormality and the presence of microalbuminuria. 10 Figure 1 shows a diagram of a test strip with a top‐view of its components and demonstrates the principle of a competitive strip test assay to detect microalbuminuria.
FIGURE 1.
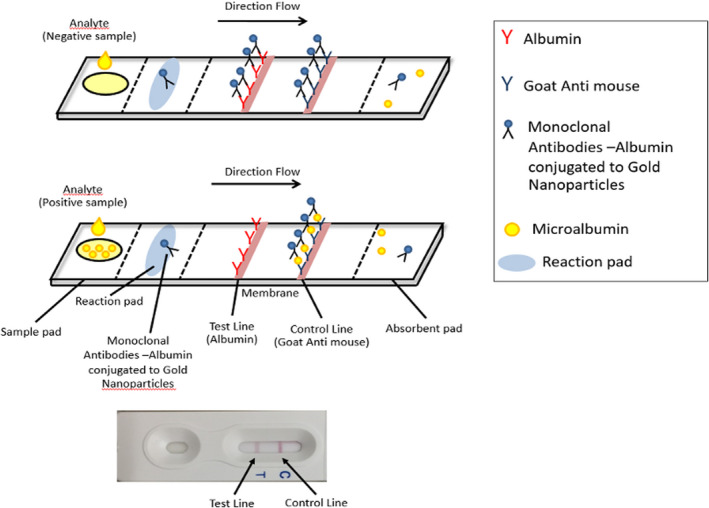
Diagram of a test strip showing a top‐view of its components and principle of a competitive strip test assay with microalbuminuria
2.3. Statistical analysis
Sensitivity, specificity, positive predictive value (PPV), negative predictive value (NPV) and diagnostic accuracy were calculated and corrected with 95% confidence interval of the diagnostic methods using Diagnostic test MedCalc Software.
3. RESULTS
The concentration of MAbs in each clone are demonstrated in Table 1. All harvested MAbs consisted of immunoglobulin G1 (IgG1) subclass with kappa light chain. The kinetic studies of the reaction between MAbs and HSA are demonstrated in Table 2. The MAbs from the clone number 4,5,8,9 showed a lower dissociation constant (K D) value than the others, reflecting higher affinity of the antibodies. The clone number 4 was applied for our antibody‐based POCT development, as it showed the best sensitivity and specificity to the presence of microalbuminuria by ELISA.
TABLE 2.
Kinetics of the reaction between McAbs and HSA
| Clone number | Code | Ka (1/MS) | Kd (1/s) | KD (M) | χ 2 | U‐value |
|---|---|---|---|---|---|---|
| 1 | 4/B11/G3/B7/G12 | 7.48 × 10⁴ | 0.0091 | 122.00 nM | 0.12 | 1 |
| 2 | 4/B11/G3/F3/H2 | 7.51 × 10⁴ | 0.0089 | 118.00 nM | 0.19 | 1 |
| 4 | 11/E12/D10/A3/G3 | 1.04 × 10⁵ | 0.0024 | 22.90 nM | 1.05 | 1 |
| 5 | 11/E12/D10/G6/C12 | 8.28 × 10⁴ | 0.0025 | 30.00 nM | 0.63 | 1 |
| 6 | 6/D1/D1/E3/G10 | 1.32 × 10⁴ | 0.0014 | 121.00 nM | 0.01 | 2 |
| 8 a | 6/D2/D6/C11/A2 | 1.10 × 10⁵ | 0.0011 | 10.43 nM | 2.57 | 2 |
| 9 | 6/D2/D6/G11/A8 | 1.09 × 10⁵ | 0.0011 | 10.41 nM | 1.85 | 2 |
| 10 | 4/B11/G3/H11/D11 | 7.28 × 10⁴ | 0.0090 | 123.00 nM | 0.22 | 1 |
| 11 | 4/B11/G3/E12/E5 | 5.25 × 10n | 0.0090 | 172.00 nM | 0.15 | 1 |
Clone number 7 did not bind to albumin.
A total of 100 urine samples were included in the analysis. Participant characteristics are shown in Table S1. The median level of microalbuminuria was 45.5 [12.48, 407.8] µg/ml by laboratory‐measured urine microalbumin concentration. The results of microalbuminuria interpreted by the other three readers are shown in Table 3. Figure 2 shows interpretation of the results detected by the CU microalbumin test.
TABLE 3.
Data interpretation of urine microalbumin performed by each POCT
| Samples | Microalbumin | Results | ||||||||
|---|---|---|---|---|---|---|---|---|---|---|
| ug/ml | CU microalbumin | Microalbu Phan | MICRAL | |||||||
| reader1 | reader2 | reader3 | reader1 | reader2 | reader3 | reader1 | reader2 | reader3 | ||
| 1 | 16.2 | TN | TN | TN | TN | TN | FP | TN | TN | TN |
| 2 | 79.3 | TP | TP | TP | TP | TP | TP | TP | TP | TP |
| 3 | 315.4 | TP | TP | TP | TP | TP | TP | TP | TP | TP |
| 4 | 360.2 | TP | TP | TP | TP | TP | TP | TP | TP | TP |
| 5 | 13.8 | FP | FP | FP | FP | TN | FP | TN | TN | FP |
| 6 | 919.5 | TP | TP | TP | TP | TP | TP | TP | TP | TP |
| 7 | 168.6 | TP | TP | TP | TP | TP | TP | TP | TP | TP |
| 8 | 1.8 | TN | TN | TN | TN | TN | TN | TN | TN | TN |
| 9 | 718.9 | TP | TP | TP | TP | TP | TP | TP | TP | TP |
| 10 | 55.1 | TP | TP | TP | TP | TP | TP | TP | TP | TP |
| 11 | 2194.8 | TP | TP | TP | TP | TP | TP | TP | TP | TP |
| 12 | 65.5 | TP | TP | TP | TP | TP | TP | TP | TP | TP |
| 13 | 483.2 | TP | TP | TP | TP | TP | TP | TP | TP | TP |
| 14 | 92.8 | TP | TP | TP | TP | TP | TP | TP | TP | TP |
| 15 | 22.5 | TP | TP | TP | FN | FN | FN | TP | TP | TP |
| 16 | <5 | TN | TN | TN | TN | TN | FP | TN | TN | TN |
| 17 | <5 | TN | TN | TN | TN | TN | TN | TN | TN | TN |
| 18 | 25.7 | TP | TP | TP | TP | FN | TP | TP | TP | TP |
| 19 | 826.2 | TP | TP | TP | TP | TP | TP | TP | TP | TP |
| 20 | 33.8 | TP | TP | TP | TP | TP | TP | TP | TP | TP |
| 21 | 33 | FN | FN | FN | TP | TP | TP | TP | TP | TP |
| 22 | 12.3 | TN | TN | TN | TN | TN | TN | TN | FP | FP |
| 23 | 241.8 | TP | TP | TP | TP | TP | TP | TP | TP | TP |
| 24 | <5 | TN | TN | TN | TN | TN | FP | FP | FP | FP |
| 25 | 764.1 | TP | TP | TP | TP | TP | TP | TP | TP | TP |
| 26 | 10.1 | TN | TN | TN | TN | TN | FP | FP | FP | FP |
| 27 | 24.4 | FN | FN | FN | TP | TP | TP | TP | TP | TP |
| 28 | 5016.7 | TP | TP | TP | TP | TP | TP | TP | TP | TP |
| 29 | 37.1 | TP | TP | TP | FN | TP | FN | TP | TP | TP |
| 30 | 961.8 | TP | TP | TP | TP | TP | TP | TP | TP | TP |
| 31 | 1589.7 | TP | TP | TP | TP | TP | TP | TP | TP | TP |
| 32 | 62.7 | TP | TP | TP | TP | TP | TP | TP | TP | TP |
| 33 | 726.2 | TP | TP | TP | TP | TP | TP | TP | TP | TP |
| 34 | 42.1 | TP | TP | TP | TP | TP | TP | TP | TP | TP |
| 35 | <5 | TN | TN | TN | TN | TN | TN | TN | TN | TN |
| 36 | <0.5 | TN | TN | TN | TN | TN | TN | TN | TN | TN |
| 37 | 88 | TP | TP | TP | TP | TP | TP | TP | TP | TP |
| 38 | 190 | TP | TP | TP | TP | TP | TP | TP | TP | TP |
| 39 | 11 | TN | TN | TN | FP | TN | FP | TN | TN | TN |
| 40 | <5 | TN | TN | TN | TN | TN | TN | TN | TN | FP |
| 41 | 696 | TP | TP | TP | TP | TP | TP | TP | TP | TP |
| 42 | 19 | FP | FP | FP | TN | TN | TN | TN | FP | FP |
| 43 | 65 | TP | FN | TP | TP | TP | TP | TP | TP | TP |
| 44 | 1108 | TP | TP | TP | TP | TP | TP | TP | TP | TP |
| 45 | 11 | TN | TN | TN | FP | FP | FP | TN | FP | FP |
| 46 | 13 | TN | TN | TN | FP | FP | FP | TN | FP | FP |
| 47 | 6170 | TP | TP | TP | TP | TP | TP | TP | TP | TP |
| 48 | 24 | FN | FN | FN | TP | TP | TP | TP | TP | TP |
| 49 | 9 | TN | TN | TN | TN | TN | TN | TN | TN | FP |
| 50 | 22 | FN | FN | FN | TP | TP | TP | TP | TP | TP |
| 51 | 10 | TN | TN | TN | TN | TN | TN | TN | FP | FP |
| 52 | 750 | TP | TP | TP | TP | TP | TP | TP | TP | TP |
| 53 | 455 | TP | TP | TP | TP | TP | TP | TP | TP | TP |
| 54 | 415 | TP | TP | TP | TP | TP | TP | TP | TP | TP |
| 55 | 687 | TP | TP | TP | TP | TP | TP | TP | TP | TP |
| 56 | 47 | TP | FN | TP | TP | TP | TP | TP | TP | TP |
| 57 | 14 | TN | TN | TN | TN | TN | TN | TN | TN | TN |
| 58 | 754 | TP | TP | TP | TP | TP | TP | TP | TP | TP |
| 59 | 9 | TN | TN | TN | TN | TN | TN | FP | FP | FP |
| 60 | 1990 | TP | TP | TP | TP | TP | TP | TP | TP | TP |
| 61 | 436 | TP | TP | TP | TP | TP | TP | TP | TP | TP |
| 62 | 16 | TN | TN | TN | FP | FP | FP | TN | TN | TN |
| 63 | 22 | FN | FN | FN | TP | TP | TP | TP | TP | TP |
| 64 | 33 | FN | FN | FN | FN | FN | FN | FN | FN | FN |
| 65 | <5 | TN | TN | TN | TN | TN | TN | TN | TN | FP |
| 66 | <5 | TN | TN | TN | TN | TN | TN | TN | TN | TN |
| 67 | 10 | TN | TN | TN | TN | FP | FP | FP | FP | FP |
| 68 | 14 | TN | TN | TN | FP | FP | FP | FP | FP | FP |
| 69 | 210 | TP | TP | TP | TP | TP | TP | TP | TP | TP |
| 70 | 190 | TP | TP | TP | TP | TP | TP | TP | TP | TP |
| 71 | 7 | TN | TN | TN | TN | TN | TN | TN | TN | TN |
| 72 | 80 | TP | TP | TP | TP | TP | TP | TP | TP | TP |
| 73 | 131 | TP | TP | TP | TP | TP | TP | TP | TP | TP |
| 74 | 18 | TN | TN | TN | FP | FP | FP | FP | FP | FP |
| 75 | 114 | TP | TP | TP | TP | TP | TP | TP | TP | TP |
| 76 | <5 | TN | TN | TN | TN | TN | TN | TN | TN | TN |
| 77 | <5 | TN | TN | TN | TN | TN | TN | TN | TN | TN |
| 78 | 220 | TP | TP | TP | TP | TP | TP | TP | TP | TP |
| 79 | 11 | TN | TN | TN | FP | TN | FP | FP | FP | FP |
| 80 | 10 | TN | TN | TN | FP | TN | FP | FP | FP | FP |
| 81 | 829 | TP | TP | TP | TP | TP | TP | TP | TP | TP |
| 82 | 793 | TP | TP | TP | TP | TP | TP | TP | TP | TP |
| 83 | 199 | TP | TP | TP | TP | TP | TP | TP | TP | TP |
| 84 | 40 | FN | FN | FN | TP | TP | TP | TP | TP | TP |
| 85 | 44 | TP | FN | FN | TP | TP | TP | TP | TP | TP |
| 86 | 7 | TN | TN | TN | FP | TN | FP | TN | TN | FP |
| 87 | 57 | TP | TP | TP | TP | TP | TP | TP | TP | TP |
| 88 | 110 | TP | TP | TP | TP | TP | TP | TP | TP | TP |
| 89 | 44 | FN | FN | FN | TP | TP | TP | TP | TP | TP |
| 90 | 2580 | TP | TP | TP | TP | TP | TP | TP | TP | TP |
| 91 | 386 | TP | TP | TP | TP | TP | TP | TP | TP | TP |
| 92 | 24 | FN | FN | FN | FN | TP | TP | TP | TP | TP |
| 93 | 1228 | TP | TP | TP | TP | TP | TP | TP | TP | TP |
| 94 | 17 | TN | TN | TN | FP | FP | FP | TN | TN | TN |
| 95 | 107 | TP | TP | TP | TP | TP | TP | TP | TP | TP |
| 96 | 8 | TN | TN | TN | FP | FP | FP | TN | TN | FP |
| 97 | <5 | TN | TN | TN | TN | TN | TN | TN | TN | TN |
| 98 | 42 | TP | FN | TP | TP | TP | TP | TP | TP | TP |
| 99 | 64 | TP | FN | TP | TP | TP | TP | TP | TP | TP |
| 100 | 2804 | TP | TP | TP | TP | TP | TP | TP | TP | TP |
Abbreviations: FN, false negative; FP, false positive; TN, true negative; TP, true positive.
FIGURE 2.

Test strips tested with different samples: (A) Phosphate buffer saline (negative control), (B) Urine without albumin (negative control), (C) Human serum albumin (positive control), (D) CKD with urine sample (positive), and (E) Healthy urine sample (negative). C, control line; T, test line
When compared to the gold standard, the CU microalbumin test had a sensitivity of 86%, specificity of 94%, positive predictive value (PPV) of 96%, negative predictive value (NPV) 74.6% and an accuracy of 87%. The MicroalbuPHAN® had a sensitivity of 95%, specificity of 64%, a PPV of 84%, NPV 86% and an accuracy of 84%. The Micral‐Test® had a sensitivity of 98%, specificity of 61%, PPV of 83%, NPV 95% and an accuracy of 86% (Figure 3). When compared with the gold standard, the CU microalbumin test showed a Kappa test value of 0.915 with p < 0.001.
FIGURE 3.
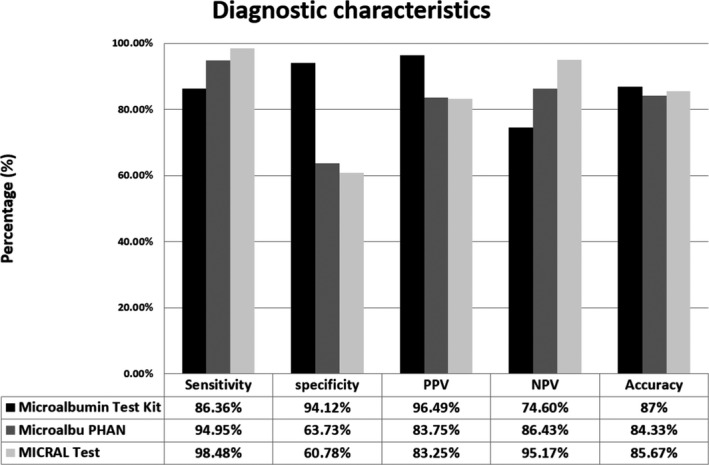
Histogram showing the diagnostic characteristics of each Point‐of‐Care diagnostic device
4. DISCUSSION
The early stages of kidney impairment may be clinically silent, but progresses rapidly and leads to morbidity and mortality in the later stages. Detection of early CKD will allow for management to delay CKD progression and prevent the need of renal replacement therapy. Therefore, a combination of good sensitivity and high specificity is essential for screening to rule out CKD. When comparing to the other two commercial kits, the CU microalbumin has lower sensitivity, however, it reached higher specificity, PPV, and accuracy.
The level of microalbuminuria in this study varied from micro‐ to macroalbuminuria, which proves the efficacy of this test for screening in both general and high‐risk populations. Thus, it is considered as a promising tool for front‐line CKD screening before referral to nephrologists, especially in remote areas where the laboratory services are difficult to access.
The developed strip test, CU microalbumin, is a competitive strip test based on antigen‐antibody complex formation labelled gold nanoparticles. It is simple, easy to use and inexpensive. When compared to current commercial tests, MicroalbuPHAN® strip and Micral‐Test® strip, both tests are dipstick tests based on color change of acidic‐basidic indicator. The urine test results are manually interpreted by comparing the color with the standard color chart where different color perception may interfere with the results of both tests. Therefore, it is essential to properly train personnel to accurately identify and interpret urine dipsticks.
Recently, immunosensor platforms have been developed to quantify microalbuminuria for quantitative measurement of microalbumin in urine. Shaikh et al, used monodisperse polystyrene(PS) nanoparticles coated with Ag nanoshells conjugated to HSA antibodies. Then, these nanoprobes would be trapped on the electrode surface using dieletrophoresis. 11 The second study by Omidfar et al, constructed an antibody labeled with AuNP (Ab‐AuNP) and polyvinyl alcohol(PVA) modified screen‐printed carbon electrode(SPCE) for quantitative measurement of microalbuminuria. The current signal was recorded by voltammetric modes. 12 The last study by Tsai et al developed an immunosensor based on an carboxyl‐enriched porous screen‐printed carbon electrode (COOH‐P‐SPCE). The sensor could detect HSA in urine in a wide linear range from 10 to 300 ug/ml. Unfortunately, these immunosensors are not commercially available. 13
Several limitations should be noted. First, the CU microalbumin was designed to detect microalbuminuria qualitatively for cost reduction in mass screening. To assess the degree of kidney damage, further quantitative investigations are still required. Second, our test is very specific to albumin detection as we developed the test in the concept of antibody‐based POCT. Such kidney diseases with non‐albumin proteinuria cannot be ruled out by our test. Third, CU microalbumin has lower sensitivity than the other two commercial tests used in this study. Thus, we plan to improve sensitivity of our test by developing a sandwich immunochromatographic assay in collaboration with the National Innovation Agency (NIA) and Siam Cement Group (SCG).
This is the first time in which Thailand can produce monoclonal antibodies with potential use at the commercial level. Therefore, this POCT can decrease the cost of importing commercial tests from overseas. In the future, we plan to integrate this POCT into our primary health care facilities and set up a remote telemedicine screening system for CKD. Health education and other useful recommendations are also given individually according to the patient's underlying diseases in an online format. In addition, we also plan to use our test in research areas as one of the outcomes of implementation of integrated CKD care to delay progression of CKD in patients with metabolic diseases.
5. CONCLUSION
CU microalbumin correlated well with the standard method for quantitative measurement of urine albumin. Therefore, it has the potential for point‐of‐care testing in early screening of CKD.
CONFLICT OF INTEREST
None.
AUTHORS’ CONTRIBUTION
Conceptualization: NS, TP, KK; Methodology: NS, TP, KK, PK; Formal analysis and investigation: NS, TP, KK, PK, NV Writing – NW, PK, NS, original draft preparation: NS, TP, KK, PK, NV; Writing – review and editing: NV, PK, TP, KK, CT, NL, SP, SK, KK, KT, SE, NS; Funding acquisition: NS; Supervision: NS, TP, KK.
CONSENT TO PARTICIPATE
All subjects were informed about the risk and benefit of the study. Informed consent was signed before enrolling to the study.
CONSENT FOR PUBLICATION
All authors whose names appear on the submission (1) made substantial contributions to the conception or design of the work; or the acquisition, analysis, or interpretation of data; or the creation of new software used in the work; (2) drafted the work or revised it critically for important intellectual content; (3) approved the version to be published; and (4) agree to be accountable for all aspects of the work in ensuring that questions related to the accuracy or integrity of any part of the work are appropriately investigated and resolved.
CODE AVAILABILITY
Custom code.
Supporting information
Table S1
ACKNOWLEDGEMENTS
I would like to express my sincere thanks to Health Systems Research Institute (HSRI); Department of Medicine, Faculty of Medicine, Chulalongkorn University, Bangkok, Thailand; Division of Nephrology, Department of Medicine, Faculty of Medicine, Chulalongkorn University, Bangkok, Thailand; Excellence Center for Critical Care Nephrology, King Chulalongkorn Memorial Hospital, Thai Red Cross Society, Bangkok, Thailand; Department of Laboratory Medicine, Chulalongkorn University, Bangkok, Thailand; Chulalongkorn University Systems Biology (CUSB) Center, Bangkok, Thailand; Institute of Biotechnology and Genetic Engineering, Chulalongkorn University, Bangkok, Thailand; Biomedical Signal Processing (BSP) Research Team; National Science and Technology Development Agency (NSTDA), Pathumthani, Thailand.
Funding information
Health Systems Research Institute (HSRI).
DATA AVAILABILITY STATEMENT
The datasets generated during and/or analyzed during the current study are available from the corresponding author on reasonable request.
REFERENCES
- 1. Luyckx V, Tonelli M, Stanifer J. The global burden of kidney disease and the sustainable development goals. Bull World Health Orga. 2018;96(6):414‐422. [DOI] [PMC free article] [PubMed] [Google Scholar]
- 2. 2018 USRDS Annual Data Report: Executive Summary. Am J Kidney Dis. 2019;73(3):A9‐A22. [Google Scholar]
- 3. Ingsathit A, Thakkinstian A, Chaiprasert A, et al. Prevalence and risk factors of chronic kidney disease in the Thai adult population: Thai SEEK study. Nephrol Dial Transplant. 2009;25(5):1567‐1575. [DOI] [PubMed] [Google Scholar]
- 4. Guidelines for chronic kidney disease patients before RRT in 2009 by the Kidney Association of Thailand.
- 5. Fund Management Manual National Health Security, Fiscal Year. 2020.
- 6. Khwaja A. KDIGO Clinical Practice Guidelines for Acute Kidney Injury. Nephron. 2012;120(4):c179‐c184. [DOI] [PubMed] [Google Scholar]
- 7. Comper WD, Osicka TM. Detection of urinary albumin. Adv Chronic Kidney Dis. 2005;12(2):170 – 176. [DOI] [PubMed] [Google Scholar]
- 8. Harlow E, Lane D. Antibodies: A laboratory manual, 1–726.New York: Cold Spring Harbor Laboratory; 1988. [Google Scholar]
- 9. Pimpitak U, Putong S, Komolpis K, Petsom A, Palaga T. Development of a monoclonal antibody‐based enzyme‐linked immunosorbent assay for detection of the furaltadone metabolite, AMOZ, in fortified shrimp samples. Food Chem. 2009;116:785‐791. [Google Scholar]
- 10. Hasslacher C. Clinical significance of microalbuminuria and evaluation of the micral‐test. Clin Biochem. 1993;26(4):283‐287. [DOI] [PubMed] [Google Scholar]
- 11. Shaikh MO, Zhu PY, Wang CC, Du YC, Chuang CH. Electrochemical immunosensor utilizing electrodeposited Au nanocrystals and dielectrophoretically trapped PS/Ag/ab‐HSA nanoprobes for detection of microalbuminuria at point of care. Biosens Bioelectron. 2019;126:572‐580. [DOI] [PubMed] [Google Scholar]
- 12. Omidfar K, Dehdast A, Zarei H, Sourkohi BK, Larijani B. Development of urinary albumin immunosensor based on colloidal AuNP and PVA. Biosens Bioelectron. 2011;26(10):4177‐4183. [DOI] [PubMed] [Google Scholar]
- 13. Tsai JZ, Chen CJ, Settu K, Lin YF, Chen CL, Liu JT. Screen‐printed carbon electrode‐based electrochemical immunosensor for rapid detection of microalbuminuria. Biosens Bioelectron. 2016;77:1175‐1182. [DOI] [PubMed] [Google Scholar]
Associated Data
This section collects any data citations, data availability statements, or supplementary materials included in this article.
Supplementary Materials
Table S1
Data Availability Statement
The datasets generated during and/or analyzed during the current study are available from the corresponding author on reasonable request.