

Abstract
In the classic source-filter theory, the source of sound is flow modulation. “Flow” is the flow rate (Q) and flow modulation is dQ/dt. Other investigators have argued, using theoretical, computational, and mechanical models of the larynx, that there are additional sources of sound. To determine the acoustic role of dQ/dt in a tissue model, Q needs to be accurately measured within a few millimeters of the glottal exit; however, no direct measures of Q currently exist. The goal of this study is to obtain this waveform in an excised canine larynx model using time-resolved tomographic particle image velocimetry. The flow rate data are captured simultaneously with acoustic measurements to determine relations with vocal characteristics. The results show that glottal waveform characteristics such as maximum flow declination rate are proportional to the subglottal pressure, fundamental frequency, and acoustic intensity. These findings are important as they use direct measurements of the volume flow at the glottal exit to validate some of the assumptions used in the source-filter theory. In addition, future work will address the accuracy of indirect clinical measurement techniques, such as the Rothenberg mask.
1. Introduction
When the vocal folds are close together, airflow through the glottis produces vibration through a complex flow structure interaction. According to the classic source-filter theory of phonation (Fant 1981), the sound is produced at the glottis by a process known as flow modulation; in this case, “flow” refers to the volume flow rate (Q) produced at the glottal exit during the phonation cycle. Flow modulation is a monopole sound source whose strength is quantified by dQ/dt, which refers to the fact that Q changes over time as the glottis opens and closes. The basic mechanisms of human phonation and related concepts are summarized in reference books such as “Principles of voice production” (Titze and Martin 1998), or “The Science of the Singing Voice” (Sundberg 1987).
Since Fant postulated that flow modulation is the source of sound, other investigators have hypothesized additional aeroacoustic sources of sound (e.g., McGowan 1988; Barney et al. 1999; McPhail et al. 2019). To evaluate the acoustic role of dQ/dt in a synthetic or tissue model of the larynx, direct measurement of Q within a few millimeters of the glottal jet is required; however, direct measurement of the flow rate has not been reported for tissue models. In addition, current clinical techniques for measuring Q, such as the Rothenberg mask, use acoustics at the mouth to calculate Q at the glottal exit. However, the validity of this approximation has not been determined in a tissue model. Thus, there is a need for a technique that measures Q at the glottal exit. In this paper, tomographic particle imaging velocimetry (PIV) is used to directly measure Q.
In Fant’s theory, it is also assumed that there is a linear source-filter interaction such that acoustic pressures in the vocal tract do not affect intraglottal pressures. In the past several years, the authors have shown that there is non-linear source-filter coupling (Titze 2008; Lucero et al. 2012). Some analytical models used two-dimensional, or simplified models of the human glottis and vocal tract to describe the characteristics of the different sound mechanisms in the voice (Howe and McGowan 2010; Fulcher et al. 2019). Other models based on experiments measured the flow above the vocal folds in excised models of the larynx (Bielamowicz et al. 1999; Verneuil et al. 2003; Kataoka et al. 2007; Oren et al. 2015b; Birk et al. 2017), or at the mouth (Rothenberg 1973; Sulter and Wit 1996; Lehto et al. 2007), or on synthetic mechanical models (Kniesburges et al. 2008; Becker et al. 2009; Taylor et al. 2019).
Early measurements of the velocity fields were made using miniature pressure transducers (Cranen and Boves 1988). Neubauer et al. (2007) proposed an a posteriori “quasi phase-locked” experiments in a synthetic replica of the human larynx. This paper focused on the coherent structures in the near field above the glottis with a vocal tract, which exhibited vortex convection, as well as jet flapping. Drechsel and Thomson (2008) showed the influence of the vocal tract and false vocal folds on the glottal jet produced by a synthetic self-oscillating vocal fold model. The technique used phase-locked PIV (ensemble-averaged) with and without a vocal tract above the folds. The silicon model did not reproduce the wave-like motion of the superior membrane of the folds and showed high sensitivity to the wetness of the folds (caused by the PIV fluid). Lodermeyer et al. (2015) used the transient subglottal pressure measurement to trigger a phase-locked PIV system, to compute aeroacoustics from the measured velocity field. Triep et al. (2005) published high-speed PIV above the false vocal folds in a driven mechanical model. These measurements presented some limitations as they could not measure very close to the glottis, and the measurement medium was water. In all these studies, the glottal flow was characterized by two-dimensional velocity fields. Measuring Q, however, requires three-dimensional characterization. Krebs et al. (2012) introduced a volume flow rate measurement technique with and without a vocal tract by tracking the temporal vertical motion of a column of water, acquired by a microscopic lens and a high-speed camera. Axis switching was observed, as well as the effect of closing on the shape of the glottal jet (divergent shape, reduced glottal gap). This axis switching phenomenon is a typical three-dimensional effect observed in non-circular jets, and in jets inspired from biological jets such as the glottal jet (Audier et al. 2016). Axis switching in the excised canine larynx has been shown in past publications (Khosla et al. 2008), as well as in mechanical models of the glottal jet (Triep and Brücker 2010a).
The correlation between the radiated sound and the measured flow field at the glottal exit has been studied (Howe and McGowan 2011) in idealized models, using an unsteady flow through an orifice into free space as a monopole sound source. They concluded that the source “strength” is equal to the volume flux from the orifice. When the orifice exhausts into a through-flow cavity, the subsequent radiation from the cavity exit is ‘filtered’ by cavity resonances. A study of the source contribution to the acoustics can be achieved with a decoupled flow-acoustic analysis, which has been done in synthetic larynges (Lodermeyer et al. 2018). Analogies based on different aeroacoustic variables provide different sources of sound (Crighton et al. 1992). The choice of the aeroacoustic variable depends on the application considered. Hence, it is important to note that the definition of dQ/dt as the source of sound is restricted to a source-filter model and that there exist alternatives that are equivalent (Hirschberg 1992; McPhail et al. 2019).
The major limitation of the above-mentioned methods lies in the indirect relationship between the source and the measurement location, or the non-volumetric measurement of this volumetric quantity. Although dQ/dt is constantly changing from glottal opening to closing, the greatest rate of change happens during the latter part of the closing, when Q rapidly decreases. This rapid deceleration is quantified by the maximum flow declination rate (MFDR). MFDR has been shown to highly correlate with acoustic intensity (loudness) (Stevens 2000). MFDR also correlates with the amount of acoustic energy in the higher harmonics.
Using one camera and planar particle image velocimetry (PIV), Oren et al. (2015b) estimated the laryngeal flow rate in a 1 mm-thick coronal plane located in the middle of the membranous folds. They showed a correlation between the acoustic intensity (using SPL) and the maximum flow rate, as well as a correlation between SPL and MFDR. Previous studies attempted three-dimensional volume measurements of the laryngeal flow, using synthetic aperture particle image velocimetry (Nielson et al. 2013) and obtained satisfactory qualitative results. The authors noted that the results were noisy due to the optical challenges in capturing images of the seeded volume flow. Thus, it did not achieve the validation of quantitative measurements of the flow rate. Velocity fields were measured 1 cm above the glottal exit in an excised larynx model (Verneuil et al. 2003) using three one-component hot wire anemometers equally spaced in the anterior-posterior direction. The glottal area was measured endoscopically. The major limitation of this study is that the velocities were measured 1 cm above the glottal exit and that the spatial resolution was relatively coarse. In a study evaluating axis switching in the excised larynx, we found that velocity fields changed significantly in the first centimeter above the folds (Khosla et al. 2008), but were relatively stable within the first 3 mm. Another issue with one-component hot wires is that flow reversal cannot be determined and thus vortices cannot be resolved. However, Khosla et al. (2008) showed significant vortices in both the mid-coronal and mid-sagittal planes.
The tomo-PIV is the most suited technique for non-intrusive measurements of the glottal jet. The technique can characterize both spatial and temporal behaviors of the flow. Other non-intrusive measurement techniques, such as stereo-PIV, particle tracking velocimetry (PTV), or laser Doppler velocimetry (LDV) can only resolve part of this information. LDV and stereo-PIV, for example, can measure all three velocity components, but would require multiple simultaneous measurements of multiple planes to reconstruct the flow dynamics. Similarly, PTV would only yield a few vectors across the domain. Furthermore, PTV requires a low particle displacement to particle spacing ratio, which means that the seeding particles density must be quite low (when compared with PIV). This can be very challenging to achieve in the current setup.
Ideally, computational models should help to address the complexity of the glottal flow. From static models (Mylavarapu et al. 2009; Farbos de Luzan et al. 2015) to dynamic fluid-structure interaction (FSI) models (Luo et al. 2008; Zheng et al. 2009), tremendous progress has been made which requires proper validation. The current study proposes to introduce the tomographic PIV technique as a way to provide quantitative validation data for computational models. It is the first study to measure instantaneous changes in Q within 2 mm of the glottal exit; given the vertical movement of the vocal folds, the axial location of the measurement plane is from 0 to 2 mm during the vibration cycle. It is never greater than 2 mm. We also used the MFDR as a simplification of the complex mechanisms described above to describe a correlation-based relation between flow and radiated sound.
2. Methods
2.1. Experimental setup
We excised a canine larynx from a shared research mongrel subject immediately after the animal was euthanized. The weight of the animal was approximately 28 kg. All the structures above the vocal folds were removed to allow optical access to the superior aspect of the folds (i.e., above the glottal exit). We cut the trachea approximately 5 cm below the cricoid cartilage. The folds were 14 mm in length. The folds were adducted using three-pronged supports that were inserted into each of the vocal processes. The prongs connected the arytenoid cartilage to a three-stage micrometer that enabled adducting the folds until achieving minimal contact. The prongs did not exert any additional strain on the folds, and a posterior glottal opening always remained (Fig. 1a). The trachea was placed over an aerodynamic nozzle, which supplied conditioned airflow to the glottis. Conditioning of the flow consisted of a perforated wedge, a honeycomb, and screens in the plenum chamber on which the aerodynamic nozzle was directly fitted. The nozzle contraction ratio was 1:35 and its profile was designed using a fifth-order polynomial, according to the guideline given by Mehta (1985) and Morel (1975). The pressure inside the plenum chamber was measured using a pressure transducer (Honey-well, FPG) and was used to calculate the subglottal pressure (Psg). Upstream of the nozzle, the airflow was humidified (Hudson RCI, ConchaTerm III®) and regulated using a mass flow controller (Parker, MPC series), a flow meter (Micro-Motion Inc., CMF025 Coriolis Flow Meter), and a pressure regulator (ControlAir Inc., type 100 Precision Air Pressure Regulator). Polyurethane tubing (3/4 in. OD, 1/8 in., wall) was used to connect the different instrumentations.
Fig. 1.
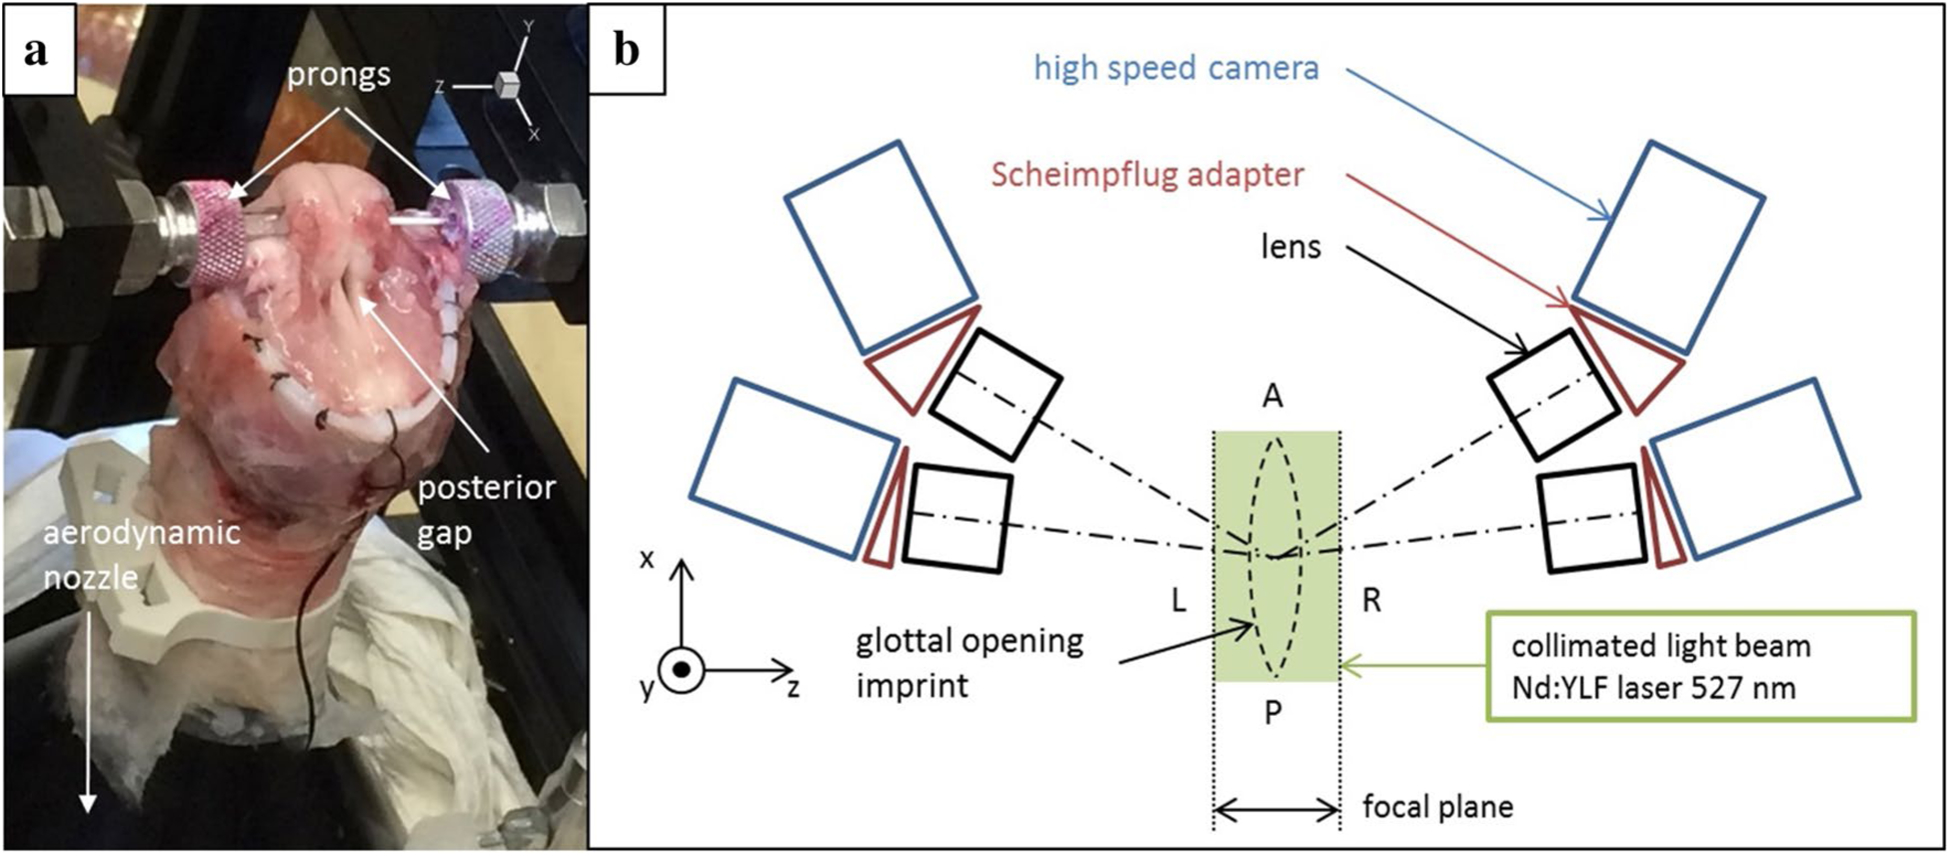
Details of the experimental setup: a larynx mounted on the aerodynamic nozzle (before applying fluorescent red dye). The folds are adducted by inserting prongs into the vocal processes. b Schematic of the tomo-PIV setup. The orientation of the setup with respect to the larynx is given by the anterior (A), posterior (P), left (L), and right (R) directions on each side of the focal plane
Volume velocity fields were measured using time-resolved tomographic particle image velocimetry (tomo-PIV). The technique of tomo-PIV relies on the use of four cameras (Phantom, Miro 340) to image four different per-spectives of a seeded flow. The different views allow for tomographic reconstruction of the PIV images. The flow volume was illuminated from above the larynx by creating a 20 mm × 10 mm collimated laser beam (Dantec TopHat Volumetric Illumination System, aspect ratio 2:1) using a high repetition rate dual cavity Nd:YLF laser (Litron Lasers, LDY304).
The testing area was enclosed with a 70 cm × 50 cm × 80 cm clear vinyl sheets (X mm thick) for better ambient seeding. The enclosure was not sealed and was large enough not to disturb the laryngeal airflow and not to affect the acoustics measurements. Both the ambient air and the glottal flow were seeded using DEHS oil [bis(2-eth-ylhexyl) sebacate] generated by two atomizers (TSI, model 9306 and LaVision GmbH, resp.).
Fluorescent red dye (Cole-Parmer, Rhodamine WT Dye) was applied to the tissue to reduce the laser reflections. The PIV cameras were fitted with Nikon 105 mm F/2.8 macro lenses, which yielded a spatial resolution of 38.8 pixels/mm. Scheimpflug optical adaptors (LaVision GmbH) were connected between each camera and its lens to correct the image distortion that is formed by the oblique viewing angle (Fig. 1b). Processing of the PIV data was done using DAVIS 10.5 software (LaVision GmbH) with a multi-pass decreasing voxel size (96 to 32) with a 75% overlap, which yielded a spatial resolution of 4.88 vector/mm. Outliers were removed using the universal outliers detection proposed by Westerweel and Scarano (2005) with the default threshold value of 2.
Testing occurred at five different sub-glottal pressures. The total range for Psg varied from 21.2 to 32.2 cmH2O. The values for the low subglottal pressures started at 5 cm of water above the phonation threshold of the larynx (Berke et al. 1987; Alipour and Scherer 2002). Five hundred images were captured at 3 kHz for each case of subglottal pressure. The data acquisition for each test was initiated several seconds after the onset of phonation when steady vibration of the folds was achieved.
Acoustic measurements were taken simultaneously with the PIV measurements using a multi-field microphone (Brüel & Kjær, 0.25 in, type 4961) which was placed 30 cm above the larynx. This distance from the source is typical for such vocal acoustic measurements (Pickett 1956; Monsen and Engebretson 1977; Holmberg et al. 1989). The microphone was far enough from the glottal jet axis to ensure it did not capture non-acoustic pressure fluctuations. The transistor-transistor logic (TTL) signal output from each PIV image served as the time reference with the audio recording. Both TTL and acoustic data were captured at 30 kHz using a data acquisition system (NI, PXIe-6356).
2.2. Validation and verification of the tomo‑PIV flow rates
The accuracy of the tomo-PIV technique in terms of particle reconstruction and velocity magnitude Was assessed by Elsinga et al. (2006) and showed to be within 8%. The flow rate data from tomo-PIV is computed by integrating the velocity magnitude at each axial plane. Measurements in the current study were validated and verified by comparing our results with measurements taken by other means.
Validation of the flow rate measurements was done by comparing the mean value computed at the glottal exit with the flow rate that was measured upstream of the larynx. The Coriolis flowmeter used upstream provides a highly accurate measurement (Anklin et al. 2006), but cannot resolve the glottal flow rate waveform due to its low-frequency response (~ 500 ms). On the other hand, the tomo-PIV measurement can resolve the glottal waveform. The mean value computed at the glottal exit is expected to match with the upstream measurement, because the continuity equation still holds at this location. In the current study, the average flow rate computed from PIV was in all cases within 10% difference of the flow rate that was measured upstream.
The verification process of the flow rate measurement technique was done by using the exact same setup except that the larynx was replaced with a lenticular nozzle (e.g., same location for the cameras, same lenses, same spatial resolution, same processing of the PIV data). This shape was chosen because it resembles the maximum opening shape of the glottis. The details of this axillary study are discussed in Maddox and Gutmark (manuscript under review). In short, the tomo-PIV measurements were taken in continuous flow emanating from a nozzle with an orifice shape of a lenticular lens. The flow rate was adjusted so that the Reynolds number (based on the maximum glottal opening and the minor axis of the nozzle) would approximately match the ones for the current experiment. The results of this study showed that the current setup for tomo-PIV can provide a good approximation for the flow rate values. When the flow rate computed from the PIV measurements was compared with its upstream measurement, it showed that the error at the nozzle exit varied from 1.6 to 12.9%.
2.3. Phase referencing of glottal flow measurements
The acoustic signal determined the phase of each PIV image. In each glottal cycle, the sharp peaks in the audio measurement defined the period of each glottal cycle (Fig. 2). This data is then used to determine the phase of each PIV image by comparing the acoustic and TTL signals. The phase of each PIV field, θi, was determined based on the time delay from the beginning of its cycle:
| (1) |
where tTTL=1 is the time stamp of the image trigger (corresponds to TTL high), and t0° and t360° are the time stamps of the microphone reference points before and after the image time stamps, respectively.
Fig. 2.

Sample data from the microphone (blue line) and camera TTL (orange bars) signals for phonation at Psg = 22.7 cmH2O. Red circles show the reference points on the microphone signal where θ(modulo 360) = 0°. The TTL signal marks the acquisition of the frames by the PIV cameras
3. Results
3.1. Instantaneous velocity fields
Instantaneous contours of velocity of the glottal jet are shown in Fig. 3 in two orthogonal planes above the larynx. The mid-sagittal plane (z = 0 mm) is in the center of the measurement volume and shows the posterior-anterior/inferior-superior extents of the captured glottal jet. Streamlines show the direction of the exiting jet, as well as the continuity of the velocity field. y = 0 mm is an axial plane located immediately above the glottal opening. It features the posterior-anterior/left-right extents of the measured volume. Due to tissue obstruction at the level of the vocal folds, it is physically located within 1–2 mm above the superior edge of the vocal folds. The process of tomographic reconstruction allows the reconstruction.
Fig. 3.

Instantaneous flow field plotted as contours of velocity magnitude and velocity streamlines. Volume mesh is overlaid to appreciate the spatial resolution yielded by the tomographic reconstruction. a The plane z = 0 mm is in the mid-sagittal plane of the measurement volume and shows the posterior-anterior extents of the glottal jet. b The plane y = 0 mm is an axial plane located immediately above the glottal opening. Due to tissue obstruction at the level of the vocal folds, it is within 1–2 mm above the superior edge of the vocal folds. The orientation of the views is given by the anterior (A), posterior (P), left (L), and right (R) directions
3.2. Phase-averaged velocity fields
For each sequence of phonation of the larynx, we were able to reconstruct the three-dimensional glottal jet over the full cycle of the waveform. Five hundred instantaneous flow fields were ordered with respect to their phase angle θi then grouped in bins of 24° width. For each bin (0°–24°, 24°–48°, …, 334°–360°), the flow field was averaged, as it yielded a smoother shape for the jet visualization. In Fig. 4, the volume velocities above the glottis are shown for 24° phase increments, from θ = 0° to 216° in at two different subglottal pressures (Psg = 22.7 and 32.2 cmH2O). The glottal jet shape above the glottis is captured in the velocity contours shown in the cross-sectional plane (at y = 0 mm), and an iso-surface of constant velocity (|V| = 30 m/s) characterizes its evolution downstream. The series of plots show how the glottis opens from its posterior (left) toward its anterior (right), which is typical of the zipper-like motion of the folds. Vignettes d, j, and p are close to the peak flow rate of the cycles for the low and high subglottal pressure respectively, and the width of the jet increases with the sub-glottal pressure. The rapid closure of the folds is visible in the figure from the evolution of the jet between 120° and 216°. The displacement amplitude of the superior edge of the glottis typically correlates with the divergence angle of the intraglottal region during closing. The persistent flow through the posterior glottal opening, which is typical of canine and women larynges, was observed at all subglottal pressures. This could be an important parameter to study in the presence of a vocal tract (Cranen and Schroeter 1995).
Fig. 4.
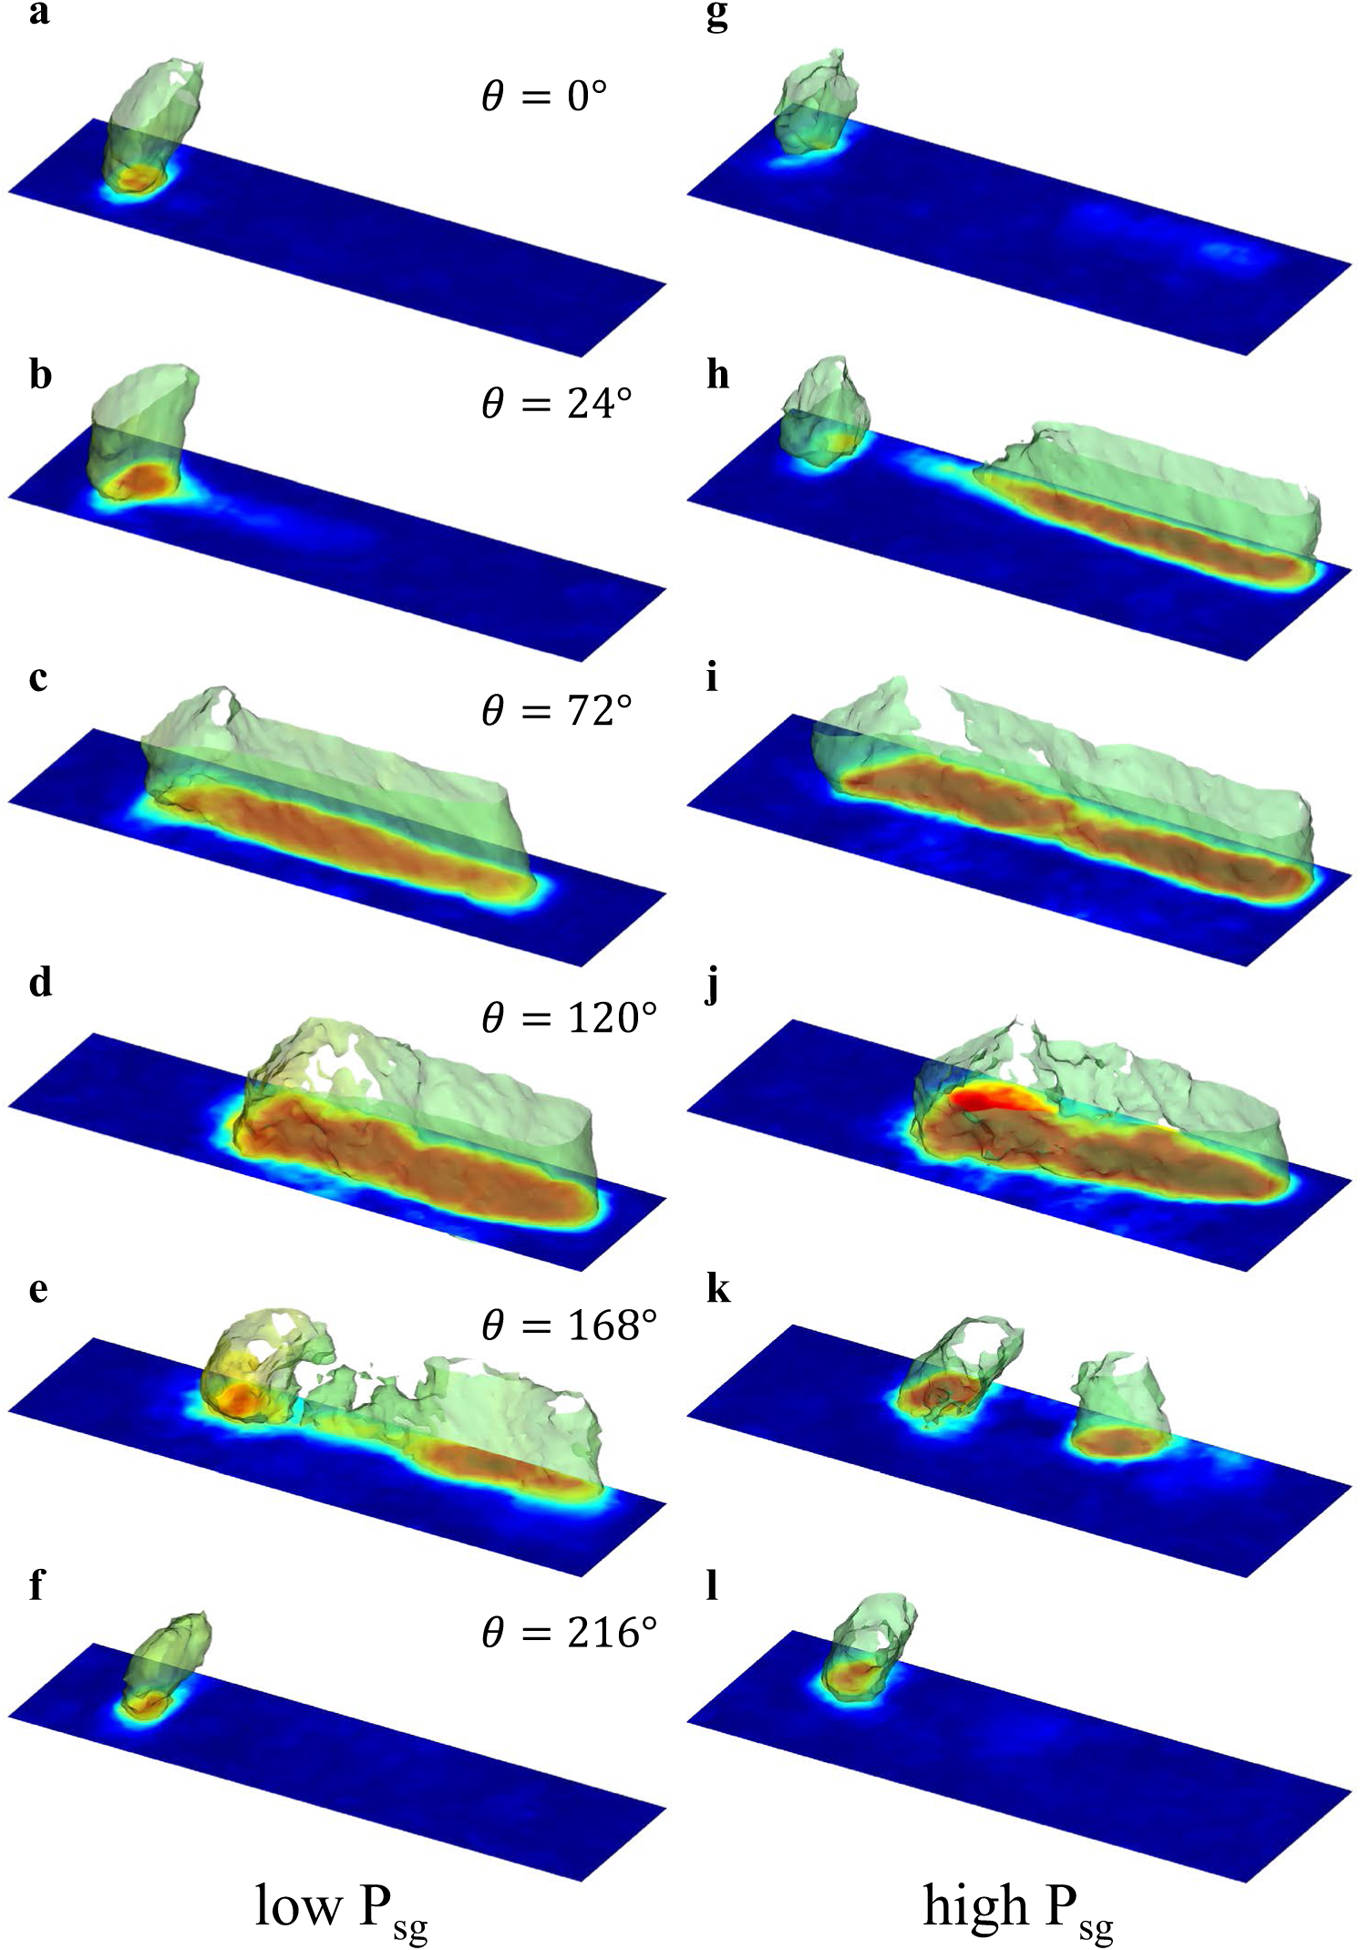
Representation of the 3D glottal jet for low and high sub-glottal pressures. a–f Low subglottal pressure (Psg = 22.7 cmH2O) and g–l high (Psg = 32.2 cmH2O) subglottal pressure. The figure displays only phases between 0° and 216°, since the 216°–360° range corresponds to the closed phase of the glottal cycle, and despite the small posterior opening leakage, the flow does not qualitatively change above the glottis
The time-resolved measurements of the volume velocity were used to extract the flow rate waveform, Q(θ)(Fig. 5). The figure shows in the left column velocity contours in the mid-sagittal and axial planes for different phases (top to bottom sub-figures numbered 1–5, corresponding to θ = 24°, 72°, 120°, 168°, and 216°, respectively) from Larynx 1at Psg = 22.7 cmH2O The x-axis ranges from the posterior end of the folds (x = 0 mm) to the anterior commissure of the larynx (x = 16.4 mm) In the middle column, the sub-figures represent cross sections of the flow field at y = 0 mm, which is the plane located immediately above the superior membrane of the folds. The z-axis range corresponds to the maximum width of the jet at the glottal exit. The axial component of velocity is integrated for each phase in this plane, to reconstruct the waveform that is shown in the right column. Symbols 1–5 are located next to their corresponding point in the glottal cycle.
Fig. 5.

Phase-averaged flow fields over one glottal flow cycle plotted as contours of velocity magnitude. (Left column) plane z = 0 mm is located in the mid-sagittal plane of the measurement volume and shows the extents of the glottal jet from x = 0 mm (posterior) to x = 16.4 mm (anterior). Added streamlines indicate the in-plane direction of the flow over the contours of velocity magnitude. (Center column) plane y = 0 mm is located immediately above the folds. It shows the cross section of the glottal jet. (Right column) Phase-ordered reconstructed glottal waveform . The dots show the θ-ordered instantaneous Q (y = 0 mm)
The velocity contours show that during opening (sub-figures 1, 2), the velocity increased first near the posterior end of the folds, consistent with anterior-posterior vibration in a zipper-like fashion. The axial contour also shows that flow continuously exits between the arytenoids, even during the closed phase (θ = 360°). The leakage is due to the posterior opening that is typically observed in canine and some women’s larynges. This leakage explains why the computed values of Q are never zero.
The right column shows the result of axial component integration in the plane y = 0 mm for each acquired flow field (dots). The dashed line is the result of the phase averaging process described above, which consists of performing a moving averaging process of width 15°. Error bars showing the standard deviation are added to the phase-binned curve.
Figure 6 shows 40 ms of Q(t) for low and high subglottal pressures, which feature a few cycles of the time-resolved instantaneous flow rates. The scattered dots (blue) represent the instantaneous flow rate, which is yielded from the raw PIV data. A fourth-order Fourier series (solid red line) is fitted to the scatter to extract information from a continuous signal. The equation of the fit is as follows:
| (2) |
where ω is the fundamental frequency of the signal, 4 is the number of terms (harmonics) in the series, and Q(t) is the glottal flow rate. From fitting the instantaneous flow measurements, a characteristic waveform was reconstructed for each phonation condition, as depicted in Fig. 7. MFDR was calculated for each cycle as the minimum of dQ/dt, which is the time derivative of the fitted Fourier series. The figure shows that in all cases, the glottal waveform skewed toward closing, which indicates that the closing phase occurs more rapidly than the opening. For each trial, the average of all MFDR was retained (Fig. 8). The magnitude of MFDR increased linearly with Psg, which was also shown in a previous planar study (Oren et al. 2015b). The increase in MFDR means that there is an even more rapid shutoff of the glottal flow, which generates higher harmonics (Stevens 2000). The phonation of the larynx featured high frequencies for the range of subglottal pressures tested, and the closed phase was long and well defined. In addition, the waveform appeared more skewed toward closing in the case of higher subglottal pressure.
Fig. 6.

Time-resolved glottal waveforms at a low (Psg = 22.7 cmH2O) and b high (Psg = 32.2 cmH2O) subglottal pressures for the larynx model. The blue dots represent the instantaneous flow rate integrated from the velocity fields, and a 4th order Fourier series is fitted to it (red line). Two-sigma dotted lines show the confidence bounds of the fit
Fig. 7.

A single period of the glottal volume flow rate for a low (Psg = 22.73 cmH2O) and b high (Psg = 32.23 cmH2O) subglottal pressures. The top vignettes display the Q(t) fitted curve (red solid line) and its 2-sigma confidence interval. The bottom vignettes show their derivative dQ/dt, for which the minimum represents the maximum flow declination rate (MFDR). The time at which MFDR occurs is identified on all plots as a vertical dashed line (blue)
Fig. 8.

a Maximum flow declination rate (MFDR) vs. subglottal pressure (Psg). b MFDR vs. fundamental frequency (F0). c MFDR vs. sound pressure level (SPLa). The linear fit to the five experiments suggests there is a linear relationship between the subglottal pressure and MFDR. Moreover, it agrees with other quantities that have been known to increase with Psg, such as F0 and SPLa
Figure 8 summarizes the results obtained for the larynx model at five different subglottal pressures. A linear fit to the five experiments suggests there is a linear relationship between the subglottal pressure and MFDR. Moreover, this trend agrees with other quantities that have been known to increase with Psg, such as F0 and SPLa. Discrepancy is noted at relatively high subglottal pressures (experiments 4 and 5) without compromising the trend.
4. Discussion
The qualitative and quantitative characteristics of the measured waveforms proved the feasibility of the tomo-PIV technique to assess the time-varying glottal waveform successfully. We were able to measure the volume flow rate and the results matched the value of the flow reference, measured by a Coriolis flow-meter. Results presented in this article confirmed known trends, such as the relation between MFDR and Psg. Nevertheless, it is worth noticing that the literature usually calculates MFDR as a function of time, using units such as L/s2 or Lpm/s. As the vibration frequency usually increases with the subglottal pressure, it is only normal that the period of the signal diminishes accordingly. Hence, the flow derivative must increase in amplitude; otherwise, the average flow would reduce. What we observed is that an increase of the subglottal pressure (with the same pre-phonatory conditions) accompanies an increase of the averaged flow. In the three cases presented, MFDR increased with the subglottal pressure. We also made sure it was still increasing if defined as a function of the vibration period (or phase angle), using units such as Lpm/s−1 or Lpm/°. Nevertheless, it is something to keep in mind when looking at the absolute values of MFDR. In the more general sense, dQ/dt is the time derivative of the measured quantity, which induces some uncertainties on its absolute value. Therefore, measuring Q(t) does not replace acoustic measurements produced by a microphone. Yet, it is the only experimental way to directly measure the flow waveform, and it adds valuable information to the dynamics of the glottis during phonation.
It was seen that skewing of the flow rate curve increases with subglottal pressure. Q is equal to the area multiplied by the velocity of the flow at the glottal exit. In previous work, we have seen skewing of the velocity (Khosla et al. 2014) and of the area (Titze 1988; Oren et al. 2019) waveforms in the excised canine larynges without a vocal tract. Theoretical models show that there is no skewing of the area or velocity curves without a vocal tract and that there is only skewing of the velocity curves when a vocal tract is added (e.g., Titze 1988). Titze (2006) later theoretically argued that area skewing can occur only if the maximum amplitude of the inferior edge is greater than the superior edge; however, we have found in the excised larynx (Oren et al. 2019) that the superior aspect of the glottis has a greater maximum amplitude than the inferior edge; in this case, Titze predicted that the area curve would skew to the left, which is not what was found in our work (Oren et al. 2019). It is known that when the glottis is divergent, vortices are present in the superior aspect of the fold and remain there until the glottis completely closes. We have shown that these vortices produce significant pressures. We hypothesize that this negative pressure produces an additional closing force causing both area and velocity curves to skew to the right. We are in the process of testing this hypothesis using flow structure interaction computational models. It has been shown that the strength (circulation) of these intraglottal separation vortices depends on the divergent geometry of the glottis during closing (Oren et al. 2014, 2015a; Farbos de Luzan et al. 2015). Therefore, it will be of interest to capture the shape of the intraglottal geometry during tomo-PIV measurements and relate it to MFDR.
These measurements were performed without any structure above the larynx. Subsequent studies will show the effect of vocal tract constriction above the glottis by implementing a mechanical vocal tract above the location of the measurement and varying the constriction of the ventricular folds. The effect of vocal folds’ asymmetries (anterior/posterior, as well as inferior/superior) will be investigated using planar and tomo-PIV. Similarly, the effect of arytenoid adduction and superior/inferior medialization on the glottal waveform can be investigated.
Some limitations are to be noted. The excised canine larynx model is not innervated. Innervation affects the pre-phonatory parameters but not the actual vibration, which is flow induced. The time that the larynx can be studied is limited to a few days. It is also observed that the vocal folds can move slightly superiorly due to the subglottal pressure force applied during phonation, which causes a source of uncertainty in the axial distance between the superior edge of the folds and y = 0 mm. When tissues bulge up consequently, the observed lateral mucosal wave may obscure part of the flow field immediately above the folds. Thus, the physical location for height for integration was within 2 mm above the superior edge of the vibrating folds. Further downstream entrainment to the glottal jet increases the magnitude of the flow rate. The entrainment is derived in part by the axis switching phenomenon that was shown by multiple research groups in the case of the glottal flow (Khosla et al. 2008; Triep and Brücker 2010b; Krebs et al. 2012), and more generally in the case of an oblong-shaped jet (Ho and Gutmark 1987). The acoustic measurements were not performed in an anechoic environment, and the background noise of the experimental setup was measured at 59.9 dB. Thus, the sound pressure values must be taken for their qualitative insight, although they still fall in the range observed in the literature. Similarly, the subglottal acoustics were not measured, and it has been reported that they can interfere with the vibration mechanism (Zhang et al. 2006). Nevertheless, the current measurements do not focus on the potential influence of the subglottal acoustics, as all measurements were performed in the same conditions (relatively), and no jumps or non-linear phenomena were observed during phonation.
5. Conclusion
The current study is the first to measure the time-resolved volume flow rate at the glottal exit in a vibrating excised tissue model of the larynx. The agreement between the computed mean volume flow rate from instantaneous flow fields and the supplied mean flow rate (measured by Coriolis flowmeter) validated the tomographic PIV method. Results presented in this article confirmed known trends, such as the relation between MFDR and Psg. Further development of the technique will involve a co-registration of a digital image correlation system using two cameras in a stereoscopic setup, which will provide the geometry of the glottis simultaneously with the volume flow measurements, thereby reducing the positioning error sources. This will lead to characterize the acoustic role of dQ/dt in tissue models of the larynx, for which direct measurement of Q within a few millimeters of the glottal jet is required. In addition, it will contribute to the validation of current clinical techniques for measuring Q, such as the Rothenberg mask, which use acoustics at the mouth to calculate Q at the glottal exit.
Acknowledgements
This project was supported by NIH Grant no. R01 DC009435 from the National Institute of Deafness and Other Communication Disorders.
References
- Alipour F, Scherer RC (2002) Pressure and velocity profiles in a static mechanical hemilarynx model. J Acoust Soc Am 112:2996–3003. 10.1121/1.1519540 [DOI] [PubMed] [Google Scholar]
- Anklin M, Drahm W, Rieder A (2006) Coriolis mass flowmeters: overview of the current state of the art and latest research. Flow Meas Instrum. 10.1016/j.flowmeasinst.2006.07.004 [DOI] [Google Scholar]
- Audier P, Sciamarella D, Artana G (2016) Pre-switching bifurcation of a slender jet. Phys Fluids. 10.1063/1.4939711 [DOI] [Google Scholar]
- Barney A, Shadle CH, Davies POAL(1999) Fluid flow in a dynamic mechanical model of the vocal folds and tract. I. Measurements and theory. J Acoust Soc Am 105(1):444–455 [Google Scholar]
- Becker S, Kniesburges S, Müller S et al. (2009) Flow-structure-acoustic interaction in a human voice model. J Acoust Soc Am. 10.1121/1.3068444 [DOI] [PubMed] [Google Scholar]
- Berke GS, Moore DM, Hantke DR et al. (1987) Laryngeal modeling: theoretical, in vitro, in vivo. Laryngoscope. 10.1288/00005537-198707000-00019 [DOI] [PubMed] [Google Scholar]
- Bielamowicz S, Berke GS, Kreiman J, Gerratt BR (1999) Exit jet particle velocity in the in vivo canine laryngeal model with variable nerve stimulation. J Voice. 10.1016/S0892-1997(99)80019-8 [DOI] [PubMed] [Google Scholar]
- Birk V, Kniesburges S, Semmler M et al. (2017) Influence of glottal closure on the phonatory process in ex vivo porcine larynges. J Acoust Soc Am doi 10(1121/1):5007952. [DOI] [PMC free article] [PubMed] [Google Scholar]
- Cranen B, Boves L (1988) On the measurement of glottal flow. J Acoust Soc Am. 10.1121/1.396658 [DOI] [PubMed] [Google Scholar]
- Cranen B, Schroeter J (1995) Modeling a leaky glottis. J Phon. 10.1016/S0095-4470(95)80040-9 [DOI] [Google Scholar]
- Crighton DG, Dowling AP, Ffowcs-Williams JE et al. (1992) Modern methods in analytical acoustics lecture notes. J Acoust Soc Am. 10.1121/1.404334 [DOI] [Google Scholar]
- Drechsel JS, Thomson SL (2008) Influence of supraglottal structures on the glottal jet exiting a two-layer synthetic, self-oscillating vocal fold model. J Acoust Soc Am. 10.1121/1.2897040 [DOI] [PMC free article] [PubMed] [Google Scholar]
- Elsinga GE, Van Oudheusden BW, Scarano F (2006) Experimental assessment of tomographic-PIV accuracy. In: 13th international symposium on applications of laser techniques to fluid mechanics, Lisbon, Portugal, paper, vol 20 [Google Scholar]
- Fant G (1981) The source filter concept in voice production. STL-QPSR 1:21–37 [Google Scholar]
- Farbos de Luzan C, Chen J, Mihaescu M et al. (2015) Computational study of false vocal folds effects on unsteady airflows through static models of the human larynx. J Biomech 48:1248–1257 [DOI] [PMC free article] [PubMed] [Google Scholar]
- Fulcher L, Lodermeyer A, Kähler G et al. (2019) Geometry of the vocal tract and properties of phonation near threshold: calculations and measurements. Appl Sci. 10.3390/app9132755 [DOI] [Google Scholar]
- Hirschberg A (1992) Some fluid dynamic aspects of speech. Bull Commun Parlée 2:7–30 [Google Scholar]
- Ho CM, Gutmark E (1987) Vortex induction and mass entrainment in a small-aspect-ratio elliptic jet. J Fluid Mech. 10.1017/S0022112087001587 [DOI] [Google Scholar]
- Holmberg EB, Hillman RE, Perkell JS (1989) Glottal airflow and transglottal air pressure measurements for male and female speakers in low, normal, and high pitch. J Voice. 10.1016/S0892-1997(89)80051-7 [DOI] [PubMed] [Google Scholar]
- Howe MS, McGowan RS (2010) On the single-mass model of the vocal folds. Fluid Dyn Res. 10.1088/0169-5983/42/1/015001 [DOI] [PMC free article] [PubMed] [Google Scholar]
- Howe MS, McGowan RS (2011) Production of sound by unsteady throttling of flow into a resonant cavity, with application to voiced speech. J Fluid Mech. 10.1017/S0022112010006117 [DOI] [PMC free article] [PubMed] [Google Scholar]
- Kataoka H, Arii S, Ochiai Y et al. (2007) Analysis of human glottal velocity using hot-wire anemometry and high-speed imaging. Ann Otol Rhinol Laryngol. 10.1177/000348940711600505 [DOI] [PubMed] [Google Scholar]
- Khosla S, Murugappan S, Lakhamraju R, Gutmark E (2008) Using particle imaging velocimetry to measure anterior-posterior velocity gradients in the excised canine larynx model. Ann Otol Rhinol Laryngol. 10.1177/000348940811700212 [DOI] [PMC free article] [PubMed] [Google Scholar]
- Khosla S, Oren L, Ying J, Gutmark E (2014) Direct simultaneous measurement of intraglottal geometry and velocity fields in excised larynges. Laryngoscope. 10.1002/lary.24512 [DOI] [PubMed] [Google Scholar]
- Kniesburges S, Becker S, Mueller S, Delgado A, Link G, Kaltenbacher M, Doellinger M (2008) Experimental study of the fluid-structure-acoustic interaction in a human voice model. J Acoust Soc Am 123(5):3737–3737 [DOI] [PubMed] [Google Scholar]
- Krebs F, Silva F, Sciamarella D, Artana G (2012) A three-dimensional study of the glottal jet. Exp Fluids. 10.1007/s00348-011-1247-3 [DOI] [Google Scholar]
- Lehto L, Airas M, Björkner E et al. (2007) Comparison of two inverse filtering methods in parameterization of the glottal closing phase characteristics in different phonation types. J Voice. 10.1016/j.jvoice.2005.10.007 [DOI] [PubMed] [Google Scholar]
- Lodermeyer A, Becker S, Döllinger M, Kniesburges S (2015) Phase-locked flow field analysis in a synthetic human larynx model. Exp Fluids. 10.1007/s00348-015-1942-6 [DOI] [Google Scholar]
- Lodermeyer A, Tautz M, Becker S et al. (2018) Aeroacoustic analysis of the human phonation process based on a hybrid acoustic PIV approach. Exp Fluids. 10.1007/s003480172469-9 [DOI] [Google Scholar]
- Lucero JC, Lourenço KG, Hermant N et al. (2012) Effect of source-tract acoustical coupling on the oscillation onset of the vocal folds. J Acoust Soc Am. 10.1121/1.4728170 [DOI] [PubMed] [Google Scholar]
- Luo H, Mittal R, Zheng X et al. (2008) An immersed-boundary method for flow-structure interaction in biological systems with application to phonation. J Comput Phys. 10.1016/j.jcp.2008.05.001 [DOI] [PMC free article] [PubMed] [Google Scholar]
- McGowan RS (1988) An aeroacoustic approach to phonation. J Acoust Soc Am 83(2):696–704 [DOI] [PubMed] [Google Scholar]
- McPhail MJ, Campo ET, Krane MH (2019) Aeroacoustic source characterization in a physical model of phonation. J Acoust Soc Am. 10.1121/1.5122787 [DOI] [PMC free article] [PubMed] [Google Scholar]
- Mehta RD (1985) Turbulent boundary layer perturbed by a screen. AIAA J 23:1335–1342 [Google Scholar]
- Monsen RB, Engebretson AM (1977) Study of variations in the male and female glottal wave. J Acoust Soc Am. 10.1121/1.381593 [DOI] [PubMed] [Google Scholar]
- Morel T (1975) Comprehensive design of axisymmetric wind tunnel contractions. J Fluids Eng 97:225. 10.1115/1.3447255 [DOI] [Google Scholar]
- Mylavarapu G, Murugappan S, Mihaescu M et al. (2009) Validation of computational fluid dynamics methodology used for human upper airway flow simulations. J Biomech 42:1553–1559 [DOI] [PubMed] [Google Scholar]
- Neubauer J, Zhang Z, Miraghaie R, Berry DA (2007) Coherent structures of the near field flow in a self-oscillating physical model of the vocal folds. J Acoust Soc Am doi 10(1121/1):2409488. [DOI] [PubMed] [Google Scholar]
- Nielson JR, Daily DJ, Truscott TT et al. (2013) Simultaneous tracking of vocal fold superior surface motion and glottal jet dynamics. 10.1115/IMECE2013-64574 [DOI] [Google Scholar]
- Oren L, Khosla S, Gutmark E (2014) Intraglottal geometry and velocity measurements in canine larynges. J Acoust Soc Am 135:380–388. 10.1121/1.4837222 [DOI] [PMC free article] [PubMed] [Google Scholar]
- Oren L, Gutmark E, Khosla S (2015a) Intraglottal velocity and pressure measurements in a hemilarynx model. J Acoust Soc Am 137:935–943. 10.1121/1.4906833 [DOI] [PMC free article] [PubMed] [Google Scholar]
- Oren L, Khosla S, Dembinski D et al. (2015b) Direct measurement of planar flow rate in an excised canine larynx model. Laryngoscope 125:383–388 [DOI] [PMC free article] [PubMed] [Google Scholar]
- Oren L, Khosla S, Gutmark E (2019) Medial surface dynamics as a function of subglottal pressure in a canine larynx model. J Voice. 10.1016/j.jvoice.2019.07.015 [DOI] [PMC free article] [PubMed] [Google Scholar]
- Pickett TM (1956) Effects of vocal force on the intelligibility of speech sounds. J Acoust Soc Am. 10.1121/1.1908510 [DOI] [Google Scholar]
- Rothenberg M (1973) A new inverse-filtering technique for deriving the glottal air flow waveform during voicing. J Acoust Soc Am. 10.1121/1.1975066 [DOI] [PubMed] [Google Scholar]
- Stevens KN (2000) Acoust Phon 30:55–127 [Google Scholar]
- Sulter AM, Wit HP (1996) Glottal volume velocity waveform characteristics in subjects with and without vocal training, related to gender, sound intensity, fundamental frequency, and age. J Acoust Soc Am 100:3360–3373. 10.1121/1.416977 [DOI] [PubMed] [Google Scholar]
- Sundberg J (1987) The science of the singing voice. University Press, Dekalb [Google Scholar]
- Taylor CJ, Tarbox GJ, Bolster BD et al. (2019) Magnetic resonance imaging-based measurement of internal deformation of vibrating vocal fold models. J Acoust Soc Am. 10.1121/1.5091009 [DOI] [PMC free article] [PubMed] [Google Scholar]
- Titze IR (1988) The physics of small-amplitude oscillation of the vocal folds. J Acoust Soc Am 83:1536–1552 [DOI] [PubMed] [Google Scholar]
- Titze IR (2006) Theoretical analysis of maximum flow declination rate versus maximum area declination rate in phonation. J Speech Lang Hear Res 49:439–447. 10.1044/1092-4388(2006/034) [DOI] [PubMed] [Google Scholar]
- Titze IR (2008) Nonlinear source-filter coupling in phonation: theory. J Acoust Soc Am. 10.1121/1.2832337 [DOI] [PMC free article] [PubMed] [Google Scholar]
- Titze IR, Martin DW (1998) Principles of voice production. J Acoust Soc Am 104:1148. 10.1121/1.424266 [DOI] [Google Scholar]
- Triep M, Brücker C (2010a) Three-dimensional nature of the glottal jet. J Acoust Soc Am. 10.1121/1.3299202 [DOI] [PubMed] [Google Scholar]
- Triep M, Brücker C (2010b) Three-dimensional nature of the glottal jet. J Acoust Soc Am 127:1537–1547 [DOI] [PubMed] [Google Scholar]
- Triep M, Brücker C, Schröder W (2005) High-speed PIV measurements of the flow downstream of a dynamic mechanical model of the human vocal folds. Exp Fluids 39(2):232–245 [Google Scholar]
- Verneuil A, Gerratt BR, Berry DA et al. (2003) Modeling measured glottal volume velocity waveforms. Ann Otol Rhinol Laryngol. 10.1177/000348940311200204 [DOI] [PubMed] [Google Scholar]
- Westerweel J, Scarano F (2005) Universal outlier detection for PIV data. Exp Fluids 10.1007/s00348-005-0016-6 [DOI] [Google Scholar]
- Zhang Z, Neubauer J, Berry DA (2006) The influence of subglottal acoustics on laboratory models of phonation. J Acoust Soc Am. 10.1121/1.2225682 [DOI] [PubMed] [Google Scholar]
- Zheng X, Bielamowicz S, Luo H, Mittal R (2009) A computational study of the effect of false vocal folds on glottal flow and vocal fold vibration during phonation. Ann Biomed Eng 37:625–642. 10.1007/s10439-008-9630-9 [DOI] [PMC free article] [PubMed] [Google Scholar]