

Abstract
The domestication process is associated with substantial phenotypic changes through time. However, although morphological integration between biological structures is purported to have a major influence on the evolution of new morphologies, little attention has been paid to the influence of domestication on the magnitude of integration. Here, we assessed the influence of constraints associated with captivity, considered as one of the crucial first steps in the domestication process, on the integration of cranial and mandibular structures. We investigated the craniomandibular integration in Western European Sus scrofa using three‐dimensional (3D) landmark‐based geometric morphometrics. Our results suggest that captivity is associated with a lower level of integration between the cranium and the mandible. Plastic responses to captivity can thus affect the magnitude of integration of key functional structures. These findings underline the critical need to develop integration studies in the context of animal domestication to better understand the processes accountable for the set‐up of domestic phenotypes through time.
Keywords: cranium, domestication, geometric morphometrics, modularity, morphological integration, skull
Morphological integration between biological structures is purported to have a major influence on the evolution of new morphologies. Here, we assessed the influence of constraints associated with captivity, considered as one of the crucial first steps of the domestication process, on the integration of cranial and mandibular structures in wild boar. Our results suggest that captivity can affect the magnitude of integration of these key functional structures.

1. INTRODUCTION
Domestication is the ongoing process of the intensification of interactions between humans and other animals (Vigne, 2011; Zeder, 2012) associated with substantial phenotypic changes through time (Lord et al., 2020; Sánchez‐Villagra et al., 2016; Zeder, 2015). Identifying the mechanisms responsible for the emergence of domestication is crucial to understand its role in the trajectories of human societies over the last 10,000 years (Zeder, 2018) and the emergence of humans as a new evolutionary selective force (Erlandson & Braje, 2013; Smith & Zeder, 2013). The initial morphological changes associated with the first responsive steps of animal populations to anthropogenic environments, prior to the emergence of selected breeds, are largely unknown and remain unidentified. Controlling the behaviour of wild animals, where they are removed from their natural habitat and moved into an anthropogenic environment, is generally considered as a first step and a catalyst of the domestication process (Vigne, 2015; Zeder, 2015). Previous studies have shown that a lifetime in captivity can induce changes in the functional demands of wild animals (e.g. locomotor, foraging or feeding behaviours), modifying the shape of craniomandibular (Hartstone‐Rose et al., 2014; Neaux et al., 2020; Selvey, 2018) and postcranial bony structures (Harbers et al., 2020; Morimoto et al., 2011; Panagiotopoulou et al., 2019), and that captivity can leave an anatomical print on the musculoskeletal system, beyond the phenotypic variation range observed in animals in their natural habitat.
For a comprehensive understanding of these processes, it is crucial to take into account that morphological structures, such as the cranium and the mandible, may respond to constraints in a coordinated fashion as they are morphologically integrated (Cheverud, 1982; Klingenberg, 2008; Olson & Miller, 1958). This co‐inheritance of character complexes (Cheverud, 1995) has been described as the consequence of shared genetic processes, developmental pathways, functional selective pressures and/or phylogenetic constraints (Marcucio et al., 2011; Martínez‐Abadías et al., 2016; Parsons et al., 2015). Morphological integration, defined as the tendency of different traits to vary jointly in a coordinated manner (Klingenberg, 2008), has been suggested as having a major influence on morphological evolution (Klingenberg, 2005; Schlosser & Wagner, 2004; Wagner & Altenberg, 1996). Indeed, a high degree of covariation between structures (i.e. strong level of integration) channels morphological variation along specific trajectories of shape space, reducing the range of potential phenotypic diversity by constraining evolution along ‘lines of evolutionary least resistance’ (Figure 1a; Goswami & Polly, 2014; Marroig et al., 2004; Schluter, 1996; Wagner et al., 2007). Conversely, a low covariation reduces the constraints on morphological variation. In this case, the evolution of traits is equally possible in all directions of the shape space as the different structures can respond independently to selective forces, increasing the extent of potential phenotypic diversity. A link between environmental factors, acting during the life of an individual, and modifications in the magnitude of integration has been suggested (Cheverud, 1995; Klingenberg, 2014). It has been hypothesised that morphological integration is labile in response to changes in environmental conditions and that the correlations between phenotypic traits can be altered by the environment (Pigliucci & Schlichting, 1998). Indeed, as integration results from the coordinated plastic responses of several traits to variation in environmental factors, it is likely that changes in these factors may cause variation in the magnitude of integration. In this sense, the need for studies disentangling the relationship between morphological changes, due to environmental factors, and the level of integration has already been underlined (Klingenberg, 2014).
FIGURE 1.
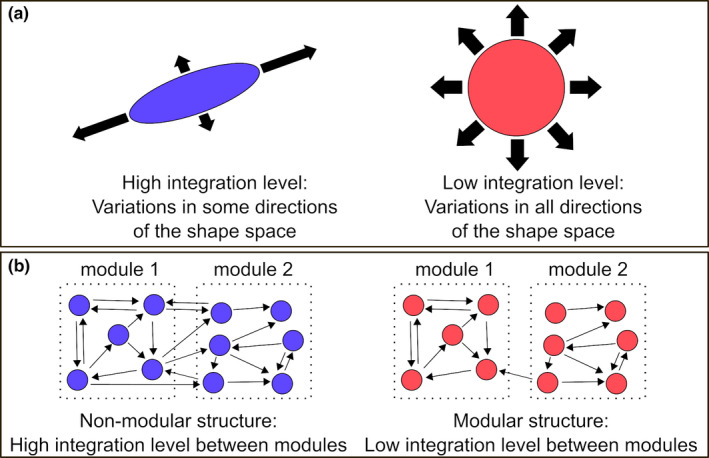
(a) A high integration level channels morphological variation, reducing the range of potential phenotypic diversity. A low integration level minimises constraints on morphological variation, increasing the extent of potential phenotypic diversity. (b) Modularity exists if integration is concentrated within certain parts of a structure (the modules) but is relatively weak between these modules. Modularity therefore means that integration in a structure is compartmentalised, with strong integration within modules and weak integration between modules. Modified after Klingenberg (2008, 2010)
To assess the impact of a lifetime of growth in a captive artificial environment on morphological integration in an ungulate, we used an experimental approach focusing on the skull of wild boar. We collected weaned wild boar piglets from a genetically homogenous population and raised them in a captive anthropogenic environment close to their initial habitat (100 km away). In this experimental farm, the piglets were separated into two groups where their natural foraging behaviour was suppressed (100‐m2 stall with no possibility of foraging) or drastically limited (3000‐m2 pen with limited possibility of foraging due to the lack of space); they were fed primarily on processed dry food pellets, developed for pig farming. We compared the level of morphological integration in the captive wild boar specimens with wild‐caught wild boar populations. The captive wild boar had little possibility to forage and were fed on a diet requiring little mechanical demands. We hypothesised that the constraints of captivity during their growth, by reducing the range of functions performed and relaxing the need for functional integration, may be linked to a significant reduction in the magnitude of integration.
2. MATERIAL AND METHODS
2.1. Material
The dataset was composed of 46 adult European wild boar and pig skulls belonging to four different groups (see Supporting Information Data S1). We chose specimens from a limited region (i.e. Western Europe) to reduce the confounding effects of geographic and climate‐induced morphological variation known to exist in Sus scrofa (Albarella et al., 2009). The first two groups consisted of wild boar from the DOMEXP project: a multidisciplinary experiment aiming to assess the effect of captivity on the musculoskeletal system (http://anr‐domexp.cnrs.fr/). To test the plastic response of mobility reduction on the shape of a wild ungulate skull, we relied on a control population of wild boar living in a 100,000‐m2 fenced forest in Urciers (France). From this population, we sampled 24 piglets that were divided into two groups of 12 specimens of equal sex ratio (six males and six females). These groups were raised from 6 to 24 months at the Zoological Reserve of La Haute Touche (France) in two different contexts of mobility reduction: an indoor stall of 100 m2 (‘stall–captive’ group) offering no possibility of natural foraging and a 3000‐m2 wooded pen (‘enclosure–captive’ group) with only limited natural foraging possible. We supplied both groups with the same processed dry food pellets, including 15.5% of raw protein adapted for pig diets. This experiment received ethics approval from the French Ministère de l'Enseignement Supérieur et de la Recherche (APAFIS#5353‐201605111133847). The relatively small sample sizes for the ‘stall–captive’ and the ‘enclosure–captive’ groups are inherent to the experimental nature of the study. As sample size can affect the results of integration studies (Bookstein et al., 2003; Rohlf & Corti, 2000), we choose to use similar sample sizes for the other studied groups. In addition to the two captive groups, we also sampled adult free‐ranging specimens (‘wild‐caught’ group). This group included four individuals from the initial free‐ranging herd of Urciers (i.e. the same population as the captive ones). These specimens came from a wild boar farm, where human interactions are intentionally kept to a minimum in order to ensure that the behaviour of the wild boar remains as natural as possible. They are free to forage for food in the woods. In addition to the specimens of the DOMEXP project, the ‘wild‐caught’ group also included seven free‐ranging wild boar from the same geographic and climatic environment (i.e. temperate central France) as the DOMEXP specimens. Like most wild boar in Western Europe, these free‐ranging specimens had an omnivorous diet consisting mostly of vegetable foods, for example, acorns, roots and crops (Schley & Roper, 2003). All these specimens were wild‐caught between 1 and 2 years of age. We included a fourth group of long‐term domesticated populations of German, Polish and French Landrace pigs (‘Landrace’ group), that is, locally adapted traditional breeds (Negri et al., 2009). They were raised in stalls, with a strong mobility reduction, and were between 1 and 9 years of age.
2.2. Data acquisition and analyses
We used 94 homologous landmarks and 67 semilandmarks placed on three‐dimensional (3D) surfaces to describe the cranial and mandibular shape (Supporting Information Data S2). We digitised the anatomical landmarks and semilandmarks using IDAV Landmark v3.0 software (Wiley et al., 2005). We performed all the analyses in the R environment (R Core Team, 2019). To remove variation related to their initial arbitrary position along the curves, the semilandmarks were slid along the tangent of the curves, minimising bending energy (Gunz & Mitteroecker, 2013). These were then superimposed with the fixed landmarks using a generalised Procrustes superimposition (Rohlf & Slice, 1990), implemented in the gpagen function of the package ‘geomorph’ (Adams et al., 2019) to obtain a new set of shape variables (Procrustes coordinates) and the centroid size (CS). The cranial and mandibular landmarks were subject to separate Procrustes superimpositions in order to avoid the increase of covariance and spurious results (Cardini, 2018).
Allometry is known to significantly affect the level of morphological integration as size‐dependent shape changes contribute to produce integration between structures (Klingenberg & Marugán‐Lobón, 2013); therefore, we performed Procrustes ANOVAs (Klingenberg & McIntyre, 1998) with permutation procedures to quantify the allometry, with size computed as the decimal logarithm of CS (log CS; Collyer et al., 2015). This test was performed with the procD.lm function of the package ‘geomorph’ (Adams et al., 2019). We also tested the difference between the allometric slopes of the studied groups. Assuming that these differences were not significant, all the following analyses were computed on both the raw shape data and on size‐corrected shape data, which are the residuals from the global multivariate regression of the shape against log CS, to account for the effect of allometry (Monteiro, 1999).
We performed a principal component analysis (PCA) using gm.prcomp (‘geomorph’) on all groups to assess the overall morphological variation and the distribution of individuals in the shape space. We evaluated the significance of shape differences among groups by performing a Procrustes ANOVA on aligned Procrustes coordinates using procD.lm.
To quantify the shape covariation, partial least squares (PLS) analyses (Bookstein, 1991; Rohlf & Slice, 1990) and covariance ratios (CR; Adams, 2016; Adams & Collyer, 2016) were used jointly, as recommended by Adams (2016). We quantified the covariation as a proxy for the integration of cranium and mandible for each pair of axes by a correlation coefficient rPLS using integration.test (‘geomorph’). This coefficient is supported by a permutation test for the null hypothesis that the distribution of specimens on one axis has no bearing on the distribution of the other axis. We computed the heatmap of shape deformations along the PLS axes to assess the location and the intensity of covariations using meshDist from the ‘Morpho’ package (Schlager & Jefferis, 2020). In addition, differences in integration patterns were assessed by examining the general orientation of each group's distribution on the PLS scores (Mitteroecker & Bookstein, 2008; Neaux, 2017; Singh et al., 2012). For this purpose, we tested for differences in the regression slopes between the studied groups on the between‐group PLS. We assessed the overall modularity between cranium and mandible modules using the CR from modularity.test (‘geomorph’). Modularity exists if integration is compartmentalised, that is, concentrated within certain parts of a structure (the modules) but relatively weak between modules (Figure 1b; see Supporting Information Data S3). The value of CR provides a measure for characterising and evaluating the degree of modularity in biological datasets (Adams, 2016; Adams & Collyer, 2016). Morphological integration and modularity were assessed including all groups (between‐group covariation) and within groups (within‐group covariation).
3. RESULTS
3.1. Variation analyses
Allometry explains nearly 20% of the shape variation in the cranium (p < 0.01; 19.74% of the total variance) and the mandible (p < 0.01; 17.39% of the total variance). The allometric slopes did not differ between the studied groups for the cranium (p = 0.44) or the mandible (p = 0.16). In addition to raw shape, we computed the size‐corrected shape variables for further analyses. On the PCA, PC1 accounted for 56.41% and 31.24% of the total variance for the cranium and mandible respectively (Supporting Information Data S4). For both structures, PC1 was driven by the strong divergence between the wild boar phenotype towards the negative side of the axis and the Landrace pigs towards the positive side. For the cranium, PC2 mainly separates the wild‐caught from the captive wild boar. It is noteworthy that the plastic effect displayed on PC2 is different from the shape divergence between the wild boar and pigs, displayed on PC1, as the two shape changes are located on different PCs. We found significant (p < 0.05) pairwise differences of raw cranial shapes between all groups and the ‘Landrace’ but not between the wild boar groups (Supporting Information Data S4). We found the same results for the allometry‐free cranial shapes. We found significant (p < 0.05) pairwise differences of mandibular raw shapes between all groups except between the ‘stall–captive’ and ‘enclosure–captive’ groups. For the allometry‐free mandibular shapes, the difference between the ‘stall–captive’ and the ‘wild‐caught’ groups was also not significant.
3.2. Between‐group covariation analyses
The correlation coefficient of the first pair of PLS axes (PLS1) between the cranium and the mandible for all the studied specimens is strong and significant for raw (rPLS = 0.89; p < 0.01; Table 1, Figure 2a) and allometry‐free shapes (rPLS = 0.88; p < 0.01). The PLS1 pairs of axes account, respectively, for 86.65% and 92.67% of the total covariation. The main deformation associated with PLS1 is located in the anterior part of the nasal, in the nuchal crest region, in the zygomatic process of the frontal and in the tip of paroccipital processes for the cranium (Figure 2b). For the mandible, they are visible in the maximum of curvature between the mandibular ramus and corpus, in the inner part of the gonial angle region, on the insertion of the lower canines and on the ventral part of the symphysis. The regression slopes between the studied groups were not different between the studied groups for the cranium (p = 0.44) or the mandible (p = 0.16) between‐group PLS 1. The CR values for all the studied specimens indicate a significant modularity between the cranium and mandible for raw (CR = 0.81; p < 0.01; Table 1) and allometry‐free shapes (CR = 0.70; p < 0.01).
TABLE 1.
Values of PLS, covariance ratios and coefficients for raw shapes and allometry‐free shapes. rPLS: PLS coefficient of the first pair of PLS axes, %EC: percentage of covariation explained by the first pair of PLS axes, CR: Covariance Ratio
| rPLS | p‐value | %EC | CR | p‐value | |
|---|---|---|---|---|---|
| Raw shapes | |||||
| All groups | 0.89 | <0.01 | 85.65 | 0.81 | <0.01 |
| Stall – captive | 0.82 | 0.51 | 59.33 | 0.71 | <0.01 |
| Enclosure – captive | 0.89 | 0.04 | 76.74 | 0.84 | <0.01 |
| Wild‐caught | 0.97 | <0.01 | 72.86 | 0.95 | <0.01 |
| Landrace | 0.88 | 0.06 | 69.31 | 0.81 | <0.01 |
| Allometry free‐shapes | |||||
| All groups | 0.88 | <0.01 | 92.67 | 0.70 | <0.01 |
| Stall – captive | 0.89 | 0.29 | 56.90 | 0.88 | <0.01 |
| Enclosure – captive | 0.88 | 0.04 | 76.90 | 0.84 | <0.01 |
| Wild‐caught | 0.97 | <0.01 | 56.14 | 0.97 | <0.01 |
| Landrace | 0.84 | 0.52 | 32.16 | 0.88 | <0.01 |
Significant values (p < 0.05) are in bold.
FIGURE 2.
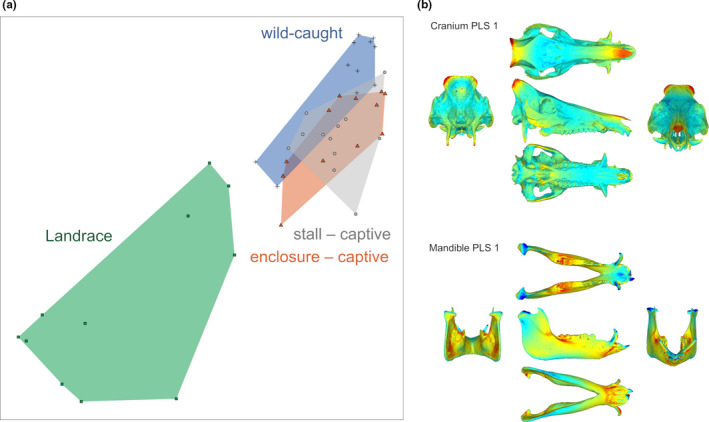
(a) First pair of partial least squares analysis axes (PLS1) between cranial and mandibular shape for all specimens. (b) Heatmap of the intensity of shape covariation on PLS 1; blue indicates a low intensity of covariation and red indicates a high intensity of covariation
3.3. Within‐group covariation analyses
The PLS computed for each studied group showed a significant level of integration for the ‘enclosure–captive’ (rPLS = 0.89; p = 0.04) and ‘wild‐caught’ (rPLS = 0.97; p < 0.01) groups for raw shapes (Table 1) and allometry‐free shapes (rPLS = 0.88; p = 0.04; rPLS = 0.97; p < 0.01). The correlation coefficients of PLS1 are not significant for the ‘stall–captive’ and ‘Landrace’ groups. The main deformation associated with PLS1 includes important changes in the anterior extremity of the rostrum, the occipital region, the lateral side of the ramus and the symphysis region for both the ‘enclosure–captive’ (Figure 3a) and ‘wild‐caught’ (Figure 3b) groups. Deformations include changes in the ventral edge of the zygomatic arch and in the pterygoid fossa region for the ‘wild‐caught’ group. The CR values for all the studied groups indicate a significant modularity between the cranium and the mandible (Table 1).
FIGURE 3.
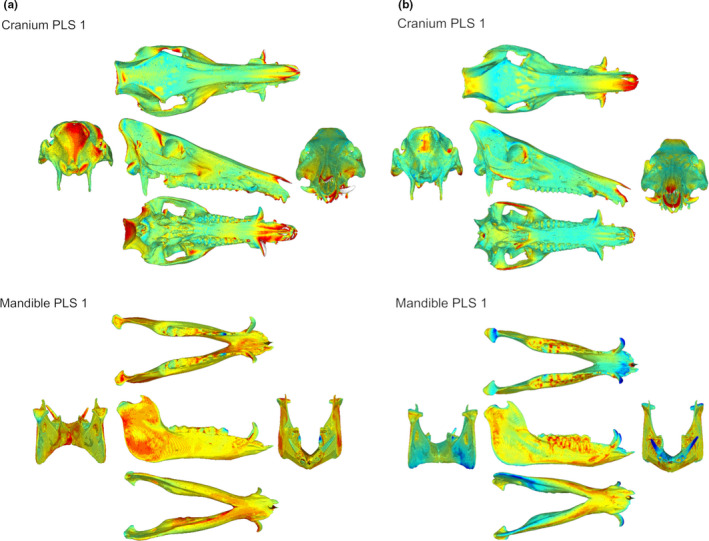
Heatmap of the shape covariation intensity of partial least squares analysis axes (PLS 1) for (a) the enclosure – captive’ group and (b) the ‘wild‐caught’ group. Blue indicates a low intensity of covariation and red indicates a high intensity of covariation
4. DISCUSSION
Our analyses confirm that captivity imposed on wild boar during their growth is linked to a reduction in the magnitude of integration. The results obtained from allometry‐free shape data reveal similar tendencies, indicating a relatively low impact of allometry on patterns of covariation. This result underlines that changes in environmental factors can affect the magnitude of integration. Previous results on the same experimental sample (DOMEXP project) found that the shape of cranium and mandible are affected by changes in the functional demands associated with captivity (Neaux et al., 2020). Indeed, modifications in foraging and feeding behaviours have been identified as potential factors able to modify skull shape. Furthermore, morphological integration between the cranium and the mandible is considered as a classic example of functional integration, where two structures interact in the same functional context (Klingenberg, 2014). Indeed, the upper and lower jaws need to be coordinated to achieve proper occlusion and perform functions, such as biting and chewing (Figueirido et al., 2013; Hautier et al., 2012). Therefore, our results show that captivity, inducing changes in foraging and feeding behaviour which likely reduce the need for functional integration (Neaux et al., 2020), also diminishes the magnitude of integration between the cranium and the mandible, that is, the structures performing these functions. In this sense, several studies have empirically shown that morphological integration can be highly variable over short timescales in response to environmental changes acting on shared developmental and functional processes (Beldade et al., 2002; Monteiro & Nogueira, 2010; Young & Hallgrímsson, 2005). In our study, most of the wild‐caught and captive wild boar groups did not display significant differences in terms of shape disparity. This similarity underlines that though captivity modifies functional demands in wild animals (Harbers et al., 2020; Hartstone‐Rose et al., 2014; Neaux et al., 2020), it does not affect their potential range of morphological variation.
Our analyses also showed that, as for the group of captive wild boar raised in a stall, integration is also not significant for the group composed of Landrace pigs. These traditional breeds of pigs share several features with the captive wild boar from our experiment. They were given daily rations, mainly composed of agricultural products and food waste, allowing the relaxation of environmental constraints associated with the necessity to find and process food. This relaxation in one of the main functions performed together by the cranium and mandible (i.e. mastication) may result in a weaker morphological integration between these structures in Landrace pigs, as well as in captive wild boar raised in a stall. Furthermore, these two groups share the impossibility to perform foraging and rooting as they were both raised in stalls, that is, on artificial solid grounds. When possible, foraging and rooting are activities that both wild boar (Blasetti et al., 1988) and pigs (Buckner et al., 1998) spend a lot of time doing. Modifications in rooting frequency, impacting the development of the muscles in the neck regions, may be associated with changes in cranial shape (Owen et al., 2014). Therefore, the impossibility for both captive wild boar raised in a stall and Landrace pigs to perform such functions may also explain the non‐significant integration between the cranium and the mandible observed in these two groups. This confirms that a reduction in the range of functions available is linked to a significant reduction in the magnitude of integration. Although we found differences in the integration level between the studied groups, we did not find differences in integration patterns, suggesting that changes in constraints due to captivity affect the level of covariation between structures but not the way they covary. This result was expected, as previous studies have shown that integration patterns are fairly conservative, even at high taxonomic levels (Goswami, 2006; Neaux et al., 2018; Porto et al., 2009).
For both the between‐group and within‐group analyses, we also found significant modularity between the cranium and the mandible, corroborating the presence of two basic independent phenotypic modules in the skull (one cranial and one mandibular). The modularity between the cranium and mandible is likely explained by their respective functional roles. Indeed, whereas the morphology of the mandible is closely related to feeding behaviour (Anderson et al., 2014; Daegling & McGraw, 2007; Taylor, 2006), the shape of the cranium is also affected by a multiplicity of other functions unrelated to food consumption (e.g. vision, respiration, mastication and brain protection; Lieberman, 2011). Our results confirm that even if the cranium and the mandible can be considered as two distinct modules (i.e. integration is stronger within these structures than between them), there is still a significant relationship between them, at least in our between‐group analysis, which can be defined as intermodule integration (Klingenberg, 2013).
5. CONCLUSION
Our results support the hypothesis that behavioural changes associated with captivity, considered a catalyst of the animal domestication process (Vigne, 2015; Zeder, 2015), do result in a reduction of the integration between the cranium and the mandible. However, this work will need to be expanded further using a greater dataset, as the relatively small sample size, inherent to the experimental nature of our study, could have partly biased these results (Thiese et al., 2016). Further studies would also help confirm our results that a weak integration could be the morphological response to anthropogenic changes in the functional demands associated with captivity, constituting possible future new markers for the domestication process that could be explored in the archaeological record.
AUTHOR CONTRIBUTIONS
DN, AH, VD and TC designed the research. BB, KO, YL and TC conducted the experimental fieldwork. RS and TC collected the CT data. DN carried out the GMM analyses and interpreted the data with TC and VD. DN led the manuscript with scientific and editorial input from RS, AH, VD and TC. All authors gave final approval for publication.
Supporting information
Supplementary Material
ACKNOWLEDGEMENTS
We are most grateful to the staff of the Réserve Zoologique de la Haute‐Touche (Christophe Audureau, Jérémy Bernard, Christophe Jubert, Sandrine Laloux, Emmanuel Maréchal, Régis Rabier, Patrick Roux and Colin Vion) for their help during the set‐up of the experimental structures and the care they provided to the experimental specimens and during the data acquisition. We thank the CIRE platform at INRAE (Hans Adriensen, Frédéric Elbout, Christian Moussu and Luc Perrigouard), CT teams from the Leibniz‐IZW in Berlin (Guido Fritsch and Juliane Kühne) and the University Hospital Halle/Saale (Silvio Brandt). We would like to thank Jill Cucchi for copy editing this manuscript. We are grateful to two anonymous reviewers for their valuable comments and advice on an earlier version of the manuscript. This research was funded by ANR through the DOMEXP project (ANR‐13‐JSH3‐0003‐01), the LabEx ANR‐10‐LABX‐0003‐BCDiv, in the programme ‘Investissements d’avenir’ ANR‐11‐IDEX‐0004‐02, programme Emergence SU‐19‐3‐EMRG‐02, Muséum national d’Histoire naturelle (Paris) and the CNRS INEE institute. We have no conflict of interest to declare.
Contributor Information
Dimitri Neaux, Email: dimitrineaux@gmail.com.
Thomas Cucchi, Email: thomas.cucchi@mnhn.com.
DATA AVAILABILITY STATEMENT
The data that support the findings of this study are available from the corresponding authors upon reasonable request.
REFERENCES
- Adams, D.C. (2016) Evaluating modularity in morphometric data: challenges with the RV coefficient and a new test measure. Methods in Ecology and Evolution, 7, 565–572. [Google Scholar]
- Adams, D.C. & Collyer, M.L. (2016) On the comparison of the strength of morphological integration across morphometric datasets. Evolution, 70, 2623–2631. [DOI] [PubMed] [Google Scholar]
- Adams, D.C. , Collyer, M. & Kaliontzopoulou, A. (2019) Geomorph: geometric morphometric analyses of 2D/3D landmark data. [Google Scholar]
- Albarella, U. , Dobney, K. & Rowley‐Conwy, P. (2009) Size and shape of the Eurasian wild boar (Sus scrofa), with a view to the reconstruction of its Holocene history. Environmental Archaeology, 14, 103–136. [Google Scholar]
- Anderson, P.S. , Renaud, S. & Rayfield, E.J. (2014) Adaptive plasticity in the mouse mandible. BMC Evolutionary Biology, 14, 85. [DOI] [PMC free article] [PubMed] [Google Scholar]
- Beldade, P. , Koops, K. & Brakefield, P.M. (2002) Developmental constraints versus flexibility in morphological evolution. Nature, 416, 844–847. [DOI] [PubMed] [Google Scholar]
- Blasetti, A. , Boitani, L. , Riviello, M.C. & Visalberghi, E. (1988) Activity budgets and use of enclosed space by wild boars (Sus scrofa) in captivity. Zoo Biology, 7, 69–79. [Google Scholar]
- Bookstein, F.L. (1991) Morphometric Tools for Landmark Data: Geometry and Biology. Cambridge, UK: Cambridge University Press. [Google Scholar]
- Bookstein, F.L. , Gunz, P. , Mitterœcker, P. , Prossinger, H. , Schæfer, K. & Seidler, H. (2003) Cranial integration in Homo: Singular warps analysis of the midsagittal plane in ontogeny and evolution. Journal of Human Evolution, 44, 167–187. [DOI] [PubMed] [Google Scholar]
- Buckner, L.J. , Edwards, S.A. & Bruce, J.M. (1998) Behaviour and shelter use by outdoor sows. Applied Animal Behaviour Science, 57, 69–80. [Google Scholar]
- Cardini, A. (2018) Integration and modularity in procrustes shape data: Is there a risk of spurious results? Evolutionary Biology, 46, 90–105. [Google Scholar]
- Cheverud, J.M. (1982) Phenotypic, genetic, and environmental morphological integration in the cranium. Evolution, 36, 499–516. [DOI] [PubMed] [Google Scholar]
- Cheverud, J.M. (1995) Morphological integration in the saddle‐back tamarin (Saguinus fuscicollis) cranium. The American Naturalist, 145, 63–89. [Google Scholar]
- Collyer, M.L. , Sekora, D.J. & Adams, D.C. (2015) A method for analysis of phenotypic change for phenotypes described by high‐dimensional data. Heredity, 115, 357–365. [DOI] [PMC free article] [PubMed] [Google Scholar]
- Daegling, D.J. & McGraw, W.S. (2007) Functional morphology of the mangabey mandibular corpus: Relationship to dental specializations and feeding behavior. American Journal of Physical Anthropology, 134, 50–62. [DOI] [PubMed] [Google Scholar]
- Erlandson, J.M. & Braje, T.J. (2013) Archeology and the Anthropocene. Anthropocene, 4, 1–7. [Google Scholar]
- Figueirido, B. , Tseng, Z.J. & Martín‐Serra, A. (2013) Skull shape evolution in durophagous carnivorans. Evolution, 67, 1975–1993. [DOI] [PubMed] [Google Scholar]
- Goswami, A. (2006) Morphological integration in the carnivoran skull. Evolution, 60, 169–183. [PubMed] [Google Scholar]
- Goswami, A. & Polly, P.D. (2014) The macroevolutionary consequences of phenotypic integration: from development to deep time. Philosophical Transactions of the Royal Society of London. Series B, Biological sciences, 369, 20130254. [DOI] [PMC free article] [PubMed] [Google Scholar]
- Gunz, P. & Mitteroecker, P. (2013) Semilandmarks: a method for quantifying curves and surfaces. Hystrix, the Italian Journal of Mammalogy, 24, 103–109. [Google Scholar]
- Harbers, H. , Neaux, D. , Ortiz, K. , Blanc, B. , Laurens, F. , Baly, B. et al. (2020) The mark of captivity: plastic responses in the ankle bone of a wild ungulate (Sus scrofa). Royal Society Open Science, 7, 192039. [DOI] [PMC free article] [PubMed] [Google Scholar]
- Hartstone‐Rose, A. , Selvey, H. , Villari, J.R. , Atwell, M. & Schmidt, T. (2014) The three‐dimensional morphological effects of captivity. PLoS One, 9, e113437. [DOI] [PMC free article] [PubMed] [Google Scholar]
- Hautier, L. , Lebrun, R. & Cox, P.G. (2012) Patterns of covariation in the masticatory apparatus of hystricognathous rodents: implications for evolution and diversification. Journal of Morphology, 273, 1319–1337. [DOI] [PubMed] [Google Scholar]
- Klingenberg, C.P. (2005) Developmental constraints, modules, and evolvability. In: Hallgrímsson, B. and Hall, B.K. (Eds.) Variation: A central concept in biology. Amsterdam: pp. 1–30. [Google Scholar]
- Klingenberg, C.P. (2008) Morphological integration and developmental modularity. Annual review of ecology, evolution, and systematics, 39, 115–132. [Google Scholar]
- Klingenberg, C.P. (2010) Evolution and development of shape: integrating quantitative approaches. Nature Reviews Genetics, 11, 623–635. [DOI] [PubMed] [Google Scholar]
- Klingenberg, C.P. (2013) Cranial integration and modularity: insights into evolution and development from morphometric data. Hystrix, the Italian Journal of Mammalogy, 24, 43–58. [Google Scholar]
- Klingenberg, C.P. (2014) Studying morphological integration and modularity at multiple levels: concepts and analysis. Philosophical Transactions of the Royal Society B: Biological Sciences, 369, 20130249. [DOI] [PMC free article] [PubMed] [Google Scholar]
- Klingenberg, C.P. & Marugán‐Lobón, J. (2013) Evolutionary covariation in geometric morphometric data: Analyzing integration, modularity, and allometry in a phylogenetic context. Systematic Biology, 62, 591–610. [DOI] [PubMed] [Google Scholar]
- Klingenberg, C.P. & McIntyre, G.S. (1998) Geometric morphometrics of developmental instability: Analyzing patterns of fluctuating asymmetry with Procrustes methods. Evolution, 52, 1363–1375. [DOI] [PubMed] [Google Scholar]
- Lieberman, D.E. (2011) The Evolution of the Human Head. Cambridge: Harvard University Press. [Google Scholar]
- Lord, K.A. , Larson, G. , Coppinger, R.P. & Karlsson, E.K. (2020) The history of farm foxes undermines the animal domestication syndrome. Trends in Ecology & Evolution, 35, 125–136. [DOI] [PubMed] [Google Scholar]
- Marcucio, R.S. , Young, N.M. , Hu, D. & Hallgrimsson, B. (2011) Mechanisms that underlie co‐variation of the brain and face. Genesis, 49, 177–189. [DOI] [PMC free article] [PubMed] [Google Scholar]
- Marroig, G. , De Vivo, M. & Cheverud, J.M. (2004) Cranial evolution in sakis (Pithecia, Platyrrhini). II: Evolutionary processes and morphological integration. Journal of Evolutionary Biology, 17, 144–155. [DOI] [PubMed] [Google Scholar]
- Martínez‐Abadías, N. , Esparza, M. , Sjøvold, T. & Hallgrímsson, B. (2016) Chondrocranial growth, developmental integration and evolvability in the human skull. In: Boughner, J.C. and Rolian, C. (Eds.) Developmental approaches to human evolution. Hoboken: Wiley, pp. 17–34. [Google Scholar]
- Mitteroecker, P. & Bookstein, F. (2008) The evolutionary role of modularity and integration in the hominoid cranium. Evolution, 62, 943–958. [DOI] [PubMed] [Google Scholar]
- Monteiro, L.R. (1999) Multivariate regression models and geometric morphometrics: the search for causal factors in the analysis of shape. Systematic Biology, 48, 192–199. [DOI] [PubMed] [Google Scholar]
- Monteiro, L.R. & Nogueira, M.R. (2010) Adaptive radiations, ecological Specialization, and the evolutionary integration of complex morphological structures. Evolution, 64, 724–744. [DOI] [PubMed] [Google Scholar]
- Morimoto, N. , Ponce de León, M. & Zollikofer, C.P.E. (2011) Exploring femoral diaphyseal shape variation in wild and captive chimpanzees by means of morphometric mapping: a yest of Wolff’s law. The Anatomical Record, 294, 589–609. [DOI] [PubMed] [Google Scholar]
- Neaux, D. (2017) Morphological integration of the cranium in Homo, Pan, and Hylobates and the evolution of hominoid facial structures. American Journal of Physical Anthropology, 162, 732–746. [DOI] [PubMed] [Google Scholar]
- Neaux, D. , Blanc, B. , Ortiz, K. , Locatelli, Y. , Laurens, F. , Baly, I. et al. (2020) How changes in functional demands associated with captivity affect the skull shape of a wild boar (Sus scrofa). Evolutionary Biology. [Google Scholar]
- Neaux, D. , Sansalone, G. , Ledogar, J.A. , Ledogar, S.H. , Luk, T.H. , Wroe, S. (2018) Basicranium and face: assessing the impact of morphological integration on primate evolution. Journal of Human Evolution, 118, 43–55. [DOI] [PubMed] [Google Scholar]
- Negri, V. , Maxted, N. & Veteläinen, M. (2009) European landrace conservation: An introduction. In: Veteläinen, M. , Negri, V. and Maxted, N. (Eds.) European Landraces: On‐farm Conservation, Management and Use. Rome, Italy: Biodiversity International, pp. 1–22. [Google Scholar]
- Olson, E.C. & Miller, R.L. (1958) Morphological Integration. Chicago, IL: University of Chicago Press. [Google Scholar]
- Owen, J. , Dobney, K. , Evin, A. , Cucchi, T. , Larson, G. , Vidarsdottir, U. (2014) The zooarchaeological application of quantifying cranial shape differences in wild boar and domestic pigs (Sus scrofa) using 3D geometric morphometrics. Journal of Archaeological Science, 43, 159–167. [Google Scholar]
- Panagiotopoulou, O. , Pataky, T.C. & Hutchinson, J.R. (2019) Foot pressure distribution in White Rhinoceroses (Ceratotherium simum) during walking. PeerJ, 7, e6881. [DOI] [PMC free article] [PubMed] [Google Scholar]
- Parsons, T.E. , Downey, C.M. , Jirik, F.R. , Hallgrimsson, B. , Jamniczky, H.A. (2015) Mind the gap: genetic manipulation of basicranial growth within synchondroses modulates calvarial and facial shape in mice through epigenetic interactions. PLoS One, 10, e0118355. [DOI] [PMC free article] [PubMed] [Google Scholar]
- Pigliucci, M. & Schlichting, C. (1998) Phenotypic Evolution: A Reaction Norm Perspective. Sunderland, MA: Sinauer Associates Inc. [Google Scholar]
- Porto, A. , de Oliveira, F.B. , Shirai, L.T. , Marroig, G. (2009) The evolution of modularity in the mammalian skull I: morphological integration patterns and magnitudes. Evolutionary Biology, 36, 118–135. [Google Scholar]
- R Core Team (2019) R: A language and environment for statistical computing. Vienna: Austria. [Google Scholar]
- Rohlf, F.J. & Corti, M. (2000) Use of two‐block partial least‐squares to study covariation in shape. Systematic Biology, 49, 740–753. [DOI] [PubMed] [Google Scholar]
- Rohlf, F.J. & Slice, D. (1990) Extensions of the Procrustes method for the optimal superimposition of landmarks. Systematic Biology, 39, 40–59. [Google Scholar]
- Sánchez‐Villagra, M.R. , Geiger, M. & Schneider, R.A. (2016) The taming of the neural crest: a developmental perspective on the origins of morphological covariation in domesticated mammals. R Soc Open Sci, 3, 160107. [DOI] [PMC free article] [PubMed] [Google Scholar]
- Schlager, S. & Jefferis, G. (2020) Morpho: calculations and visualisations related to geometric morphometrics. [Google Scholar]
- Schley, L. & Roper, T.J. (2003) Diet of wild boar Sus scrofa in Western Europe, with particular reference to consumption of agricultural crops. Mammal Review, 33, 43–56. [Google Scholar]
- Schlosser, G. & Wagner, G.P. (2004) Modularity in Development and Evolution. Chicago: University of Chicago Press. [Google Scholar]
- Schluter, D. (1996) Adaptive radiation along genetic lines of least resistance. Evolution, 50, 1766–1774. [DOI] [PubMed] [Google Scholar]
- Selvey, H. (2018) Cranial responses to captivity in Lemur catta and Propithecus verreauxi in natural history museum collections. Anthropology Graduate Theses & Dissertations, 72. [Google Scholar]
- Singh, N. , Harvati, K. , Hublin, J.‐J. & Klingenberg, C.P. (2012) Morphological evolution through integration: a quantitative study of cranial integration in Homo, Pan, Gorilla and Pongo. Journal of Human Evolution, 62, 155–164. [DOI] [PubMed] [Google Scholar]
- Smith, B.D. & Zeder, M.A. (2013) The onset of the Anthropocene. Anthropocene, 4, 8–13. [Google Scholar]
- Taylor, A.B. (2006) Feeding behavior, diet, and the functional consequences of jaw form in orangutans, with implications for the evolution of Pongo. Journal of Human Evolution, 50, 377–393. [DOI] [PubMed] [Google Scholar]
- Thiese, M.S. , Ronna, B. & Ott, U. (2016) P value interpretations and considerations. Journal of Thoracic Disease, 8, 928–931. [DOI] [PMC free article] [PubMed] [Google Scholar]
- Vigne, J.‐D. (2011) The origins of animal domestication and husbandry: a major change in the history of humanity and the biosphere. Comptes Rendus Biologies, 334, 171–181. [DOI] [PubMed] [Google Scholar]
- Vigne, J.‐D. (2015) Early domestication and farming: what should we know or do for a better understanding? Anthropozoologica, 50, 123–150. [Google Scholar]
- Wagner, G.P. & Altenberg, L. (1996) Perspective: complex adaptations and the evolution of evolvability. Evolution, 50, 967–976. [DOI] [PubMed] [Google Scholar]
- Wagner, G.P. , Pavlicev, M. & Cheverud, J.M. (2007) The road to modularity. Nature Reviews Genetics, 8, 921–931. [DOI] [PubMed] [Google Scholar]
- Wiley, D. , Amenta, N. , Alcantara, D. , Alcantara, D.A. , Ghosh, D. , Kil, Y.J. et al. (2005) Evolutionary Morphing. In Proceedings of IEEE visualization 2005. VIS’05. Minneapolis, MN: IEEE, pp. 431–438. [Google Scholar]
- Young, N.M. & Hallgrímsson, B. (2005) Serial homology and the evolution of mammalian limb covariation structure. Evolution, 59, 2691–2704. [PubMed] [Google Scholar]
- Zeder, M.A. (2012) The domestication of animals. Journal of Anthropological Research, 68, 161–190. [Google Scholar]
- Zeder, M.A. (2015) Core questions in domestication research. Proceedings of the National Academy of Sciences of the United States of America, 112, 3191–3198. [DOI] [PMC free article] [PubMed] [Google Scholar]
- Zeder, M.A. (2018) Why evolutionary biology needs anthropology: Evaluating core assumptions of the extended evolutionary synthesis. Evolutionary Anthropology, 27, 267–284. [DOI] [PubMed] [Google Scholar]
Associated Data
This section collects any data citations, data availability statements, or supplementary materials included in this article.
Supplementary Materials
Supplementary Material
Data Availability Statement
The data that support the findings of this study are available from the corresponding authors upon reasonable request.