

Abstract
Non-human primates infected with SARS-CoV-2 exhibit mild clinical signs. Here we used a mathematical model to characterize in detail the viral dynamics in 31 cynomolgus macaques for which nasopharyngeal and tracheal viral load were frequently assessed. We identified that infected cells had a large burst size (>104 virus) and a within-host reproductive basic number of approximately 6 and 4 in nasopharyngeal and tracheal compartment, respectively. After peak viral load, infected cells were rapidly lost with a half-life of 9 hours, with no significant association between cytokine elevation and clearance, leading to a median time to viral clearance of 10 days, consistent with observations in mild human infections. Given these parameter estimates, we predict that a prophylactic treatment blocking 90% of viral production or viral infection could prevent viral growth. In conclusion, our results provide estimates of SARS-CoV-2 viral kinetic parameters in an experimental model of mild infection and they provide means to assess the efficacy of future antiviral treatments.
Author summary
Non-human primates infected with SARS-CoV-2 develop a mild infection resembling asymptomatic human infection. Here we used viral dynamic modelling to characterize the nasopharyngeal and tracheal viral loads. We found that viral load rapidly declined after peak viral load despite the absence of association between model parameters and immune markers. The within-host reproductive basic reproduction number was approximately equal to 6 and 4 in nasopharynx and trachea suggesting that a prophylactic therapy blocking viral entry or production with 90% efficacy could be sufficient to prevent viral growth and peak viral load.
Introduction
The severe acute respiratory syndrome coronavirus 2 (SARS-CoV-2) which originated in Wuhan, China, at the end of December 2019, has spread rapidly around the world, resulting at the end of December 2020 in more than 1,600,000 deaths [1]. Fortunately, the majority of infections do not lead to hospitalizations [2], and the vast majority of subjects infected with SARS-CoV-2 will experience asymptomatic or pauci-symptomatic infection characterized by specific (anosmia) or general symptoms (fever, fatigue) [3–5]. In other acute or chronic viral diseases (HIV, HCV, influenza), the characterization of viral load kinetics has played an important role to understand the pathogenesis of the virus and design better antiviral drugs [6–8]. In the case of SARS-CoV-2, viral kinetics has been found to be associated with mortality in hospitalized patients [9] but the association in less severe patients is unclear. This is due to the fact that many studies rely on large cross-sectional analyses with few patients having serial data points or, in contrary, on detailed small series of patients [10–12]. In that perspective, the analysis of data generated in non-human primates is a unique opportunity to characterize in detail the viral dynamics during natural infection, and to study the effects of antiviral therapy [13–15].
Here, we used data generated on nonhuman primates (NHP) and treated with hydroxychloroquine (HCQ) ± azithromycine (AZTH) in either pre- or post-exposure prophylaxis [16] to develop a mathematical model of SARS-CoV-2 infection. Although our analysis did not reveal any significant antiviral efficacy of HCQ, the large data generated (31 cynomolgus macaques with frequent measurements of both nasopharyngeal and tracheal viral loads) allowed us to characterize in detail the key parameters driving the viral dynamics and to evaluate putative immune response mechanisms during the infection.
Methods
Ethics statement
Cynomolgus macaques aged 37–40 months and originating from Mauritian AAALAC certified breeding centers were used in this study. Animals were housed under BSL-2 and BSL-3 containment when necessary (Animal facility authorization #D92-032-02, Prefecture des Hauts de Seine, France) and in compliance with European Directive 2010/63/EU, the French regulations and the Standards for Human Care and Use of Laboratory Animals, of the Office for Laboratory Animal Welfare (OLAW, assurance number #A5826-01, US).
The protocols were approved by the institutional ethical committee “Comité d’Ethique en Expérimentation Animale du Commissariat à l’Energie Atomique et aux Energies Alternatives” (CEtEA #44) under statement number A20-011. The study was authorized by the “Research, Innovation and Education Ministry” under registration number APAFIS#24434-2020030216532863v1.
Experimental procedure
Our study includes 31 cynomolgus macaques (16 male, 15 female) infected with 106 pfu (corresponding to 1010 total RNA copies) of a primary isolate of SARS-CoV-2 (BetaCoV/France/IDF/0372/2020). Each animal received 5 mL of the total inoculum: 90% (4.5 mL) were injected by the intra-tracheal route and 10% (0.5 mL) by the intra-nasal route [17,18]. Nasopharyngeal and tracheal swabs were collected longitudinally at days 1, 2, 3, 4, 5, 7, 9, 11, 13, 16 and 20 post-infection (pi) and eluted in 3 mL of Universal transport medium (Copan) or Viral Transport Medium (CDC, DSR-052-01). Viral RNA levels were assessed in each sample using a real-time PCR, with 8540 and 180 copies/mL as quantification and detection limits, respectively (Fig 1)
Fig 1. Nasopharyngeal and tracheal SARS-CoV-2 viral loads in infected cynomolgus macaques treated by a placebo or hydroxychloroquine ± azithromycin.

Dashed lines represent the lower limit of detection (LOD) and lower limit of quantification (LOQ).
The original study included 6 groups treated either by a high dosing regimen (Hi) of HCQ (90 mg/kg loading dose and 45 mg/kg maintenance dose) ± AZTH (36 mg/kg of at 1 dpi, followed by a daily maintenance dose of 18 mg/kg), a low dosing regimen (Lo) of HCQ (30 mg/kg loading dose and 15 mg/kg maintenance dose) or a vehicle (water) as a placebo. Among the 23 treated animals, 14 were treated at 1 dpi with a Lo (n = 4), Hi (n = 5) dose of HCQ or HCQ+AZTH (n = 5). A late treatment initiation was also investigated in 4 animals receiving a Lo dosing regimen. Finally, 5 animals received HCQ at the Hi dose starting at day 7 prior to infection as a pre-exposure prophylaxis (PrEP) (see S1 Data)
Viral dynamic model of SARS-CoV-2
Model describing nasopharyngeal and tracheal swabs
Given that HCQ was not associated to any antiviral effect [16], we pooled the data from either treated and untreated groups. Thus, we consider all animals as controls in our primary analysis but we also investigated a potential effect of HCQ (see details in S1 Text). Nasopharynx and trachea were considered as two distinct compartments of the upper respiratory tract (URT) where each one is described by a target cell limited model [13,19,20]. In this model, susceptible cells (T) are infected by an infectious virus (VI) at a rate β and generate non-productive infected cells (I1). After an eclipse phase of duration 1/k on average, infected cells start to be productive (I2) and produce both infectious and non infectious viruses at a rate μp and (1-μ)p respectively. Productive infected cells die at a rate δ and viruses are cleared at a rate c (see S2 Text). The model is given by ordinary differential Eqs (1) to (5) where subscript X denotes the compartment of interest either nasopharynx or trachea. The basic reproduction number is and the burst-size is .
| (1) |
| (2) |
| (3) |
| (4) |
| (5) |
Fixed parameters
Because not all parameters can be estimated when only total viral RNA are measured, some parameters had to be fixed based on the experimental setting or the current literature. As only the product p×T0 is identifiable, we chose to fix T0, the initial concentrations of susceptible cells, as follows. We measured the surfaces (S) and volumes (V) of the nasopharynx and the trachea in one euthanized animal and obtained VN = 6.3 mL; VT = 1.2 mL; SN = 50 cm2; ST = 9 cm2. Assuming an apical surface of one epithelial cell of s = 4 10−7 cm2/cell [21], the number of target cells exposed to the virus in the nasopharynx and the trachea are and , respectively. Only a fraction of these cells expresses both angiotensin-converting enzyme 2 (ACE2) and the type II transmembrane serine protease (TMPRSS2), and we fixed this proportion to 0.1% i.e. TN,0 = 1.98×10⁴ and TT,0 = 1.88×10⁴ cells in nasopharynx and trachea, respectively. Also, we supposed that the eclipse phase duration was equal in the nasopharynx and in the trachea, and we set k = 3 d-1 based on in vitro studies showing that virus release occurs 8 hours after infection [22]. Third, we supposed the proportion of infectious virus μ remained constant over time. TCID50 is a proxy for the infectious viruses. Fig 2B shows that the ratio TCID50/total viral loads is 10−5 (range 10−6–10−4). However, not all the infectious viruses present in the samples may be detected in Vero-E6 cells experiments. Hence, we fixed μ to 10−4, the upper bound of the observed ratio of infectious virus. Finally the viral clearance c was fixed to 10 d-1, consistent with the rapid viral clearance rate of influenza virus [20]. Sensitivity analyses exploring the consequences of those different assumptions were performed, with c in a range 5–20 d-1, μ in a range 10−5–10−3 and the proportion of target cells being equal to 1% (see S3 Text). Thus, the estimated parameters in each compartment were V0, p, β and δ.
Fig 2. Relationship between TCID50 and viral loads. Each symbol corresponds to a tracheal swab obtained at 3 dpi.

A) Viral load levels in samples with no detectable infectious virus (circles) and those with detectable infectious virus (triangles). B) Correlation between the viral loads and the infectious virus, as measured by TCID50. Red, green and purple dashed lines represent putative ratios of infectious virus of 10−4; 10−5 and 10−6 respectively.
Statistical model
The structural model used to describe the observed log10 viral loads Yijk of the ith animal at the jth time point in the kth compartment (k = 1 for nasopharyngeal or k = 2 for tracheal) is
| (6) |
Where f is the function describing the total viral loads dynamics over time (VI(t)+VNI(t)); θik is the vector of parameters of subject i in the kth compartment and eijk is the additive residual error. Individual parameters θik are supposed to follow a log-normal distribution with a median value that depends on the compartment:
| (7) |
where γ indicates the fixed effects and ηi the individual random effects, which are supposed to follow a normal distribution of mean zero and standard deviation ω, and exp(α) is the vector of the ratio values between the nasal and tracheal compartments. The residual error eijk is assumed to follow a normal distribution of mean zero and constant standard deviation σk. Standard errors were calculated by drawing parameters in the asymptotic distribution of the parameter estimators. For each parameter, we calculated the 2.5 and 97.5% percentile to derive the 95% confidence interval.
Modelling strategy
As a first step, we considered nasopharynx and trachea parameters as two distinct compartments and we then tested whether the virus could migrate from one compartment to the other at a constant first order migration rate g. Parameter g was set to 0 if it did not improve the fit to the data or could not be precisely estimated. In order to reduce the number of remaining parameters, we fixed the ratio of effective inoculum, V0,T/V0,N, to 9. Then we tested the possibility for estimated parameters to be equal in both nasopharynx and trachea (e.g., α = 0) and tested then if their variances could be set to 0 (e.g., ω = 0). To do this, we used a backward selection procedure and stopped once the BIC did not decrease anymore. Lastly, based on the Empirical Bayes Estimates (EBE), we screened the random effects for correlations. Only correlations with a Pearson’s coefficient >0.8 were implemented in the model. All models tested are presented and compared in S4 Text.
Viral titers determination on Vero-E6 cells
Vero-E6 cells (mycoplasma-free) were seeded in 24-well plates (2×10⁵cells/well) and cultured in DMEM (Thermo Fisher Scientific) containing 1% PS (Penicillin 10,000 U/mL; Streptomycin 10,000 μg/mL) supplemented with 5% FBS (Foetal Bovine Serum) and incubated at 37°C in the presence of 5% CO2. The next day, cells were inoculated in triplicate with 100μL per well of the tracheal swab dilutions (1:2, 1:10, 1:50,1:250) in DMEM, 1% PS, 0.1% TPCK trypsin and incubated for 1 hour at 37°C. After removal of the inoculum, 1mL of DMEM, 1% PS, 0.1% TPCK trypsin was added in each well before incubation at 37°C in the presence of 5% CO2 for 72 hrs. The presence of a cytopathic effect (CPE) was visualized under the microscope and the TCID50 i.e. the tissue culture infective dose leading to 50% of the maximal cytopathic effect,was calculated using the method of Reed and Münch. All experiments were conducted under strict BSL3 conditions.
Plasma cytokine analysis
In all 31 macaques, the concentration of 30 cytokines were measured at 0, 2, 5, 7 and 9 dpi. Among them, CCL11, CCL2, IFN-⍺, Il-15, Il-1Ra and Il-2 were of particular interest as their kinetic changed during the infection. To identify the cytokines to be incorporated in the model, we correlated the are under the cytokine curve (AUC, calculated by the linear trapezoidal method) with the AUC of log10 viral loads predicted by the model.
Models assuming a compartment for the innate immune response
We considered additional models incorporating a compartment for an antigen-dependent immune response, F, given by . In these models, F could either i) reduce viral infectivity ii) and iii) put target cells into a refractory state, iv) reduce viral production and v) increase the loss of infected cells (see S5 Text).
Simulations of a prophylactic treatment
We used the median estimated parameter values of the model to simulate the effects of an antiviral treatment, initiated before infection, on the viral kinetics. We explored the effects of 10 to 100 fold lower viral inoculum (corresponding to doses of 105 and 104 pfu) as well as the effects of drugs acting on viral production, viral entry or the proportion of infectious virus. For each scenario, we also calculated the 95% confidence interval of the median time to viral clearance, using the method described above.
Parameter estimation
Parameters were estimated with the SAEM algorithm implemented in MONOLIX software version 2018R2 allowing to handle the left censored data [23]. Likelihood was estimated using the importance sampling method and the Fisher Information Matrix (FIM) was calculated by stochastic approximation. Graphical and statistical analyses were performed using R version 3.4.3.
Results
SARS-CoV-2 viral kinetics
In our experiment, cynomolgus macaques developed a rapid infection, with viral loads peaking 2 days post infection (dpi) in both nasopharyngeal and tracheal compartments. Afterwards, both nasopharyngeal and tracheal viral loads rapidly declined exponentially, with a similar median rate of 1.9 d-1, corresponding to a daily reduction of 0.8 log10 copies/mL (Fig 1). Because the viral load peaked later and higher in in the nasopharynx than in the trachea (7.9 and 7.2 log10, respectively), the median time to unquantifiable viral load nonetheless occurred later in the nasopharynx than in the trachea (9 and 7 dpi, respectively).
Overall, the area under the viral load curve (AUC) was larger in the nasopharynx than in the trachea (45 vs 38 log10 copies.day/mL, p<10−4). In addition to viral RNA, we also measured virus titers in Vero-E6 cells using tracheal swabs obtained at 3 dpi (see Methods). All samples contained more than 4 log10 copies/mL however viral growth was observed only in those having more than 6 log10 copies/mL (Fig 2A). In those for which viral culture could be obtained, the ratio of TCID50 (median tissue culture infective dose) to the total number of RNA copies ranged between 10−4 to 10−6 (Fig 2B).
Viral dynamic model
Importantly, there was no antiviral effect in animals receiving various doses of HCQ compared to those receiving vehicles, even after adjustment on the mean HCQ exposure [16]. Thus, the effect of treatment was neglected as a first approximation. We later challenged this hypothesis but found no significant effect of HCQ in reducing viral production or viral infectivity (see S1 Text).
Physiologically, viruses can migrate from the nasopharynx to the trachea through respiration and movements of ciliary cells at the mucosal surface. Thus, we tested the possibility for viruses to move from nasopharyngeal to tracheal compartment and vice versa by linking both with a bidirectional rate constant g. However, possibly due to data paucity, the parameter g was not significantly different from 0 (CI95% included 0) and was therefore set to 0 in the following. Then, using a backward selection procedure we found that the infectivity rate β and the viral production p were different between nasopharyngeal and tracheal compartments (Table 1). The final model well fitted the data and allowed the estimation of several parameters of the infection (Fig 3). We estimated the effective initial viral load to 1.7×10⁶ and 8.0×10⁷ copies/mL in tracheal and nasal compartments, respectively, which corresponds to a total inoculum of approximately 108 total RNA, i.e., about 1% of the total injected dose (see Methods). We found estimates of β of 1.2×10⁻³ (CI95% 0.5×10⁻³−2.8×10⁻³) and 1.8×10⁻³ (CI95% 0.6×10⁻³−5.6×10⁻³) mL/virion/day (p<10−4) in nasopharynx and trachea, respectively, while p was estimated to 4.8×10⁴ (CI95% 1−8.8×10⁴) and 2.2×10⁴ (CI95% 0.7−4.1×10⁴) virions/cell/day (p<0.05). Consequently the product p×T0 was equal to 9.5×10⁸ (CI95% 2.0–17×108) and 3.9×10⁸ (CI95% 1.2–17.7×10⁸) virions/mL/day in nasopharynx and trachea, respectively.
Table 1. Population parameter estimates of the final model described by Eq (1) to (5).
Numbers in parenthesis are the relative standard error expressed in percentage (RSE%) associated either to the fixed or the standard deviation (SD) of random effects.
| Parameters (units) | Fixed effects (RSE%) | SD of random effects (RSE%) |
|---|---|---|
| βT (mL.copie/d) | 1.8×10⁻³ (42) | 0.3 (33) |
| βN (mL.copie/d) | 1.2×10⁻³ (12) | |
| pT (copies/cell/d) | 2.2×10⁴ (49) | 1.0 (27) |
| pN (copies/cell/d) | 4.8×10⁴ (40) | |
| VT,0 (copies/mL) | 8.0×10⁷ (9) | - |
| VN,0 (copies/mL) | 1.7×10⁶ (9) | - |
| δ (1/d) | 1.9 (9) | 0.2 (37) |
| c (1/d) | 10 (fixed) | - |
| μ (unitless) | 10−3 (fixed) | - |
| k (1/d) | 3 (fixed) | - |
| TT,0 (cells/mL) | 1.88×10⁴ (fixed) | - |
| TN,0 (cells/mL) | 1.98×10⁴ (fixed) | |
| σT | 1.06 (6) | - |
| σN | 1.19 (6) | - |
Fig 3.

Nasopharyngeal (blue) and tracheal (red) individual predicted dynamics by the model described in Eqs (1) to (5). Full dots are the quantifiable viral loads and crosses the observation below the limit of quantification. The dotted line represents the limit of quantification and the dashed line the limit of detection.
The loss rate of infected cells, δ, was not found different between the two compartments and estimated to 1.9 (CI95% 1.6–2.3) d-1 corresponding to an infected cell half-life of 9 (CI95% 7–13) hours. These parameter estimates allow us to derive the basic reproduction number R0 corresponding to the number of infected cells generated by a single infected cell at the beginning of the infection. We found R0,N equal to 5.6 (CI95% 1.3–21) and R0,T equal to 3.8 (CI95% 0.7–18) in the nasopharynx and the trachea, respectively. One can also derive the viral burst size N corresponding to the number of viruses produced by an infected cell over its lifespan. We found NN = 25,000 (CI95% 5,900–72,000) virions and NT = 11,000 (CI95% 4,000–19,000) virions.
Sensitivity analysis
In our main analysis, the viral clearance c and the proportion of infectious virus μ were fixed. We tested the robustness of our results to different values of these parameters (see S3 Text) and we used model averaging (MA) to compute the averaged parameters values following a methodology presented in [24]. Overall, models were broadly undistinguishable as they provided a Bayesian Information Criterion within a 4 points range. Model averaged parameter estimates of δ, R0,N and R0,T were equal to 1.9 (CI95% 1.5−2.3) d-1, 6.8 (CI95% 1.3−29) and 4.4 (CI95% 1−26), respectively.
Immune markers during SARS-CoV-2 infection
Among the 30 cytokines tested, 6 greatly varied during the infection and peaked at 2 dpi (namely CCL11, CCL2, IFN-⍺, IL-15, IL-1RA and IL-2) but there was no association between cytokine and viral loads (Fig 4). A model assuming an effect of the immune response in cell protection resulted in a reduced BIC of 6 points. However, the gain in fitting criterion was entirely due to 3 individuals (see S5 Text) and led to more uncertainty in parameter estimates due to increased complexity (see Table B in S5 Text). Moreover none of the cytokines measured during the experiments, including IFN-a, showed a correlation with viral dynamics (Fig 5). Thus, overall, there was no clear evidence in these data that a more complex model improved the understanding of viral dynamics over a simple target cell model.
Fig 4. Cytokine concentrations during SARS-CoV-2 infection.
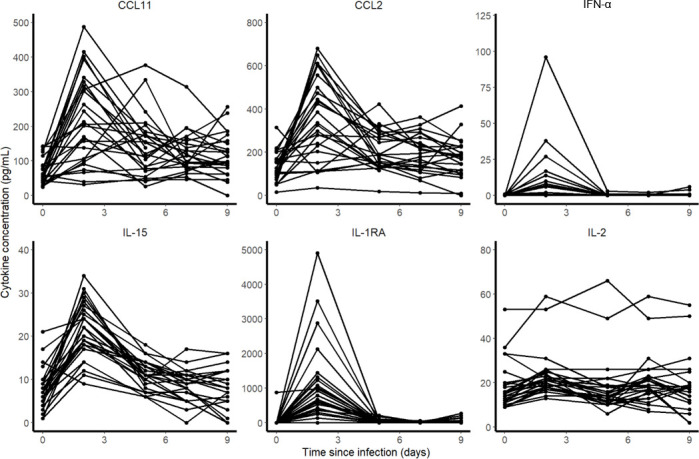
Fig 5. Correlation between the individual predicted AUC log10 viral load and cytokine AUC.

None of the 6 cytokines that increased during the infection was significantly correlated with the predicted viral load AUC in the nasopharynx or the trachea.
Expected profiles with prophylaxis treatments
We used estimated parameter values of the model to simulate the effects of an antiviral treatment, initiated before infection, on the viral kinetics. We explored different viral inoculum (ranging from 104 to 106 pfu), drugs mechanisms of action (blocking viral production, viral entry, or infectious virus production), with different levels of antiviral efficacy. As the conclusions were not sensitive to the mechanism of action, we present below the results for a prophylactic drug blocking viral entry (Fig 6). Other mechanisms of action are presented in S6 Text.
Fig 6.

Median viral kinetic profiles in the nasopharynx (blue) and the trachea (red) according to the inoculum size and the level of an antiviral initiated in prophylaxis and blocking viral entry β. Treatment efficacy of 0% (no treatment, solid line), 90% (dashed line) and 99% (dotted lines) were considered. Point-dotted line represents the threshold below which no virus could be cultured in vitro (Fig 2).
In both compartments, the median time to viral clearance increased with lower doses of inoculum, and ranged from 10.1 (CI95% 8.4–14.7) days with 106 pfu to 11.7 (CI95% 9.5–19.0) days with 104 pfu in the nasopharynx. A 90% effective antiviral treatment administered upon infection would dramatically reduce peak viral load in all scenario and maintain virus below the threshold level of infectivity of 6 log10 copies/mL (Fig 2A). A 99% effective antiviral treatment could in addition abrogate viral load viral load, with time to viral clearance ranging from 3.5 (CI95% 1.9–6.2) days with 106 pfu to 0.5 (CI95% 0.2–2.5) days with 104 pfu in the nasopharynx.
Discussion
We here developed a mathematical model for SARS-CoV-2 viral dynamics using nasopharyngeal and tracheal swabs obtained in 31 infected macaques. Using this model we could estimate key parameters of virus pathogenesis, in particular the viral infectivity rate (equal to 1.2×10⁻³ and 1.8×10⁻³ in tracheal and nasopharyngeal compartments, respectively), and the loss rate of infected cells, estimated to 1.9 d-1 in both compartments (e.g., a half-life of 9 hours). Consequently, we estimated the number of secondary cell infection resulting from one infected cells, R0, to approximately 4 and 6 in tracheal and nasopharyngeal compartments, respectively. This value of R0, together with the large viral inoculum used in this experimental model (106 pfu), explains that tracheal viral loads barely increased post-infection and that nasopharyngeal viral loads rapidly peaked at 3 dpi. After peak viral load, the rapid loss rate of infected cells was sufficient to explain that clearance of the virus occurred around day 10 in both compartments, and we did not find evidence in this model for a role of an immune response mediated by cytokines in accelerating the viral clearance.
Although the number of animals and the very detailed kinetic data allowed the precise estimation of several parameters, some limitations exist. First, animals were infected with a large inoculum (106 pfu, i.e. 1010 RNA copies) which rapidly saturate target cells making the estimation of β less robust and difficult to distinguish the processes of clearance of the inoculum from those of de novo viral infections. In the future, the analysis of subgenomic RNA, that quantifies intracellular viral transcription, will provide important information to distinguish these two processes and provide a more precise estimate of R0 [25,26]. Second, a number of unknown parameters were fixed to ensure identifiability, in particular the proportion of infectious virus, μ, and the number of target cells available in each compartment, T0. In this model, p×T0 is the only reliable quantity since the estimate of p depends on the number of susceptible cells. We here estimated the number of alveolar type II cells by analysis of the size of the tissues of one euthanized animal and we assumed that 0.1% of these cells could be target for the virus. Although this value led to more coherent parameter estimates (see S3 Text), this is higher than the value of 1% of cells expressing the ACE2 receptor and serine protease TMPRSS2 found in humans [27,28]. Specific experiments will be needed to estimate the proportion of target cells in the URT of macaques. Third, we relied only on measures in both compartments of the upper respiratory tract, which may not reflect the kinetics in the lower respiratory tract. It is in particular possible that the kinetics of both the virus and the immune response may be different in the lung, and that both cytokine responses and the lesions as observed by CT scans may be associated with viral loads in the lungs. In our experiments the first viral load measurements in bronchoalveolar lavages (BAL) was made at 6 dpi, and were all below the limit of detection at the next available data point at day 14, precluding a more detailed analysis of the kinetics in the lungs.
We also aimed to evaluate whether more complex models including an antigen-dependent immune response could improve the data fitting. A model assuming that cells could be put in an antiviral state improved the BIC (see S4 Text), however this improvement was due to 3 individuals, and this came to the expense of a deteriorated precision of parameter estimates. Further, none of the observed cytokines were found associated with viral dynamics (Fig 5), suggesting that this improvement in data fitting was not supported by our data. In addition, none of the animals had detectable antibodies until day 7, and only 25% had detectable antibodies by day 14, suggesting that the humoral response played a minor role in viral clearance. The role of the immune response in this experimental model of mild infection is unclear, but our findings are consistent with data obtained in patients with an asymptomatic infection, in which the immune response and the cytokine response remained low throughout the infection period [29]. Accordingly our estimate of the duration of viral shedding was between 10 and 12 days in the nasopharynx, depending on the initial inoculum, very close to the values of 9 days (Diamond Princess [30]) and 12 days [11] estimated in mild or asymptomatic individuals. From an experimental setting, the analysis of viral dynamics in animals infected with different size of viral inoculum could also bring insights on the need to use more complex models [31].
Finally, we used the model to inform on the use of prophylactic drugs in this macaque model. Given our estimate of R0, a 90% effective treatment should be able to prevent virus growth and would maintain the viral load levels below 106 copies/mL at all times, making the chance of detecting infectious virus very limited, consistent with our modeling predictions in humans ([32]).
Supporting information
(DOCX)
(TXT)
(DOCX)
(DOCX)
(DOCX)
(DOCX)
(TXT)
Acknowledgments
We thank Peter Czuppon (Collège de France & Sorbonne Université), François Blanquart (Collège de France & INSERM UMR1137) for critical reading and expertise on the analysis.
Data Availability
All relevant data are within the manuscript and its Supporting Information files.
Funding Statement
This work was funded by the French national research agency (ANR) through the TheraCoV ANR-20-COVI-0018 (JG) and also by the Bill & Melinda Gates Foundation through INV-017335 (JG). The funders had no role in study design, data collection and analysis, decision to publish, or preparation of the manuscript.
References
- 1.Weekly epidemiological update—22 December 2020. [cited 11 Jan 2021]. Available: https://www.who.int/publications/m/item/weekly-epidemiological-update—22-december-2020
- 2.Lapidus N, Paireau J, Levy-Bruhl D, de Lamballerie X, Severi G, Touvier M, et al. Do not neglect SARS-CoV-2 hospitalization and fatality risks in the middle-aged adult population. Infect Dis Now. 2021. [cited 21 Feb 2021]. 10.1016/j.idnow.2020.12.007 [DOI] [PMC free article] [PubMed] [Google Scholar]
- 3.Chen N, Zhou M, Dong X, Qu J, Gong F, Han Y, et al. Epidemiological and clinical characteristics of 99 cases of 2019 novel coronavirus pneumonia in Wuhan, China: a descriptive study. The Lancet. 2020;395: 507–513. 10.1016/S0140-6736(20)30211-7 [DOI] [PMC free article] [PubMed] [Google Scholar]
- 4.Yang X, Yu Y, Xu J, Shu H, Xia J, Liu H, et al. Clinical course and outcomes of critically ill patients with SARS-CoV-2 pneumonia in Wuhan, China: a single-centered, retrospective, observational study. The Lancet Respiratory Medicine. 2020;8: 475–481. 10.1016/S2213-2600(20)30079-5 [DOI] [PMC free article] [PubMed] [Google Scholar]
- 5.Wu F, Wang A, Liu M, Wang Q, Chen J, Xia S, et al. Neutralizing antibody responses to SARS-CoV-2 in a COVID-19 recovered patient cohort and their implications. medRxiv. 2020. [cited 2 Jun 2020]. 10.1101/2020.03.30.20047365 [DOI] [Google Scholar]
- 6.Guedj J, Bazzoli C, Neumann AU, Mentré F. Design evaluation and optimization for models of hepatitis C viral dynamics. Statistics in Medicine. 2011;30: 1045–1056. 10.1002/sim.4191 [DOI] [PubMed] [Google Scholar]
- 7.Lovern M, Minton SK, Patel K, Xiong Y, Kirkpatrick CM, Smith PF. Applications of Influenza Viral Kinetic Modeling in Drug Development. Curr Pharmacol Rep. 2017;3: 294–300. 10.1007/s40495-017-0104-3 [DOI] [Google Scholar]
- 8.Hill AL, Rosenbloom DIS, Nowak MA, Siliciano RF. Insight into treatment of HIV infection from viral dynamics models. Immunol Rev. 2018;285: 9–25. 10.1111/imr.12698 [DOI] [PMC free article] [PubMed] [Google Scholar]
- 9.Néant N, Lingas G, Hingrat QL, Ghosn J, Engelmann I, Lepiller Q, et al. Modeling SARS-CoV-2 viral kinetics and association with mortality in hospitalized patients from the French COVID cohort. PNAS. 2021;118. 10.1073/pnas.2017962118 [DOI] [PMC free article] [PubMed] [Google Scholar]
- 10.Zheng S, Fan J, Yu F, Feng B, Lou B, Zou Q, et al. Viral load dynamics and disease severity in patients infected with SARS-CoV-2 in Zhejiang province, China, January-March 2020: retrospective cohort study. BMJ. 2020;369. 10.1136/bmj.m1443 [DOI] [PMC free article] [PubMed] [Google Scholar]
- 11.Young BE, Ong SWX, Kalimuddin S, Low JG, Tan SY, Loh J, et al. Epidemiologic Features and Clinical Course of Patients Infected With SARS-CoV-2 in Singapore. JAMA. 2020. [cited 29 Mar 2020]. 10.1001/jama.2020.3204 [DOI] [PMC free article] [PubMed] [Google Scholar]
- 12.Woelfel R, Corman VM, Guggemos W, Seilmaier M, Zange S, Mueller MA, et al. Clinical presentation and virological assessment of hospitalized cases of coronavirus disease 2019 in a travel-associated transmission cluster. medRxiv. 2020. [cited 2 Jun 2020]. 10.1101/2020.03.05.20030502 [DOI] [Google Scholar]
- 13.Best K, Guedj J, Madelain V, de Lamballerie X, Lim S-Y, Osuna CE, et al. Zika plasma viral dynamics in nonhuman primates provides insights into early infection and antiviral strategies. Proceedings of the National Academy of Sciences. 2017;114: 8847–8852. 10.1073/pnas.1704011114 [DOI] [PMC free article] [PubMed] [Google Scholar]
- 14.Madelain V, Baize S, Jacquot F, Reynard S, Fizet A, Barron S, et al. Ebola viral dynamics in nonhuman primates provides insights into virus immuno-pathogenesis and antiviral strategies. Nat Commun. 2018;9: 4013. 10.1038/s41467-018-06215-z [DOI] [PMC free article] [PubMed] [Google Scholar]
- 15.Guedj J, Piorkowski G, Jacquot F, Madelain V, Nguyen THT, Rodallec A, et al. Antiviral efficacy of favipiravir against Ebola virus: A translational study in cynomolgus macaques. PLOS Medicine. 2018;15: e1002535. 10.1371/journal.pmed.1002535 [DOI] [PMC free article] [PubMed] [Google Scholar]
- 16.Maisonnasse P, Guedj J, Contreras V, Behillil S, Solas C, Marlin R, et al. Hydroxychloroquine in the treatment and prophylaxis of SARS-CoV-2 infection in non- human primates. Nature. 2020. [cited 3 Jun 2020]. 10.21203/rs.3.rs-27223/v1 [DOI] [PubMed] [Google Scholar]
- 17.Kobasa D, Jones SM, Shinya K, Kash JC, Copps J, Ebihara H, et al. Aberrant innate immune response in lethal infection of macaques with the 1918 influenza virus. Nature. 2007;445: 319–323. 10.1038/nature05495 [DOI] [PubMed] [Google Scholar]
- 18.Cillóniz C, Shinya K, Peng X, Korth MJ, Proll SC, Aicher LD, et al. Lethal influenza virus infection in macaques is associated with early dysregulation of inflammatory related genes. PLoS Pathog. 2009;5: e1000604. 10.1371/journal.ppat.1000604 [DOI] [PMC free article] [PubMed] [Google Scholar]
- 19.Pawelek KA, Huynh GT, Quinlivan M, Cullinane A, Rong L, Perelson AS. Modeling within-host dynamics of influenza virus infection including immune responses. PLoS Comput Biol. 2012;8: e1002588. 10.1371/journal.pcbi.1002588 [DOI] [PMC free article] [PubMed] [Google Scholar]
- 20.Baccam P, Beauchemin C, Macken CA, Hayden FG, Perelson AS. Kinetics of influenza A virus infection in humans. J Virol. 2006;80: 7590–7599. 10.1128/JVI.01623-05 [DOI] [PMC free article] [PubMed] [Google Scholar]
- 21.Fedoseev G, Geharev S. Basic defence mechanisms of bronchio-lung system. In Outov NV. Moscow, Russia; 1989.
- 22.Agostini ML, Andres EL, Sims AC, Graham RL, Sheahan TP, Lu X, et al. Coronavirus Susceptibility to the Antiviral Remdesivir (GS-5734) Is Mediated by the Viral Polymerase and the Proofreading Exoribonuclease. mBio. 2018;9. 10.1128/mBio.00221-18 [DOI] [PMC free article] [PubMed] [Google Scholar]
- 23.Samson A, Lavielle M, Mentré F. Extension of the SAEM algorithm to left-censored data in nonlinear mixed-effects model: Application to HIV dynamics model. Computational Statistics & Data Analysis. 2006;51: 1562–1574. 10.1016/j.csda.2006.05.007 [DOI] [Google Scholar]
- 24.Gonçalves A, Mentré F, Lemenuel-Diot A, Guedj J. Model Averaging in Viral Dynamic Models. AAPS J. 2020;22: 48. 10.1208/s12248-020-0426-7 [DOI] [PubMed] [Google Scholar]
- 25.Baum A, Ajithdoss D, Copin R, Zhou A, Lanza K, Negron N, et al. REGN-COV2 antibodies prevent and treat SARS-CoV-2 infection in rhesus macaques and hamsters. Science. 2020;370: 1110–1115. 10.1126/science.abe2402 [DOI] [PMC free article] [PubMed] [Google Scholar]
- 26.Chandrashekar A, Liu J, Martinot AJ, McMahan K, Mercado NB, Peter L, et al. SARS-CoV-2 infection protects against rechallenge in rhesus macaques. Science. 2020;369: 812–817. 10.1126/science.abc4776 [DOI] [PMC free article] [PubMed] [Google Scholar]
- 27.Muus C, Luecken MD, Eraslan G, Waghray A, Heimberg G, Sikkema L, et al. Integrated analyses of single-cell atlases reveal age, gender, and smoking status associations with cell type-specific expression of mediators of SARS-CoV-2 viral entry and highlights inflammatory programs in putative target cells. bioRxiv. 2020; 2020.04.19.049254. 10.1101/2020.04.19.049254 [DOI] [Google Scholar]
- 28.Bezara MEO, Thurman A, Pezzulo AA, Leidinger MR, Klesney-Tait JA, Karp PH, et al. Heterogeneous expression of the SARS-Coronavirus-2 receptor ACE2 in the human respiratory tract. Cell Biology; 2020. April. 10.1101/2020.04.22.056127 [DOI] [PMC free article] [PubMed] [Google Scholar]
- 29.Long Q-X, Tang X-J, Shi Q-L, Li Q, Deng H-J, Yuan J, et al. Clinical and immunological assessment of asymptomatic SARS-CoV-2 infections. Nat Med. 2020. [cited 26 Jun 2020]. 10.1038/s41591-020-0965-6 [DOI] [PubMed] [Google Scholar]
- 30.Sakurai A, Sasaki T, Kato S, Hayashi M, Tsuzuki S, Ishihara T, et al. Natural History of Asymptomatic SARS-CoV-2 Infection. N Engl J Med. 2020; NEJMc2013020. 10.1056/NEJMc2013020 [DOI] [PMC free article] [PubMed] [Google Scholar]
- 31.Li Y, Handel A. Modeling inoculum dose dependent patterns of acute virus infections. Journal of Theoretical Biology. 2014;347: 63–73. 10.1016/j.jtbi.2014.01.008 [DOI] [PubMed] [Google Scholar]
- 32.Czuppon P, Débarre F, Gonçalves A, Tenaillon O, Perelson AS, Guedj J, et al. Predicted success of prophylactic antiviral therapy to block or delay SARS-CoV-2 infection depends on the targeted mechanism. PLoS Comput Biol 2021. 10.1371/journal.pcbi.1008752 [DOI] [PMC free article] [PubMed] [Google Scholar]