

Abstract
NLRP3 (NOD-, LRR-, and pyrin domain-containing protein 3) inflammasome activation has emerged as a central mediator of kidney inflammation in diabetic kidney disease (DKD). However, the mechanism underlying this activation in DKD remains poorly defined. In this study, we found that kidney-enriched microRNA-10a and -10b (miR-10a/b), predominantly expressed in podocytes and tubular epithelial cells, were downregulated in kidney from diabetic mice and patients with DKD. High glucose decreased miR-10a/b expression in vitro in an osmolarity-independent manner. miR-10a/b functioned as negative regulators of the NLRP3 inflammasome through targeting the 3′untranslated region of NLRP3 mRNA, inhibiting assembly of the NLRP3 inflammasome and decreasing caspase-1-dependent release of pro-inflammatory cytokines. Delivery of miR-10a/b into kidney prevented NLRP3 inflammasome activation and renal inflammation, and it reduced albuminuria in streptozotocin (STZ)-treated mice, whereas knocking down miR-10a/b increased NLRP3 inflammasome activation. Restoration of miR-10a/b expression in established DKD ameliorated kidney inflammation and mitigated albuminuria in both db/db and STZ-treated mice. These results suggest a novel intervention strategy for inhibiting kidney inflammation in DKD by targeting the NLRP3 inflammasome.
Keywords: diabetic kidney disease, NLRP3 inflammasome, kidney inflammation, microRNA
Graphical abstract
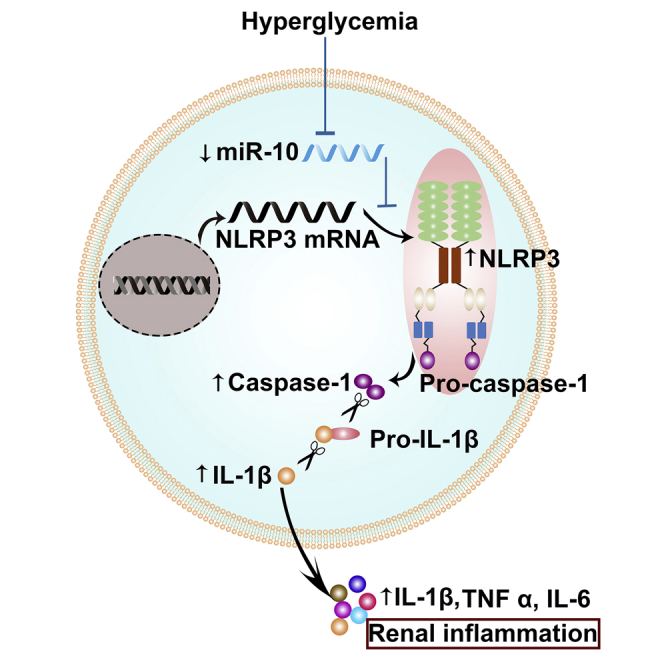
Kidney inflammation has emerged as a central mediator in diabetic kidney disease. This study found that a kidney-enriched noncoding RNA miR-10 inhibits inflammation by blocking the NLRP3 inflammasome and improves kidney damage in diabetic models, suggesting that targeting NLRP3 by miR-10 might be a key strategy for treatment of diabetic kidney disease.
Introduction
Diabetic kidney disease (DKD) develops in approximately 40% of patients who are diabetic and is a leading cause of end-stage renal disease worldwide, posing an enormous burden on affected individuals and health care systems.1, 2, 3 DKD is associated with sterile inflammation in the kidney, characterized by accumulation of macrophages and T cells.2, 3, 4, 5 Increasing evidence from clinical and experimental studies suggests that renal inflammation plays crucial roles in the development and progression of DKD.6 Infiltration of immune cells, predominantly macrophages, is commonly observed in the interstitium and glomeruli of kidney biopsy samples at all stages of DKD.7 The extent of macrophage accumulation is associated with decline in renal function, suggesting a causative link of renal inflammation with progression of DKD.8
The mechanisms underlying inflammation in the diabetic kidney have not been fully understood. Recent studies indicate that renal inflammation is involved with the upregulation of inflammatory signaling pathways, secretion of various cytokines and chemokines, and infiltration of immune cells in the kidney.9 NLRP3 (NOD-, LRR-, and pyrin domain-containing protein 3) is an intracellular sensor that detects a broad range of metabolic stress signals to result in the formation and activation of the NLRP3 inflammasome.10 Assembly of the NLRP3 inflammasome leads to caspase-1 (Casp1)-dependent release of cytokines IL-1β and IL-18, and it triggers the pro-inflammatory cascade in the diabetic kidney.11,12 In patients with DKD, the expression of markers of inflammasome activation, such as Casp1, interleukin (IL)-1β, and IL-18, in renal biopsy samples is positively correlated with the severity of albuminuria, suggesting that NLRP3 may play a crucial role in the pathogenesis and progression of DKD.13 Therefore, a mechanistic understanding of the regulation of NLRP3 activation may help to reveal the molecules specifically targeting NLRP3 for treatment of kidney inflammation in DKD.
Emerging evidence suggests that each organ expresses a unique panel of microRNAs (miRNAs or miRs), and tissue-specific miRNAs play a key role in physiological and pathological processes.14, 15, 16, 17 miRNAs are endogenously produced small non-coding RNAs that repress specific target gene expression by post-transcriptional mechanism.18 Microarray-based analysis has found several miRNAs that are predominantly expressed in kidney, such as miR-30a/c/e, miR-192, miR-194, miR-196a/b, and miR-200.19, 20, 21 These miRNAs have been reported to play important roles in the regulation of kidney inflammation, cell injury, fibrogenesis, and epithelial-to-mesenchymal transition through different pathways.21, 22, 23, 24
In the present study, we identified a conserved and kidney-enriched miRNA, miR-10 (including two members, miR-10a and -10b), expressed mainly in tubular epithelial cells (TECs) and glomerular podocytes. Downregulation of miR-10a and -10b expression in the kidney was observed in both diabetic mice and patients with DKD, which was negatively correlated with the activation of the NLRP3 inflammasome. We also found that miR-10a/b negatively regulated the NLRP3 signal by targeting the 3′ untranslated region (UTR) of NLRP3 mRNA, alleviating Casp1 cleavage and IL-1β maturation, and attenuating cellular inflammation in the diabetic kidney. Given that specific intervention targeting inflammation in DKD remains scarce, this discovery may provide a new therapeutic target for inflammation in the diabetic kidney.
Results
miR-10a and -10b are predominantly expressed in the kidney
Consistent with the previous data from Solexa deep sequencing in mice,21 miR-10a and -10b were constitutively expressed in the kidneys of C57BL/6J mice and humans by in situ hybridization. Nevertheless, less expression was observed in other epithelial organs, such as lung and liver (Figures 1A–1C).
Figure 1.

miR-10a and -10b are predominantly expressed in the kidney
(A–C) Representative images of in situ hybridization for miR-10a and -10b in epithelial organs from a mouse (A) and human (B) and semi-quantification data (C). Scale bars, 40 μm in (A) and 80 μm in (B). (D) Relative expression of miR-10a and -10b to U6 snoRNA, measured by qRT-PCR in homogenate from various mouse organs. (E) Expression of miR-10a and -10b in mouse kidney cell lines by qRT-PCR. (F) Relative miR-10a and -10b expression to U6 snoRNA in human kidney. (G) Expression of miR-10a and -10b in human kidney cell lines by qRT-PCR. (H) Representative image of fluorescence in situ hybridization of miR-10a and -10b in human TECs and podocytes.
Quantitative RT-PCR (qRT-PCR) analysis of tissue homogenates from various mouse organs indicated that miR-10a and -10b were predominantly expressed in kidney compared with other organs or tissues (Figure 1D). Expression of miR-10a and -10b were also detected in the homogenates from human kidney, and the relative levels of miR-10a and -10b were 0.336 and 0.536, respectively, when normalized to U6 small nucleolar RNA (snoRNA) (Figure 1F). Furthermore, we isolated total RNA from mouse kidney cell lines including TECs, podocytes, collecting duct epithelial cells, and mesangial cells, and qRT-PCR results showed that miR-10a and -10b were mainly expressed in the TECs, and to a less extent in podocytes (Figure 1E). A similar expression pattern was found in human kidney cell lines (Figure 1G). Fluorescence in situ hybridization (FISH) demonstrated that miR-10a and -10b localized primarily to the cytoplasm of TECs and podocytes (Figure 1H).
Intrarenal miR-10a and -10b are downregulated and negatively correlated with NLRP3 expression in DKD mice
We evaluated miR-10a and -10b expression in two types of diabetic models, streptozotocin (STZ)-treated uninephrectomized C57BL/6J mice with a high-fat diet and db/db mice (Figures 2A–2J). The developments of kidney injury, characterized by mesangial expansion, enlargement of glomeruli, and accumulation of CD11b+ macrophages, were observed 12 weeks after STZ treatment in C57BL/6J mice and in aged 18- to 20-week-old db/db mice (Figures 2A, 2B, and 2E–2H). Renal expression of miR-10a and -10b were significantly downregulated in both STZ-treated and db/db mice as compared with their respective control animals (C57BL/6J and db/+, Figures 2C, 2D, 2I, and 2J). Downregulation of miR-10a and -10b was verified by qRT-PCR analyses of renal cortex homogenates from STZ-treated and db/db mice (Figures S1A and S1B). Upregulation of NLRP3 was remarkable in the two types of diabetic kidney and mainly localized in the TECs (Figures 2A, 2B, 2G, and 2H). The enhanced NLRP3 expression in the diabetic kidney was reconfirmed by analyzing the NLRP3 protein level in the lysate of renal cortex using western blotting (Figures 2K and 2L).
Figure 2.

Intrarenal miR-10a and -10b were downregulated and negatively correlated with NLRP3 expression in DKD mice
(A–J) Representative graphs of kidney sections with H&E or PASM staining or immunohistochemical staining for NLRP3 or CD11b (A and B), in situ hybridization for miR-10a/b (C and D) from STZ and db/db mice, and semi-quantification data (E–J). Non-treated C57BL/6J mice were used as controls for STZ-treated mice, and db/+ mice were used as controls for db/db mice. Scale bars, 40 μm. (K and L) NLRP3 protein expression in renal cortex homogenate from STZ-treated (K) or db/db mice (L). (M–P) Correlations of NLRP3 expression with miR-10a or -10b in tubules and glomeruli (Glome) from STZ-treated mice (n = 18) (M and N) or db/db mice (n = 12) (O and P). Data are expressed as means ± SEM; n = 6 for each group. A Student’s t test was used for the comparison of two groups. ∗∗p < 0.01.
Interestingly, significant negative correlations of miR-10a and -10b with NLRP3 were found in the tubular area and glomeruli in diabetic kidneys (Figures 2M–2P), suggesting a possible link of miR-10a and -10b with activation of NLRP3.
miR-10a/b inhibit the NLRP3 inflammasome in vitro through targeting the 3′ UTR of NLRP3 mRNA
To determine the effect of metabolic stress on the expression of miR-10a and -10b, human TEC line HK-2 cells and human podocytes were incubated with various concentrations of glucose or mannitol (osmolality control) for the indicated time. High glucose, but not mannitol, markedly downregulated the expression of miR-10a and -10b in a dose- and time-dependent manner (Figures 3A–3D and S2A–S2D), suggesting an osmolality-independent effect of high glucose on miR-10 expression. Downregulation of miR-10a/b induced by high glucose was not reversed by the inhibitors of intracellular oxidative stress or scavengers of reactive oxygen species (ROS) (Figures S2E and S2F), suggesting that it was not oxidative stress-dependent.
Figure 3.

miR-10a/b inhibited the NLRP3 inflammasome in vitro through targeting the 3′ UTR of NLRP3 mRNA
(A–D) Expression of miR-10a and -10b in human tubular epithelial cells (TECs) (A and B) or podocytes (C and D) incubated with various concentrations of glucose or mannitol. (E) Putative conserved binding site of NLRP3 with miR-10a/b and seed sequence of miR-10a/b (Ea), and the mutated 3′ UTR and mutated miR-10a/b (Eb). (F and G) Luciferase activity in TECs (F) or human podocytes (G) transfected with constructed plasmids. (H) Western blot for the NLRP3 inflammasome in miR-10a and -10b knockout (KO) TECs or podocytes in the presence or absence of 2 5mM glucose. (I and J) Restoring miR-10 with its mimic in cells knocking out miR-10 inhibited high glucose-induced NLRP3 inflammasome activation, while rescuing miR-10a or -10b with a mutated seed sequence (Mut) had no effect on glucose-triggered NLRP3 activation. Data are expressed as means ± SEM of three independent experiments. ANOVA was used for comparison among multiple groups. ∗p < 0.05, ∗∗p < 0.01.
High glucose, but not mannitol, increased NLRP3 protein (Figures S3A–S3D) but not its mRNA expression (Figures S3E–S3H), which was accompanied by activation of the NLRP3 inflammasome, as manifested by increased cleavage of Casp1 to Casp1 p10 that promoted cleavage of pro-IL-1β to matured IL-1β (Figures S3A–S3D). Inconsistency between protein and mRNA of NLRP3 indicated a post-transcriptional regulation.
To determine whether miR-10 interacts with NLRP3, we predicted the potential targets of miR-10a and -10b using a combination of several software programs, including TargetScan, miRDB, and miRanda.25, 26, 27 Our three software programs consistently predicted the mRNA of NLRP3, an essential protein upstream of NLRP3 inflammasome signaling. The base sequence in the 3′ UTR of NLRP3 mRNA is highly conserved between humans and mice, which offer binding sites for miR-10a and -10b (Figure 3Ea). The seed sequence (the core sequences encompass the first two to eight bases of the mature miRNA) of miR-10a and -10b base paired with the 3′ UTR of NLRP3 mRNA with a free energy of −23.2 kcal/mol (for miR-10a) and −22.1 kcal/mol (for miR-10b) for humans and −21.1 kcal/mol (for both miR-10a and -10b) for mice (Figures S3I and S3J).
To validate the binding of miR-10a/b to human NLRP3, the wild-type 3′ UTR sequence of NLRP3 (Figure 3Ea) and the mutated one (Figure 3Eb, red parts) were cloned into luciferase plasmids, respectively. The reporter constructs were co-transfected into TECs or podocytes with nonsense sequence, miR-10a/b mimic, or antisense sequence of miR-10a/b, respectively. A luciferase assay showed that overexpression of miR-10a and -10b by their mimics suppressed luciferase activity in cells transfected with wild-type 3′ UTR of NLRP3, whereas inhibition of miR-10a and -10b by their antisense sequences enhanced luciferase activity (Figures 3F and 3G). Mutation of the seed sequence of miR-10a or -10b by its complementary sequence abolished the effect of miR-10a/b on regulating luciferase activity. Moreover, when the binding site in the 3′ UTR of NLRP3 was replaced by its complementary sequence, miR-10a/b failed to regulate the luciferase activity (Figures 3F and 3G). These results indicate that the binding site in NLPR3 mRNA and the seed sequence of miR-10a/b are both indispensable for their interaction in human TECs and podocytes.
To further validate the role of miR-10a and -10b in regulating NLRP3 inflammasome signaling, we knocked out miR-10a and -10b by CRISPR-caspase-9 in TECs and human podocytes. qRT-PCR analysis showed that the expression of miR-10a and -10b in knockout cells was reduced by 90% of their original levels (Figures S3K and S3L), without changing NLRP3 mRNA expression (Figures S3M and S3N). Knocking out miR-10a and -10b significantly increased the expression of NLRP3 and its downstream inflammatory cascade, such as increased cleavage of Casp1 and IL-1β, in the presence or absence of high glucose stimulation (Figure 3H). However, ASC protein (apoptosis-associated speck-like protein containing a CARD), an inflammasome adaptor protein, was not influenced by miR-10a/b knockout (Figure 3H).
In addition, restoring miR-10a or -10b in cells knocking out miR-10a/b significantly inhibited high glucose-induced activation of the NLRP3 inflammasome, whereas rescuing miR-10a or -10b with a mutated seed sequence had no effect on glucose-triggered NLRP3 inflammasome activation (Figures 3I and 3J).
Modulation of miR-10a/b expression in vivo impacts renal inflammation in STZ-treated mice
To further validate the effect of miR-10a/b on renal inflammation, lentivirus harboring the mimic of miR-10a or -10b or its antisense was injected into the kidney, respectively, at 1 week before STZ treatment. Mice were sacrificed after 12 weeks (Figure 4A). The renal expression of miR-10a and -10b in mice delivered with miR-10a/b mimic was increased by 3.6- (miR-10a) and 4.3-fold (miR-10b), while in mice delivered with antisense, expression of miR-10a and -10b decreased by 57% (miR-10a) and 49.7% (miR-10b) at 12 weeks, compared to their lentivirus vector control (Figures S4A–S4C).
Figure 4.

Modulation of miR-10a/b expression in vivo impacted renal inflammation in STZ-treated mice
(A) Schematic diagram of the experimental procedure. (B and C) Activation of the NLRP3 inflammasome cascade in kidney was inhibited by overexpression of miR-10a or -10b through injecting lentivirus harboring mimic. Western blotting analysis (B) and quantification data (C) are presented. (D and E) Knocking down miR-10a or -10b by antisense-enhanced NLRP3 inflammasome activation in kidney. Western blotting analysis (D) and quantification data (E) are shown. (F–I) Representative immunohistochemical staining of NLRP3 and CD11b and PASM staining in kidney sections (F), and quantification data (G–I). Scale bar, 40 μm. (J) Urinary albumin excretion. (K) Flow cytometry analysis for CD45-, CD11c-, CD3-, CD3/CD4-, and CD3/CD8-positive cells in single kidney cell suspensions. Data are expressed as means ± SEM; n = 6 for each group. ANOVA was used for comparison among multiple groups. ∗p < 0.05, ∗∗p < 0.01.
Overexpression of miR-10a or -10b via its mimic reversed the STZ-induced activation of NLRP3 and its downstream cascade (Figures 4B and 4C). In contrast, knocking down miR-10a or -10b by its antisense enhanced activation of the NLRP3 inflammasome (Figures 4D and 4E). Of note, overexpressing or knocking down miR-10a and -10b did not influence NLRP3 mRNA expression (Figures S4D and S4E). As shown in Figures 4F–4J and S4F, overexpression of miR-10a or -10b before STZ treatment significantly attenuated STZ-induced NLRP3 expression, macrophage infiltration, pro-inflammatory factor expression, mesangial expansion in the diabetic kidney, and reduced albuminuria. However, knocking down miR-10a or -10b aggravated renal inflammation, deteriorated the kidney damage, and increased urinary albumin excretion.
Apart from improvement in albuminuria in diabetic mice, we further tested whether miR-10 had an effect on podocyte injury in STZ-treated mice. Kidney samples were collected at 12 weeks after STZ treatment. Expression of the podocyte-associated molecule podocin and the number of apoptotic cells in glomeruli were analyzed in kidney tissue. As shown in Figures S4G and S4H, overexpressing miR-10a/b attenuated, whereas knocking down miR-10a/b augmented, podocyte injury and glomerular cell apoptosis in STZ-treated mice.
To evaluate the effects of sustained inflammation on fibrosis, we examined the levels of extracellular matrix deposition in kidney from STZ-treated mice at 12 weeks. Overexpressing miR-10 or -10b decreased extracellular matrix deposition, whereas knocking down miR-10a or -10b enhanced kidney fibrosis (Figures S4I and S4J).
Flow cytometry analysis indicated that renal accumulation of immune cells, including total leukocytes (CD45+), macrophages (CD11c+), T cells (CD3+), helper T cells (CD3+/CD4+), and killer T cells (CD3+/CD8+), was significantly decreased in miR-10a or -10b overexpressed mice, but increased in those with knockdown of miR-10a or -10b (Figure 4K).
Restoring miR-10a/b in the diabetic kidney attenuates inflammation by targeting the NLRP3 inflammasome
To determine whether restoring miR-10a/b in the diabetic kidney could inhibit the NLRP3 inflammasome and thus attenuate renal inflammation in DKD, lentivirus harboring miR-10a or -10b or nonsense sequence mimics (negative control mimics) was injected into the kidneys 6 weeks after STZ treatment. The animals were sacrificed at 12 weeks after STZ administration (Figure 5A). Delivered miR-10a or -10b was equally distributed in the kidneys (Figure S5A) and restored renal miR-10a/b to the levels that were comparable to the control animals (Figures S5A and S5B). Restoration of miR-10a or -10b remarkably inhibited activation of the NLRP3 signal cascade but not the NLRP3 mRNA level (Figures 5B–5E and S5C), attenuated cellular inflammation (Figures 5D and 5F) and mesangial expansion (Figures 5D and 5G) in the diabetic kidney, and improved albuminuria (Figure 5H). There was no significant difference in the effect of delivering miR-10a and -10b on DKD.
Figure 5.

Restoring miR-10a/b in diabetic kidney attenuated renal inflammation by targeting the NLRP3 inflammasome
(A) Schematic diagram of the experimental procedure. (B and C) Activation of the NLRP3 inflammasome cascade in kidney was attenuated by restoring miR-10a or -10b mimic in STZ-treated mice. Western blotting analysis (B) and quantification data (C) are shown. (D–G) Representative images of NLRP3 and CD11b immunohistochemical and PASM staining in kidney sections (D) and quantification data (E–G). Scale bar, 40 μm. (H) Urinary albumin excretion in STZ-treated mice. (I and J) Flow cytometry analysis for CD45-, CD11c-, CD3-, CD3/CD4-, and CD3/CD8-positive cells in single-cell suspensions of kidney from STZ-treated mice (I), and the quantification data (J). (K and L) Activation of the NLRP3 inflammasome cascade in kidney was attenuated by restoring miR-10a or -10b mimic in db/db mice. Western blotting analysis (K) and quantification data (L) are shown. (M) Flow cytometry analysis for immune cells in single-cell suspensions of kidney from db/db mice. (N) Changes in albuminuria in db/db mice. Data are expressed as means ± SEM; n = 6 for each group. ANOVA was used for comparison among multiple groups. ∗p < 0.05, ∗∗p < 0.01.
As shown in flow cytometry analysis (Figures 5I and 5J), rescue of miR-10a or -10b alleviated the accumulation of immune cells, including total leukocytes (CD45+), macrophages (CD11c+), T cells (CD3+), helper T cells (CD3+/CD4+), and killer T cells (CD3+/CD8+) in STZ-treated diabetic mice.
As previously reported,28 db/db mice developed mesangial expansion and albuminuria at the age of 6–8 weeks. Overexpression of miR-10a or -10b at 8 weeks of age inhibited the NLRP3 signal with intact NLRP3 mRNA (Figures 5K, 5L, and S5E) and cellular inflammation (Figures 5M and S5F–S5H) in the kidney, and it mitigated albuminuria in 18-week-old db/db mice (Figure 5N). These results suggest that targeting the NLRP3 inflammasome by miR-10a/b inhibits kidney inflammation in DKD.
Intrarenal miR-10a/b are downregulated and negatively correlate with renal inflammation in patients with DKD
To evaluate the role of miR-10a/b in the pathogenesis of human DKD, we conducted a cross-sectional analysis for the association of miR-10a/b expression and the NLRP3 inflammasome in a cohort of 27 patients with biopsy-proven DKD. Characteristics of patients at the time of biopsy are shown in Table S1. In situ hybridization showed that normal human kidney (tissue adjacent to renal carcinoma) constitutively expressed miR-10a and -10b. Expression levels of miR-10a and -10b were clearly downregulated in renal biopsy samples from patients with DKD and accompanied by activation of NLRP3 and accumulation of CD11b+ macrophages (Figures 6A–6E). Partial correlation analysis showed negative correlations between renal expression of miR-10a/b and NLRP3 or macrophage accumulation after adjusting the confounders such as mean arterial blood pressure and urinary protein excretion; furthermore, miR-10a/b expression was negatively correlated with urinary protein excretion in patients with DKD (Figures 6F–6K).
Figure 6.

Intrarenal miR-10a/b downregulated and was negatively correlated with renal inflammation in patients with DKD
(A–E) Representative images of in situ hybridization for miR-10a/b and immunohistochemistry for NLRP3 and CD11b in renal biopsy samples from patients with DKD (A) and quantification data (n = 6 for control, n = 27 for patients with DKD) (B–E). (F and G) Partial correlation analysis for association between renal miR-10a with NLRP3 expression (F) or accumulation of CD11b+ cells (G) after adjusting the confounders, including mean arterial pressure and urinary protein excretion. (H) Correlation between miR-10a expression and proteinuria. (I and J) Partial correlation analysis for association between renal miR-10b with NLRP3 expression (I) and accumulation of CD11b+ cells (J) after adjusting the confounders, including mean arterial pressure and urinary protein excretion. (K) Correlation between miR-10b and proteinuria. Data are expressed as means ± SEM. ∗∗p < 0.01.
Discussion
DKD is considered an inflammatory disease. Emerging evidence demonstrates that inflammasome activation plays a critical role in the pathogenesis of DKD. In this study, we found that kidney-enriched miR-10a and -10b were downregulated in animal and human DKD. miR-10a/b functioned as the negative regulators of the NLRP3 inflammasome through targeting the 3′ UTR of NLRP3 mRNA, inhibiting assembly of the NLRP3 inflammasome and decreasing Casp1-dependent release of pro-inflammatory cytokines. Restoring miR-10a and -10b in the diabetic kidney significantly inhibited activation of the NLRP3 pathway and attenuated kidney inflammation in both db/db and STZ-induced DKD mice. These results may suggest a novel intervention for kidney inflammation by targeting the NLRP3 inflammasome in DKD.
Tissue-specific miRNAs are essential for maintaining normal physiological functions. In our study, miR-10a/b were expressed in the epidermal organs, predominantly in kidney glomerular podocytes and TECs. The distribution and function of miR-10a and -10b are indistinguishable. miR-10a and -10b belong to the miR-10 family with only one nucleotide difference in the non-seed sequence.26,27 High similarity in the sequence indicates that miR-10a and -10b may play a similar role in physiological and pathological processes.
Consistent with previous studies,23,29 we found that expression levels of miR-10a and -10b are significantly downregulated in diabetic kidney. The levels of miR-10a and -10b negatively correlate with the inflammatory response in the diabetic kidney, suggesting that they may be involved in regulation of kidney inflammation in DKD. The mechanisms underlying the decrease in miR-10a and -10b expression remain to be studied. Our in vitro study showed that reduced miR-10a and -10b by high glucose could not be reversed by antioxidants, suggesting that alteration in miR-10a and -10b expression may not be attributed to cellular oxidative stress.
An important finding in our study is that miR-10a/b negatively regulated the NLRP3 inflammasome in the diabetic kidney. The NLRP3 inflammasome has a critical role in the pathogenesis of DKD.11,12 The expression of markers of NLRP3 inflammasome activation, such as Casp1 and IL-1 in kidney biopsy samples, was significantly increased and positively associated with the severity of albuminuria.13,30 Although several molecules, including miR-2231 and miR-223,32,33 have been reported to regulate the activation of NLRP3, there remains a large gap in understanding the key regulators.10 In this study, we provided several lines of evidence demonstrating that miR-10a and -10b were negative regulators for activation of the NLRP3 inflammasome. miR-10a/b, through their complementary sequences, interacted with the 3′ UTR of NLRP3 and inhibited NLRP3 mRNA translation at the post-transcriptional level. Supporting this notion, delivery of miR-10a/b to mouse kidney before STZ treatment prevented NLRP3 inflammasome activation and kidney inflammation and improved albuminuria in STZ-induced diabetic mice. Conversely, knocking down miR-10a/b upregulated the expression of markers of NLRP3 inflammasome activation. Furthermore, restoration of miR-10a/b expression in established DKD also significantly ameliorated kidney inflammation and albuminuria in db/db and STZ-treated mice. We also detected a close correlation of miR-10a/b with NLRP3 expression and macrophage infiltration in biopsy samples from a cohort of patients with biopsy-proven DKD. These data suggest that hyperglycemia-induced downregulation of miR-10a/b may enhance NLRP3 inflammasome activation and increase inflammatory cytokine release in renal resident cells, such as TECs and podocytes, resulting in macrophage accumulation and kidney damage. Consistent with previous reports,34, 35, 36 we found that expression of other proinflammatory factors, such as tumor necrosis factor (TNF)-α and IL-6, increased in the diabetic kidney. Modulating miR-10a/b expression influenced activation of these cytokines, supporting the observation that upregulation of IL-1β increases activation of TNF α and IL-6.37,38 Interestingly, we found that in addition to regulating activation of IL-1β, miR-10 also regulated podocyte injury and glomerular cell apoptosis in the diabetic kidney. These data suggest that targeting NLRP3 might be a key strategy for treatment of DKD.
There are limitations to this study. We were not able to investigate the role of miR-10a/b in conditional knockout or NLRP3-deficient mice, which may yield more convincing evidence. Moreover, the mechanism underlying downregulation of miR-10a/b by high glucose remains to be illustrated in further studies.
In conclusion, our study identified kidney-enriched miR-10a/b that function as endogenous inhibitors of the NLRP3 inflammasome and regulate kidney inflammation in DKD. These findings provide novel insights into understanding kidney sterile inflammation in diabetes. Our results suggest a new therapeutic target for halting the most damaging process in DKD.
Materials and methods
Experimental design
The objective of this study was to identify and evaluate whether kidney-enriched miRNAs regulate renal inflammation and are potentially suitable as a therapeutic target for DKD. Using in situ hybridization and qRT-PCR, we showed that miR-10a and -10b were enriched in kidney, predominantly in glomerular podocytes and TECs.
To examine the regulative effect of miR-10a/b on kidney inflammation in DKD, knocking out and restoration of miR-10a/b were performed in human podocytes and TECs in the absence or presence of high-glucose stimulation in vitro, and luciferase assay was conducted to determine the interaction between the 3′ UTR of NLRP3 mRNA and the seed sequence of miR-10a/b predicted by bioinformatics. To validate the role of miR-10a/b in vivo, loss- and gain-of-function experiments were performed in DKD mice, including uninephrectomized STZ-treated mice feeding with a high-fat diet and db/db mice, before or after onset of DKD. To evaluate kidney inflammation, renal expression of NLRP3 and its downstream cascade was analyzed by western blot and immunohistochemistry staining, the accumulation of macrophages and T cells was quantified by flow cytometry, and the expression of proinflammatory cytokines was analyzed by western blot and immunohistochemistry studies. Kidney damage in DKD was shown by histopathological analysis and the functional phenotype represented by urinary albumin excretion rate.
To evaluate the role of miR-10a/b in the pathogenesis of human DKD, we conducted a cross-sectional analysis for the association of miR-10a/b expression and kidney inflammation in a cohort of 27 patients with biopsy-proven DKD. The correlations between miR-10a/b with NLRP3 expression and macrophage infiltration in the kidney biopsy samples were analyzed and adjusted by the confounders with partial correlation analysis.
Cell culture
The human podocytes were cultured under permissive condition in RPMI 1640 media (11 mmol/L glucose, Life Technologies, Grand Island, NY, USA) containing 10% fetal bovine serum (FBS), 0.1% antibiotic/antimycotic solution, and Insulin-Transferrin-Selenium-Ethanolamine solution (ITS) (Life Technologies) at 33°C in an incubator with 5% CO2. When cells reached 70% confluence, they were thermoswitched to 37°C for another 8 days to induce differentiation. The human renal TECs (HK2) were maintained in DMEM/low-glucose (5.5 mmol/L) medium (Life Technologies) with 10% FBS and antibiotics at 37°C in a 5% CO2 incubator.
Animal model
STZ-induced DKD
Male C57BL/6J mice at 6–8 weeks of age (body weight of 20–25 g) were used to generate a high-fat diet and STZ-induced DKD model as previously described.39 Briefly, uninephrectomized mice were fasted for 4 h followed by intraperitoneal STZ injection (50 mg/kg) for 5 consecutive days. Blood glucose levels were monitored 1 week after the last STZ injection, and mice with fasting blood glucose levels >15 mmol/L were considered diabetic. Mice were feed with a high-fat diet containing 60% fat (Guangdong Medical Animal Center, Guangzhou, China) with unrestricted access to food/water for 12 weeks. The kidneys were harvested 12 weeks after STZ injection. The animal study protocol was approved by Institutional Animal Care and Use Committee at Nanfang Hospital.
db/db mice
db/db (leptin receptor db/db) mice at age of 8 weeks were obtained from the Model Animal Research Center of Nanjing University (Nanjing, China). Age-matched nondiabetic db/m mice (C56BL/6J background) were used as a control.
Human subjects
Renal biopsy samples from 27 patients with biopsy-proven DKD was analyzed. Diagnosis of DKD was confirmed by both kidney histological and scanning electron microscopy examination. Kidney samples from patients who received nephrectomy for solitary renal carcinoma and without diabetes or kidney disease were used as controls. Clinical data were obtained from medical records at the time of biopsy. The use of tissue samples was approved by the Institutional Review Board of the National Clinical Research Center for Kidney Disease of Nanfang Hospital. All of the study participants provided written informed consent.
Gene analysis
Gene delivery
For animal studies, 1 week before or 6 weeks after STZ injection, recombinant lentivirus vectors pGLV-harboring miR-10a or -10b mimic, or their antisense or nonsense sequence (GenePharma, Shanghai), were delivered into mouse kidney as previously described.39 Briefly, 100 μL (105 transducing units [TU]/μL) of lentivirus was injected into the temporary obstructed kidney by using a 31G needle syringe in anesthetized mice. The needle was inserted from the lower pole to the upper pole of the kidney, and lentivirus solution was injected when the needle was slowly withdrawn. To monitor lentivirus distribution in the kidney, pGLV-expressing GFP (GenePharma, Shanghai) was used as the tracer.
For cell transient transfection, synthetic miR-10a or -10b mimic (GenePharma, Shanghai) was introduced into the cells by Lipofectamine 3000 (Invitrogen) following the manufacturer’s instructions.
Gene knockout in cells
Knocking out miR-10a and -10b in cultured cells was performed by CRISPR-Cas9. Small guide RNAs (sgRNAs) targeting the genome sequence of miR-10a and -10b were cloned into MCS-EF1a-Cas9-FLAG-P2A-puro vector. The sgRNA sequences targeting miR-10a were as follows: sgRNA 10a-1, 5′-GTGGTCACAAATTCGTATCT-3′; 10a-2, 5′-TTACACAAATTCGGATCTAC-3′. The sgRNA sequences targeting miR-10b were as follows: sgRNA 10b-1, 5′-CCACACAAATTCGGTTCTAC-3′; 10b-2, 5′-ATAGTCACAGATTCGATTCT-3′. The lentivirus harboring sgRNA and Cas9 were customized by GeneChem (Shanghai, China) and applied to transfected human podocytes and HK2 cells according to the manufacturer’s instructions.
Luciferase
To determine the interaction between miR-10a/b and NLRP3 mRNA, the full-length 3′ UTR of NLRP3 was amplified via PCR with human genomic DNA as the template and inserted downstream of the pGL3 promotor (Promega), referred to as WT. Binding site of the seed sequence for miR-10a/b was mutated from CAGGGUG into GUCCCAU. The resulting constructs were co-transfected with miR-10a/b mimic or miR-10a/b antisense, nonsense RNA without a binding site in the host cells into human podocytes or HK2 cells using Lipofectamine 3000. 24 h after transfection, cell lysates were subjected to luciferase assay with a Dual-Luciferase reporter assay system (Promega). Luciferase activity was normalized to Renilla luciferase activity (Promega).
miR-10a/b expression
In situ hybridization in kidney
In situ hybridization for miR-10a and -10b was performed with double digoxigenin-labeled locked nucleic acid (LNA) miRCURY probes (Exiqon, Woburn, MA, USA). U6 was served as the positive control whereas a scrambled probe was conducted as negative control. Paraffin-embedded tissue was cut into 5-μm-thick sections and incubated with indicated probes at 54°C for 2 h. An anti-digoxigenin antibody conjugated with alkaline phosphatase (Roche) was used, followed by color development with nitroblue tetrazolium (NBT)/5-bromo-4-chloro-3-indolyl phosphate (BCIP) (Roche) as substrates. Sections were counterstained with fast red. After mounting, the miR-10a and miR-10b expression levels were visualized under phase-contrast microscopy. Positive staining area were quantified with Image-Pro plus 6.0 software.
Quantitative real-time RT-PCR
Total RNA was isolated from tissues or cells using TRIzol reagent (Invitrogen, Carlsbad, CA, USA), according to the manufacturer’s instructions. A MystiCq miRNA qPCR assay (Sigma-Aldrich, St. Louis, MO, USA) was used to quantify miR-10a/b expression according to the manufacturer’s instructions, and U6 was used as the internal control. For relative miRNA expression, miR-10a/b expression was calculated as 2−△CT (△CT = CTmiR − CTU6).
Histology, immunohistochemistry, immunofluorescence, and TUNEL staining
For histology, kidney tissue was embedded in paraffin and cut into 1- to 2-μm-thick sections for hematoxylin and eosin (H&E) and periodic acid-silver methenamine (PASM) staining. Mesangial index was calculated as the ratio of mesangial area to glomerular tuft area by Image-Pro plus 6.0 software.
For immunohistochemistry and immunofluorescence, 6-μm-thick sections for mice and 5-μm-thick sections for humans were used, respectively. After antigen retrieval and blocking, primary antibodies against NLRP3 (Abcam, Cambridge, UK), CD11b (Abcam), α-smooth muscle actin (α-SMA) (Sigma-Aldrich), fibronectin (Sigma-Aldrich), and podocin (Sigma-Aldrich) were incubated at 4°C overnight. Staining was developed with diaminobenzidine (DAB) and counterstained with hematoxylin for immunohistochemistry and with DAPI for immunofluorescence, respectively. Positive staining areas were quantified with Image-Pro plus 6.0 software.
Cellular apoptosis was evaluated by using a TUNEL (terminal deoxynucleotidyl transferase-mediated deoxyuridine triphosphate nick end labeling) apoptosis detection system (Promega), and nuclei were counterstained with DAPI.
Semi-quantification of histological and immunohistochemical staining was performed by two pathologists independently in a blinded manner.
Expression of inflammatory mediators
Flow cytometry
Kidney tissue was minced with fine scissors and digested with collagenase IV for 40 min at 37°C with intermittent agitation to prepare single-cell suspensions. Cell suspensions were passed through a 70-μm cell strainer and blocked with FBS. The antibodies used for flow cytometry were purchased from BD Biosciences (San Jose, CA, USA): anti-CD3e-fluorescein isothiocyanate (FITC) (145-2C11), anti-CD4-phycoerythrin (PE) (GK1.5), anti-CD8A-peridinin chlorophyll protein (PerCP)-Cy5.5 (53-6.7), anti-CD45-FITC (30-F11), and anti-CD11c-PE (HL3). The cell suspensions were then immediately analyzed on a flow cytometer (Becton Dickinson, CA, USA). Data analysis was performed using FlowJo software (Tree Star, San Carlos, CA, USA).
Western blotting
Tissue or cell lysates were prepared with radioimmunoprecipitation assay buffer containing protease inhibitor cocktail (Roche, Indianapolis, IN, USA). The blots were incubated with primary antibody against NLRP3 (Abcam, Cambridge, UK), Casp1 (Abcam), IL-1β (Santa Cruz Biotechnology, Santa Cruz, CA, USA), ASC (Sigma-Aldrich), and GAPDH (Santa Cruz Biotechnology). The protein expression of NLRP3 was normalized to GAPDH. Expression of Casp1 p10 and mature IL-1β protein was normalized to their proform, respectively.
Quantitative real-time RT-PCR
The expression levels of mRNA were determined by quantitative real-time RT-PCR using a SYBR Premix Ex Taq kit (Takara Bio, Japan) on a 7500 fast real-time PCR System (Applied Biosystems, CA, USA). All reactions were performed in triplicate. The sequences of specific primers were as follows: human NLRP3, 5′-TGAAGAAAGATTACCGTAAGAAGTACAGA-3′, 5′-GCGTTTGTTGAGGCTCACACT-3′; mouse NLRP3, 5′-AGAGCCTACAGTTGGGTGAAATG-3′, 5′-CCACGCCTACCAGGAAATCTC-3′; IL-1β, 5′-TGCCACCTTTTGACAGTGATG-3′, 5′-TGATGTGCTGCTGCGAGATT-3′; IL-6, 5′-GTCCTTCCTACCCCAATTTCCA-3′, 5′-CGCACTAGGTTTGCCGAGTA-3′; TNF-α, 5′-GATCGGTCCCCAAAGGGATG-3′, 5′-GTGGTTTGTGAGTGTGAGGGT-3′.
Urinary albumin excretion
24-h urine from each mouse was collected with a metabolic cage. Urinary albumin levels were measured with an albumin ELISA kit (Bethyl Laboratories, Montgomery, TX, USA) according to the manufacturer’s instructions. Urine albumin excretion was calculated by albumin concentration multiplied by 24-h urine volume.
Statistical analysis
All values are presented as the mean ± SEM, unless otherwise indicated. Differences between groups were analyzed using an unpaired Student’s t test (for comparison between two samples) or analysis of variance (ANOVA) (for multiple comparisons). Statistical calculations were performed using GraphPad Prism version 6.0 (GraphPad, San Diego, CA, USA). Statistical significance was accepted at p <0.05; symbols are explained in the figure legends. For each experiment, n is indicated in the figure legend and refers to biological replicates.
Acknowledgments
This work was supported by the National Natural Science Foundation of China (81700640 to H.D.); The Major International (Regional) Joint Research Project of National Natural Science Foundation of China (81620108003 to F.F.H.); The National Natural Science Foundation of China (Key Program) (82030022 to F.F.H.); The National Innovation Team Program (81521003 to Y.L.); and by the Guangzhou Regenerative Medicine and Health-Guangdong Laboratory Research Grant (2018GZR0201003 and 2018GZR110102004 to F.F.H.).
Author contributions
H.D. participated in the study design and manuscript writing. H.D., J.L., Y.L., M.Y., S.N., M.Z., and Z.Z. conducted the experiments. H.D. and X.Y. analyzed the data. Y.L. revised a draft of manuscript. F.F.H. designed the study and wrote the paper.
Declaration of interests
The authors declare no competing interests.
Footnotes
Supplemental information can be found online at https://doi.org/10.1016/j.ymthe.2021.03.012.
Supplemental information
References
- 1.Declèves A.E., Sharma K. New pharmacological treatments for improving renal outcomes in diabetes. Nat. Rev. Nephrol. 2010;6:371–380. doi: 10.1038/nrneph.2010.57. [DOI] [PubMed] [Google Scholar]
- 2.Tang S.C.W., Yiu W.H. Innate immunity in diabetic kidney disease. Nat. Rev. Nephrol. 2020;16:206–222. doi: 10.1038/s41581-019-0234-4. [DOI] [PubMed] [Google Scholar]
- 3.Wada J., Makino H. Innate immunity in diabetes and diabetic nephropathy. Nat. Rev. Nephrol. 2016;12:13–26. doi: 10.1038/nrneph.2015.175. [DOI] [PubMed] [Google Scholar]
- 4.Galkina E., Ley K. Leukocyte recruitment and vascular injury in diabetic nephropathy. J. Am. Soc. Nephrol. 2006;17:368–377. doi: 10.1681/ASN.2005080859. [DOI] [PubMed] [Google Scholar]
- 5.Wada J., Makino H. Inflammation and the pathogenesis of diabetic nephropathy. Clin. Sci. (Lond.) 2013;124:139–152. doi: 10.1042/CS20120198. [DOI] [PubMed] [Google Scholar]
- 6.Barutta F., Bruno G., Grimaldi S., Gruden G. Inflammation in diabetic nephropathy: Moving toward clinical biomarkers and targets for treatment. Endocrine. 2015;48:730–742. doi: 10.1007/s12020-014-0437-1. [DOI] [PubMed] [Google Scholar]
- 7.Klessens C.Q.F., Zandbergen M., Wolterbeek R., Bruijn J.A., Rabelink T.J., Bajema I.M., IJpelaar D.H.T. Macrophages in diabetic nephropathy in patients with type 2 diabetes. Nephrol. Dial. Transplant. 2017;32:1322–1329. doi: 10.1093/ndt/gfw260. [DOI] [PubMed] [Google Scholar]
- 8.Nguyen D., Ping F., Mu W., Hill P., Atkins R.C., Chadban S.J. Macrophage accumulation in human progressive diabetic nephropathy. Nephrology (Carlton) 2006;11:226–231. doi: 10.1111/j.1440-1797.2006.00576.x. [DOI] [PubMed] [Google Scholar]
- 9.Tang S.C.W., Chan L.Y.Y., Leung J.C.K., Cheng A.S., Chan K.W., Lan H.Y., Lai K.N. Bradykinin and high glucose promote renal tubular inflammation. Nephrol. Dial. Transplant. 2010;25:698–710. doi: 10.1093/ndt/gfp599. [DOI] [PubMed] [Google Scholar]
- 10.Swanson K.V., Deng M., Ting J.P. The NLRP3 inflammasome: Molecular activation and regulation to therapeutics. Nat. Rev. Immunol. 2019;19:477–489. doi: 10.1038/s41577-019-0165-0. [DOI] [PMC free article] [PubMed] [Google Scholar]
- 11.Strowig T., Henao-Mejia J., Elinav E., Flavell R. Inflammasomes in health and disease. Nature. 2012;481:278–286. doi: 10.1038/nature10759. [DOI] [PubMed] [Google Scholar]
- 12.Martinon F., Burns K., Tschopp J. The inflammasome: A molecular platform triggering activation of inflammatory caspases and processing of proIL-β. Mol. Cell. 2002;10:417–426. doi: 10.1016/s1097-2765(02)00599-3. [DOI] [PubMed] [Google Scholar]
- 13.Shahzad K., Bock F., Al-Dabet M.M., Gadi I., Kohli S., Nazir S., Ghosh S., Ranjan S., Wang H., Madhusudhan T. Caspase-1, but not caspase-3, promotes diabetic nephropathy. J. Am. Soc. Nephrol. 2016;27:2270–2275. doi: 10.1681/ASN.2015060676. [DOI] [PMC free article] [PubMed] [Google Scholar]
- 14.Bhatt K., Kato M., Natarajan R. Mini-review: Emerging roles of microRNAs in the pathophysiology of renal diseases. Am. J. Physiol. Renal Physiol. 2016;310:F109–F118. doi: 10.1152/ajprenal.00387.2015. [DOI] [PMC free article] [PubMed] [Google Scholar]
- 15.Fan B., Luk A.O.Y., Chan J.C.N., Ma R.C.W. MicroRNA and diabetic complications: A clinical perspective. Antioxid. Redox Signal. 2018;29:1041–1063. doi: 10.1089/ars.2017.7318. [DOI] [PubMed] [Google Scholar]
- 16.Wang P., Luo M.L., Song E., Zhou Z., Ma T., Wang J., Jia N., Wang G., Nie S., Liu Y., Hou F. Long noncoding RNA lnc-TSI inhibits renal fibrogenesis by negatively regulating the TGF-β/Smad3 pathway. Sci. Transl. Med. 2018;10:eaat2039. doi: 10.1126/scitranslmed.aat2039. [DOI] [PubMed] [Google Scholar]
- 17.Jopling C. Liver-specific microRNA-122: Biogenesis and function. RNA Biol. 2012;9:137–142. doi: 10.4161/rna.18827. [DOI] [PMC free article] [PubMed] [Google Scholar]
- 18.Pasquinelli A.E. MicroRNAs and their targets: Recognition, regulation and an emerging reciprocal relationship. Nat. Rev. Genet. 2012;13:271–282. doi: 10.1038/nrg3162. [DOI] [PubMed] [Google Scholar]
- 19.Beuvink I., Kolb F.A., Budach W., Garnier A., Lange J., Natt F., Dengler U., Hall J., Filipowicz W., Weiler J. A novel microarray approach reveals new tissue-specific signatures of known and predicted mammalian microRNAs. Nucleic Acids Res. 2007;35:e52. doi: 10.1093/nar/gkl1118. [DOI] [PMC free article] [PubMed] [Google Scholar]
- 20.Sun Y., Koo S., White N., Peralta E., Esau C., Dean N.M., Perera R.J. Development of a micro-array to detect human and mouse microRNAs and characterization of expression in human organs. Nucleic Acids Res. 2004;32:e188. doi: 10.1093/nar/gnh186. [DOI] [PMC free article] [PubMed] [Google Scholar]
- 21.Meng J., Li L., Zhao Y., Zhou Z., Zhang M., Li D., Zhang C.Y., Zen K., Liu Z. MicroRNA-196a/b mitigate renal fibrosis by targeting TGF-β receptor 2. J. Am. Soc. Nephrol. 2016;27:3006–3021. doi: 10.1681/ASN.2015040422. [DOI] [PMC free article] [PubMed] [Google Scholar]
- 22.Wu J., Zheng C., Fan Y., Zeng C., Chen Z., Qin W., Zhang C., Zhang W., Wang X., Zhu X. Downregulation of microRNA-30 facilitates podocyte injury and is prevented by glucocorticoids. J. Am. Soc. Nephrol. 2014;25:92–104. doi: 10.1681/ASN.2012111101. [DOI] [PMC free article] [PubMed] [Google Scholar]
- 23.Krupa A., Jenkins R., Luo D.D., Lewis A., Phillips A., Fraser D. Loss of microRNA-192 promotes fibrogenesis in diabetic nephropathy. J. Am. Soc. Nephrol. 2010;21:438–447. doi: 10.1681/ASN.2009050530. [DOI] [PMC free article] [PubMed] [Google Scholar]
- 24.Xiong M., Jiang L., Zhou Y., Qiu W., Fang L., Tan R., Wen P., Yang J. The miR-200 family regulates TGF-β1-induced renal tubular epithelial to mesenchymal transition through Smad pathway by targeting ZEB1 and ZEB2 expression. Am. J. Physiol. Renal Physiol. 2012;302:F369–F379. doi: 10.1152/ajprenal.00268.2011. [DOI] [PubMed] [Google Scholar]
- 25.Grimson A., Farh K.K.H., Johnston W.K., Garrett-Engele P., Lim L.P., Bartel D.P. MicroRNA targeting specificity in mammals: Determinants beyond seed pairing. Mol. Cell. 2007;27:91–105. doi: 10.1016/j.molcel.2007.06.017. [DOI] [PMC free article] [PubMed] [Google Scholar]
- 26.Betel D., Wilson M., Gabow A., Marks D.S., Sander C. The microRNA.org resource: Targets and expression. Nucleic Acids Res. 2008;36:D149–D153. doi: 10.1093/nar/gkm995. [DOI] [PMC free article] [PubMed] [Google Scholar]
- 27.Wang X. miRDB: A microRNA target prediction and functional annotation database with a wiki interface. RNA. 2008;14:1012–1017. doi: 10.1261/rna.965408. [DOI] [PMC free article] [PubMed] [Google Scholar]
- 28.Shahzad K., Bock F., Dong W., Wang H., Kopf S., Kohli S., Al-Dabet M.M., Ranjan S., Wolter J., Wacker C. Nlrp3-inflammasome activation in non-myeloid-derived cells aggravates diabetic nephropathy. Kidney Int. 2015;87:74–84. doi: 10.1038/ki.2014.271. [DOI] [PMC free article] [PubMed] [Google Scholar]
- 29.Yu J., Yu C., Feng B., Zhan X., Luo N., Yu X., Zhou Q. Intrarenal microRNA signature related to the fibrosis process in chronic kidney disease: Identification and functional validation of key miRNAs. BMC Nephrol. 2019;20:336. doi: 10.1186/s12882-019-1512-x. [DOI] [PMC free article] [PubMed] [Google Scholar]
- 30.Fang L., Xie D., Wu X., Cao H., Su W., Yang J. Involvement of endoplasmic reticulum stress in albuminuria induced inflammasome activation in renal proximal tubular cells. PLoS ONE. 2013;8:e72344. doi: 10.1371/journal.pone.0072344. [DOI] [PMC free article] [PubMed] [Google Scholar]
- 31.Hu Z., Lv X., Chen L., Gu X., Qian H., Fransisca S., Zhang Z., Liu Q., Xie P. Protective effects of microRNA-22-3p against retinal pigment epithelial inflammatory damage by targeting NLRP3 inflammasome. J. Cell. Physiol. 2019;234:18849–18857. doi: 10.1002/jcp.28523. [DOI] [PubMed] [Google Scholar]
- 32.Xu D., Zhang X., Chen X., Yang S., Chen H. Inhibition of miR-223 attenuates the NLRP3 inflammasome activation, fibrosis, and apoptosis in diabetic cardiomyopathy. Life Sci. 2020;256:117980. doi: 10.1016/j.lfs.2020.117980. [DOI] [PubMed] [Google Scholar]
- 33.Neudecker V., Haneklaus M., Jensen O., Khailova L., Masterson J.C., Tye H., Biette K., Jedlicka P., Brodsky K.S., Gerich M.E. Myeloid-derived miR-223 regulates intestinal inflammation via repression of the NLRP3 inflammasome. J. Exp. Med. 2017;214:1737–1752. doi: 10.1084/jem.20160462. [DOI] [PMC free article] [PubMed] [Google Scholar]
- 34.Pedigo C.E., Ducasa G.M., Leclercq F., Sloan A., Mitrofanova A., Hashmi T., Molina-David J., Ge M., Lassenius M.I., Forsblom C. Local TNF causes NFATc1-dependent cholesterol-mediated podocyte injury. J. Clin. Invest. 2016;126:3336–3350. doi: 10.1172/JCI85939. [DOI] [PMC free article] [PubMed] [Google Scholar]
- 35.Chen Y., Lee K., Ni Z., He J.C. Diabetic kidney disease: Challenges, advances, and opportunities. Kidney Dis. 2020;6:215–225. doi: 10.1159/000506634. [DOI] [PMC free article] [PubMed] [Google Scholar]
- 36.Verzola D., Cappuccino L., D’Amato E., Villaggio B., Gianiorio F., Mij M., Simonato A., Viazzi F., Salvidio G., Garibotto G. Enhanced glomerular Toll-like receptor 4 expression and signaling in patients with type 2 diabetic nephropathy and microalbuminuria. Kidney Int. 2014;86:1229–1243. doi: 10.1038/ki.2014.116. [DOI] [PubMed] [Google Scholar]
- 37.Kim S.M., Lee S.H., Kim Y.G., Kim S.Y., Seo J.W., Choi Y.W., Kim D.J., Jeong K.H., Lee T.W., Ihm C.G. Hyperuricemia-induced NLRP3 activation of macrophages contributes to the progression of diabetic nephropathy. Am. J. Physiol. Renal Physiol. 2015;308:F993–F1003. doi: 10.1152/ajprenal.00637.2014. [DOI] [PubMed] [Google Scholar]
- 38.Cahill C.M., Rogers J.T. Interleukin (IL) 1β induction of IL-6 is mediated by a novel phosphatidylinositol 3-kinase-dependent AKT/IκB kinase alpha pathway targeting activator protein-1. J. Biol. Chem. 2008;283:25900–25912. doi: 10.1074/jbc.M707692200. [DOI] [PMC free article] [PubMed] [Google Scholar]
- 39.Liu M., Liang K., Zhen J., Zhou M., Wang X., Wang Z., Wei X., Zhang Y., Sun Y., Zhou Z. Sirt6 deficiency exacerbates podocyte injury and proteinuria through targeting Notch signaling. Nat. Commun. 2017;8:413. doi: 10.1038/s41467-017-00498-4. [DOI] [PMC free article] [PubMed] [Google Scholar]
Associated Data
This section collects any data citations, data availability statements, or supplementary materials included in this article.