

Abstract
Rb1-inducible coiled-coil 1 (RB1CC1) has been demonstrated to function as an inhibitor of proline-rich/Ca-activated tyrosine kinase 2 (PYK2) by binding to the kinase domain of PYK2, which promotes the proliferation, invasion, and migration of renal cell carcinoma (RCC) cells. Additionally, in breast cancer, PYK2 positively regulates the expression of transcriptional co-activator with PDZ-binding motif (TAZ) which in turn can enhance PDL1 levels in breast and lung cancer cells. The current study was performed to decipher the impact of RB1CC1 in the progression of RCC via regulation of the PYK2/TAZ/PDL1 signaling axis. Expression of RB1CC1 and PYK2 was quantified in clinical tissue samples from RCC patients. The relationship between TAZ and PYK2, TAZ and PDL1 was then validated. The cellular processes of doxorubicin (DOX)-induced human RCC cell lines including the abilities of proliferation, colony formation, sphere formation and apoptosis, as well as the tumorigenicity of transfected cells, were evaluated after the alteration of RB1CC1 expression. RB1CC1 exhibited decreased expression in RCC tissues and was positively correlated with patient survival. RB1CC1 could inhibit the activity of PYK2, which in turn stimulated the stability of TAZ protein by phosphorylating TAZ. Meanwhile, TAZ protein activated PDL1 transcription by binding to the promoter region of PDL1. RB1CC1 overexpression or PYK2 knockdown could help everolimus (EVE) to inhibit tumor proliferation and activate immune response. Taken together, RB1CC1 can potentially augment the response of RCC cells to immunotherapy by suppressing the PYK2/TAZ/PDL1 signaling axis.
Keywords: Renal cell carcinoma, Rb1-inducible coiled-coil 1, Proline-rich/Ca-activated tyrosine kinase 2, Tafazzin, Programmed cell death ligand 1
Introduction
Renal cell carcinoma (RCC) is the most prevalent adult renal malignancy, accounting for 85% of all renal tumors, while incidence continues to increase with the development of improved diagnostic imaging techniques in recent years [1]. RCC is often first detected as an organ-specific disease, locally advanced, metastatic to locoregional lymph nodes at the point of diagnosis [2]. Early diagnosis is extremely important for treating kidney cancer [3]. Systemic treatments for metastatic RCC have improved in recent years, with immune checkpoint inhibitors therapies being gradually recognized to improve the survival of patients [4]. Immunotherapy has recently been regarded as an important treatment for patients with solid tumors [5]. However, therapeutic resistance to immunotherapy in the tumor microenvironment can dramatically reduce the effectiveness of this treatment [6]. Therefore, it is necessary to improve our understanding of immunotherapies.
Rb1-inducible coiled-coil 1 (RB1CC1) is a recently identified tumor suppressor [7–9], which is involved in various cellular processes including growth, differentiation, proliferation, apoptosis, and autophagy [10]. Targeting RB1CC1 is an effective therapeutic strategy for various human cancers including clear cell renal carcinoma [11] and breast cancer [9]. The loss of nuclear RB1CC1 results in a significantly worse prognosis for patients with salivary gland cancers [12]. However, how RB1CC1 functions in the development of RCC remains poorly understood.
Downregulation of RB1CC1 leads to apoptosis of glioblastoma and microvascular endothelial cells by enhancing proline-rich/Ca-activated tyrosine kinase 2 (PYK2) activity [13]. PYK2 is a member of the non-receptor tyrosine kinase family, which regulates its downstream signaling by catalyzing protein phosphorylation [14]. PYK2 has been reported to promote survival, proliferation, migration, invasion, and metastasis of cancer cells [15]. For example, overexpression of PYK2 promotes the proliferation, invasion, and migration of RCC cells and reduces their rates of apoptosis [16]. In addition, PYK2 activity promotes the invasion of breast cancer through positive feedback regulation in breast cancer [17]. PYK2 enhances tumorigenesis of lung and brain cancers [18, 19]. PYK2 is capable of enhancing the tyrosine phosphorylation of transcriptional co-activator with PDZ-binding motif (TAZ) and promoting the TAZ stability in the context of triple-negative breast cancer [20]. TAZ is a mitochondrial enzyme, which transfers fatty acids from phospholipids to lysophospholipids and has been linked with tumor progression [21, 22]. TAZ expression is upregulated in RCC where it is thought to be involved in density-dependent nuclear or cytosolic translocation [23]. A direct protein–protein interaction between PYK2 and TAZ in the Hippo signaling pathway has been identified [20], which has been reported to regulate the expression of programmed cell death ligand 1 (PDL1) in RCC cells [24]. PDL1 is involved in immune evasion in various tumor types [25], meaning it is unsurprising that PDL1 is regarded as a novel prognostic marker for RCC [26]. In this study, we aimed to investigate the clinical significance of RB1CC1 in RCC and to explore the mechanisms by which RB1CC1 suppresses the development of RCC.
Materials and methods
Ethics statement
The study protocol was approved by the Medical and Clinical Research Ethics Committee of the First Affiliated Hospital, University of South China and performed in strict accordance with the Declaration of Helsinki. All participants signed consent documentation. Animal experimental procedures were in line with the animal care guideline of National Institutes of Health. Great efforts were made to minimize the number of animals used in the experiments and their discomfort.
Microarray-based gene expression profiling
Gene Expression Omnibus (GEO) database (https://www.ncbi.nlm.nih.gov/geo/) was initially used to retrieve datasets related to RCC, and GSE6344 was obtained, which included 10 normal samples and 10 RCC samples, with the platform of GPL96. “Limma” package of R language was applied for differential analysis of mRNA expression in RCC and normal samples with |logFC|> 2, p value < 0.05 set as the screening criteria. Heatmaps were constructed using R “pheatmap” package. In addition, the UALCAN database (http://ualcan.path.uab.edu/analysis.html) was utilized to analyze the expression of RB1CC1 in RCC patients, as well as its correlation with the survival of RCC patients [27]. The specific procedures are outlined here (http://ualcan.path.uab.edu/tutorial.html#step2b). Clinical data of patients in XML format were parsed with the use of Perl script to obtain, (1) patient vital status (Dead/Alive), (2) if the patient is alive, then “days_to_last_follow_up” from most recent follow-up, and (3) if the patient is dead, then “days_to_death”. Overall survival analysis was conducted using only patients with survival data and gene expression data from RNA-seq. As for each gene, a tab separated input file was created with the use of columns for the Cancer Genome Atlas (TCGA) sample ID, Time (days_to_death or days_to_last_follow_up), Status (Alive or Dead), and Expression (high, low, or medium expression). Samples were subsequently divided into two groups: (1) high expression (with transcripts per million [TPM] values above upper quartile) and (2) low/medium expression (with TPM values below upper quartile). A Kaplan–Meier survival plot was constructed for every gene in each TCGA cancer type with the use of “survival” package and “survminer” package. Finally, the survival curve of samples with high, low, or medium gene expression was compared by means of the log-rank test. The detailed clinical information of RCC patients in the TCGA database is shown in Supplementary Table 2.
Clinical sample collection
Five patients with RCC who underwent surgery from June 2018 to June 2019 were enrolled in this study; 2 males and 3 females, aged 26—61 years, with an average age of 43.06 ± 8.92 years. Both cancer tissues and adjacent normal tissues (serving as controls) were collected. All patients did not receive anti-tumor treatment before surgery. RCC was confirmed by postoperative pathological sections. Patients with distant metastases and cachexia were not included.
Immunohistochemistry
Paraffin sections of clinical tissues were dewaxed, dehydrated with gradient alcohol and immersed in 3% methanol H2O2 for 20 min. Normal goat serum blocking solution (C-0005, Shanghai Haoran Bio Technologies Co., Ltd., Shanghai, China) was added to the tissue sections, which was placed at room temperature for 20 min and then immunostained with primary rabbit anti-human antibodies (Abcam Inc., Cambridge, UK) against Ki67 (ab16667) and CD3/CD8 (ab4055; 1: 200) overnight at 4℃. The following day, the sections were then subjected to another incubation with secondary antibody goat anti-rabbit immunoglobulin G (IgG) (ab6785, 1: 1000, Abcam) at 37℃ for 20 min, and with streptavidin protein working solution (0343-10000U, Emerald Biotechnology Co., Ltd., Beijing, China) labeled with horseradish peroxidase at 37℃ for 20 min. Next, the sections were developed using diaminobenzidine (DAB) (ST033, Guangzhou Weijia Technology Co., Ltd., Guangzhou, China), counter-stained with hematoxylin (PT001, Shanghai Bogoo Biotechnology Co., Ltd., Shanghai, China) for 1 min and then treated with 1% ammonia hydroxide. The sections were then dehydrated with gradient alcohol, cleared using xylene and mounted with neutral gum. The sections were finally observed and photographed under a microscope with 5 high-power field of view randomly selected from each section according to the system. A total of 100 cells were counted in each field.
Cell transfection
The RCC cell lines A498 and ACHN purchased from American Type Culture Collection (ATCC; Manassas, VA, USA) were cultured in Roswell Park Memorial Institute (RPMI)-1640 medium (Thermo Fisher Scientific Inc., Waltham, MA, USA) containing 10% fetal bovine serum (FBS) (Thermo Fisher Scientific Inc.), 10 μg/mL streptomycin, and 100 U/mL penicillin at 37℃ under 5% CO2. Cells in the logarithmic growth phase were seeded in six-well plates at a density of 1 × 10⁵ cells/well. After 24 h in culture, cells were transfected with 3 μg pLVX-TetOne-Puro control plasmid or plasmid expressing RB1CC1 according to the instructions of Lipofectamine 2000 reagents (Invitrogen, Carlsbad, CA, USA). After 24 h of transfection, the medium was replaced with a complete one. After 24 h, the medium containing the recombinant virus was collected, filtered, and added with polybrene at a final concentration of 8 µg/mL (with the virus titer of 1 × 10⁹TU/mL) to infect A498 and ACHN cells. The infected cells were sieved with 0.5 g/mL puromycin for 7 days. The detailed information about RB1CC1 DOX-induced plasmid is shown in Supplementary Table 1.
Reverse transcription quantitative polymerase chain reaction (RT-qPCR)
Total RNA was extracted using the TRIzol reagent (15,596,026, Invitrogen, Carlsbad, CA, USA) and then reverse transcribed into complementary DNA (cDNA) using a PrimeScript RT reagent Kit (RR047A, Takara, Tokyo, Japan) as per the manufacturer’s protocol. RT-qPCR was then conducted using the Fast SYBR Green PCR reagents (Applied Biosystems, Carlsbad, CA, USA) on an ABI PRISM 7300 RT-qPCR system (Applied Biosystems). All analyses were completed in triplicate. Glyceraldehyde-3-phosphate dehydrogenase (GAPDH) was used as an internal reference to analyze the relative expression of RB1CC1 and PDL1 gene by the 2−ΔΔCt method. The primers used are shown in Supplementary Table 3.
Western blot analysis
A total of 1 × 10⁶ cells in each group were trypsinized and lysed with enhanced radioimmunoprecipitation assay (RIPA) lysis buffer (Boster Biological Technology Co., Ltd., Wuhan, China) containing protease inhibitor, followed by detection of protein concentration with a bicinchoninic acid (BCA) protein quantification kit (Boster). Then, 15 µL of protein was separated using 10% sodium dodecyl sulfate–polyacrylamide gel electrophoresis (SDS-PAGE) followed by transfer onto a polyvinylidene fluoride (PVDF) membrane. The membrane was blocked with 5% bovine serum albumin (BSA) at room temperature for 2 h to block non-specific binding and incubated at 4℃ overnight with the diluted rabbit primary antibodies RB1CC1 (ab176816) p-PYK2 (ab16667), PYK2 (ab32571), TAZ (ab224239), β-actin (ab8227), HA (ab9110), Myc (ab32072), PDL1 (ab205921), and tyrosine phosphorylated antibody (Phosphotyrosine, ab179530), (all 1: 500; Abcam), as well as. Phospho-YAP/TAZ (Ser127, #13,008: 1: 500; Cell Signaling Technologies, Danvers, MA, USA). The next day, after washing, the membrane was subjected to another incubation with horseradish peroxidase (HRP)-labeled secondary antibody goat anti-rabbit (ab205719, 1: 2000, Abcam) at room temperature for 1 h. Enhanced chemiluminescence (ECL) working solution (EMD Millipore, Billerica, MA, USA) was used to visualize the immunocomplexes on the membrane, and Image J analysis software was used to quantify protein band intensity, with β-actin used as an internal reference.
Terminal deoxynucleotidyl transferase-mediated dUTP-biotin nick end labeling (TUNEL) assay
Cell slides were prepared, in which approximately 5 × 10⁷ cells were seeded, washed, then fixed in PBS containing 4% formaldehyde for 30 min, added with Triton X-100 (1%), and then soaked in 3% hydrogen peroxide for 10 min. Next, the cells were incubated with TdT labeling solution (C1086, Beyotime Biotechnology Co., Shanghai, China) for 1 h at 37 °C. Following washing, the cells were incubated with 100 μL staining buffer solution for 30 min in the dark and stained with 4′,6-diamidino-2-phenylindole (DAPI).
Cell counting kit-8 (CCK-8) assay
RCC cells in the logarithmic growth phase were seeded in 96-well plates at a density of 1 × 10⁴ cells per well for 24 h of pre-culture. Then the cells were transfected according to grouping for 48 h. Then 10 μL of CCK-8 reagent (C0037, Beyotime) was added to the cells at 0, 24, 48, and 72 h after transfection, and incubated at 37 °C for 3 h. Next, the optical density (OD) values at 450 nm were determined using a microplate reader. The value was proportional to the number of proliferated cells in the culture medium, and a cell growth curve was plotted.
Immunofluorescence
Cells were cultured and incubated overnight in six-well plates containing acid-treated coverslips. Triton X-100 (0.2%) was added to the cells for 10 min. Then the coverslips were blocked in 3% FBS for 30 min, followed by incubation with primary antibodies. The slides were then washed, incubated with fluorescently tagged secondary antibodies, and stained with DAPI.
Xenograft tumor formation assay
Healthy 6–8-week-old nude mice (Beijing Institute of Pharmacology, Chinese Academy of Medical Sciences, Beijing, China) were separately housed in a specific pathogen-free (SPF) animal laboratory with humidity of 60%–65% and temperature of 22 °C—25 °C under a 12-h light/dark cycle, and given ad libitum access to food and water. Mice were subjected to experiments after one week of adaptive feeding. Mice were randomly divided into 7 groups, 8 animals in each group. A total of 5 × 10⁶ A498i cells with Matrigel were injected subcutaneously into the mice. After 7 weeks, mice were euthanized, and tumors removed. Next the tumor tissues were dehydrated, paraffin-embedded, and cut into 4-μm-thick sections, which were subjected to immunohistochemistry for Ki67 expression detection and TUNEL staining.
Luciferase assay
The luciferase reporter element for PDL1 promoter (nucleotide residue positions: −221 to + 21) was constructed, followed by the detection of the luciferase reporter gene following the instructions of a dual luciferase reporter gene analysis system (Promega, Madison, WI, USA). Renilla luciferase was used as a reference gene. The luciferase activity of the target reporter gene was measured by calculating the ratio of the relative luciferase (RLU) activity of the Firefly luciferase to that of Renilla luciferase.
Site-directed mutagenesis and plasmid construction
Site-directed mutagenesis was conducted with the use of overlapping PCR. Briefly, mouse TAZ and TEAD4 cDNAs were synthesized by reverse transcription from E10 cells. For transient gene expression, cDNAs were cloned into pCDNA3.1, while for inducible overexpression, cDNAs were cloned into a puromycin-resistant modified pTRIPZ. Stable overexpression constructs were created in a HA-tagged and hygromycin-resistant modified whey protein isolate (WPI). Lentivirus production or infection was performed using the method described previously. In order to create human PDL1 promoter reporter, nucleotides 221–þ21 were amplified by RT-qPCR from HeLa cell genomic DNA (gDNA) and cloned into pGL3-basic. Additionally, mouse PDL1 promoter (nucleotides 1723–þ220) was constructed by applying the gDNA extracted from C57BL/6 mice. The deletion in the promoter reporters was performed with the overlapping PCR.
Cell treatment
HEK293 cells were transfected with packaging plasmids (psPAX2 and pMD2.G) and pLVX-TetOne-Puro expression plasmid vectors of RB1CC1, PDL1 or short hairpin RNA targeting TAZ (sh-TAZ), respectively. Twenty-four hours after transfection, cells were plated in fresh medium for 24 h. After the recombinant virus-containing medium was filtered, the target cells were infected with polypentadiene (8 mg/mL). After 48 h of infection, the cells were treated with puromycin (0.5 mg/mL) for 7 days, and the positive target cells were selected.
Co-immunoprecipitation (Co-IP) assay
A total of 1 × 10⁷ cells from each group were lysed in lysis buffer (50 mM Tris–HCl [pH 7.4], 150 mM NaCl, 10% glycerol, 1 mM ethylenediamine tetraacetic acid (EDTA), 0.5% NP-40, and protease inhibitor mixture, and cell debris was removed by centrifugation. The cleared cell lysate was incubated with 1 μg of the corresponding primary antibody and 15 μL of Protein A/G beads (Santa Cruz Biotechnology, Santa Cruz, CA, USA) for 2 h, and washed thoroughly. The beads were boiled at 100 °C for 5 min.
Sphere formation assay
Cells were seeded in a six-well plate at a density of 2,000 cells/well and cultured in Dulbecco's modified Eagle’s medium (DMEM)/F12 (Thermo Fisher Scientific Inc.) supplemented with 20 ng/mL endothelial growth factor (EGF) (Thermo Fisher Scientific Inc.) and 10 ng/mL basic fibroblast growth factor (bFGF) (Thermo Fisher Scientific Inc.). After 2 weeks in culture, spheres larger than 50 μm in diameter were counted under an inverted microscope.
Colony formation assay
Cells were seeded in a six-well plate at a density of 500–1000 cells/well, accompanied with the dilution of cell suspension. Each reaction was run in triplicate. Cells were cultured in complete medium containing 30% FBS. The morphology of seeded cells was observed every 3 days with culture solution renewed. Colony formation was observed under a microscope and then imaged. Subsequently, 1 mL of 4% paraformaldehyde was added to each well, after which the cells were stained with 1,000 μL of crystal violet solution for 2 min.
Chromatin immunoprecipitation (ChIP)
Cells that had reached 70%–80% confluence were fixed by immersion in 1% formalin at room temperature for 10 min to produce DNA–protein cross-linking. Next, the cells were subjected to ultrasonic treatment to produce chromatin fragments, 10 s each time at intervals of 10 s, with a total of 15 cycles. After centrifugation at 13,000 rpm and 4℃, the supernatant was collected and divided into two tubes, which were incubated with rabbit antibody to IgG (ab109489, 1: 100, Abcam) serving as negative control (NC) and target rabbit antibody to TAZ (ab242313, 1: 100, Abcam) at 4 °C overnight. Thereafter, Protein Agarose/Sepharose was used to precipitate the endogenous DNA–protein complex. After a brief centrifugation and removal of the non-specific complex, the DNA–protein complex was incubated at 65 °C overnight to relieve the cross-linking. Phenol/chloroform was then used to extract the obtained DNA fragments. Subsequently, detection on the binding between TAZ and PDL1 was conducted with the PDL1 promoter specific primer [28].
Statistical analysis
GraphPad Prism 6.0 (IBM SPSS Statistics, Chicago, IL, USA) was used for data statistical analysis. The measurement data were expressed as mean ± standard deviation throughout this study. Data between two groups were compared using unpaired t test, and those among multiple groups were compared using one-way analysis of variance (ANOVA) or repeated measures ANOVA, followed by a Tukey's post hoc test for multiple comparisons. Log-rank test was used for univariate analysis, and Pearson correlation analysis was used to analyze the correlation of indicators. p < 0.05 was regarded as statistically significant.
Results
RB1CC1 is an effective clinically relevant tumor suppressor gene for RCC
Differential gene expression analysis on the RCC-related expression dataset GSE6344 revealed lower RB1CC1 expression in RCC samples when compared to normal samples (Fig. 1a). It is therefore likely that RB1CC1 may be a tumor suppressor gene in RCC. Next, using the UALCAN website (http://ualcan.path.uab.edu/analysis.html), we focused on RCC data from the TCGA database and found that the mRNA expression of RB1CC1 was also lower in tumor tissues than that in adjacent normal tissues (Fig. 1b). Clinical samples confirmed that RB1CC1 had higher protein and mRNA levels in adjacent normal tissues than in cancer tissues (Fig. 1c, d). In the UALCAN website, we also found that patients with high RB1CC1 expression had longer survival (Fig. 1e). The above data indicated that RB1CC1 was a clinically relevant tumor suppressor gene in RCC.
Fig. 1.

RB1CC1 is an effective RCC tumor suppressor gene. A, A heat map highlighting the top 10 differentially expressed genes in the GSE6344 dataset. B. The expression of RB1CC1 mRNA in RCC tumor and adjacent normal tissue samples in TCGA. C, Western blot analysis of RB1CC1 protein in the RCC tissues (n = 5) and adjacent normal tissues (n = 5). T represents the tumor, and P–T represents the adjacent normal tissues. D, mRNA expression of RB1CC1 in RCC tissues (n = 5) and adjacent normal tissues (n = 5). E, Kaplan–Meier analysis of the survival curve of patients with high or low RB1CC1 expression was conducted using the UALCAN database (http://ualcan.path.uab.edu/analysis.html). The red line indicates the RCC patients with high RB1CC1 expression (expression cutoff 25%), and the blue line indicates the RCC patients with low RB1CC1 expression (expression cutoff 75%). F, Western blot analysis of the RB1CC1 expression in the A498i and ACHNi cells. The antibody was shown in the figure. G, Cell viability of A498 and ACHN cells measured by CCK-8 assay. For DOX-inducible expressing cell lines A498 and ACHN, DOX (1 µg/mL) and DMSO (DOX lysing agent) were added, and cell viability was measured as shown in the figure. H, R A498 and ACHN colony-forming ability determined using colony formation assay. I—J, A498 and ACHN sphere-forming ability determined using sphere formation assay. Data between RCC tissues and adjacent normal tissues were compared with paired t test, while those between the other two groups were compared with unpaired t test. * p < 0.05
To verify the tumor suppressor function of RB1CC1, RB1CC1 was aberrantly expressed in human RCC cell lines. Human RCC cell lines A498 and ACHN were employed for the establishment of cell models induced by doxorubicin (DOX) (as DOX-induced A498 and ACHN cell lines) (Fig. 1f). After the expression of RB1CC1 was restored, a downward trend was evident in the proliferation rate of A498 and ACHN cells, while the ability to form colonies and the rate of sphere-forming formation also decreased (Fig. 1g-j). In summary, RB1CC1 was a functional and clinically relevant tumor suppressor gene for RCC.
RB1CC1 suppresses the PYK2 activity in RCC cells
In order to explore the correlation between RB1CC1 and PYK2 in RCC, we over-expressed PYK2 in DOX-induced A498i and ACHNi cell lines (Fig. 2a). Overexpression of PYK2 reversed the decreased cell proliferation rate of A498 and ACHN (Fig. 2b, c), sphere-forming rate (Fig. 2d, e), and colony-forming capability (Fig. 2F) caused by RB1CC1 overexpression. The above data indicated that a regulatory relationship between PYK2 and RB1CC1 was present in RCC, probably through a direct interaction.
Fig. 2.

PYK2 restored RB1CC1 inhibition of RCC cell lines. A. Western blot analysis of whole cell lysates of cells confirms DOX (1 µg/mL) induction and expression of RB1CC1 and PYK2 in A498i and ACHNi transfected with PYK2. B-C, The A498i and ACHNi cell viability measured by CCK-8 assay. D-E, A498i and ACHNi sphere-forming ability determined using sphere formation assay. F, A498i and ACHNi colony-forming ability determined using colony formation assay. *, & or # p < 0.05
The above experiments had clarified the regulatory relationship between PYK2 and RB1CC1 in RCC; we then proceeded to further study the molecular mechanism between PYK2 and RB1CC1. We assessed whether an interaction between PYK2 and RB1CC1 is present, confirming that, as expected, these two proteins did physically interact (Fig. 3a), and demonstrating that this interaction occurred in the C-terminal of RB1CC1 (Fig. 3b, c). Previous experimental data indicated that RB1CC1 and PYK2 are negatively correlated in RCC. Therefore, we investigated whether RB1CC1 inhibited PYK2 activity. E4Y1 was used as a foreign substrate for measuring PYK2 activity in the presence of different doses of GST-CT-RB1CC1 and GST in cells [29]. RB1CC1 inhibited PYK2 activity in a dose-dependent manner (Fig. 3d). At the protein level, based on the PYK2 protein phosphorylation induced by sorbitol, overexpression of both C-terminal and full-length RB1CC1 inhibited the protein phosphorylation level of PYK2, although no effect was observed when just the N-terminal of RB1CC1 was expressed (Fig. 3e). The aforementioned data supported the notion that RB1CC1 could inhibit PYK2 activity.
Fig. 3.

RB1CC1 inhibited PYK2 activity. A, 293 T was co-transfected with PCDNA3.1-PYK2, PCDNA3.1-RB1CC1, and the cells were lysed 48 h later. Preimmune and anti-RB1CC1 were used for co-immunoprecipitation experiments, followed by Western blot analysis detection of immune complexes or extracts (WCL), corresponding proteins in Preimmune and anti-RB1CC1 with antibodies shown in the figure. B, Top: Schematic diagram of the secondary structure of RB1CC1 protein, Bottom: N-terminal-RB1CC1 & C-terminal-RB1CC1 protein secondary Schematic. C, Co-transfected plasmids in 293 T cells: pKH3-Pyk2, pSG5-flag-FIP200/RB1CC1 (FIP200), pSG5-flag-N-FIP200/RB1CC1(NT-FIP), pSG5-flag-C-FIP200/RB1CC1 (CT-FIP). After immunoprecipitation, the interaction between RB1CC1 C-terminal and PYK2 in 293 T cells was detected by Western blot analysis. The antibodies are shown in the figure. D, In the case of E4Y1 characterizing PYK2 activity, different concentrations of GST-CT-RB1 and GST were added to determine the activity of PYK2. E, The PYK2 protein phosphorylation affected by RB1CC1 C-terminal in 293 T cells was detected by western blot analysis, with the antibodies shown in the figure. Each set of data had three independent experiments and was analyzed by unpaired t test. The error bars were a representation of the standard deviation, * p < 0.05, * * p < 0.01, * * * p < 0.001
PYK2 promotes TAZ protein stability via increase in TAZ phosphorylation
Reanalysis of TCGA data from RCC identified that TAZ mRNA expression in tumor tissues was higher than adjacent normal tissues (Fig. 4a). Meanwhile, we found that the expression of TAZ was negatively associated with the survival of RCC patients (Fig. 4b). It is therefore likely that TAZ may be an oncogene in RCC. To further verify the function of TAZ in RCC, we knocked down TAZ expression in human RCC cell lines. We selected human RCC cell lines A498 and ACHN, followed by the establishment of DOX-induced A498 and ACHN cell lines silencing TAZ expression (A498shi and ACHNshi) (Fig. 4c). Following TAZ knockdown, the proliferation rate and the ability of colony forming of A498shi and ACHNshi cells were reduced (Fig. 4d, e). This indicated that TAZ might promote the growth of RCC cells.
Fig. 4.

PYK2 enhanced the stability of TAZ protein by increasing the TAZ phosphorylation. A, TAZ mRNA levels in RCC and adjacent normal tissues obtained from the TCGA database. The red box indicates the expression in tumor samples, and the gray box indicates the expression in normal samples. KIRC stands for kidney renal clear cell carcinoma, and KIRP stands for kidney renal papillary cell carcinoma. T indicates tumor, and N indicates normal. B, A Kaplan–Meier plot of the survival curve of RCC patients with high or low TAZ expression. The cutoff value was determined by the median TAZ expression value. C, Western blot analysis of TAZ expression in the A498shi and ACHNshi cells. D, A498shi and ACHNshi cell viability measured by CCK-8 assay. E, A498shi and ACHNshi colony-forming ability determined using colony formation assay. F, The correlation between TAZ and PYK2 mRNA expression in RCC tumors in TCGA data. G, Western blot analysis of expression of TAZ and PYK2 proteins. H, TAZ protein in the 293 T cells was co-precipitated with Myc antibody, and its protein tyrosine residue was phosphorylated and measured using Western blot analysis. Each set of data had three independent experiments and was analyzed by unpaired t test. The error bars were a representation of the standard deviation, * p < 0.05, * * p < 0.01, * * * p < 0.001
Since previous data showed that PYK2 was an oncogene in RCC, we further analyzed the correlation between PYK2 and TAZ. Results of TCGA-based analysis found that TAZ and PYK2 mRNA expression were positively correlated (Fig. 4f). Next, we examined the interaction between PYK2 and TAZ at the protein level. Overexpression of PYK2 in A498 and ACHN was found to increase the total amount of TAZ protein (Fig. 4g). Furthermore, 293 T cells were co-transfected with PCDNA3.1-HA-PYK2 and PCDNA3.1-Myc-TAZ, with the GFP plasmid used as a control. As shown in Fig. 4h, the tyrosine residues of TAZ were phosphorylated in the presence of PYK2. The above data indicate that PYK2 enhances TAZ protein stability.
PYK2 promotes TAZ-mediated transcription of PDL1 in RCC cells
We further explored the regulatory role TAZ and PYK2 have on PDL1 protein expression in RCC. Knocking down of TAZ in A498shi and ACHNshi cell lines reduced PDL1 mRNA and protein levels (Fig. 5a, b), while overexpression of PYK2 increased PDL1 protein expression (Fig. 5c), suggesting TAZ and PYK2 promoted PDL1 expression in RCC cell lines. Since TAZ is a transcription factor, we adopted a ChIP-PCR-based approach to confirm that TAZ bound to the promoter region of PDL1 (Fig. 5d). We further constructed a PDL1 promoter (nucleotide residue positions −221 to + 21), a luciferase reporter element, and found that WT of TAZ proteins with binding ability at the transcriptional region could activate PDL1 promoter activity, while this effect was not observed in the MUT of TAZ (F52/53A) or a TAZ without C-terminal transcriptional co-activation domain—Δ227 (Fig. 5e). By deleting mutations in the PDL1 promoter region, we found that the TAZ-PDL1 promoter binding region was −101 to −39 (Fig. 5f). The above data indicated that PYK2 promoted TAZ-dependent transcription of PDL1 in RCC cells.
Fig. 5.

PYK2 promoted TAZ-mediated transcription of PDL1 in RCC cells. A, The mRNA level of PDL1 in A498shi and ACHNshi cell lines detected using RT-qPCR. B. The expression of PDL1 protein in the A498shi and ACHNshi cells was detected by Western blot analysis. C, The expression of PDL1 and PYK2 protein in the A498shi and ACHNshi cells was detected by Western blot analysis. D, The binding of TAZ to PDL1 promoter regions detected using ChIP-PCR. E, The activity of PDL1 promoter activated by TAZ detected by dual luciferase assay. F, PDL1 promoter deletion mutation scanned TAZ to recognize the activated PDL1 promoter region. Each set of data had three independent experiments and was analyzed by unpaired t test. The error bars were a representation of the standard deviation, * p < 0.05, * * p < 0.01, * * * p < 0.001
RB1CC1 enhances the effect of immunotherapy treatment by inhibiting PDL1 transcription
The data highlighted in Fig. 3 showed that RB1CC1 inhibited PYK2 activity. After ectopic expression of RB1CC1 in A498i and ACHNi cell lines, it was found that RB1CC1 overexpression reduced the PDL mRNA levels (Fig. 6a) and protein levels of PDL1, PYK2 and TAZ (Fig. 6b). This suggested that ectopic expression of RB1CC1 could potentially clinically improve the effectiveness of immunotherapy treatment in RCC patients. To test this hypothesis, nude mice were injected with A498i cells subcutaneously and randomly divided into two groups, a DOX + group (fed with food and drinking water containing DOX) and a DOX- group (fed with normal food and drinking water). After ten days, mice in both groups received everolimus (EVE) treatment. Mice in the DOX + group responded to EVE treatment to a significantly greater extent to the nude mice in the DOX-group, with the tumor growth rate and tumor weight of mice in the DOX + group being significantly lower than in the EVE group (Fig. 6c-e). At the same time, immunohistochemistry staining also showed that the expression of RB1CC1 could help EVE to suppress tumor proliferation and also activate immune response (Fig. 6f).
Fig. 6.

RB1CC1 inhibited PDL1 transcription in RCC. A, The mRNA level of PDL1 in the A498i and ACHNi cell lines detected using RT-qPCR. B, Western blot analysis of the PDL1 and TAZ protein expression in A498i and ACHNi cell lines. C, Tumor growth measured every five days in mice inoculated with A498i cells overexpressing RB1CC1. D, The size of these transplanted tumors. E. Tumor weight. F, Quantitative analysis of immunohistochemistry and TUNEL results in Figure C. n = 8 for mice upon each treatment. * p < 0.05, compared with mice treated with vehicle. # p < 0.05, compared with mice treated with EVE. & p < 0.05, compared with mice treated with DOX +
PYK2 provides a clinical target for RCC
The above experiments showed that ectopic expression of RB1CC1 could clinically improve the effectiveness of immunotherapy on RCC patients. However, it was difficult to achieve ectopic expression of RB1CC1 clinically. Therefore, it was necessary to find a method that could replace the ectopic expression of RB1CC1 and was suitable for clinical use to improve the effectiveness of immunotherapy for RCC patients. The aforesaid results proved that RB1CC1 inhibited PYK2 activity, indirectly inhibiting TAZ protein activity, resulting in a decrease in TAZ and reduction in PDL1 transcriptional activity. Therefore, the A498 cell line that constructed the PDL1 protein induced by DOX was named A498-PDL1 (Fig. 7a). Nude mice were injected with A498-PDL1 cells subsequently and received EVE, PF-562,271 (FAK/PYK2 inhibitor), combined treatment of EVE + PF-562,271 or the combined treatment of EVE + PF-562,271 + DOX. The tumor growth rate, volume, and weight of nude mice in the combined treatment group were lower than those in the EVE treatment group. At the same time, the restoration of PDL1 expression would reduce the promoting effect of PF-562,271 on immunotherapy (Fig. 7b-d). Immunohistochemistry analysis also showed that inhibition of PYK2 could help EVE inhibit tumor proliferation and activate the immune response, while restoring PDL1 expression would impair the effects of PYK22 on EVE treatment (Fig. 7e). These results showed that PF-562,271 could replace the ectopic expression of RB1CC1 and improved the effectiveness of immunotherapy for RCC patients for immunological drugs and that this promotion effect was caused by inhibition of PDL1 transcription.
Fig. 7.

PYK2 inhibitor promoted RCC immunotherapy. A, Western blot analysis of the PDL1 expression in the A498-PDL1 cell line. B, Growth curve of xenograft tumors of nude mice in different treatment groups (n = 8). C, Size of these transplanted tumors. D, The tumor weight statistics in Figure C. E, Quantitative analysis of immunohistochemistry and TUNEL results in Figure C. * p < 0.05, compared with mice treated with vehicle. # p < 0.05, compared with mice treated with EVE. & p < 0.05, compared with mice treated with DOX +
Discussion
RCC is one of the prevalent lethal urologic cancers [30]. RCC is the most common adult renal malignancy, accounting for 2.4% of adult malignancies worldwide. In recent decades, the incidence of RCC has increased significantly [31]. RCC has high risks of malignancy and metastasis, is always asymptomatic and has regularly metastasized prior to being diagnosed [32, 33]. Even though several targeted drugs currently being used to treat RCC, chemotherapy and radiotherapy still remain unsuccessful [34]. Therefore, finding new effective treatment methods and targets is of significant clinical interest. In this study, we investigated the mechanism of RB1CC1 and PYK2 underlying RCC. We provided evidence that RB1CC1 inhibited PYK2 activity to reverse the effect of TAZ on PDL1 transcriptional activation in RCC.
Our study first revealed that RB1CC1 was an effective clinically relevant tumor suppressor gene for RCC, manifested by its lower expression in RCC tissues than that in adjacent normal tissues, and its positive correlation with the longer survival time of RCC patients. Similar to our findings, RB1CC1 has been indicated to be an independent prognostic indicator for prostate cancer [35]. RB1CC1 expression was detected to be significantly lower in urine sediment of patients with diabetic kidney disease than control individuals [36]. Overexpression of RB1CC1, when combined with RB1 and p53 status, can help clinical practice and provide future therapies for breast cancer [7]. Prostate stem cell antigen (PSCA) inhibits tumor growth of esophageal squamous cell carcinoma by binding to RB1CC1 [37]. We also found that PF-562,271 could replace the ectopic expression of RB1CC1 and therefore functioned as a PYK2 inhibitor. Similar with our findings, the combination of sunitinib and PF-562,271 TKI may help to alleviate the angiogenesis and tumor aggressiveness of hepatocellular carcinoma [38].
In addition, the activity of PYK2 in RCC cells was inhibited by RB1CC1, and RB1CC1 and PYK2 were negatively correlated in functional correlation in RCC. Similarly, downregulation of endogenous focal adhesion kinase (FAK) family interacting protein of 200 kD (FIP200), also known as RB1CC1, in glioblastoma tumor cells, astrocytes, and brain microvessel endothelial cells can promote tumor cell apoptosis for removing its inhibition on PYK2 activation [13]. More importantly, RB1CC1 has been previously reported to bind to the kinase domain of PYK2 and thus inhibit its kinase activity [39]. Moreover, the results obtained from our present study indicated that PYK2 was highly expressed in RCC, and furthermore, PYK2 could promote the proliferation of RCC cell lines, and existed as a proto-oncogene in RCC. Consistently, a recent study presented higher PYK2 expression in RCC tissues compared with paired adjacent normal tissues, and the tumor-promoting function of PYK2 in RCC due to its role in stimulating tumor cell proliferation, invasion, and migration [14]. Moreover, the high expression of PYK2 is associated with the reduced survival in patients with pure human epidermal growth factor receptor 2 (HER2) breast cancer [40]. Microglial cells can activate the migration/dispersal of glioma cells by PYK2 signaling pathway in glioma cells [41]. High expression of PYK2, especially peritumoral Pyk2, can result in poor survival, disease recurrence, and metastasis in hepatocellular carcinoma [42]. In addition, PYK2 was found to be positively associated with TAZ in RCC where PYK2 promoted TAZ protein stability via enhancement of its phosphorylation level. Consistent with our findings, a previous study revealed the significantly increased TAZ protein stability after TAZ underwent tyrosine phosphorylation [43]. In addition, PYK2 can strengthen the tyrosine phosphorylation of TAZ and LATS1/2 and the stability of TAZ [20]. The cell density-regulated ferroptosis in RCC is regulated by TAZ by regulating EMP1-NOX4 [23].
Besides, our data suggest that PYK2 phosphorylation stabilizes TAZ to increase transcription of PD-L1 in RCC. TAZ can enhance PDL1 levels in breast and lung cancer cell lines, and the TAZ-induced PDL1 upregulation in human cancer cells is sufficient to inhibit T cell function, contributing to the promotion of immune evasion in human cancer [44]. PDL1 is regarded as a biomarker for high-risk RCC [45]. Multiple cytokines like STAT3 may induce the expression of PDL1 on tumor and/or immune cells [46]. PD1 on regulatory T cells and PDL1 inhibits immune response on cancer cells, which is important for evading the immune system [47]. In addition, RB1CC1 improved the effectiveness of RCC immunotherapy by inhibiting PDL1 transcription in RCC. Similar to our findings, combined treatment of EVE with anti-PDL1 can reduce the tumor burden [48].
On the basis of the above findings, our study proved that RB1CC1 was a tumor suppressor gene for RCC. PYK2 was highly expressed in RCC where it functioned as a proto-oncogene in RCC. RB1CC1 significantly reduced PYK2 activity to inhibit the effect of TAZ on PDL1 transcriptional activation. In doing so, this has a dramatic influence on the effectiveness immunotherapy treatment has on RCC (Fig. 8). This study suggests a novel theoretical ground for developing molecular-based therapeutics against RCC, although further work is required to identify additional regulatory mechanisms which underpin this disease.
Fig. 8.
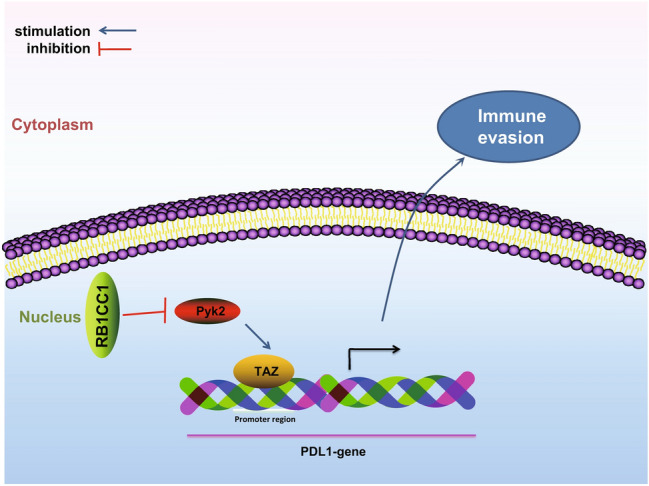
Schematic of the molecular mechanism outlining how RB1CC1 inhibits the activation of PDL1 transcription induced by TAZ by inhibiting PYK2 activity, thereby promoting the effectiveness of immunotherapy for RCC patients clinically
Acknowledgements
We would like to give our sincere appreciation to the reviewers for their helpful comments on this study.
Abbreviations
- ANOVA
Analysis of variance
- ATCC
American Type Culture Collection
- BCA
Bicinchoninic acid
- BFGF
Basic fibroblast growth factor
- BSA
Bovine serum albumin
- CCK-8
Cell counting kit-8
- CDNA
Complementary DNA
- ChIP
Chromatin immunoprecipitation
- Co-IP
Co-immunoprecipitation
- DAB
Diaminobenzidine
- DAPI
4′,6-Diamidino-2-phenylindole
- DMEM
Dulbecco's modified Eagle’s medium
- DOX
Doxorubicin
- ECL
Enhanced chemiluminescence
- EDTA
Ethylenediamine tetraacetic acid
- EGF
Endothelial growth factor
- EVE
Everolimus
- FAK
Focal adhesion kinase
- FBS
Fetal bovine serum
- FIP200
Family interacting protein of 200 kD
- GAPDH
Glyceraldehyde-3-phosphate dehydrogenase
- GDNA
Genomic DNA
- GEO
Gene Expression Omnibus
- HER2
Human epidermal growth factor receptor 2
- IgG
Immunoglobulin G
- KIRC
Kidney renal clear cell carcinoma
- KIRP
Kidney renal papillary cell carcinoma
- NC
Negative control
- OD
Optical density
- PDL1
Programmed cell death ligand 1
- PSCA
Prostate stem cell antigen
- PVDF
Polyvinylidene fluoride
- PYK2
Proline-rich/Ca-activated tyrosine kinase 2
- RB1CC1
Rb1-inducible coiled-coil 1
- RCC
Renal cell carcinoma
- RIPA
Radioimmunoprecipitation assay
- RLU
Relative luciferase
- RPMI
Roswell Park Memorial Institute
- RT-qPCR
Reverse transcription quantitative polymerase chain reaction
- SDS-PAGE
Sodium dodecyl sulfate–polyacrylamide gel electrophoresis
- SH-TAZ
Short hairpin RNA targeting TAZ
- SPF
Specific pathogen-free
- TAZ
Transcriptional co-activator with PDZ-binding motif
- TCGA
The Cancer Genome Atlas
- TPM
Transcripts per million
- TUNEL
Terminal deoxynucleotidyl transferase-mediated dUTP-biotin nick end labeling
- WPI
Whey protein isolate
Author contributions
PFC, YJD, XSL, LBC, RH, WZ, SML, and HW designed the study. PFC, YJD, and XSL collated the data, carried out data analyses, and produced the initial draft of the manuscript. LBC, RH, WZ, SML, and HW contributed to drafting the manuscript. All authors have read and approved the final submitted manuscript.
Data availability and materials
The datasets generated and/or analyzed during the current study are available from the corresponding author on reasonable request.
Declarations
Conflict of interest
The authors declare that they have no conflict of interest.
Ethics approval
The study protocol was approved by the Medical and Clinical Research Ethics Committee of the First Affiliated Hospital, University of South China, and performed in strict accordance with the Declaration of Helsinki.
Human and animal participation
Animal experimental procedures were in line with the animal care guideline of National Institutes of Health. Great efforts were made to minimize the number of animals used in the experiments and their discomfort.
Informed consent
All participants signed informed consent documentation.
Footnotes
Publisher's Note
Springer Nature remains neutral with regard to jurisdictional claims in published maps and institutional affiliations.
Pingfeng Chen, Youjun Duan and Xinsheng Lu Contributed equally to this work.
Contributor Information
Rong Hu, Email: wzzyyx1217@163.com.
Shimin Liu, Email: shiminliu456@163.com.
References
- 1.Caliskan S. Elevated neutrophil to lymphocyte and platelet to lymphocyte ratios predict high grade and advanced stage renal cell carcinoma. Int J Biol Markers. 2019;34:15–19. doi: 10.1177/1724600818817557. [DOI] [PubMed] [Google Scholar]
- 2.De Gobbi A, Mangano MS, Cova G, Lamon C, Maccatrozzo L. Testicular metastasis from renal cell carcinoma after nephrectomy and on tyrosine kinase inhibitors therapy: case report and review. Urologia. 2019;86:96–98. doi: 10.1177/0391560318818951. [DOI] [PubMed] [Google Scholar]
- 3.Zheng S, Zhang M, Bai H, He M, Dong L, Cai L, Zhao M, Wang Q, Xu K, Li J. Preparation of AS1411 aptamer modified Mn-MoS2 QDs for targeted MR imaging and fluorescence labelling of renal cell carcinoma. Int J Nanomedicine. 2019;14:9513–9524. doi: 10.2147/IJN.S215883. [DOI] [PMC free article] [PubMed] [Google Scholar]
- 4.Billon E, Walz J, Brunelle S, Thomassin J, Salem N, Guerin M, Vicier C, Dermeche S, Albiges L, Tantot F, Nenan S, Pignot G, Gravis G. Vitiligo adverse event observed in a patient with durable complete response after nivolumab for metastatic renal cell carcinoma. Front Oncol. 2019;9:1033. doi: 10.3389/fonc.2019.01033. [DOI] [PMC free article] [PubMed] [Google Scholar]
- 5.Mendiratta P, Rini BI, Ornstein MC. Emerging immunotherapy in advanced renal cell carcinoma. Urol Oncol. 2017;35:687–693. doi: 10.1016/j.urolonc.2017.08.011. [DOI] [PubMed] [Google Scholar]
- 6.Kawashima A, Uemura M, Nonomura N. Importance of multiparametric evaluation of immune-related T-cell markers in renal-cell carcinoma. Clin Genitourin Cancer. 2019;17:e1147–e1152. doi: 10.1016/j.clgc.2019.07.021. [DOI] [PubMed] [Google Scholar]
- 7.Chano T, Ikebuchi K, Ochi Y, Tameno H, Tomita Y, Jin Y, Inaji H, Ishitobi M, Teramoto K, Nishimura I, Minami K, Inoue H, Isono T, Saitoh M, Shimada T, Hisa Y, Okabe H. RB1CC1 activates RB1 pathway and inhibits proliferation and cologenic survival in human cancer. PLoS ONE. 2010;5:e11404. doi: 10.1371/journal.pone.0011404. [DOI] [PMC free article] [PubMed] [Google Scholar]
- 8.Ikebuchi K, Chano T, Ochi Y, Tameno H, Shimada T, Hisa Y, Okabe H. RB1CC1 activates the promoter and expression of RB1 in human cancer. Int J Cancer. 2009;125:861–867. doi: 10.1002/ijc.24466. [DOI] [PubMed] [Google Scholar]
- 9.Chano T, Ikebuchi K, Tomita Y, Jin Y, Inaji H, Ishitobi M, Teramoto K, Ochi Y, Tameno H, Nishimura I, Minami K, Inoue H, Isono T, Saitoh M, Shimada T, Hisa Y, Okabe H. RB1CC1 together with RB1 and p53 predicts long-term survival in Japanese breast cancer patients. PLoS ONE. 2010;5:e15737. doi: 10.1371/journal.pone.0015737. [DOI] [PMC free article] [PubMed] [Google Scholar]
- 10.Nishimura I, Chano T, Kita H, Matsusue Y, Okabe H. RB1CC1 protein suppresses type II collagen synthesis in chondrocytes and causes dwarfism. J Biol Chem. 2011;286:43925–43932. doi: 10.1074/jbc.M111.264192. [DOI] [PMC free article] [PubMed] [Google Scholar]
- 11.Lebovitz CB, Robertson AG, Goya R, Jones SJ, Morin RD, Marra MA, Gorski SM. Cross-cancer profiling of molecular alterations within the human autophagy interaction network. Autophagy. 2015;11:1668–1687. doi: 10.1080/15548627.2015.1067362. [DOI] [PMC free article] [PubMed] [Google Scholar]
- 12.Tameno H, Chano T, Ikebuchi K, Ochi Y, Arai A, Kishimoto M, Shimada T, Hisa Y, Okabe H. Prognostic significance of RB1-inducible coiled-coil 1 in salivary gland cancers. Head Neck. 2012;34:674–680. doi: 10.1002/hed.21797. [DOI] [PubMed] [Google Scholar]
- 13.Wang D, Olman MA, Stewart J, Jr, Tipps R, Huang P, Sanders PW, Toline E, Prayson RA, Lee J, Weil RJ, Palmer CA, Gillespie GY, Liu WM, Pieper RO, Guan JL, Gladson CL. Downregulation of FIP200 induces apoptosis of glioblastoma cells and microvascular endothelial cells by enhancing Pyk2 activity. PLoS ONE. 2011;6:e19629. doi: 10.1371/journal.pone.0019629. [DOI] [PMC free article] [PubMed] [Google Scholar]
- 14.Liu S, Chen L, Xu Y. Significance of PYK2 level as a prognosis predictor in patients with colon adenocarcinoma after surgical resection. Onco Targets Ther. 2018;11:7625–7634. doi: 10.2147/OTT.S169531. [DOI] [PMC free article] [PubMed] [Google Scholar]
- 15.Shen T, Guo Q. EGFR signaling pathway occupies an important position in cancer-related downstream signaling pathways of Pyk2. Cell Biol Int. 2019 doi: 10.1002/cbin.11209. [DOI] [PMC free article] [PubMed] [Google Scholar]
- 16.Zhao T, Bao Y, Lu X, He Y, Gan X, Wang J, Liu B, Wang L. Pyk2 promotes tumor progression in renal cell carcinoma. Oncol Lett. 2018;16:5953–5959. doi: 10.3892/ol.2018.9412. [DOI] [PMC free article] [PubMed] [Google Scholar]
- 17.Selitrennik M, Lev S. PYK2 integrates growth factor and cytokine receptors signaling and potentiates breast cancer invasion via a positive feedback loop. Oncotarget. 2015;6:22214–22226. doi: 10.18632/oncotarget.4257. [DOI] [PMC free article] [PubMed] [Google Scholar]
- 18.Kuang BH, Zhang MQ, Xu LH, Hu LJ, Wang HB, Zhao WF, Du Y, Zhang X. Proline-rich tyrosine kinase 2 and its phosphorylated form pY881 are novel prognostic markers for non-small-cell lung cancer progression and patients' overall survival. Br J Cancer. 2013;109:1252–1263. doi: 10.1038/bjc.2013.439. [DOI] [PMC free article] [PubMed] [Google Scholar]
- 19.Yue Y, Li ZN, Fang QG, Zhang X, Yang LL, Sun CF, Liu FY. The role of Pyk2 in the CCR7-mediated regulation of metastasis and viability in squamous cell carcinoma of the head and neck cells in vivo and in vitro. Oncol Rep. 2015;34:3280–3287. doi: 10.3892/or.2015.4269. [DOI] [PubMed] [Google Scholar]
- 20.Kedan A, Verma N, Saroha A, Shreberk-Shaked M, Muller AK, Nair NU, Lev S. PYK2 negatively regulates the Hippo pathway in TNBC by stabilizing TAZ protein. Cell Death Dis. 2018;9:985. doi: 10.1038/s41419-018-1005-z. [DOI] [PMC free article] [PubMed] [Google Scholar]
- 21.Schlame M, Xu Y, Ren M. The Basis for Acyl Specificity in the Tafazzin Reaction. J Biol Chem. 2017;292:5499–5506. doi: 10.1074/jbc.M116.769182. [DOI] [PMC free article] [PubMed] [Google Scholar]
- 22.Li X, Wu M, An D, Yuan H, Li Z, Song Y, Liu Z. Suppression of Tafazzin promotes thyroid cancer apoptosis via activating the JNK signaling pathway and enhancing INF2-mediated mitochondrial fission. J Cell Physiol. 2019 doi: 10.1002/jcp.28287. [DOI] [PubMed] [Google Scholar]
- 23.Yang WH, Ding CC, Sun T, Rupprecht G, Lin CC, Hsu D, Chi JT. The hippo pathway effector TAZ regulates ferroptosis in renal cell carcinoma. Cell Rep. 2019;28(2501–2508):e2504. doi: 10.1016/j.celrep.2019.07.107. [DOI] [PMC free article] [PubMed] [Google Scholar]
- 24.Stewart GD, O'Mahony FC, Powles T, Riddick AC, Harrison DJ, Faratian D. What can molecular pathology contribute to the management of renal cell carcinoma? Nat Rev Urol. 2011;8:255–265. doi: 10.1038/nrurol.2011.43. [DOI] [PubMed] [Google Scholar]
- 25.Tong G, Cheng B, Li J, Wu X, Nong Q, He L, Li X, Li L, Wang S. MACC1 regulates PDL1 expression and tumor immunity through the c-Met/AKT/mTOR pathway in gastric cancer cells. Cancer Med. 2019;8:7044–7054. doi: 10.1002/cam4.2542. [DOI] [PMC free article] [PubMed] [Google Scholar]
- 26.Kumar B, Ghosh A, Datta C, Pal DK. Role of PDL1 as a prognostic marker in renal cell carcinoma: a prospective observational study in eastern India. Ther Adv Urol. 2019;11:1756287219868859. doi: 10.1177/1756287219868859. [DOI] [PMC free article] [PubMed] [Google Scholar]
- 27.Chandrashekar DS, Bashel B, Balasubramanya SAH, Creighton CJ, Ponce-Rodriguez I, Chakravarthi B, Varambally S. UALCAN: A portal for facilitating tumor subgroup gene expression and survival analyses. Neoplasia. 2017;19:649–658. doi: 10.1016/j.neo.2017.05.002. [DOI] [PMC free article] [PubMed] [Google Scholar]
- 28.Nelson JD, Denisenko O, Sova P, Bomsztyk K. Fast chromatin immunoprecipitation assay. Nucleic Acids Res. 2006;34:e2. doi: 10.1093/nar/gnj004. [DOI] [PMC free article] [PubMed] [Google Scholar]
- 29.Hoekstra MF, Dhillon N, Carmel G, DeMaggio AJ, Lindberg RA, Hunter T, Kuret J. Budding and fission yeast casein kinase I isoforms have dual-specificity protein kinase activity. Mol Biol Cell. 1994;5:877–886. doi: 10.1091/mbc.5.8.877. [DOI] [PMC free article] [PubMed] [Google Scholar]
- 30.Chen Y, Zhu Y, Sheng Y, Xiao J, Xiao Y, Cheng N, Chai Y, Wu X, Zhang S, Xiang T. SIRT1 downregulated FGB expression to inhibit RCC tumorigenesis by destabilizing STAT3. Exp Cell Res. 2019;382:111466. doi: 10.1016/j.yexcr.2019.06.011. [DOI] [PubMed] [Google Scholar]
- 31.Busch J, Ralla B, Jung M, Wotschofsky Z, Trujillo-Arribas E, Schwabe P, Kilic E, Fendler A, Jung K. Piwi-interacting RNAs as novel prognostic markers in clear cell renal cell carcinomas. J Exp Clin Cancer Res. 2015;34:61. doi: 10.1186/s13046-015-0180-3. [DOI] [PMC free article] [PubMed] [Google Scholar]
- 32.Liu S, Han L, Wang X, Liu Z, Ding S, Lu J, Bi D, Mei Y, Niu Z. Nephroblastoma overexpressed gene (NOV) enhances RCC cell motility through upregulation of ICAM-1 and COX-2 expression via Akt pathway. Int J Clin Exp Pathol. 2015;8:1302–1311. [PMC free article] [PubMed] [Google Scholar]
- 33.Liu X, Zhang M, Liu X, Sun H, Guo Z, Tang X, Wang Z, Li J, Li H, Sun W, Zhang Y. Urine metabolomics for Renal Cell Carcinoma (RCC) prediction: tryptophan metabolism as an important pathway in RCC. Front Oncol. 2019;9:663. doi: 10.3389/fonc.2019.00663. [DOI] [PMC free article] [PubMed] [Google Scholar]
- 34.Ma HL, Yu SJ, Chen J, Ding XF, Chen G, Liang Y, Pan JL. CA8 promotes RCC proliferation and migration though its expression level is lower in tumor compared to adjacent normal tissue. Biomed Pharmacother. 2020;121:109578. doi: 10.1016/j.biopha.2019.109578. [DOI] [PubMed] [Google Scholar]
- 35.Li X, Wan X, Chen H, Yang S, Liu Y, Mo W, Meng D, Du W, Huang Y, Wu H, Wang J, Li T, Li Y. Identification of miR-133b and RB1CC1 as independent predictors for biochemical recurrence and potential therapeutic targets for prostate cancer. Clin Cancer Res. 2014;20:2312–2325. doi: 10.1158/1078-0432.CCR-13-1588. [DOI] [PubMed] [Google Scholar]
- 36.Matboli M, Azazy AEM, Adel S, Bekhet MM, Eissa S. Evaluation of urinary autophagy transcripts expression in diabetic kidney disease. J Diabetes Complications. 2017;31:1491–1498. doi: 10.1016/j.jdiacomp.2017.06.009. [DOI] [PubMed] [Google Scholar]
- 37.Zhang LY, Wu JL, Qiu HB, Dong SS, Zhu YH, Lee VH, Qin YR, Li Y, Chen J, Liu HB, Bi J, Ma S, Guan XY, Fu L. PSCA acts as a tumor suppressor by facilitating the nuclear translocation of RB1CC1 in esophageal squamous cell carcinoma. Carcinogenesis. 2016;37:320–332. doi: 10.1093/carcin/bgw010. [DOI] [PubMed] [Google Scholar]
- 38.Bagi CM, Christensen J, Cohen DP, Roberts WG, Wilkie D, Swanson T, Tuthill T, Andresen CJ. Sunitinib and PF-562,271 (FAK/Pyk2 inhibitor) effectively block growth and recovery of human hepatocellular carcinoma in a rat xenograft model. Cancer Biol Ther. 2009;8:856–865. doi: 10.4161/cbt.8.9.8246. [DOI] [PubMed] [Google Scholar]
- 39.Ueda H, Abbi S, Zheng C, Guan JL. Suppression of Pyk2 kinase and cellular activities by FIP200. J Cell Biol. 2000;149:423–430. doi: 10.1083/jcb.149.2.423. [DOI] [PMC free article] [PubMed] [Google Scholar]
- 40.Al-Juboori SI, Vadakekolathu J, Idri S, Wagner S, Zafeiris D, Pearson JR, Almshayakhchi R, Caraglia M, Desiderio V, Miles AK, Boocock DJ, Ball GR, Regad T. PYK2 promotes HER2-positive breast cancer invasion. J Exp Clin Cancer Res. 2019;38:210. doi: 10.1186/s13046-019-1221-0. [DOI] [PMC free article] [PubMed] [Google Scholar]
- 41.Rolon-Reyes K, Kucheryavykh YV, Cubano LA, Inyushin M, Skatchkov SN, Eaton MJ, Harrison JK, Kucheryavykh LY. Microglia activate migration of glioma cells through a Pyk2 intracellular pathway. PLoS ONE. 2015;10:e0131059. doi: 10.1371/journal.pone.0131059. [DOI] [PMC free article] [PubMed] [Google Scholar]
- 42.Cao J, Chen Y, Fu J, Qian YW, Ren YB, Su B, Luo T, Dai RY, Huang L, Yan JJ, Wu MC, Yan YQ, Wang HY. High expression of proline-rich tyrosine kinase 2 is associated with poor survival of hepatocellular carcinoma via regulating phosphatidylinositol 3-kinase/AKT pathway. Ann Surg Oncol. 2013;20(Suppl 3):S312–323. doi: 10.1245/s10434-012-2372-9. [DOI] [PubMed] [Google Scholar]
- 43.Jang EJ, Jeong H, Han KH, Kwon HM, Hong JH, Hwang ES. TAZ suppresses NFAT5 activity through tyrosine phosphorylation. Mol Cell Biol. 2012;32:4925–4932. doi: 10.1128/MCB.00392-12. [DOI] [PMC free article] [PubMed] [Google Scholar]
- 44.Janse van Rensburg HJ, Azad T, Ling M, Hao Y, Snetsinger B, Khanal P, Minassian LM, Graham CH, Rauh MJ, Yang X. The hippo pathway component TAZ promotes immune evasion in human cancer through PD-L1. Cancer Res. 2018;78:1457–1470. doi: 10.1158/0008-5472.CAN-17-3139. [DOI] [PubMed] [Google Scholar]
- 45.Chandrasekaran D, Sundaram S, N K, R P, Programmed death ligand 1; an immunotarget for renal cell carcinoma. Asian Pac J Cancer Prev. 2019;20:2951–2957. doi: 10.31557/APJCP.2019.20.10.2951. [DOI] [PMC free article] [PubMed] [Google Scholar]
- 46.Chen S, Crabill GA, Pritchard TS, McMiller TL, Wei P, Pardoll DM, Pan F, Topalian SL. Mechanisms regulating PD-L1 expression on tumor and immune cells. J Immunother Cancer. 2019;7:305. doi: 10.1186/s40425-019-0770-2. [DOI] [PMC free article] [PubMed] [Google Scholar]
- 47.De Maeseneer DJ, Delafontaine B, Rottey S. Checkpoint inhibition: new treatment options in urologic cancer. Acta Clin Belg. 2017;72:24–28. doi: 10.1080/17843286.2016.1260890. [DOI] [PubMed] [Google Scholar]
- 48.Hirayama Y, Gi M, Yamano S, Tachibana H, Okuno T, Tamada S, Nakatani T, Wanibuchi H. Anti-PD-L1 treatment enhances antitumor effect of everolimus in a mouse model of renal cell carcinoma. Cancer Sci. 2016;107:1736–1744. doi: 10.1111/cas.13099. [DOI] [PMC free article] [PubMed] [Google Scholar]
Associated Data
This section collects any data citations, data availability statements, or supplementary materials included in this article.
Data Availability Statement
The datasets generated and/or analyzed during the current study are available from the corresponding author on reasonable request.