

Objective:
To identify predictors of the 5-year uptake of hearing aids (HAs) and hearing assistive technology (HAT) in a sample of Dutch employees eligible for HAs and/or HAT. The potential predictors included demographic factors (age, sex, marital status, and living situation), education, hearing factors (ability to recognize speech in noise and self-reported hearing disability), distress, self-efficacy, and work-related factors (job demand, job control, and need for recovery).
Design:
Five-year follow-up data of the Netherlands Longitudinal Study on Hearing (NL-SH) collected until January 2019 were included. An online digit-triplet in noise test, the National Hearing Test (NHT), was used to assess speech-recognition-in-noise ability. In addition, online questionnaires on demographic, socioeconomic, self-reported hearing disability, health, and work-related characteristics were administered. Adults who worked over 12 hours per week, who had not yet taken up HAs or HAT, but who would be eligible for HAs/HAT based on their NHT score (insufficient or poor hearing ability), were included in the study. The 5-year uptake of HAs/HAT was defined as a dichotomous variable of self-reported HA/HAT use reported 5 years later. Generalized Estimating Equations analyses were performed to analyze the associations between potential predicting factors and the 5-year uptake of HAs/HAT, taking into account the repeated measurements of the predicting factors and the 5-year uptake of HAs/HAT.
Results:
Data of 218 participants were included. The cumulative incidence of the 5-year uptake of HAs/HAT was 15 to 33%, of which 52 employees took up HAs and 11 employees took up HAT. Married participants had increased odds for 5-year uptake of HAs/HAT compared with unmarried participants (odds ratio [OR] = 2.13, 95% confidence interval [CI] = 1.05 to 4.35). Higher self-reported hearing disability (per one unit, scale range 0 to 74) was associated with increased odds for 5-year uptake of HAs/HAT (OR = 1.05, 95% CI = 1.03 to 1.07). Job demand showed a significant interaction with sex (p = 0.002), and therefore, stratified analyses were performed. In male participants, participants with higher job demand scores (per one unit, scale range 12 to 48) had increased odds for 5-year uptake of HAs/HAT (OR = 1.18, 95% CI = 1.05 to 1.35). No difference was seen in females.
Conclusion:
This study confirms that factors predicting the uptake of HAs/HAT in the general or older populations, including marital status and self-reported hearing disability, also extend to the working population. The identification of job demand as a predictor of the uptake of HAs/HAT (in males only) was a novel finding. It demonstrates the importance of considering work-related factors in aural rehabilitation.
Keywords: Employees, Hearing impairment, Hearing aids, Hearing assistive technology, Longitudinal analyses, Uptake
INTRODUCTION
Hearing impairment (HI) is a highly prevalent and disabling chronic condition, particularly in the senior adult population. Worldwide, approximately one-third (33%) of people aged 65 years and older suffer from disabling HI (WHO 2017). However, hearing decline starts at a younger age and, on average, accelerates around the age of 50 years (Dawes et al. 2014; Goderie et al. 2020). This indicates that HI affects many persons in the working population (Kramer & Goverts 2020). Moreover, with an increasing retirement age, the number of people with HI in the workplace is increasing.
Hearing problems in the workplace can have a significant impact on a person’s functioning. Studies have shown that employees with HI report more stress-related health problems, perceive higher job demand (i.e., psychological requirements for a worker’s tasks) and lower job control (i.e., the extent to which one has control over the tasks being performed at work), and have greater need for recovery from fatigue and distress after a day of work than normal hearing employees (Danermark & Gellerstedt 2004; Kramer et al. 2006; Kramer 2008; Nachtegaal et al. 2009, 2011). In addition, a significant association between hearing ability and the kind or amount of work that one can perform has been reported. It was found that with increasing HI, the experienced limitations in work performance also increase (Nachtegaal et al. 2012). It has also been shown that issues such as unemployment, underemployment, sick leave (due to stress), lower earning potential, and early retirement often are more pervasive among employees with HI compared to their colleagues with normal hearing (Stam et al. 2013; Fischer et al. 2014; National Academies of Sciences, Engineering, and Medicine et al. 2017).
To compensate for HI, progress in technology has improved hearing possibilities through a range of hearing solutions, including hearing aids (HAs) and hearing assistive technology (HAT). HAT is defined as any device (other than an HA) that is used to enhance or maintain the functional capacities of persons with HI (Southall et al. 2006). HAT transmits signals in a more direct manner than sound waves, and can send sound directly to users’ ears. These technologies range from products for personal and home use to systems for larger audiences and public areas and can be divided into five categories: (1) one-to-one communicators; (2) television devices; (3) telephone devices; (4) alerting devices; and (5) group listening systems (Southall et al. 2006). Examples of HAT include an amplified telephone, a portable doorbell, and an induction loop. HAT is often used in combination with HAs, but they can also be used alone. HAs and HAT provide effective treatment options for people with HI (Saunders et al. 2012; Southall et al. 2006). However, whether the uptake of these hearing solutions mitigates the effects of HI on the aforementioned issues in employees with HI has been researched to a limited extend. Studies by Kochkin (2005, 2010) among American Households showed that the use of HAs mitigates the effects of HI on loss of income by 65 to 100%. Moreover, unemployment was found to be considerably lower among HA users as compared to persons with HI without HAs (Kochkin 2010). The uptake of HAs in American studies is associated with higher socioeconomic status (Bainbridge & Ramachandran 2014); therefore, these results should be interpreted with caution. Nevertheless, evidence shows that only 20 to 50% of those who would benefit from the use of hearing solutions actually use them (Southall et al. 2006; Vuorialho et al. 2006; Kochkin 2007; Laplante-Levesque et al. 2013; Bainbridge & Ramachandran 2014).
Previous studies on factors predicting the uptake of HAs and HAT in (older) adults indicate that many factors may influence the uptake of these devices, including older age, greater degree of HI, and greater self-reported hearing disability (Southall et al. 2006; Knudsen et al. 2010; Meyer & Hickson 2012). In addition, expected benefits, positive attitudes, and high social support towards HAs were shown to be associated with the uptake of HAs and/or hearing help-seeking (Southall et al. 2006; Meyer et al. 2014; Pronk et al. 2017; Saunders et al. 2016). There is inconsistent evidence for many other factors including educational level, marital status, and living situation (Knudsen et al. 2010; Meyer & Hickson 2012). A direct association between sex and the uptake of hearing solutions has not been established, but sex may modify other predictors of the uptake of hearing solutions (Garstecki & Erler 1998; Pronk et al. 2017). Furthermore, prefitting attitudes such as distress and self-efficacy may impact the uptake of HAs (Weinstein 2000; Kricos 2006; Knudsen et al. 2010; Meyer et al. 2014). The aforementioned results were obtained in specific study samples (e.g., older adults with hearing impairment), but the factors predicting the uptake of HAs identified in these studies were similar to the results found in two longitudinal population-based studies: a greater degree of HI, older age, higher education, greater self-reported HI, and greater self-perceived hearing handicap (Fischer et al. 2011; Gopinath et al. 2011) were found to be associated with greater uptake of HAs.
Previous studies did examine employment status as a predictor for entering an HA evaluation period and for the uptake of HAs, but did not find significant associations (Knudsen et al. 2010; Pronk et al. 2017). Also, previous studies considered individuals of working age in their study samples, but working adults are usually underrepresented in these cohorts of older adults with HI (see the Appendix in Knudsen et al. 2010). The literature is scarce on the specific factors influencing the uptake of HAs/HAT in employees. To the best of our knowledge, factors influencing the uptake of HAs/HAT in a distinct group of employees with HI have never been examined. The workplace is considered a challenging environment in which it is critical to hear well for optimal occupational performance (Kramer et al. 2006; Gussenhoven et al. 2013; Kramer & Goverts 2020). Factors to take up HAs or HAT may be different in the working population as compared with factors found in the (older) general populations. Moreover, previous studies have not considered work-related factors associated with the uptake of hearing solutions. Therefore, more research on the uptake of hearing solutions in employees is needed (Gussenhoven et al. 2013). Knowledge in this area may lead to the development of evidence-based (rehabilitation) services, and may help to address these employee-specific factors in aural rehabilitation. This study aimed to examine the role of demographic factors, education, hearing factors, distress, self-efficacy, and work-related factors in the uptake of HAs/HAT reported 5 years later in a sample of Dutch adult employees eligible for HAs or HAT.
Materials and Methods
Study Design
The study sample originated from the Netherlands Longitudinal Study on Hearing (NL-SH). The NL-SH is a prospective cohort study that examines the relationship between HI and several domains of life in adults aged 18 to 70 years. It uses a convenience sampling method and includes Dutch participants with and without HI. All data are collected online. The NL-SH uses both the National Hearing Test (NHT) (Smits et al. 2006), and an extensive online questionnaire, which addresses hearing status, health, work, and health care use. More details about the study design and recruitment of participants can be found in earlier publications (e.g., Stam et al. 2015; Goderie et al. 2020). Data collection started from 2006 onward (T0). The second (T1, collected from 2011 onward) and third (T2, collected from 2016 onward) measurement rounds started 5 and 10 years later, respectively. Participants received the same test and similar questions as in the baseline measurement. The NL-SH is a study with an ongoing inclusion. This means that we still include participants for T0, and that for each participant their next measurement round takes place five years after their previous one. For the present study, data collected until January 2019 were included and 5-year time intervals within each participant were examined. These could be from T0 to T1 or from T1 to T2. The potential factors predicting the 5-year uptake of HAs or HAT were examined using longitudinal analyses (see Statistical analyses). The NL-SH study (including the follow-up measurements) was approved by the Medical Ethics Committee of Amsterdam UMC, location VU University Medical Center in Amsterdam, The Netherlands.
Study Sample
In the present study, we included working adults, who did not have HAs or HAT at baseline (i.e., at T0 or T1), but who would be eligible for those hearing solutions based on their baseline NHT scores, and who had data on at least two consecutive measurement rounds. A Speech-Reception-Threshold in noise (SRTn) of ≥−5.5 dB signal-to-noise ratio (SNR) was chosen as cutoff to select eligible participants. This cutoff was chosen as adults in The Netherlands who are using the NHT for self-screening are recommended to seek help for their hearing problems when their score is ≥−5.5 dB SNR (Smits et al. 2006). Moreover, 5.5 dB SNR approximates a pure-tone average of 35 dB at the frequencies 1, 2, and 4 kHz (Dutch cutoff for HA insurance coverage) (Smits et al. 2004). In line with our previous NL-SH studies (Nachtegaal et al. 2009; Stam et al. 2013), adults who reported to work 12 hours or more per week were selected (dichotomous variable, yes/no). HAs/HAT status was determined based on the dichotomous variables “Do you use an HA” (yes/no) and “Do you use other hearing assistive devices” (yes/no).
One hundred and eighty-two participants met the inclusion criteria at T0, and 59 participants met the inclusion criteria at T1 (Fig. 1). Note that participants that met the inclusion criteria at T0 could also be included at T1 (i.e., participants who had not taken up HAs/HAT at T1 and met the inclusion criteria at T1). This was the case for 23 participants (Fig. 1). In total, data from 218 participants was included in the longitudinal analyses.
Fig. 1.
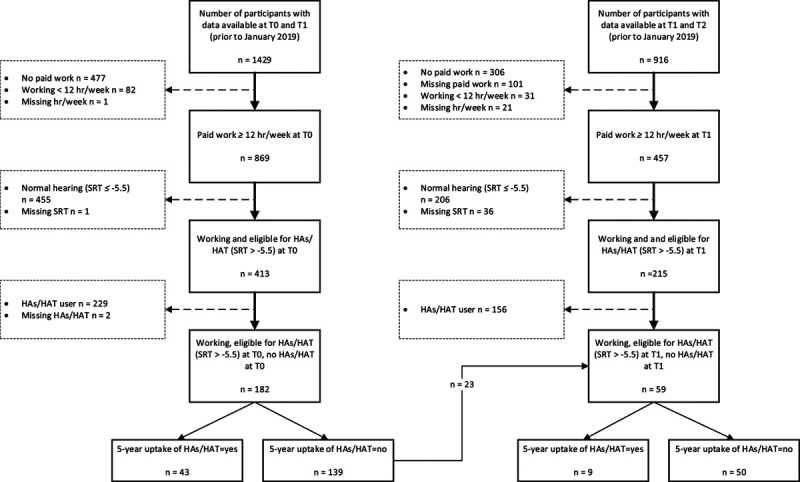
Flowchart of participant numbers. HAs, hearing aids; HAT, hearing assistive technology; n, number of participants; SRT, speech reception threshold.
Outcome Measure
The uptake of HAs and/or HAT was defined as a dichotomous variable of self-reported HAs/HAT use reported 5 years later (for simplicity further referred to as 5-year uptake of HAs/HAT). For this, the dichotomous variables “Do you use an HA” (0 = no, 1 = yes) and “Do you use other hearing assistive devices” (0 = no, 1 = yes) were combined into the new variable “5-year uptake of HAs/HAT” (0 = no—“Do you use an HA” = 0 and “Do you use other hearing assistive devices” = 0; 1 = yes—“Do you use an HA” = 1 and/or “Do you use other hearing assistive devices” = 1).
Potential Predictors
The choice of variables potentially predicting the 5-year uptake of HAs/HAT in employees originated from the factors reported in previous studies in the general and older populations (Southall et al. 2006; Knudsen et al. 2010;; Fischer et al. 2011; Gopinath et al. 2011; Meyer et al. 2014; Pronk et al. 2017), and availability of variables in the NL-SH study. In addition, new (work-related) factors were examined.
Age was included as age in years and was calculated from self-reported date of birth.
Sex was defined as male or female.
Living situation was defined as currently living with other people in a household or living alone.
Marital status was defined as currently being married or not married.
Educational level was measured by asking for the highest completed education which was categorized into: low (did not finish elementary school to lower vocational), mid (general intermediate to general secondary), or high education (higher vocational to postacademic).
Speech recognition ability in noise was tested with the NHT (Smits et al. 2006), which is a valid and reliable test as shown in a range of studies (Smits et al. 2004; 2006; Nachtegaal et al. 2009). The NHT is an online digit-triplet speech in noise test, with a total of 23 digit-triplets (e.g., 6-2-5) presented against a background of stationary masking noise, according to an adaptive (one-up, one-down) procedure. Participants were instructed to perform the test in a quiet room and asked to indicate what transducers they used (headphones or loudspeakers) to perform the test. The SRTn was calculated by taking the average SNR of the last 20 presentations and corresponds to 50% speech intelligibility. The continuous score was categorized into three categories (Smits et al. 2006): good (SRTn < −5.5 dB); insufficient (−5.5 ≤ SRTn ≤ −2.8 dB); and poor (SRTn > −2.8 dB). Participants’ scores were only included when the NHT was performed using the same transducer at each measurement assessment so that reliable comparisons could be made.
Self-reported hearing disability was measured by using the 28-item version of the Amsterdam Inventory for Auditory Disability and Handicap (AIADH; Kramer et al. 1995; Boeschen Hospers et al. 2016). The AIADH consists of 28 items that assess self-reported hearing ability, and can be subdivided into five subscales: distinguishing sounds, auditory localization, intelligibility in noise, intelligibility in quiet, and detection of sounds. The response scale for each item is a 4-point Likert scale measuring how often the respondent is able to hear effectively in a specific situation: 0 = almost always, 1 = frequently, 2 = occasionally, or 3 = almost never. Sum scores ranged from 0 to 84 (higher scores indicating more severe hearing disability).
Distress was measured using a subscale from the four-Dimensional Symptom Questionnaire (4DSQ; Terluin et al. 2006). The 4DSQ has shown to be valid and reliable (with sound psychometric measurement properties) for use in the general Dutch population (Terluin et al. 2016). Distress is defined as “the direct manifestation of the effort people must extent to maintain their psychosocial homeostasis and social functioning when confronted with stress” (Terluin et al. 2006). The scale contains 16 items and each item has a five-point response scale, of which the answers were recorded into 0 (“no”), 1 (“sometimes”) and 2 (“regularly,” “often,” and “very often or constantly”). Scores were summed when at least 10 items were completed (higher scores indicating more severe distress).
Self-efficacy was measured using the validated General Self-Efficacy Scale (Sherer et al. 1982; Bosscher & Smit 1998). It assesses persons’ expectations of their competences and capacity for action. The questionnaire contains 12 items and responses are structured on a five-point scale, 1 = disagree, 2 = slightly agree, 3 = neither agree nor disagree, 4 = somewhat agree, and 5 = agree. A total score (12 to 60) was obtained by summing the responses to each of the 12 items, higher scores indicating more self-efficacy.
Psychological job demand and job control were measured using subscales of the validated Dutch version of the Job Content Questionnaire (JCQ) (Karasek et al. 1998; Houtman et al. 1999). Psychological job demand refers to the psychological requirements for an employee’s tasks. Job control refers the extent to which one has control over the tasks being performed at work. All items in the questionnaire are answered on a four-point scale, ranging from “strongly agree” to “strongly disagree.” Weighted scale scores were computed. One missing item per (sub)scale was accepted in the calculation of the (sub)scale score; otherwise, the subscale was not computed and excluded from analyses. The psychological job demand scale contains five items addressing excessive work, conflicting demands, and work pace. Scale scores can range from 12 to 48 (higher scores indicating a higher demand). Job control was assessed by two subscales: skill discretion and decision authority. The total scale score (sum of the two subscales) was computed only when both subscale scores were available. The summed scores can range from 24 to 96 (higher scores indicating more control).
Need for Recovery after work (NFR) was measured using a subscale of the Dutch Questionnaire on the Experience and Assessment of Work (Van Veldhoven & Meijman 1994; De Croon et al. 2006). The psychometric qualities of the scale are good (Schaufeli & Van Dierendonck 1994; van Veldhoven 1996; Beurskens et al. 2000). The NFR subscale is an 11-item scale assessing the short term effects of fatigue caused by work activities. Each item had two answer categories “yes” and “no.” For each participant, the number of items answered “yes” was calculated. This sum was divided by the total number of items (11) and multiplied by 100 to obtain a percentage score for each participant. Scale scores can range from 0 to 100%, with higher scores indicating a higher NFR.
Potential Confounders and Effect Modifiers
Age, sex, living situation, marital status, educational level, and self-perceived hearing disability were also examined as effect modifiers and for confounding effects. For the association between work-related factors and 5-year uptake of HAs/HAT, job control, job demand, number of working hours per week, and social support were additionally examined for confounding effects. Previous studies showed that job control and job demands had an effect on NFR (e.g., Nachtegaal et al. 2012). In addition, the support from colleagues and/or supervisors may work as a buffer for psychological strain (Karasek et al. 1998). The number of working hours per week was determined by asking the number of hours an employee was expected to work in a week. Social support was derived from the sum of the subscales supervisor support and co-employee support of the JCQ. Scores can range from 8 to 32, with a higher score indicating more social support.
Statistical Analyses
Descriptive Analyses
Means, SDs, numbers, and/or percentages were reported for participant characteristics and the potential predicting factors.
Generalized Estimate Equations
Longitudinal logistic regression analyses using Generalized Estimating Equations were performed to analyze the associations between potential predictors and the 5-year uptake of HAs/HAT, taking into account the repeated measurements of the potential predictors and the 5-year uptake of HAs/HAT. Figure 2 illustrates the time points used in the model. The Generalized Estimating Equations models were performed using an exchangeable working correlation structure (all correlations between repeated observations of the outcome variable from each participant were assumed to be equal). By performing univariate analyses, unadjusted and adjusted odds ratios with corresponding 95% confidence intervals (CIs) were calculated for the included predictors. All analyses were performed without adjustment for confounders and/or effect modification in the first step. Effect modification was examined by adding an interaction term to the model. When the interaction term was statistically significant (p < 0.05), the variable was considered an effect modifier and stratified analyses were performed subsequently (Fig. 2). A variable was considered a relevant confounder and included in the model if: (1) the potential confounder had influence (p < 0.1) on the outcome variable and (2) when the regression coefficient of the influencing factor changed ≥10% after adding the potential confounder to the model. All statistical analyses were performed with SPSS, version 26.0.
Fig. 2.
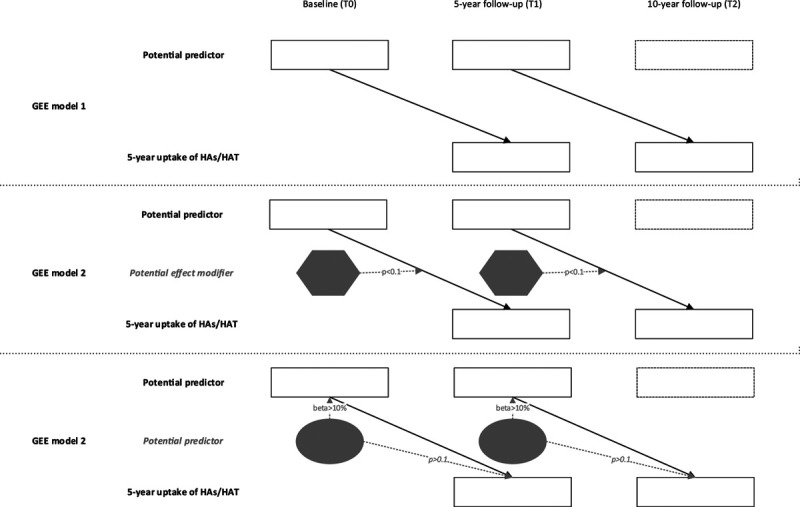
Illustration of the time points used in model that was analyzed using Generalised Estimating Equations (GEE). Note that for participants that were included twice (in T0 to T1 and T1 to T2; n = 23), and who’s baseline variable changed between T0 and T1, we used the T1 value. HAs, hearing aids; HAT, hearing assistive technology.
RESULTS
Descriptive Statistics
Table 1 shows the characteristics of the study sample and potential predictors at measurement rounds T0 and T1. The study sample comprised a majority of females (70%), married people (60%), and people with a high education level (59%).
TABLE 1.
Characteristics of the study samples and distribution of potential predictors
| Characteristic/ potential predictor [scale range]: | Sample at T0 (n = 182) | Sample at T1 (n = 59) |
|---|---|---|
| Age, mean ± SD (range) | 48.9 ± 10 (22.0–63.9) | 49.7 ± 11.1 (24.5–70) |
| Sex, n (%) | ||
| Female | 123 (67.6) | 47 (79.7) |
| Marital status, n (%) | ||
| Married | 121 (66.5) | 37 (62.7) |
| Not married | 61 (33.5) | 22 (37.3) |
| Living arrangement, n (%) | ||
| Living with other people in a household | 139 (76.4) | 45 (76.3) |
| Living alone | 42 (23.1) | 14 (23.7) |
| missing | 1 (0.5) | |
| Educational level, n (%) | ||
| Low | 25 (13.7) | 6 (10.2) |
| Mid | 54 (29.7) | 14 (23.7) |
| High | 102 (56.0) | 39 (66.1) |
| missing | 1 (0.5) | |
| Number of working hours,* mean ± SD (range) | 29.9 ± 11.7 (0–76) | 31.4 ± 9.4 (12–59) |
| Hearing ability (speech-reception-threshold, dB SNR), mean ± SD (range) | −2.8 ± 2.5 (−5.4 to 4.0) | −3.1 ± 2.6 (−5.4 to 4.0) |
| Categories, n (%) | ||
| Insufficient | 114 (62.6) | 41 (69.5) |
| Poor | 68 (37.4) | 18 (30.5) |
| Self-reported hearing disability [0–84], mean ± SD (range) | 24.5 ± 16 (0–74) | 22.1 ± 16.3 (0–65) |
| Distress [0–80], mean ± SD (range) | 8.8 ± 6.9 (0–32) | 7.9 ± 6.6 (0–27) |
| Self-efficacy [12–60], mean ± SD (range) | 42.5 ± 5.0 (29–58) | 43.5 ± 5.3 (26–53) |
| Job control [24–96], mean ± SD (range) | 76.2 ± 11.7 (44–96) | 73.9 ± 9.4 (54–92) |
| Job demand [12–48], mean ± SD (range) | 33.9 ± 4.9 (23–48) | 35.1 ± 5.1 (24–48) |
| Social support [8–32], mean ± SD (range) | 22.9 ± 4.3 (8–32) | 23.1 ± 3.4 (15–32) |
| Need for recovery [0–100], mean ± SD (range) | 42.9 ± 25.9 (0–91) | 40.7 ± 26.8 (0–91) |
The question was “How many hours does your employer expect you to work in a typical 7-day week?” It could be that some of these workers have a 0 hours contract and those with very high numbers of working hours are self-employed.
n, number of participants; SNR, signal-to-noise ratio.
published online ahead of print February 4, 2021.
The incidence of the uptake of HAs/HAT within the 5-year follow-up period was 15 to 23% (Fig. 1). Of all participants with a 5-year HAs/HAT uptake (n = 55), most participants had a 5-year uptake of HAs (n = 52) and fewer participants had a 5-year uptake of HAT (n = 10). At T1, 36 participants had a 5-year uptake of HAs only, seven participants additionally had a 5-year uptake of HAT, and three participants had a 5-year uptake of HAT only. Among those with a 5-year uptake of HAT, some had HAT for phone calls (n = 5), some for television and radio (n = 4), communication with one or more persons, or other (n = 2). At T2, nine participants had a 5-year uptake of HAs, and no participants reported a 5-year uptake of HAT.
Five-Year Uptake of HAs/HAT
Table 2 shows the unadjusted and adjusted ORs for the potential predictors studied. Out of the potential confounders, marital status and self-reported hearing disability had sufficient influence (p < 0.1) on the outcome variable to be tested for confounding effects in the models. However, marital status did not change the regression coefficient ≥10% in any of the models. Self-reported hearing disability was a significant confounder in the model for speech recognition ability in noise and 5-year uptake of HAs/HAT. From the potential predictors reported in previous studies in the general and older populations, marital status and self-reported hearing disability (as measured with the AIADH) showed a statistically significant association with the 5-year uptake of HAs/HAT. Married participants had increased odds of 5-year uptake of HAs/HAT compared with unmarried participants (odds ratio [OR] = 2.13, 95% CI = 1.05 to 4.35). In addition, participants with higher self-reported hearing disability scores (per one unit) had increased odds of 5-year uptake of HAs/HAT (OR = 1.05, 95% CI = 1.03 to 1.07). No significant associations were observed between age, gender, living situation, educational level, distress and self-efficacy,and 5-year uptake of HAs/HAT.
TABLE 2.
Unadjusted and adjusted odds ratios concerning the relation between potential predictors and the 5-year uptake of HAs/HAT later from GEE analyses
| Potential predictor | Odds for the uptake of HAs/HAT* | |||||
|---|---|---|---|---|---|---|
| Unadjusted | Adjusted | |||||
| OR (Exp(β)) | 95% CI (for OR) | p | OR (Exp(β)) | 95% CI (for OR) | p | |
| Age | 1.02 | 0.10–1.05 | 0.118 | |||
| Sex (male) | 0.96 | 0.50–1.84 | 0.899 | |||
| Living situation (with others) | 1.98 | 0.86–4.53 | 0.107 | |||
| Marital status (married) | 2.13 | 1.05–4.35 | 0.037 | |||
| Educational level (low) | ||||||
| Mid | 2.62 | 0.82–8.35 | 0.103 | |||
| High | 1.99 | 0.66–6.05 | 0.225 | |||
| Speech recognition ability in noise | 1.12 | 1.00–1.25 | 0.050 | 1.03† | 0.90–1.18 | 0.624 |
| Self-reported hearing disability | 1.05 | 1.03–1.07 | <0.001 | |||
| Distress | 0.97 | 0.92–1.02 | 0.228 | |||
| Self-efficacy | 0.99 | 0.94–1.05 | 0.790 | |||
| Job control | 1.01 | 0.96–1.05 | 0.840 | |||
| Job demand | 1.03 | 0.98–1.10 | 0.260 | |||
| Job demandmale | 1.18‡ | 1.05–1.34 | 0.007 | |||
| Job demandfemale | 0.97 | 0.90–1.04 | 0.423 | |||
| NFR | 0.99 | 0.99–1.01 | 0.894 | |||
Five-year uptake of HAs/HAT = 1 (yes); 5-year uptake of HA/HAT = 0 (no; reference category).
Adjusted model for self-reported hearing disability.
Interaction with sex significant (job demand × sex, p = 0.002).
HAs, hearing aids; HAT, hearing assistive technology; NFR, need for recovery; OR, odds ratio.
From the potential work-related predictors, only psychosocial job demand in males (as measured with the JCQ) showed a statistically significant association with the 5-year uptake of HAs/HAT. Job demand showed a significant interaction with sex (p = 0.002), and therefore, stratified analyses were performed. Male participants with higher job demand scores (per one unit), had increased odds of 5-year uptake of HAs/HAT (OR = 1.18, 95% CI = 1.05 to 1.35). For females, no association between job demand and the 5-year uptake of HAs/HAT was found (OR = 0.97, 95% CI = 0.90 to 1.04). We did not find significant associations between job control and NFR and 5-year uptake of HAs/HAT.
DISCUSSION
The present study aimed to identify factors that are associated with the uptake of HAs or HAT within the 5-year period following measurement of these factors in employees considered eligible for such hearing solutions. We examined factors that have been shown in the literature to predict the uptake of HAs/HAT in the general population, and we additionally examined work-related factors as this was the particular focus of this study. The results showed that the uptake of HAs/HAT within the next 5 years was low in employees with HI (23%). This rate is similar to the low uptake rate in the general population as reported previously (Southall et al. 2006; Vuorialho et al. 2006; Kochkin 2007; Laplante-Levesque et al. 2013). Factors significantly influencing the 5-year uptake of HAs/HAT were being married and higher self-reported hearing disability. In addition, higher perceived job demand was a significant factor predicting the 5-year uptake of HAs/HAT in males but not in females. The associations found are discussed below.
Factors Reported in Previous Studies in the General and Older Populations
Being married may be an indication of social support, that is, the spouse acting as a supporting factor in help seeking and taking up HAs/HAT (Meyer & Hickson 2012). HI is often first noticed by the significant other rather than the person with HI (Mahoney et al. 1996; Duijvestijn et al. 2003). Subsequently, the significant other could be someone who encourages the person with HI to make an appointment at a hearing clinic and take up HAs/HAT. Alternatively, persons who are married may have an increased awareness of HI through demands on communication and, therefore, may be more likely to take up hearing solutions. A review on marital status, health, and mortality showed that unmarried persons generally report poorer health (Robards et al. 2012). However, previous research on factors influencing the uptake of HAs/HAT has shown mixed results related to this factor. Gussekloo et al. (2003) did not find an association between marital status and the uptake of HAs, but in a recent study by Simpson et al. (2019) HA adopters were more likely to be married. Given the importance of the spouse in the uptake of HAs/HAT, it may be relevant to consider this stakeholder in hearing rehabilitation for employees with HI. The influence and importance of family involvement in the rehabilitation process has been previously demonstrated by (Meyer & Hickson 2012). In addition, Singh and Launer (2016) found that HA adoption is significantly associated with the spouse’s attendance at the audiology appointment. Maybe family involvement is even more important in employees as compared with retirees with HI.
Self-reported hearing disability also emerged as a significant factor predicting the 5-year uptake of HAs/HAT. This factor has repeatedly been shown to significantly predict help seeking for HI, HA uptake, and HA use (e.g., Knudsen et al. 2010; Meyer & Hickson 2012; Meyer et al. 2014; Simpson et al. 2019). Most of the previous studies included older adults and the current data showed that this predictor extends to the working population. It must be noted that self-reported hearing disability additionally acted as a confounder in the association between hearing ability in noise (SRTn) and the 5-year uptake of HAs/HAT, emphasizing the significance of this factor relative to hearing status itself for predicting the uptake. These findings highlight the importance of self-perceived disability as a factor to be taken into account in hearing rehabilitation for employees with hearing difficulties. In line with suggestions in other studies, the present results indicated that self-report may be a better choice than measuring hearing ability when screening whether an employee would be likely to take up HAs/HAT (Stephens et al. 1990a; Knudsen et al. 2010). Sex, age, and education showed no direct associations with the uptake of HAs/HAT in employees. However, age and education have shown to be significantly associated with the uptake of HAs in other (longitudinal) studies (overview in Knudsen et al. 2010; Fischer et al. 2011). The samples in these studies were characterized by greater variability in age and educational level than in the present study. The relatively limited age range in the current study (working adults only) and relatively low number of respondents with low educational level (Table 1) may have prevented us from finding significant associations. Alternatively, it could be that age is not an important factor in employees, and that other factors that were identified in this study are more important.
Distress and self-efficacy were not contributing significantly in the model predicting 5-year uptake of HAs/HAT. One explanation for not finding these associations may be the low variability in responses for these factors. The observed mean values and corresponding ranges of participant scores indicated few problems in these domains; more than 90% of the participants fell within the range for moderate to low distress (score < 20) and all participants had high general self-efficacy scores (lowest score was 26 with a median of 44 on a scale ranging from 12 to 60 with higher scores indicating higher self-efficacy). The literature suggests that experiencing high emotional distress is associated with wanting help with hearing (Stephens et al. 1990b) and experiencing lower emotional distress is associated with not wanting HAs (Brooks & Hallam 1998). Also, previous studies have reported significant associations between self-efficacy and the uptake of HAs or help seeking (Saunders et al. 2016; Pronk et al. 2017). These studies included measures specifically asking about distress in hearing situations and self-efficacy regarding HA handling. In the present study, we used general measures of distress and self-efficacy. It may be interesting to investigate the effect of results on such hearing-specific measures on the uptake of HAs/HAT in employees in future research.
Work-Related Factors
The positive association between perceived job demand and the 5-year uptake of HAs/HAT is a novel finding. Job demand includes aspects like workload, time pressure, and conflicting demands. Previous research has shown significant correlations between job demand and the frequency of hearing activities occurring at work and also with the effort needed to hearing well (Kramer et al. 2006). Similarly, it is imaginable that with experiencing a high job demand, employees may be more triggered to look for assistive technology solutions, including HAs or HAT, to decrease this demand. We only observed an association between job demand and 5-year HAs/HAT uptake in males. In this study, more males than females had a full-time job (mean number of working hours of 37.5 ± 10.9 in males versus mean number of working hours of 28.1 ± 10.0 in females) and so this may be an explanation. However, the number of working hours per week was not a confounder or effect modifier in the association between higher perceived demand and the uptake of HAs/HAT. Another reason for the difference between females and males may be the type of job they had, but examination of this factor fell outside the scope of this study and needs further investigation. Our finding highlights the relevance of considering job demand in hearing rehabilitation for (male) employees with HI.
Job control and NFR were not associated with uptake of HAs/HAT. Job control reflects the extent to which one has control over their job tasks. The scores on the JCQ subscale were fairly high on average (i.e., mean summed scores 76.2 to 73.9 on a scale ranging from 24 to 96), indicating high perceived job control in general. In previous work, it was found that employees with high control are more likely to be full-time employed and to be higher educated (Kramer et al. 2006). In accordance, in our sample, most employees had obtained high education (56 to 66%, Table 1). In future research, it would be interesting to study the association between low job control and the uptake of hearing solutions in people with HI. With regard to NFR, a considerable part of our sample had NFR scores falling into the high risk category (i.e., NFR ≥ 50; 33%). Previous research has shown a significant association between HI and higher NFR after work (Nachtegaal et al. 2009). We did not find an association between NFR and 5-year HAs/HAT uptake. It is likely that employees with HI are unaware of the relationship between hearing difficulties and high NFR, and hence, do not see it as a trigger to seek hearing help. The influence of HAs/HAT in mitigating NFR has not been researched or established before. More research into this topic and examining whether NFR might be mitigated by the uptake of HAs/HAT is needed.
Five-Year Uptake of HAT
Most of the employees in these studies had reported a combined uptake of HAs and HAT. This is not surprising, as most hearing assistance devices operate in combination with a HA. In addition, employees taking up HAs may be more aware of their HI and the existence of additional assistance devices to help improve their hearing in specific listening situations. Overall, the 5-year uptake of HAT was low. A recent qualitative study found that a negative attitude towards ones’ own HI evoked uneasiness when the impairment became visible at work (Svinndal et al. 2020). They found that particularly HAT evoked such uneasiness (Svinndal et al. 2020). Unfortunately, we could not investigate whether this was also an influencing factor in our study, as we did not have data available on the employee’s attitude towards HI.
Implications
HI is a growing “problem” in the workplace in modern Western economies, including the Netherlands (Kramer & Goverts 2020). Data from Statistics Netherlands (CBS) show that in the period from 2003 to 2016, the number of adults of 50 years and older with paid work has almost doubled to 1,588,000 out of a working population of approximately 12 million (Verkooijen 2017). Given the low uptake of HAs/HAT found in the present study and the fact that a workplace factor (i.e., job demand) appeared to be associated with the 5-year uptake of HAs/HAT in males emphasizes that this specific group of adults with HI deserve special attention. It should be further researched why employees do not take up HAs/HAT, for example, are they not tested in health screening tests at work? Do they not find their way/have access to hearing solutions and/or rehabilitation programs? Qualitative approaches may be required for answering such research questions. Vocational rehabilitation programs for employees with HI have been developed and were identified in a systematic review (Gussenhoven et al. 2013). Moreover, it was shown that a vocational enablement protocol for Dutch employees is effective in improving communication strategies and self-acceptance of employees with HI (Gussenhoven et al. 2017). However, the authors also concluded that despite availability of services, it is likely that the majority of employees with (beginning) HI are not optimally using these services (Gussenhoven et al. 2015). Previously reported data from the American National Health Interview Survey Disability Supplement indicated that employees with severe HI were approximately half as likely to report receiving accommodations compared with employees with other disabilities (Zwerling et al. 2003). In addition, two studies on stigma surrounding HI suggested that there is a reluctance to disclose an HI in the workplace (Wallhagen 2010; Ruusuvuori et al. 2019). Without this disclosure, accommodations will not be considered. Lack of knowledge of how to deal with HI at the workplace is another important experience (Jennings & Shaw 2008). It is thus apparent that there is a need for increased knowledge/awareness of HI and available hearing solutions and interventions in the workplace. Knowledge on factors that do and do not influence the uptake of HAs/HAT in employees may give healthcare professionals tools to identify people who do or do not pick up hearing solutions by themselves or need additional information.
Limitations and Considerations
This study has some limitations and considerations that deserve attention. After application of inclusion and exclusion criteria, a relatively small study sample remained. This had consequences for the availability of potential predictors in the NL-SH data, for example, for some variables not enough data were available. There are other potential predictors that were not included in the current analyses, but may be considered for future studies. An example is the perceived benefits of HAs (such as measured with the Measure of Audiologic Rehabilition Self-efficacy for HAs; West & Smith 2007). We could not include it in the model because it was not measured at baseline (T0). This was also the case for coping behavior/attitude (such as measured with the Communication Profile Hearing Impairment; Mokkink et al. 2010). The evidence of these variables as being predictive of the uptake of HAs/HAT is limited (e.g., Knudsen et al. 2010), but may be researched in future studies in employees with HI. Also, in future research, it may be worthwhile to include other variables like the communication demand (e.g., frequency of hearing activities) in the workplace and effort needed to listen in the workplace (Kramer et al. 2006).
Different forms of sample bias may have occurred: the NL-SH population is a convenience sample and this population may be more engaged with or more aware of their hearing as compared to the general population. We selected participants that already had a hearing ability ≥ −5.5 dB SNR and no HAs/HAT. It might be that a group who is more aware of the benefit of HAs/HAT already have HAs/HAT at baseline and therefore were not included in the analyses. In other words, the selected sample for this study might be less inclined to take up HAs or HAT, causing an underestimation of the uptake of HAs/HAT within employees in general. However, eligible employees not taking up hearing solutions are the employees who would typically comprise the target group for hearing health care providers. It is therefore an important group to gain insight in. Furthermore, most participants had attained a high level of education, which is also not representative for all employees in The Netherlands. However, despite high levels of education, the 5-year uptake of HAs/HAT was low.
Another consideration is that looking at multiple predictors independently within our relatively small sample size can result in spurious findings. Furthermore, we did not create multivariable models, because we were interested in the predicting factors of the 5-year uptake of HAs/HAT rather than which factors together best predict the 5-year uptake of HAs/HAT. We did check in the model for self-reported hearing disability and 5-year uptake of HAs/HAT whether marital status contributed significantly. Marital status was not significant (p < 0.05). Therefore, a multivariable model would not have included more variables besides self-reported hearing disability.
CONCLUSION
Being married, reporting higher self-reported hearing disability, and higher perceived job demand in males were found to be associated with the uptake of HAs/HAT reported 5 years later. The identification of a work-related factor as a predictor in addition to the predictors established in the general/older populations demonstrates the importance of considering work-related factors in aural rehabilitation. There is a growing need for awareness of HI and support hereof in the work place in modern Western economies, especially given the workforce will increasingly include adults of older ages.
ACKNOWLEDGMENTS
The authors thank the participants on the Netherlands Longitudinal Study on Hearing (NL-SH).
Footnotes
The first measurement round of the NL-SH (2006–2010) was financially supported by the Heinsius-Houbolt Foundation, The Netherlands. Sonova AG, Switzerland supported the data collection of the second measurement round (since 2011). Funding for data collection of the third measurement round (since 2016) came from the EMGO+ Institute for Health and Care Research, The Netherlands, and Sonova AG, Switzerland.
The current study was financed by Sonova B.V. and the Ministry of Economic Affairs by means of the PPP Allowance made available by the Top Sector Life Sciences & Health to stimulate public-private partnerships (http://www.health-holland.com/).
The work presented in this article was completed in collaboration between all authors. L.M.v.L., T.P.M.G., M.F.v.W., U.L., and S.E.K. contributed to the conception and design of the work. L.M.v.L. analyzed the data and B.I.L.-W. verified the statistical methods. All authors participated in the interpretation of the data. L.M.v.L. had the leading role in the writing process. All authors revised the manuscript critically for important intellectual content and approved the current version to be submitted to Ear and Hearing.
The authors have no conflicts of interest to disclose.
REFERENCES
- Bainbridge K. E., Ramachandran V. Hearing aid ue among older U.S. adults; The national ehalth an nutrition examination survey, 2005-2006 and 2009-2010. Eer Hear, (2014). 35, 289–294. [DOI] [PMC free article] [PubMed] [Google Scholar]
- Beurskens A. J., Bültmann U., Kant I., Vercoulen J. H., Bleijenberg G., Swaen G. M. Fatigue among working people: Validity of a questionnaire measure. Occup Environ Med, (2000). 57, 353–357. [DOI] [PMC free article] [PubMed] [Google Scholar]
- Boeschen Hospers J. M., Smits N., Smits C., Stam M., Terwee C. B., Kramer S. E. Reevaluation of the Amsterdam Inventory for Auditory Disability and Handicap using item response theory. J Speech Lang Hear Res, (2016). 59, 373–383. [DOI] [PubMed] [Google Scholar]
- Bosscher R. J., Smit J. H. Confirmatory factor analysis of the General Self-Efficacy Scale. Behav Res Ther, (1998). 36, 339–343. [DOI] [PubMed] [Google Scholar]
- Brooks D. N., Hallam R. S. Attitudes to hearing difficulty and hearing aids and the outcome of audiological rehabilitation. Br J Audiol, (1998). 32, 217–226. [DOI] [PubMed] [Google Scholar]
- Danermark B., Gellerstedt L. C. Psychosocial work environment, hearing impairment and health. Int J Audiol, (2004). 43, 383–389. [DOI] [PubMed] [Google Scholar]
- Dawes P., Fortnum H., Moore D. R., Emsley R., Norman P., Cruickshanks K., Davis A., Edmondson-Jones M., McCormack A., Lutman M., Munro K. Hearing in middle age: A population snapshot of 40- to 69-year olds in the United Kingdom. Ear Hear, (2014). 35, e44–e51. [DOI] [PMC free article] [PubMed] [Google Scholar]
- de Croon E. M., Sluiter J. K., Frings-Dresen M. H. Psychometric properties of the Need for Recovery after work scale: Test-retest reliability and sensitivity to detect change. Occup Environ Med, (2006). 63, 202–206. [DOI] [PMC free article] [PubMed] [Google Scholar]
- Duijvestijn J. A., Anteunis L. J., Hoek C. J., Van Den Brink R. H., Chenault M. N., Manni J. J. Help-seeking behaviour of hearing-impaired persons aged > or = 55 years; effect of complaints, significant others and hearing aid image. Acta Otolaryngol, (2003). 123, 846–850. [DOI] [PubMed] [Google Scholar]
- Fischer M. E., Cruickshanks K. J., Pinto A., Klein B. E., Klein R., Dalton D. S. Hearing impairment and retirement. J Am Acad Audiol, (2014). 25, 164–170. [DOI] [PMC free article] [PubMed] [Google Scholar]
- Fischer M. E., Cruickshanks K. J., Wiley T. L., Klein B. E., Klein R., Tweed T. S. Determinants of hearing aid acquisition in older adults. Am J Public Health, (2011). 101, 1449–1455. [DOI] [PMC free article] [PubMed] [Google Scholar]
- Garstecki D. C., Erler S. F. Hearing loss, control, and demographic factors influencing hearing aid use among older adults. J Speech Lang Hear Res, (1998). 41, 527–537. [DOI] [PubMed] [Google Scholar]
- Goderie T. P. M., Stam M., Lissenberg-Witte B. I., Merkus P., Lemke U., Smits C., Kramer S. E. 10-Year follow-up results of the netherlands longitudinal study on hearing: trends of longitudinal change in speech recognition in Noise. Ear Hear, (2020). 41, 491–499. [DOI] [PubMed] [Google Scholar]
- Gopinath B., Schneider J., Hartley D., Teber E., McMahon C. M., Leeder S. R., Mitchell P. Incidence and predictors of hearing aid use and ownership among older adults with hearing loss. Ann Epidemiol, (2011). 21, 497–506. [DOI] [PubMed] [Google Scholar]
- Gussekloo J., de Bont L. E., von Faber M., Eekhof J. A., de Laat J. A., Hulshof J. H., van Dongen E., Westendorp R. G. Auditory rehabilitation of older people from the general population–the Leiden 85-plus study. Br J Gen Pract, (2003). 53, 536–540. [PMC free article] [PubMed] [Google Scholar]
- Gussenhoven A. H. M., Anema J. R., Witte B. I., Goverts S. T., Kramer S. E. The effectiveness of a vocational enablement protocol for employees with hearing difficulties: Results of a randomized controlled trial. Trends Hear, (2017). 21, 2331216517692304. [DOI] [PMC free article] [PubMed] [Google Scholar]
- Gussenhoven A. H. M., Jansma E. P., Goverts S. T., Festen J. M., Anema J. R., Kramer S. E. Vocational rehabilitation services for people with hearing difficulties: A systematic review of the literature. Work, (2013). 46, 151–164. [DOI] [PubMed] [Google Scholar]
- Gussenhoven A. H. M., Singh A. S., Goverts S. T., van Til M., Anema J. R., Kramer S. E. A process evaluation of implementing a vocational enablement protocol for employees with hearing difficulties in clinical practice. Int J Audiol, (2015). 54, 507–517. [DOI] [PubMed] [Google Scholar]
- Houtman I., Kornitzer M., de Smet P., Koyuncu R., DeBacker G., Pelfrene E., Romon M., Boulenguez C., Ferrario M., Origgi G., Sans S., Perez I., Wilhelmsen L., Rosengren A., Olofisacsson S., Östergren P. Job stress, absenteeism, and coronary heart disease: European cooperative study (the JACE study). Euro J Public Health, (1999). 9, 52–57. [Google Scholar]
- Jennings M. B., Shaw L. Impact of hearing loss in the workplace: Raising questions about partnerships with professionals. Work, (2008). 30, 289–295. [PubMed] [Google Scholar]
- Karasek R., Brisson C., Kawakami N., Houtman I., Bongers P., Amick B. The Job Content Questionnaire (JCQ): An instrument for internationally comparative assessments of psychosocial job characteristics. J Occup Health Psychol, (1998). 3, 322–355. [DOI] [PubMed] [Google Scholar]
- Knudsen L. V., Oberg M., Nielsen C., Naylor G., Kramer S. E. Factors influencing help seeking, hearing aid uptake, hearing aid use and satisfaction with hearing aids: a review of the literature. Trends Amplif, (2010). 14, 127–154. [DOI] [PMC free article] [PubMed] [Google Scholar]
- Kochkin S. The impact of untreated hearing loss on household income. Better Hear Inst 2005). 1–10https://hearingpro.com.au/wp-content/uploads/2016/08/Research-Impact-of-hearing-loss-on-income-1.pdf. [Google Scholar]
- Kochkin S. MarkeTrak VII: Obstacles to adult non-user adoption of hearing aids. Hear J, (2007). 60, 24–51https://journals.lww.com/thehearingjournal/Fulltext/2007/04000/MarkeTrak_VII__Obstacles_to_adult_non_user.7.aspx. [Google Scholar]
- Kochkin S. MarkeTrak VIII: The efficacy of hearing aids in achieving compensation equity in the workplace. Hear J, (2010). 63, 19–24http://old.betterhearing.org/sites/default/files/hearingpedia-resources/MarkeTrak%20VIII%20The%20Efficacy%20of%20Hearing%20Aids%20in%20Achieving%20Compensation%20Equity%20in%20the%20Workplace.pdf. [Google Scholar]
- Kramer S. E. Hearing impairment, work, and vocational enablement. Int J Audiol, (2008). 47(Suppl 2S124–130. [DOI] [PubMed] [Google Scholar]
- Kramer S. E., Goverts S. T. (Joseph J. B. S., Montano J. (ed.), Vociational issues for persons with hearing loss. In Adult Audiologic Rehabilitation 2020). d edn)Plural Publishing.531–550). [Google Scholar]
- Kramer S. E., Kapteyn T. S., Festen J. M., Tobi H. Factors in subjective hearing disability. Audiology, (1995). 34, 311–320. [DOI] [PubMed] [Google Scholar]
- Kramer S. E., Kapteyn T. S., Houtgast T. Occupational performance: comparing normally-hearing and hearing-impaired employees using the Amsterdam Checklist for Hearing and Work. Int J Audiol, (2006). 45, 503–512. [DOI] [PubMed] [Google Scholar]
- Kricos P. B. Processing capabilities audiologic management of older adults with hearing loss and compromised cognitive/psychoacoustic auditory. Trends Amplif, (2006). 10, 1–28. [DOI] [PMC free article] [PubMed] [Google Scholar]
- Laplante-Lévesque A., Jensen L. D., Dawes P., Nielsen C. Optimal hearing aid use: Focus groups with hearing aid clients and audiologists. Ear Hear, (2013). 34, 193–202. [DOI] [PubMed] [Google Scholar]
- Mahoney C. F., Stephens S. D., Cadge B. A. Who prompts patients to consult about hearing loss? Br J Audiol, (1996). 30, 153–158. [DOI] [PubMed] [Google Scholar]
- Meyer C., Hickson L. What factors influence help-seeking for hearing impairment and hearing aid adoption in older adults? Int J Audiol, (2012). 51, 66–74. [DOI] [PubMed] [Google Scholar]
- Meyer C., Hickson L., Lovelock K., Lampert M., Khan A. An investigation of factors that influence help-seeking for hearing impairment in older adults. Int J Audiol, (2014). 53(Suppl 1), S3–17. [DOI] [PubMed] [Google Scholar]
- Mokkink L. B., Knol D. L., van Nispen R. M., Kramer S. E. Improving the quality and applicability of the Dutch scales of the Communication Profile for the Hearing Impaired using item response theory. J Speech Lang Hear Res, (2010). 53, 556–571. [DOI] [PubMed] [Google Scholar]
- Nachtegaal J., Festen J. M., Kramer S. E. Hearing ability and its relationship with psychosocial health, work-related variables, and health care use: The National Longitudinal Study on Hearing. Audiol Res, (2011). 1, e9. [DOI] [PMC free article] [PubMed] [Google Scholar]
- Nachtegaal J., Festen J. M., Kramer S. E. Hearing ability in working life and its relationship with sick leave and self-reported work productivity. Ear Hear, (2012). 33, 94–103. [DOI] [PubMed] [Google Scholar]
- Nachtegaal J., Kuik D. J., Anema J. R., Goverts S. T., Festen J. M., Kramer S. E. Hearing status, need for recovery after work, and psychosocial work characteristics: Results from an internet-based national survey on hearing. Int J Audiol, (2009). 48, 684–691. [DOI] [PubMed] [Google Scholar]
- S. C. Flaubert JL, Jette AM. (Ed.), National Academies of Sciences, Engineering, and Medicine; Health and Medicine Division; Board on Health Care Services; Committee on the Use of Selected Assistive Products and Technologies in Eliminating or Reducing the Effects of Impairments. 5, Selected hearing technologies. In The Promise of Assistive Technology to Enhance Activity and Work Participation. (2017). https://www.ncbi.nlm.nih.gov/books/NBK453282/. [PubMed] [Google Scholar]
- World Health Organization (WHO) (Global Costs of Unaddressed Hearing Loss and Cost-Effectiveness of Interventions: A WHO Report, 2017. (2017). World Health Organization. [Google Scholar]
- Pronk M., Deeg D. J. H., Versfeld N. J., Heymans M. W., Naylor G., Kramer S. E. Predictors of entering a hearing aid evaluation period: A prospective study in older hearing-help seekers. Trends Hear, (2017). 21, 2331216517744915. [DOI] [PMC free article] [PubMed] [Google Scholar]
- Robards J., Evandrou M., Falkingham J., Vlachantoni A. Marital status, health and mortality. Maturitas, (2012). 73, 295–299. [DOI] [PMC free article] [PubMed] [Google Scholar]
- Ruusuvuori J. E., Aaltonen T., Koskela I., Ranta J., Lonka E., Salmenlinna I., Laakso M. Studies on stigma regarding hearing impairment and hearing aid use among adults of working age: a scoping review [published online ahead of print]. Disabil Rehabil 2019). 1–11. doi:10.1080/09638288.2019.1622798. [DOI] [PubMed] [Google Scholar]
- Saunders G. H., Chisolm T. H., Wallhagen M. I. Older adults and hearing help-seeking behaviors. Am J Audiol, (2012). 21, 331–337. [DOI] [PubMed] [Google Scholar]
- Saunders G. H., Frederick M. T., Silverman S. C., Nielsen C., Laplante-Levesque A. Health behavior theories as predictors of hearing-aid uptake and outcomes. Int J Audiol, (2016). 55 (Suppl 3), S59–68. [DOI] [PubMed] [Google Scholar]
- Schaufeli W. B., Van Dierendonck D. (Burnout, een begrip gemeten. De Nederlandse versie van de Maslach Burnout Inventory (MBI-NL) [Burnout, measuring the concept. The Dutch version of the Maslach Burnout Inventory (MBI-NL)]. Tijdschrift voor Gedrag en Gezondheid, (1994). 22153–172. [Google Scholar]
- Sherer M., Maddux J. E., Mercandante B., Prentice-Dunn S., Jacobs B., Rogers R. W. The self-efficacy scale: Construction and validation. Psychological Rep, (1982). 51, 663–671. [Google Scholar]
- Simpson A. N., Matthews L. J., Cassarly C., Dubno J. R. Time from hearing aid candidacy to hearing aid adoption: A longitudinal cohort study. Ear Hear, (2019). 40, 468–476. [DOI] [PMC free article] [PubMed] [Google Scholar]
- Singh G., Launer S. Social context and hearing aid adoption. Trends Hear, (2016). 20, 2331216516673833. 10.1177/2331216516673833 [DOI] [PMC free article] [PubMed] [Google Scholar]
- Smits C., Kapteyn T. S., Houtgast T. Development and validation of an automatic speech-in-noise screening test by telephone. Int J Audiol, (2004). 43, 15–28. [DOI] [PubMed] [Google Scholar]
- Smits C., Merkus P., Houtgast T. How we do it: The Dutch functional hearing-screening tests by telephone and internet. Clin Otolaryngol, (2006). 31, 436–440. [DOI] [PubMed] [Google Scholar]
- Southall K., Gagné J. P., Leroux T. Factors that influence the use of assistance technologies by older adults who have a hearing loss. Int J Audiol, (2006). 45, 252–259. [DOI] [PubMed] [Google Scholar]
- Stam M., Kostense P. J., Festen J. M., Kramer S. E. The relationship between hearing status and the participation in different categories of work: demographics. Work, (2013). 46, 207–219. [DOI] [PubMed] [Google Scholar]
- Stam M., Smits C., Twisk J. W., Lemke U., Festen J. M., Kramer S. E. Deterioration of speech recognition ability over a period of 5 years in adults ages 18 to 70 years: results of the Dutch online speech-in-noise test. Ear Hear, (2015). 36, e129–e137. [DOI] [PubMed] [Google Scholar]
- Stephens S. D., Callaghan D. E., Hogan S., Meredith R., Rayment A., Davis A. C. Hearing disability in people aged 50-65: Effectiveness and acceptability of rehabilitative intervention. BMJ, (1990a). 300, 508–511. [DOI] [PMC free article] [PubMed] [Google Scholar]
- Stephens S. D., Meredith R., Callaghan D. E., Hogan S., Rayment A. Early intervention and rehabilitation: Factors influencing outcome. Acta Otolaryngol Suppl, (1990b). 476, 221–225. [DOI] [PubMed] [Google Scholar]
- Svinndal E. V., Jensen C., Rise M. B. Working life trajectories with hearing impairment. Disabil Rehabil, (2020). 42, 190–200. [DOI] [PubMed] [Google Scholar]
- Terluin B., Smits N., Brouwers E. P. M., de Vet H. C. W. The Four-Dimensional Symptom Questionnaire (4DSQ) in the general population: Scale structure, reliability, measurement invariance and normative data: A cross-sectional survey. Health Qual Life Outcomes, (2016). 14, 130. [DOI] [PMC free article] [PubMed] [Google Scholar]
- Terluin B., van Marwijk H. W., Adèr H. J., de Vet H. C., Penninx B. W., Hermens M. L., van Boeijen C. A., van Balkom A. J., van der Klink J. J., Stalman W. A. The Four-Dimensional Symptom Questionnaire (4DSQ): A validation study of a multidimensional self-report questionnaire to assess distress, depression, anxiety and somatization. BMC Psychiatry, (2006). 6, 34. [DOI] [PMC free article] [PubMed] [Google Scholar]
- Van Veldhoven M., Meijman T. (Questionnaire on the Experience and Assessment of Work: VBBA—English Version. (1994). The Foundation for Quality in Occupational Health Care. [Google Scholar]
- Van Veldhoven M. (Psychosocial arbeidsbelasting en werkstress [Psychosocial Job Demands and Work Stress] [Thesis]. (1996). Swets & Zeitlinger, University of Groningen, Lisse: 1–229. [Google Scholar]
- Verkooijen L. (Arbeidsparticipatie ouderen flink gestegen. (2017). CBS. [Google Scholar]
- Vuorialho A., Karinen P., Sorri M. Effect of hearing aids on hearing disability and quality of life in the elderly. Int J Audiol, (2006). 45, 400–405. [DOI] [PubMed] [Google Scholar]
- Wallhagen M. I. The stigma of hearing loss. Gerontologist, (2010). 50, 66–75. [DOI] [PMC free article] [PubMed] [Google Scholar]
- Weinstein B. (Geriatric Audiology. (2000). Thieme. [Google Scholar]
- West R. L., Smith S. L. Development of a hearing aid self-efficacy questionnaire. Int J Audiol, (2007). 46, 759–771. [DOI] [PubMed] [Google Scholar]
- Zwerling C., Whitten P. S., Sprince N. L., Davis C. S., Wallace R. B., Blanck P., Heeringa S. G. Workplace accommodations for people with disabilities: National Health Interview Survey Disability Supplement, 1994-1995. J Occup Environ Med, (2003). 45, 517–525. [DOI] [PubMed] [Google Scholar]